
94% of researchers rate our articles as excellent or good
Learn more about the work of our research integrity team to safeguard the quality of each article we publish.
Find out more
ORIGINAL RESEARCH article
Front. Plant Sci. , 02 July 2021
Sec. Plant Physiology
Volume 12 - 2021 | https://doi.org/10.3389/fpls.2021.700159
 Bo Gao1,2,3
 Shaowu Hu1,2Liquan Jing1,2
 Xichao Niu4Yunxia Wang4Jianguo Zhu5Yulong Wang1,2
 Lianxin Yang1,2*
To understand the effects of source-sink relationships on rice yield response to elevated CO2 levels (eCO2), we conducted a field study using a popular japonica cultivar grown in a free-air CO2 enrichment environment in 2017–2018. The source-sink ratio of rice was set artificially via source-sink treatments (SSTs) at the heading stage. Five SSTs were performed in 2017 (EXP1): cutting off the flag leaf (LC1) and the top three functional leaves (LC3), removing one branch in every three branches of a panicle (SR1/3) and one branch in every two branches of a panicle (SR1/2), and the control (CK) without any leaf cutting or spikelet removal. The eCO2 significantly increased grain yield by 15.7% on average over all treatments; it significantly increased grain yield of CK, LC1, LC3, SR1/3, and SR1/2 crops by 13.9, 18.1, 25.3, 12.0, and 10.9%, respectively. The yield response to eCO2 was associated with a significant increase of panicle number and fully-filled grain percentage (FGP), and the response of crops under different SSTs was significantly positively correlated with FGP and the average grain weight of the seeds. Two SSTs (CK and LC3) were performed in 2018 (EXP2), which confirmed that the yield response of LC3 crops (25.1%) to eCO2 was significantly higher than that of CK (15.9%). Among the different grain positions, yield response to eCO2 of grains attached to the lower secondary rachis was greater than that of grains attached to the upper primary rachis. Reducing the source-sink ratio via leaf-cutting enhanced the net photosynthetic rate response of the remaining leaves to eCO2 and increased the grain filling ability. Conversely, spikelet removal increased the non-structural carbohydrate (NSC) content of the stem, causing feedback inhibition and photosynthetic down-regulation. This study suggests that reducing the source-sink ratio by adopting appropriate management measures can increase the response of rice to eCO2.
Anthropogenic activities including fossil fuel burning and deforestation, have increased the level of atmospheric carbon dioxide (CO2) from about 280 ppm (Intergovernmental Panel on Climate Change [IPCC], 2007) during the Industrial Revolution to a current 410 ppm (National Oceanic and Atmospheric Administration [NOAA], 2020), which is projected to exceed 580 ppm (Intergovernmental Panel on Climate Change [IPCC], 2013) by 2050. As the substrate of photosynthesis, the increasing CO2 level has a “fertilizer effect” on plant growth (Ainsworth and Long, 2005). Rice is the staple food for more than half of the global population (Fan et al., 2016). Fertilization and genetic modification have led an increase in rice yields; however, due to negative factors such as increasing ozone concentrations, global warming, and drought stress, the growth rate of global rice yield has been slowing down since the beginning of this century (Ainsworth, 2008; Long, 2012). According to the Food and Agriculture Organization, an additional 30% of rice production is required to meet the demands of a global population of more than 9 billion by 2050 (Food and Agriculture Organization [FAO], 2009; Alexandratos and Bruinsma, 2012). Therefore, it is important to use the ‘fertilizer effect’ of elevated CO2 (eCO2) to maximize the potential of rice yield for ensuring food security.
Long et al. (2006), using a theoretical model, pointed out that an increasing CO2 concentration to 550 ppm at 25°C could increase the leaf net photosynthetic rate (Pn) of C3 crops by about 38%. However, free-air CO2 enrichment (FACE) experiments have indicated that the Pn was only increased by 20%, with even lower increases in biomass (17%) and final yield (13%). This indicates that the source-sink relationship of the crop population under eCO2 is far from the theoretical model, with a limited response of rice yield under eCO2. In this case, C3 crops may not be able to efficiently use eCO2 in the future (Sonnewald and Fernie, 2018). A recent meta-analysis (Hu et al., 2021) of FACE studies suggests that there are significant genotypic differences in yield increase under eCO2. The yield enhancement by eCO2 of hybrid rice (24.7%) is significantly greater than that of conventional rice (14.2%). This is mainly because of the large sink capacity (more spikelets per panicle and unit area) and adaptive plasticity of hybrid rice (Dingkuhn et al., 2020), indicating that the sink capacity of rice plays an important role in the response to increasing CO2 levels. By integrating the FACE studies involving seven rice varieties, Ainsworth and Long (2021) found a significant positive correlation between yield increase and yield potential [the product of spikelet number per unit area (SNA) and single grain weight] when the CO2 concentration was increased by 200 ppm. Similarly, by conducting a pot experiment with five naturally contrasting cultivars in the source-sink ratio and grown in a greenhouse under controlled conditions, Fabre et al. (2020) found that the response of Pn of cultivars with a low source-sink ratio to eCO2 was greater than that with a high source-sink ratio. Yield, biomass, and seed setting traits showed a similar trend, but these parameters were not statistically significant. These results indicate that under eCO2, the yield increase potential of rice does not reach the theoretical expectation and is closely related to the source-sink relationship. However, there are few reports on the response of rice yield to eCO2 by adjusting the ratio of source or sink, especially under field conditions.
Cutting off leaves or removing spikelets are commonly used methods to study the source-sink relationship of crops. The original source-sink relationship of rice could be artificially changed by reducing the source and/or sink at the heading stage and then compared with the control plants in these methods. A few studies have used this method to investigate the interaction between the source-sink relationship and eCO2. For instance, by conducting a chamber study using the japonica cultivar Kirara397, Shimono et al. (2010) found that eCO2 significantly reduced Pn of CK and spikelet-removal (SR) crops by 23 and 37% at the mid-grain filling stage, respectively, when compared with ambient conditions. The SR reduced Pn under eCO2, compared with CK, but it showed an opposite trend under ambient conditions. Conversely, Fabre et al. (2019) observed that SR significantly reduced the Pn of the indica cultivar IR64 at 2 weeks after heading compared with the CK under ambient conditions. This phenomenon was more obvious under eCO2, suggesting that SR had a certain inhibitory effect on Pn compared with CK. Recently, a FACE experiment (Zhang et al., 2019) showed that reducing the source-sink ratio of the japonica cultivars Wuyunjing 23 and Nanjing 9108 by cutting off the second and third leaves did not negate the photosynthetic downregulation of the flag leaf under eCO2. However, effects of the interaction between leaf-cutting (LC) and eCO2 on yield traits were not observed in these studies. To date, there is no systematic report about the impact of LC or SR on rice yield response to eCO2 under open-paddy conditions.
The filling capacity and weight traits of the grain are closely related to the location of the rice panicle (Wang et al., 1995; Yang et al., 2000). Generally, the spikelets located on the primary apical branches of the rice panicle develop and blossom early and are known as superior spikelets (SS). The spikelets located on the proximal secondary branches develop and blossom late and are known as inferior spikelets (IS). Previous studies have shown that the sensitivity to environmental changes differs between SS and IS, with IS being affected more significantly by changes in environmental conditions, such as drought (Dong et al., 2014) and ozone stress (Shao et al., 2020). Zhang et al. (2013, 2015) found that, in a FACE trial, eCO2 increased IS grain weight but had no significant effect on SS. However, the impacts of the interactions between CO2 and LC or SR on yield and its components of different grain positions remain unknown.
Because of the disturbance to the microclimate around the plants and the limited space (McLeod and Long, 1999), the chamber is not suitable to study the interactions between source-sink and CO2 at the population level. The FACE system, developed at the end of the 20th century, adopts standard crop management techniques to study rice performance at the field population level with free airflow, providing an opportunity to explore the rice source-sink relationship (Long et al., 2006; Yoshinaga et al., 2020). To investigate the effects and possible reasons of artificial source-sink treatments (SSTs) on the response of rice yield to eCO2, we grew the super japonica cultivar Wuyunjing 27, which is widely used in production, under an eCO2 environment in a FACE facility in 2017–2018. We constructed rice plants with gradient differences in source-sink levels by cutting off leaves or removing spikelets at the heading stage for comparison with naturally growing rice. The objectives of this study were to (1) identify the effects of eCO2 on yield and its components, biomass accumulation and distribution, non-structural carbohydrate (NSC) contents of the stem, and Pn of leaves located in different positions under different source-sink levels, (2) investigate the differences between SS and IS on yield traits under eCO2 and SSTs, and (3) investigate the mechanisms of adjustments by LC and SR in rice yield response to eCO2 from the perspectives of growth and photosynthesis.
The FACE system was established in Yangzhou (119°42′0′′E, 32°35′5′′N), Jiangsu Province, China. Detailed descriptions of the FACE platform are available elsewhere (Yang et al., 2009; Jing et al., 2021). Briefly, the FACE system had six plots located in different paddies with similar soil and agronomic histories. Three plots were randomly allocated for the elevated CO2 treatments and three for the ambient CO2. Each FACE plot was about 80 m2, and the distance between the center of the FACE and ambient plots was 90 m to avoid contamination of ambient conditions by CO2. Pure CO2 gas was emitted into the center through pipelines installed around the FACE plots. The CO2 concentration of the platform was monitored and controlled via a computer network. The release speed and direction of CO2 gas were automatically adjusted to match the atmospheric CO2 concentration, wind direction, wind speed, and CO2 concentration at the crop canopy height to maintain the CO2 concentration in the main growth period of rice in the FACE plots at 200 ppm higher than the ambient concentration. The CO2 treatment began after seedling transplanting and continued until plant maturity. Treatment was performed daily from sunrise to sunset. The average temperatures from July 01 to October 31 were 24.9 and 25.3°C in 2017 and 2018, respectively (Supplementary Figures 1A,B).
The japonica super rice cultivar Wuyunjing 27 (WYJ27), a popular cultivar in the study region, was selected. Seeds were sown on May 22 of 2017 and 2018 and grown under ambient air for 30 days. Seedlings were manually transplanted to all plots at a density of two seedlings per hill on June 21 in both growing seasons. Hill spacing was 16.7 cm × 25 cm (equivalent to 24 hills m–2). Harvesting was performed on October 13 in 2017 and on October 17 in 2018. Nitrogen was applied as urea (N = 46%) and compound chemical fertilizer (N: P2O5: K2O = 15:15:15) at a rate of 22.5 g N m–2. In each growing season, nitrogen was applied in three occasions (40% of the total as a basal dressing 1 day before transplanting, 30% as a top dressing at the early tillering stage, and 30% as a top dressing at panicle ignition). The P and K were applied as compound fertilizer P2O5 and K2O at a rate of 9 g m–2 1 day before transplanting. For water management, the paddy fields were submerged in water at 5 cm from June 17 to July 20 and then subjected to wet-dry cycles through natural drainage and intermittent irrigation from July 21 to August 10 for both years. Diseases and insects were monitored and controlled during the growing season. Fertilizer application and water management are described elsewhere (Zhao et al., 2019).
Before the SST, plants with the same growth potential (according to the average number of tillers) in each plot were selected and labeled at the heading stage. In 2017 (EXP1), five SSTs were set by cutting off the flag leaf (LC1) and the top three functional leaves (LC3), removing one branch in every three branches of a panicle (SR1/3) and one branch in every two branches of a panicle (SR1/2); in the control (CK), there was no leaf-cutting (LC) or spikelet-removal (SR). In 2018 (EXP2), two SSTs were set by LC3 and CK. A total of 15 hills were selected for the source–sink manipulation within each plot in both EXP1 and EXP2.
At DAT10 (DAT, day after SST), DAT20, and DAT35, three representative hills (based on the average tiller number per hill) were destructively sampled. Samples were separated into leaves, stems (including leaf sheaths), and panicles, and oven-dried at 105°C for 30 min and at 80°C for 72 h. At maturity, five hills in each treatment were selected to determine grain yield and dry matter weight. The panicles per hill were counted to compute the panicles per unit area. Stems and leaves were oven-dried at 105°C for 30 min, followed by 80°C for 72 h. Panicles were air-dried to maintain a constant weight. The stems, leaves, and panicles were weighed to determine dry matter weight. The panicles were hand-threshed, and filled grains, incomplete-filled grains, and empty grains were separated using a winnowing machine (FX-II, Huier Ltd., Hangzhou, China). In 2018, the panicle grains were categorized into three groups according to their position on the panicle, using the following procedure (Finkelstein, 2010; Shao et al., 2020): The panicle was equally divided into upper and lower parts with the same number of primary branches (when the number of primary branches was odd, the upper part had one more branch than the lower part). Grains on the primary branches of the upper part of the panicle were referred to as the superior spikelet (SS), whereas grains on the secondary branches of the lower part represented the inferior spikelet (IS). The remaining grains of the panicle were referred to as the medium spikelet (MS). Grain number and grain weight were determined. Yield and its traits were calculated as follows: FGP (%) = fully-filled grain number × 100/total spikelet number; incomplete-filled grain percentage (IGP) (%) = incomplete-filled grain number × 100/total spikelet number; empty grain percentage (EGP) (%) = empty grain number × 100/total spikelet number; fully-filled grain weight (FGW) = total FGW (mg)/fully-filled grain number, average grain weight of all seeds (AGW) = weight of all seeds/number of all seeds, and yield (g m–2) = panicle number per m2 × spikelet number per panicle (SNP) × FGP × FGW (mg)/1,000.
A portable photosynthesis system (Li-6400, Li-COR Inc., United States) was used to determine the leaf Pn between 9:00–11:30 and 14:30–16:30 on sunny days. Two plants of each treatment in each plot were selected for determination at DAT10, DAT20, and DAT35. The flag leaf, the second leaf, and the fourth leaf were measured for CK rice. The flag leaf was measured for SR1/3 and SR1/2 rice. The second leaf and the fourth leaf were measured for LC1 and LC3 rice, respectively. The measuring position was between 1/2 and 1/3 of the tip of the leaf. The instrument was properly connected and calibrated, and the Li-COR injection system was used to control the CO2 concentration. The CO2 concentrations in ambient and FACE plots were set at 380 and 580 ppm, respectively. The red and blue light source was selected, and the light intensity was set according to the natural light source at each measurement stage (1,200, 1,000, and 1,000 μmol m–2 s–1 at DAT10, DAT20, and DAT35, respectively). Air temperature of the measurement cuvette was maintained at 30°C, with a relative humidity of 65%. The measured leaves were kept for about 100 s in the leaf chamber to reach a stable photosynthesis state before counting.
The NSC content was determined by the sum of total soluble sugar and starch. The anthrone H2SO4 method (Yoshida et al., 1976) was used to determine the soluble sugar and starch contents of the stem and leaf. In detail, the oven-dried stem and leaf samples were ground by a pulverizer, sieved through a 100-mesh sieve, and 50 mg per sample was added into 10-mL centrifuge tubes. Subsequently, 5 mL 80% ethanol was added to the tube, which was placed in a water bath at 80°C for 30 min. The samples were then centrifuged at 4,000 rpm for 10 min before supernatant extraction. These steps were repeated three times; 0.1 g activated carbon was added to the supernatant, which was then left to stand for 12 h at room temperature. The solution was then filtered and transferred to a 50-mL volumetric flask, diluted to volume, and mixed. The residue was dried for the measurement of starch. To determine total soluble sugars, 1.0 mL of the extract was absorbed, and 5 mL 0.2% anthrone reagent was added; the mixture was shaken well and boiled in a water bath for 15 min. Subsequently, it was cooled to room temperature, colorimetry was performed at a wavelength of 620 nm, and the OD value was recorded. The soluble sugar content in the extract was calculated using the standard curve of pure glucose analysis. For the determination of starch, 1.0 mL distilled water was added to the residue, which was then boiled in a water bath for 20 min, with continuous stirring. Subsequently, 1.0 mL of 9.2 mol L–1 HCLO4 was added after cooling while shaking for 10 min. Water (3 mL) was added, and the mixture was centrifuged at 4,000 rpm for 15 min. Then, 4.6 mol L–1 HCLO4 was added to the residue, and the supernatant was extracted. The supernatant was combined and diluted to a constant volume of 50 mL. The extracted glucose was determined using the method for soluble sugar and then converted into starch.
The field experiment was a completely randomized design with a split-plot arrangement. The CO2 was treated as the main plot, and SSTs were subplots with three replications. Analysis of variance (ANOVA) was performed using the SPSS statistical software (SPSS 20.0, SPSS Inc., Chicago, IL, United States). The least significant difference was used to compare the means among treatments. Statistically significant effects were indicated as follows: ∗∗P < 0.01, ∗P < 0.05, +P < 0.1, and not statistically significant (ns) P ≥ 0.1. Pearson’s correlations were calculated to determine the relationships among the different parameters of yield and its components.
Compared with ambient CO2, eCO2 significantly increased the grain yield per unit area (GYA) of WYJ27 by 15.7% on average, and crop yields under CK, LC1, LC3, SR1/3, and SR1/2 treatments were significantly increased by 13.9, 18.1, 25.3, 12.0, and 10.9%, respectively (Figure 1A). Compared with CK, the LC1, LC3, SR1/3, and SR1/2 treatments significantly reduced GYA by 8.3, 40.1, 21.0, and 38.1%, respectively. Grain yield per panicle (GYP) was obtained by dividing GYA by panicle number per unit area (PNA), which showed a similar trend to GYA in the response to eCO2, LC, and SR. Compared with CK, LC3 significantly increased the response of GYP to eCO2, whereas SR caused a slight reduction (Figure 1B). No significant interaction effect between CO2 and SSTs was observed on GYA or GYP.
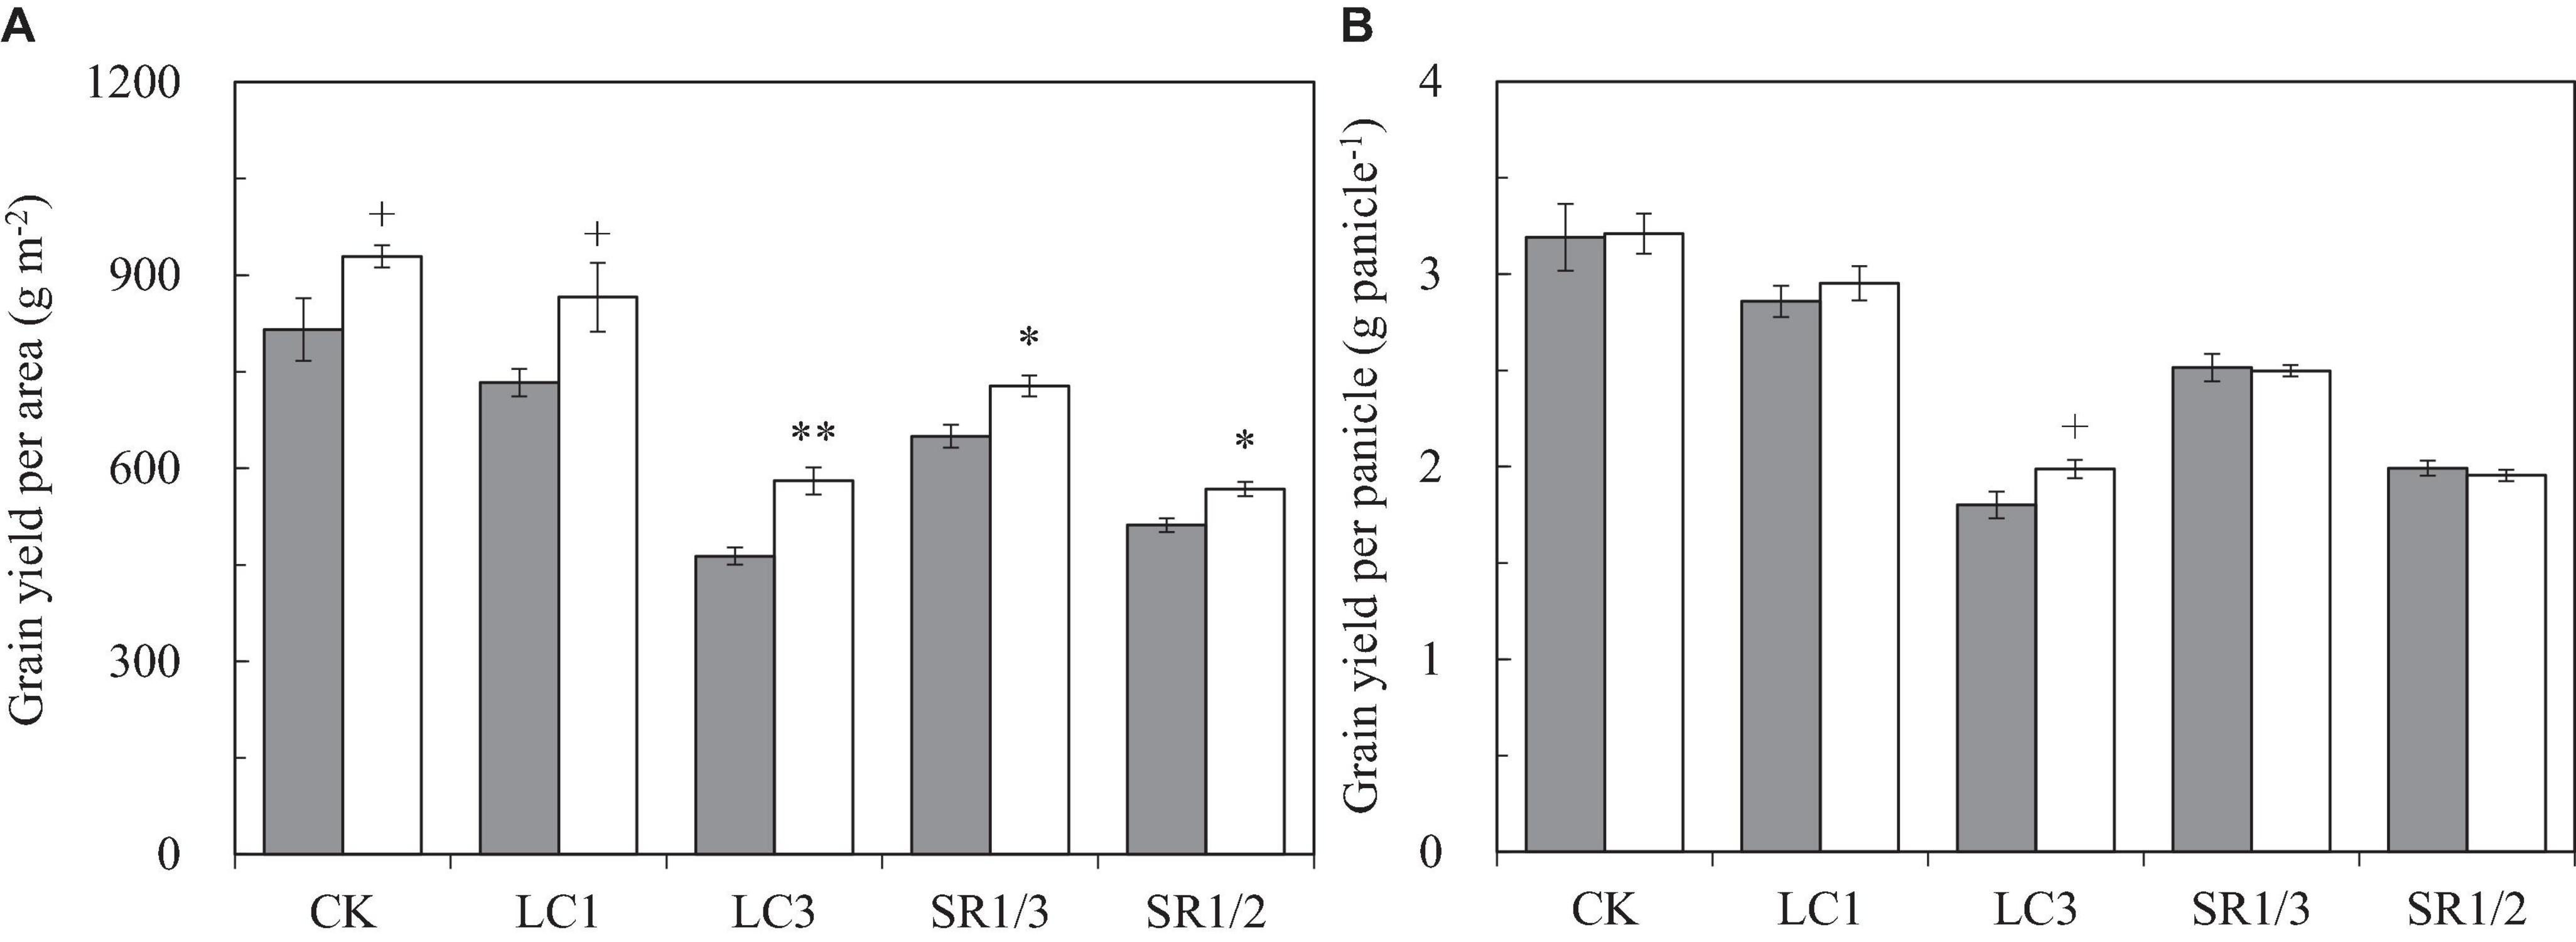
Figure 1. Grain yield per area (A) and grain yield per panicle (B) of WYJ27 affected by elevated CO2 and different source-sink treatments in 2017. Each bar in the figure represents the mean values across three plots for ambient CO2 (aCO2, filled square) or elevated CO2 (eCO2, aCO2 + 200 ppm, unfilled square); vertical bars represent standard error (n = 3). CK, no leaf cutting or spikelet removing; LC1, cutting off the flag leaf; LC3, cutting off top three leaves; SR1/3, removing one branch in every three branches of a panicle; SR1/2, removing one branch in every two branches of a panicle. **P < 0.01, *P < 0.05, +P < 0.1.
We observed that eCO2 did not affect SNP but significantly increased PNA and total SNA by 13.5 and 12.3%, respectively (Figure 2A and Supplementary Figures 2A,B). Compared with CK, LC had no significant effect on the above three parameters, but SNP and SNA were significantly reduced by SR treatments: SR1/3 and SR1/2 significantly reduced SNP by 34.9 and 51.4%, respectively, and the reduction of SNA was almost the same with SNP. No significant interaction effect between CO2 and SSTs was observed on these three parameters.
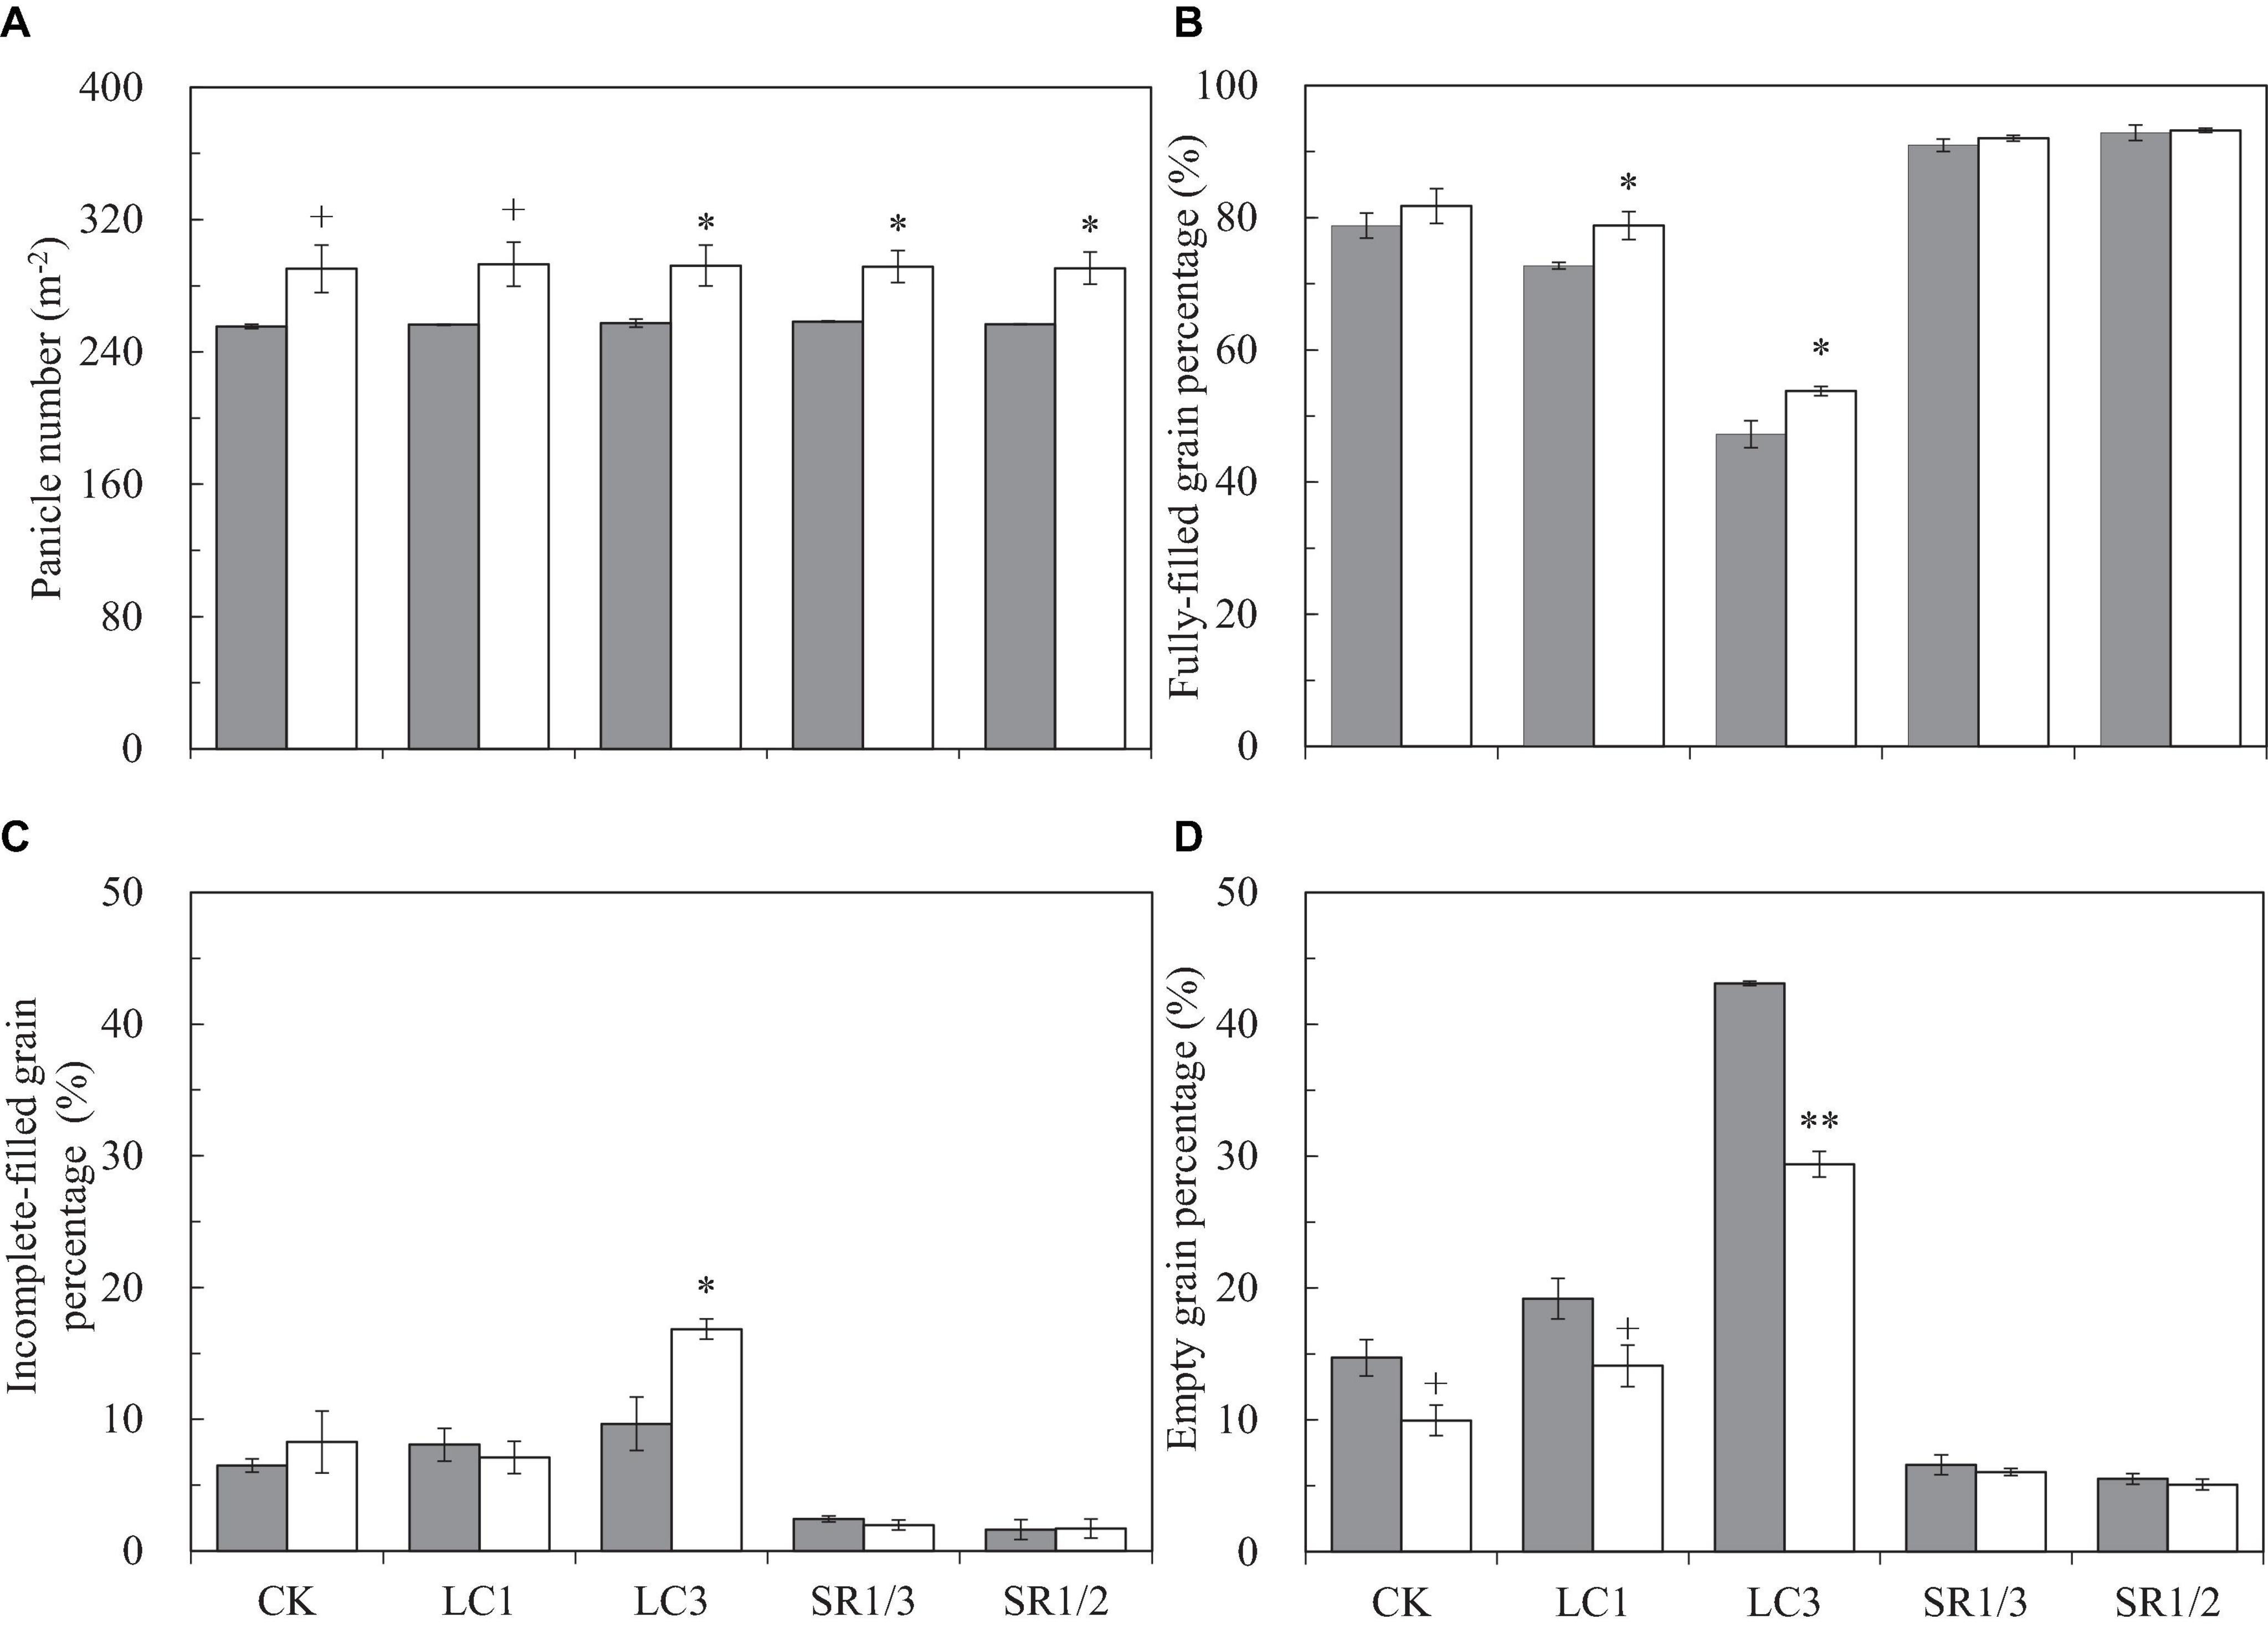
Figure 2. Panicle number per area (A), fully-filled grain percentage (B), incomplete-filled grain percentage (C), empty grain percentage (D) of WYJ27 affected by elevated CO2 and different source-sink treatments in 2017. Each bar in the figure represents the mean values across three plots for ambient CO2 (aCO2, filled square) or elevated CO2 (eCO2, aCO2 + 200 ppm, unfilled square); vertical bars represent standard error (n = 3). CK, no leaf cutting or spikelet removing; LC1, cutting off the flag leaf; LC3, cutting off top three leaves; SR1/3, removing one branch in every three branches of a panicle; SR1/2, removing one branch in every two branches of a panicle. **P < 0.01, *P < 0.05, +P < 0.1.
To better understand the grain filling capacity, we measured not only FGP but also IGP and EGP. Compared with ambient CO2, eCO2 significantly increased FGP by 4.4% on average, and crop yields under CK, LC1, LC3, SR1/3, and SR1/2 were increased by 3.8, 8.3∗, 13.8∗, 1.1, and 0.4%, respectively (Figure 2B). On average, eCO2 slightly increased IGP (Figure 2C) but significantly decreased EGP by 27.6% (Figure 2D) compared with ambient CO2. Among the crops under different SSTs, eCO2 significantly decreased the EGP of CK, LC1, and LC3 crops by 32.4, 26.6, and 31.8%, respectively, whilst no changes were observed in SR crops. Compared with CK, LC1 and LC3 significantly reduced FGP by 5.6 and 37.1%, respectively, and SR1/3 and SR1/2 significantly increased FGP by 13.9 and 15.9%, respectively. The reduction of FGP caused by LC was mainly related to the increase of EGP, whereas the significant increase in FGP in SR crops was mainly related to the decrease of both EGP and IGP. Variance analysis showed that CO2 × LC3, CO2 × SR1/3, and CO2 × SR1/2 had different degrees of interaction on EGP (Table 1).
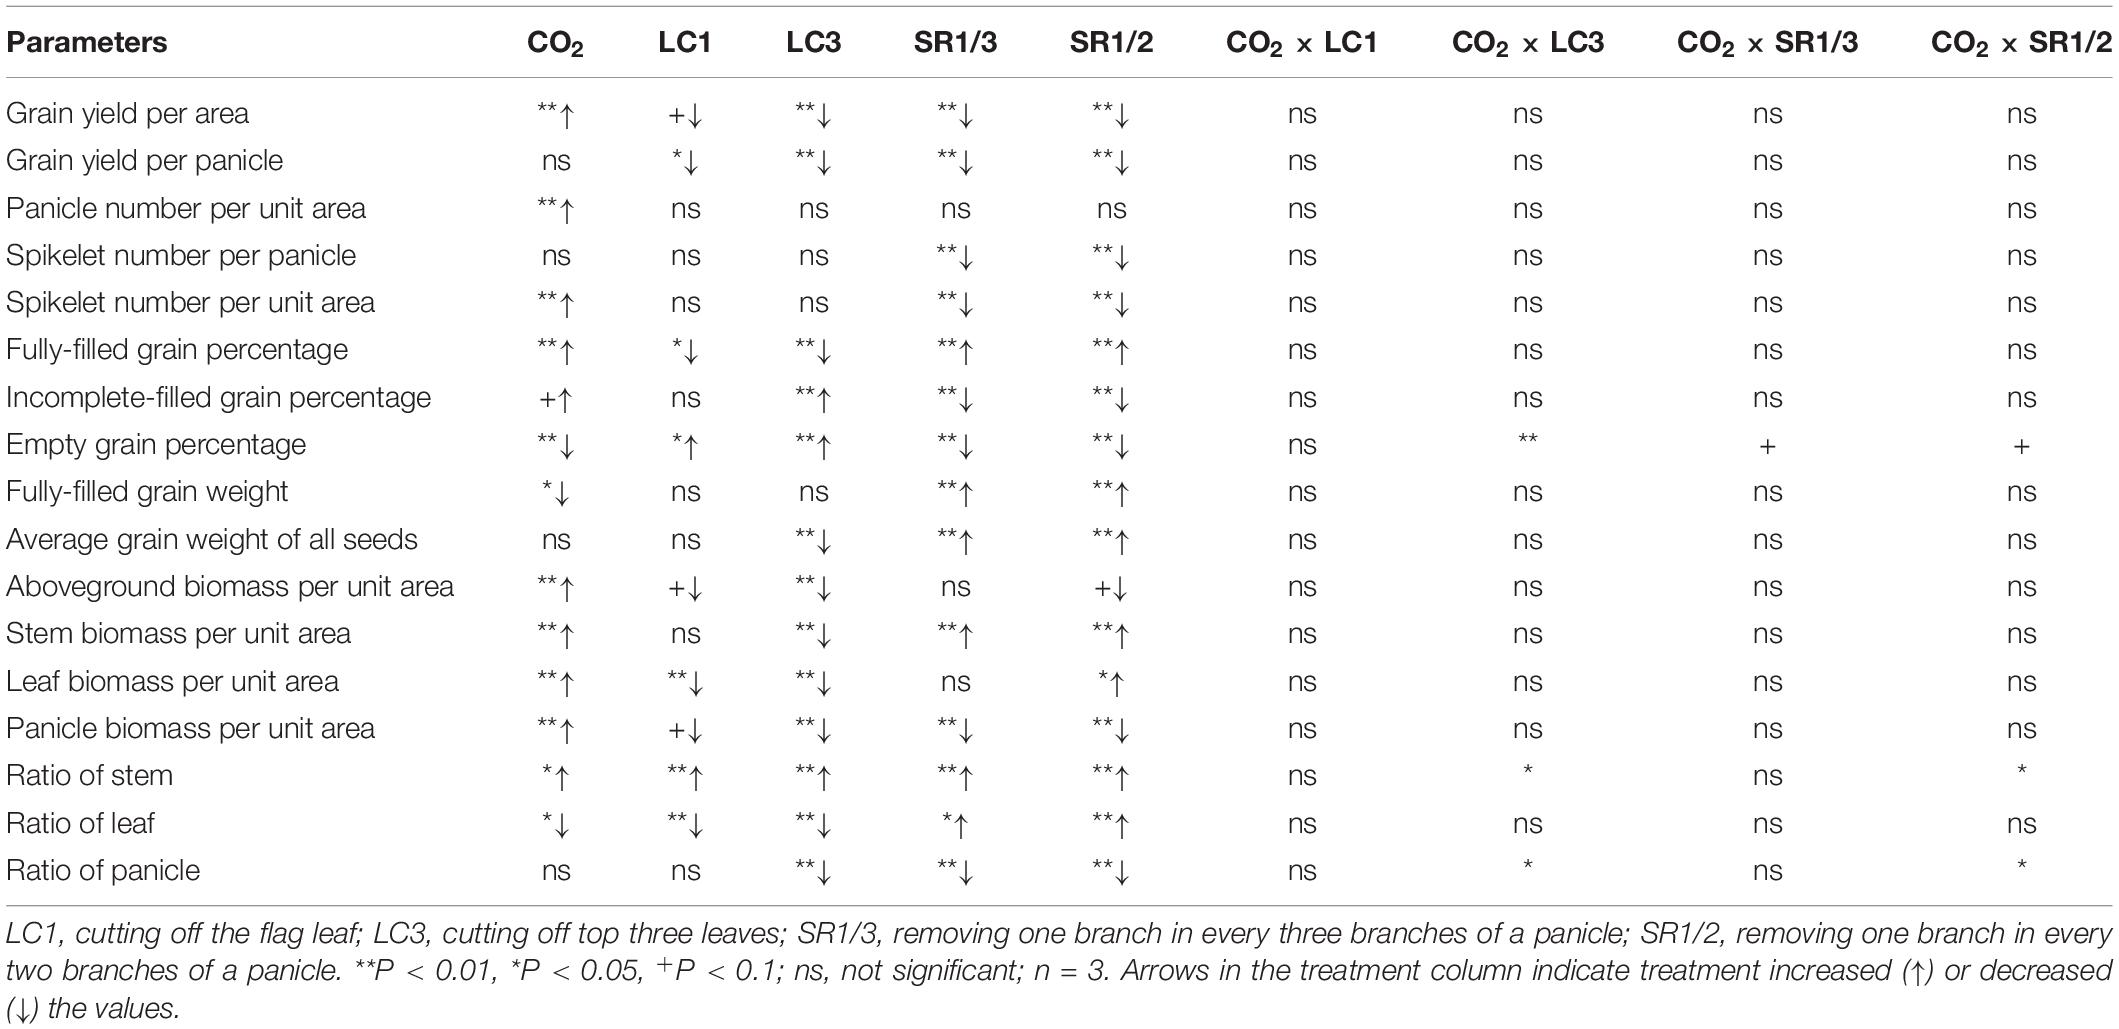
Table 1. Significance test for yield, yield traits, biomass per area, and dry matter distribution of WYJ27 under elevated CO2 and different source-sink treatments in 2017.
Unlike the three afore-mentioned parameters, the responses of grain weight to eCO2 and SSTs were small (Supplementary Figures 2C,D). Both eCO2 and LC had little effect on the FGW (ca.1%). However, compared with CK, SR1/3 and SR1/2 significantly increased FGW by 5.6 and 9.4%, respectively. The AGW was the mean grain weight of all grains, including fully-filled grains, unfilled grains, and empty grains; the response of AGW to eCO2 and SSTs was similar to that of FGP, but the response range was significantly smaller.
Correlation analysis showed that the response of GYA to eCO2 had no significant correlation with the responses of PNA, SNP, SNA, FGW, EGP, and IGP (Table 2), but was significantly positively correlated with FGP (r = 0.994∗∗, Supplementary Figure 3A) and AGW (r = 0.976∗∗, Supplementary Figure 3B). The response of GYP to eCO2 was not significantly correlated with SNP and FGW, but it was positively correlated with FGP (r = 0.981∗∗, Supplementary Figure 3C) and AGW (r = 0.962∗∗, Supplementary Figure 3D).
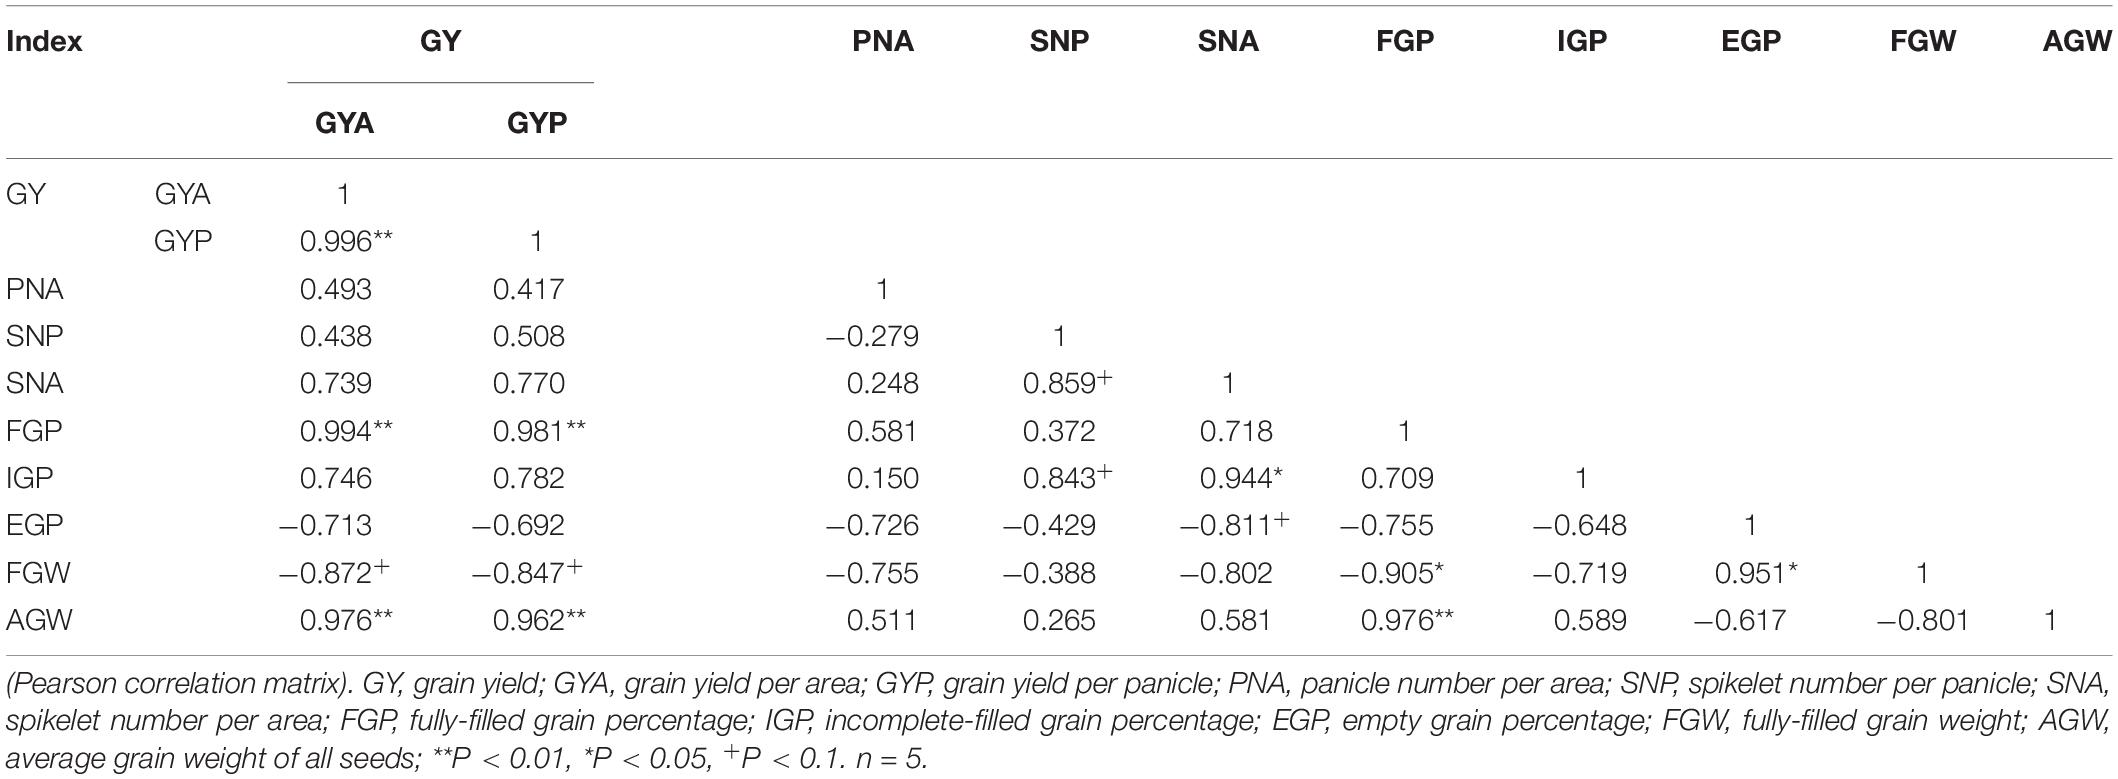
Table 2. Relationships among the CO2-induced changes in yield, yield traits of five source-sink treats under elevated CO2.
We measured yield and its components for grains located at different panicle positions of CK and LC3 crops in 2018 (EXP2). Compared with ambient CO2, eCO2 significantly increased the GYA by about 19.0% (Figure 3A); among the different SSTs, the CK and LC3 crops were significantly increased by 15.9 and 25.1%, respectively. In terms of grain position, eCO2 increased the yield of SS, MS, and IS by 15.6, 20.4∗∗, and 22.7%∗∗, respectively. Compared with CK, LC3 significantly decreased GYA by 47.2% on average. Among the different grain positions, LC3 significantly decreased the GYA of SS, MS, and IS by 26.7, 53.2, and 66.1%, respectively. The response trend of GYP to eCO2 was similar to that of GYA (Figure 3B): the response of LC3 crops (9.1%) was significantly higher than that of CK (1.9%); the responses of MS (5.6%) and IS (7.3%) were higher than that of SS (1.3%) on average for two factors (CO2 and SSTs). Position × LC3 had a significant interaction effect on GYP and GYA (Table 3).
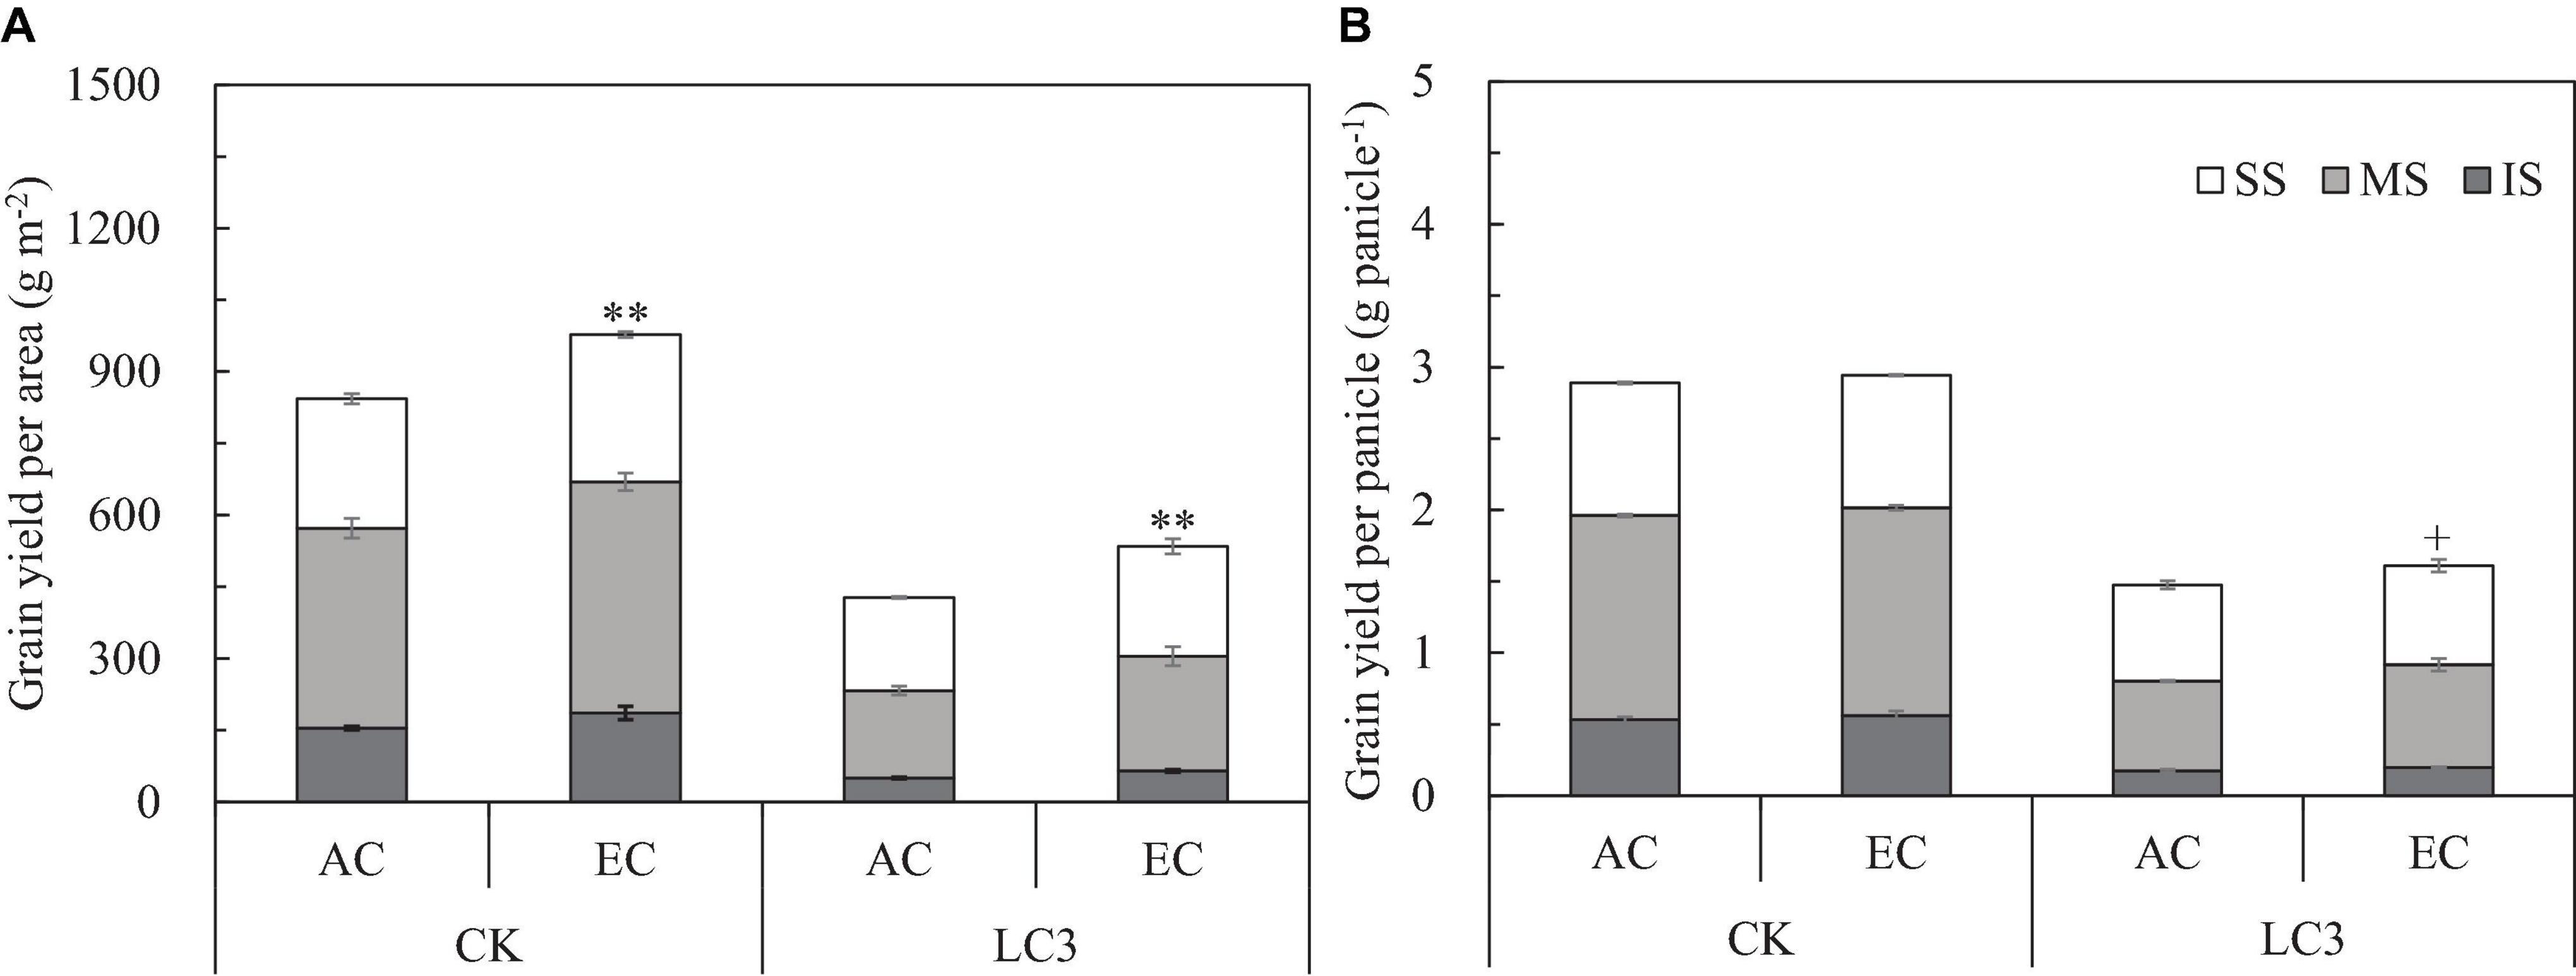
Figure 3. Grain yield per area (A) and grain yield per panicle (B) of WYJ27 affected by elevated CO2 and leaf-cutting treatment in 2018. Each bar in the figure represents the mean values across three plots for ambient CO2 (AC) or elevated CO2 (EC, AC + 200 ppm); vertical bars represent standard error (n = 3). CK, no leaf cutting; LC3, cutting off top three leaves. P, grain position; SS, superior spikelet; MS, medium spikelet; IS, inferior spikelet. **P < 0.01, +P < 0.1.
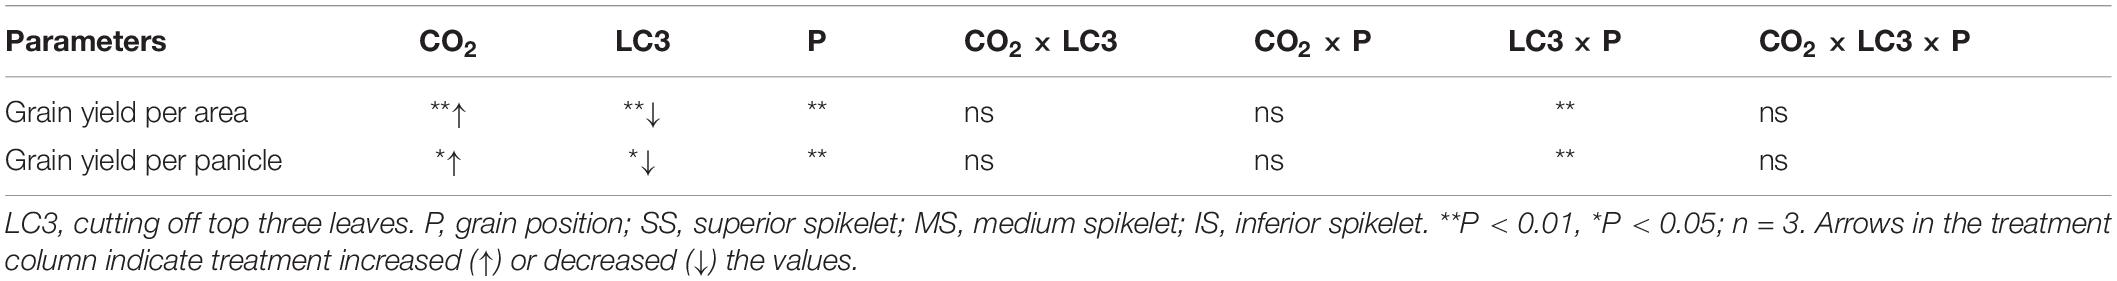
Table 3. Significance test for grain yield per area and per panicle of WYJ27 under elevated CO2 and different source-sink treatments in 2018.
Compared with ambient CO2, eCO2 did not affect SNP but significantly increased PNA and SNA by 14.0% on average (Table 4). The LC3 had no significant effect on the above three parameters compared with CK. We observed no significant interaction effect between CO2, LC3, and position on the three parameters.
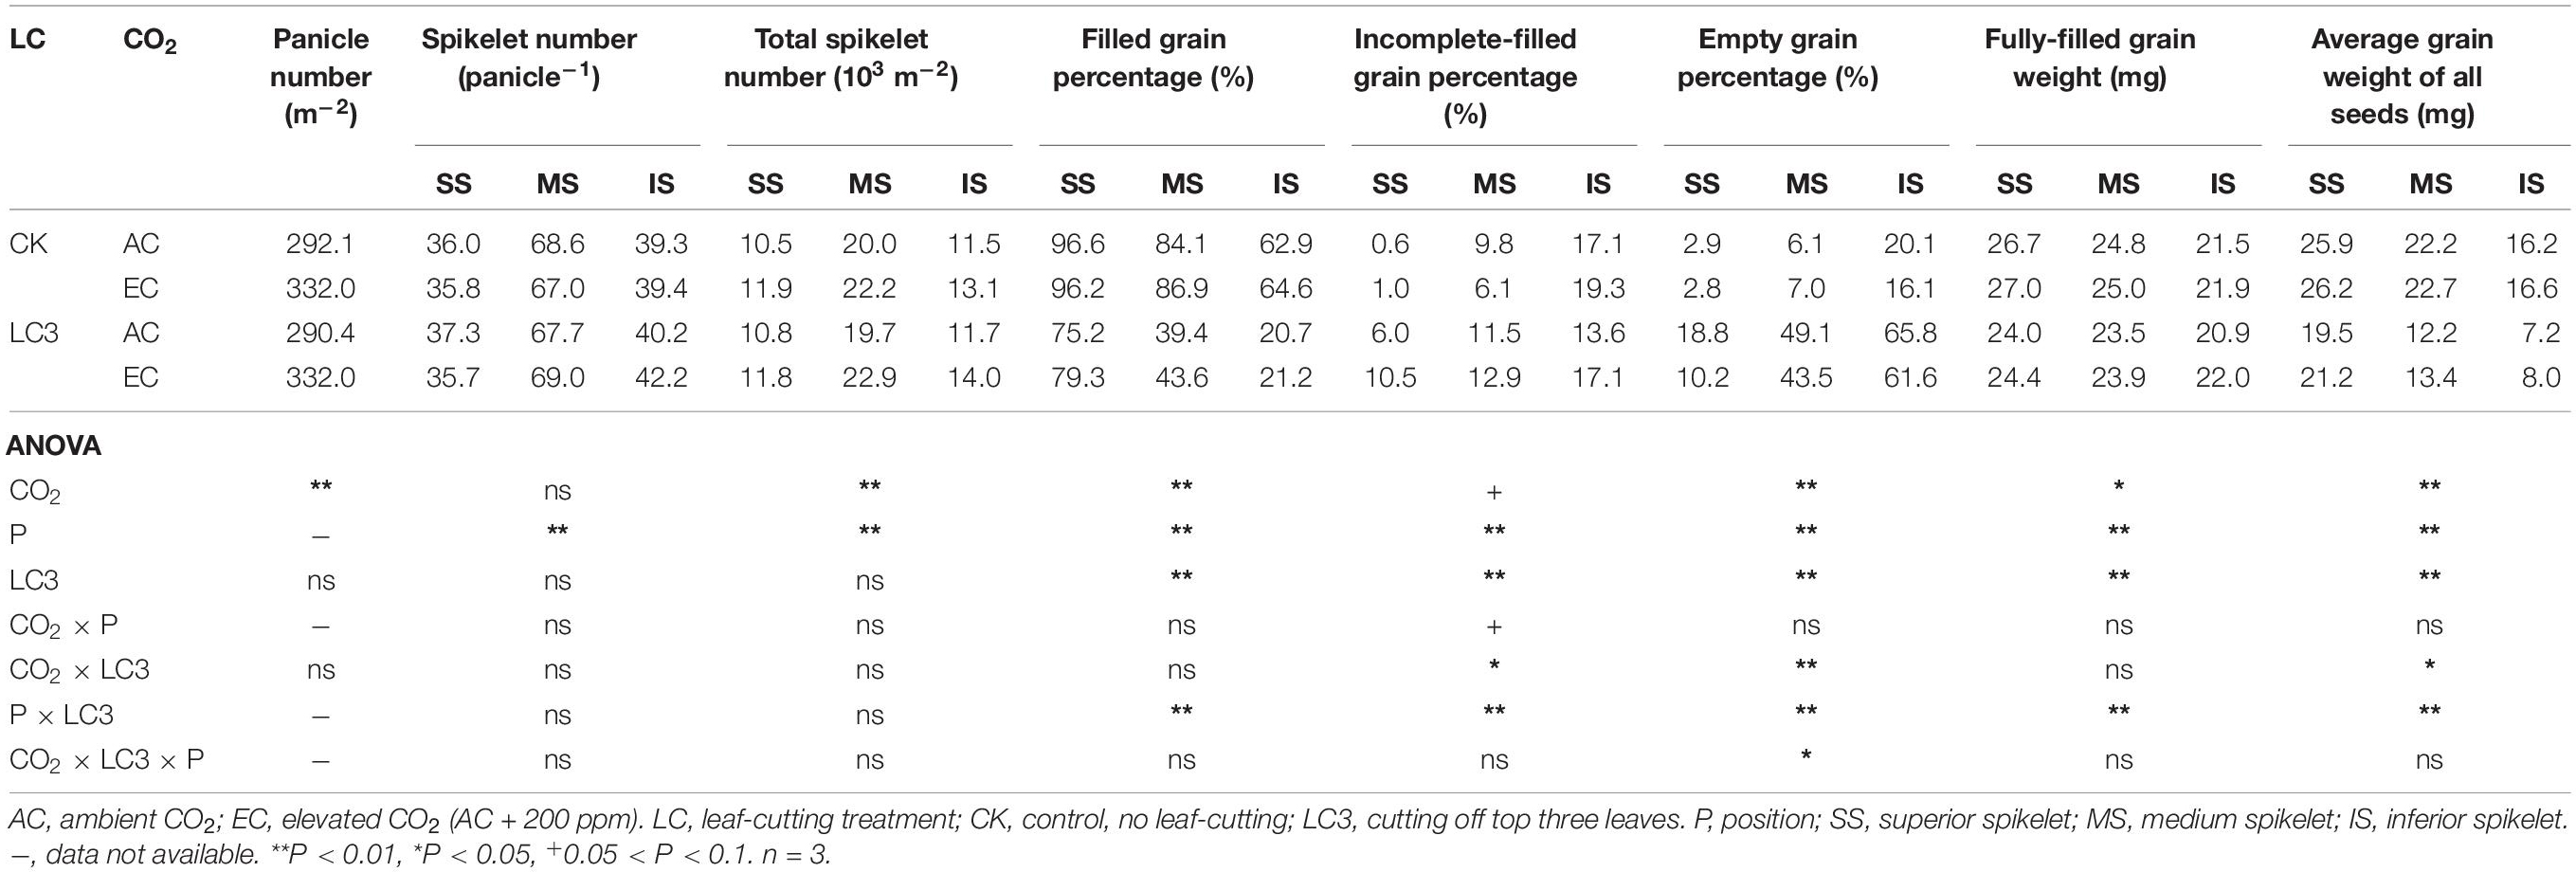
Table 4. Panicle number per area, spikelet number per panicle and total spikelet number per area, filled grain percentage, incomplete-filled grain percentage, empty grain percentage, fully-filled grain weight, average grain weight of all seeds of WYJ27 as affected by elevated CO2, grain position and leaf-cutting treatment in 2018.
Similar to EXP1 results, eCO2 and LC3 had substantial effects on FGP and EGP but little effects on IGP (Table 4). Compared with ambient CO2, eCO2 significantly increased FGP by 3.4% on average; among the different SSTs, CK and LC3 crops were significantly increased by 1.7 and 6.5%, respectively. Among the different grain positions, the responses of FGP of the middle and lower grain were slightly greater than those of the upper grain. Compared with CK, LC3 significantly decreased the FGP by 43.1% on average, and the FGP values of SS, MS, and IS were significantly decreased by 19.8, 51.4, and 67.2%, respectively. The responses of FGP were mainly related to EGP: compared with ambient CO2, eCO2 significantly reduced the EGP by about 13.2%, and the LC3 crop was reduced more significantly than CK, as indicated by the significant CO2 × LC3 interaction. Compared with CK, LC3 significantly increased the EGP, and the increase of MS and IS was greater than that of SS, which led to a significant LC3 × position interaction.
The response of FGW to eCO2 and LC3 was lower than that of AGW (Table 4). Compared with ambient CO2, eCO2 significantly increased FGW and AGW by 1.9 and 4.8%, respectively, and the response of LC3 crops was more pronounced than that of CK, whereas that of IS was slightly higher than that of SS or MS. For instance, eCO2 increased AGW of CK and LC3 crops by 1.9 and 9.7%∗∗ and significantly increased that of SS, MS, and IS by 4.4, 5.0, and 5.5%, respectively. Compared with CK, LC3 significantly decreased FGW and AGW by about 5.7 and 37.3%, respectively, and the response trend of AGW followed the order IS (53.9%∗∗) > MS (43.0%∗∗) > SS (21.9%∗∗); for FGW, the opposite trend was observed. There was no interaction effect between CO2 and LC3 on AGW, whereas position × LC3 had a significant impact on both parameters.
Compared with ambient CO2, eCO2 significantly increased the aboveground biomass (AGB) by 17.3%, and the response of LC3 crops (27%) was almost twice that of SR1/2 crops (15%) (Figure 4). Compared with CK, LC and SR significantly decreased AGB; among the different SSTs, LC3 crops had the largest decrease (28%), and the decreases caused by other SSTs were similar (about 7%). Compared with ambient CO2, eCO2 significantly increased the dry weights of stem, leaf, and panicle by 20.8, 10.3, and 16.4%, respectively. The increase in stem weight was similar under different SSTs; however, the response of leaf and panicle to eCO2 under LC3 was significantly higher than that under other SSTs. For example, eCO2 increased the leaf weight of CK, LC1, LC3, SR1/3, and SR1/2 crops by 8.8, 10.8, 28.9+, 8.2, and 7.7%, respectively. Compared with CK, cutting leaves reduced the dry weight of each organ uniformly, but the effect of spikelet removal was different in various organs; for instance, SR1/3 and SR1/2 significantly increased stem weight by 18.8 and 44.5% and leaf weight by 4.4 and 13.8%∗, but significantly reduced panicle weight by 20.9 and 38.6%, respectively. There was no interaction between CO2 and SSTs on AGB or its components.
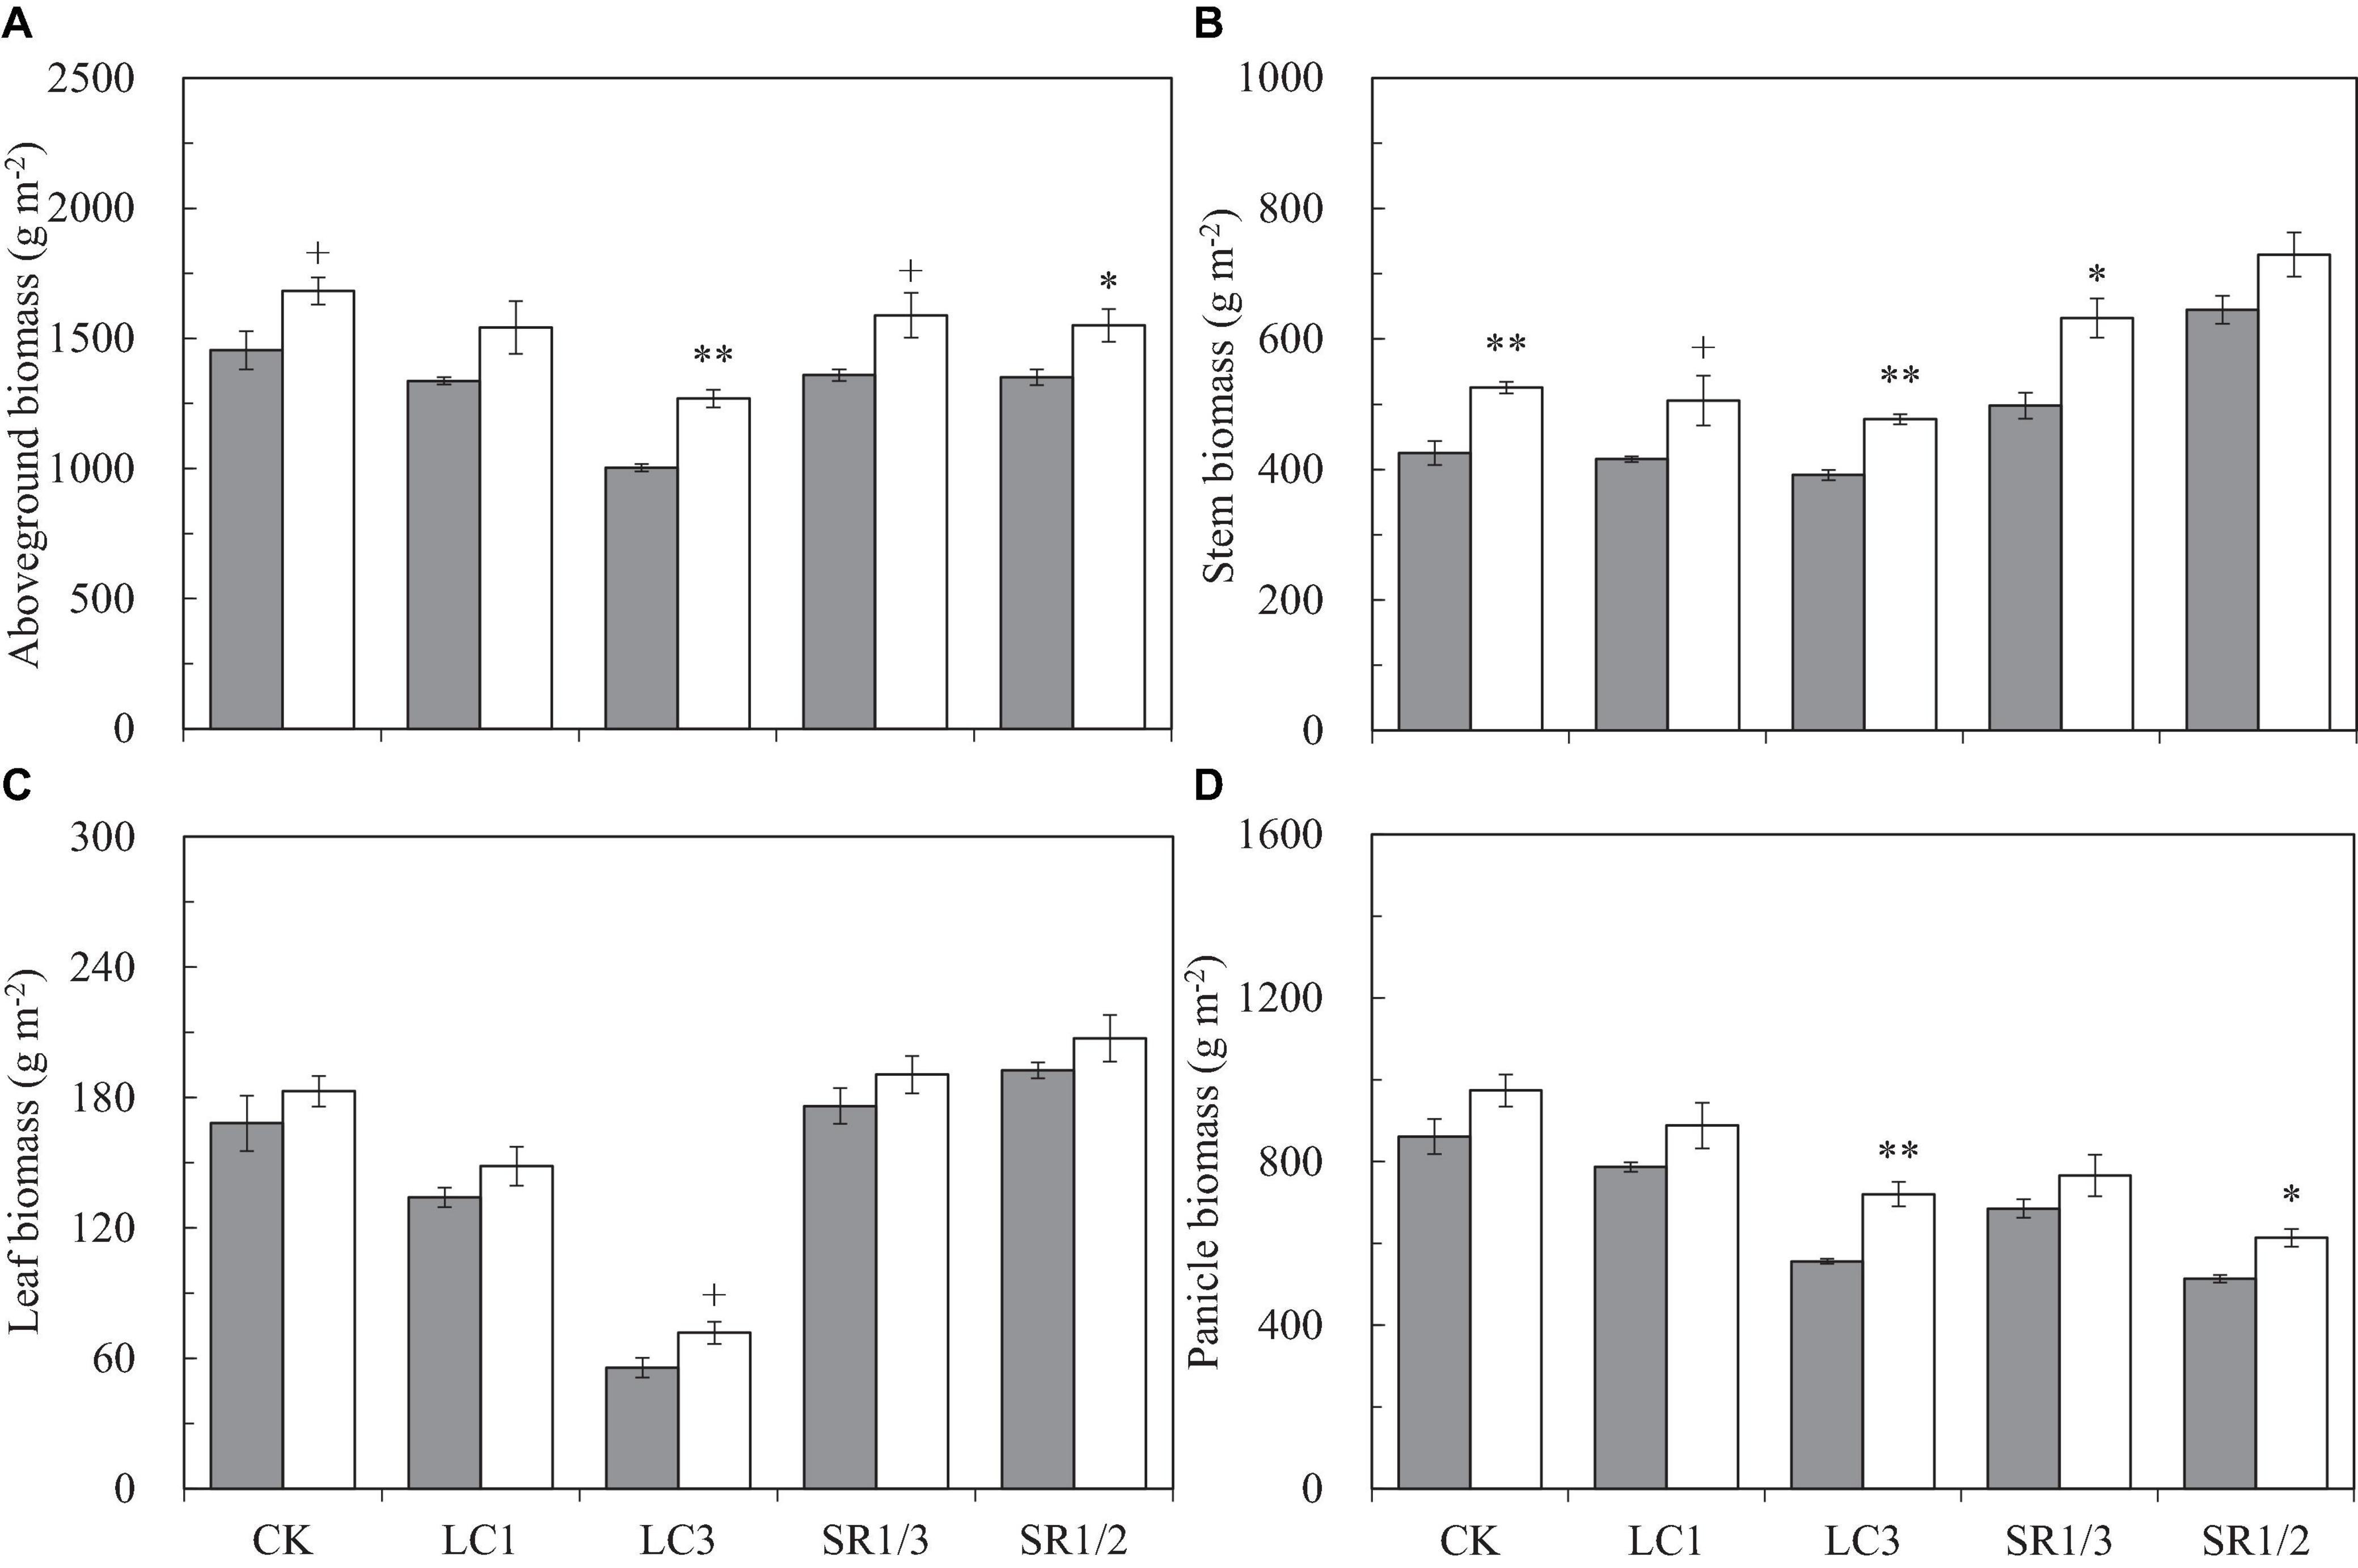
Figure 4. Aboveground biomass (A), stem biomass (B), leaf biomass (C), and panicle biomass (D) of WYJ27 per unit area at maturity affected by elevated CO2 and different source-sink treatments in 2017. Each bar in the figure represents the mean values across three plots for ambient CO2 (aCO2, filled square) or elevated CO2 (eCO2, aCO2 + 200 ppm, unfilled square); vertical bars represent standard error (n = 3). CK, no leaf cutting or spikelet removing; LC1, cutting off the flag leaf; LC3, cutting off top three leaves; SR1/3, removing one branch in every three branches of a panicle; SR1/2, removing one branch in every two branches of a panicle. **P < 0.01, *P < 0.05, +P < 0.1.
Compared with ambient CO2, eCO2 significantly increased the dry weight ratio of the stem (RS) by about 2.6% and decreased the dry weight ratio of the leaf (RL) by 5.1% (Supplementary Figure 4); it had no significant effect on the dry weight ratio of the panicle (RP). Among the crops under different SSTs, eCO2 significantly increased the RS of CK, LC1, and SR1/3 crops by 6.9, 5.2, and 8.8%, respectively, and slightly decreased the RS of LC3 and SR1/2 crops. No significant influence of eCO2 was observed on RL or RP of crops under different SSTs (Supplementary Figures 4B,C). Compared with CK, spikelet removal significantly increased RL, especially for RS (26.3∗∗ and 56.6%∗∗ by SR1/3 and SR1/2, respectively), but decreased RP (15.8∗∗ and 33.7%∗∗ by SR1/3 and SR1/2, respectively). However, leaf cutting decreased RL but increased RS, resulting in a negligible effect on the RP (Supplementary Figure 4C). Analysis of variance showed that CO2 × LC3 and CO2 × SR1/2 had significant impacts on RS and RP (Table 1).
The NSC content of the stem at different stages followed the order DAT35 > DAT10 > DAT20 (DAT, day after SST) (Figure 5). Compared with ambient CO2, eCO2 significantly increased the NSC content by 19.1% on average during the grain filling stage. Among the different SSTs, CK, LC1, LC3, SR1/3, and SR1/2 crops were increased by 7.1, 30.7∗∗, 23.7∗∗, 12.6∗∗, and 23.6%∗∗, respectively; among the different stages, eCO2 significantly increased the NSC content by 20.6, 8.2, and 22.9% at DAT10, DAT20, and DAT35, respectively. Compared with CK, LC1 and LC3 significantly reduced the NSC content by 11.4 and 24.8%, respectively. On the contrary, removing spikelets significantly increased the NSC content of the stem, especially at DAT35. Different degrees of the effects of interaction between CO2 and SSTs on the NSC content of the stem at DAT35 were observed (Table 5).
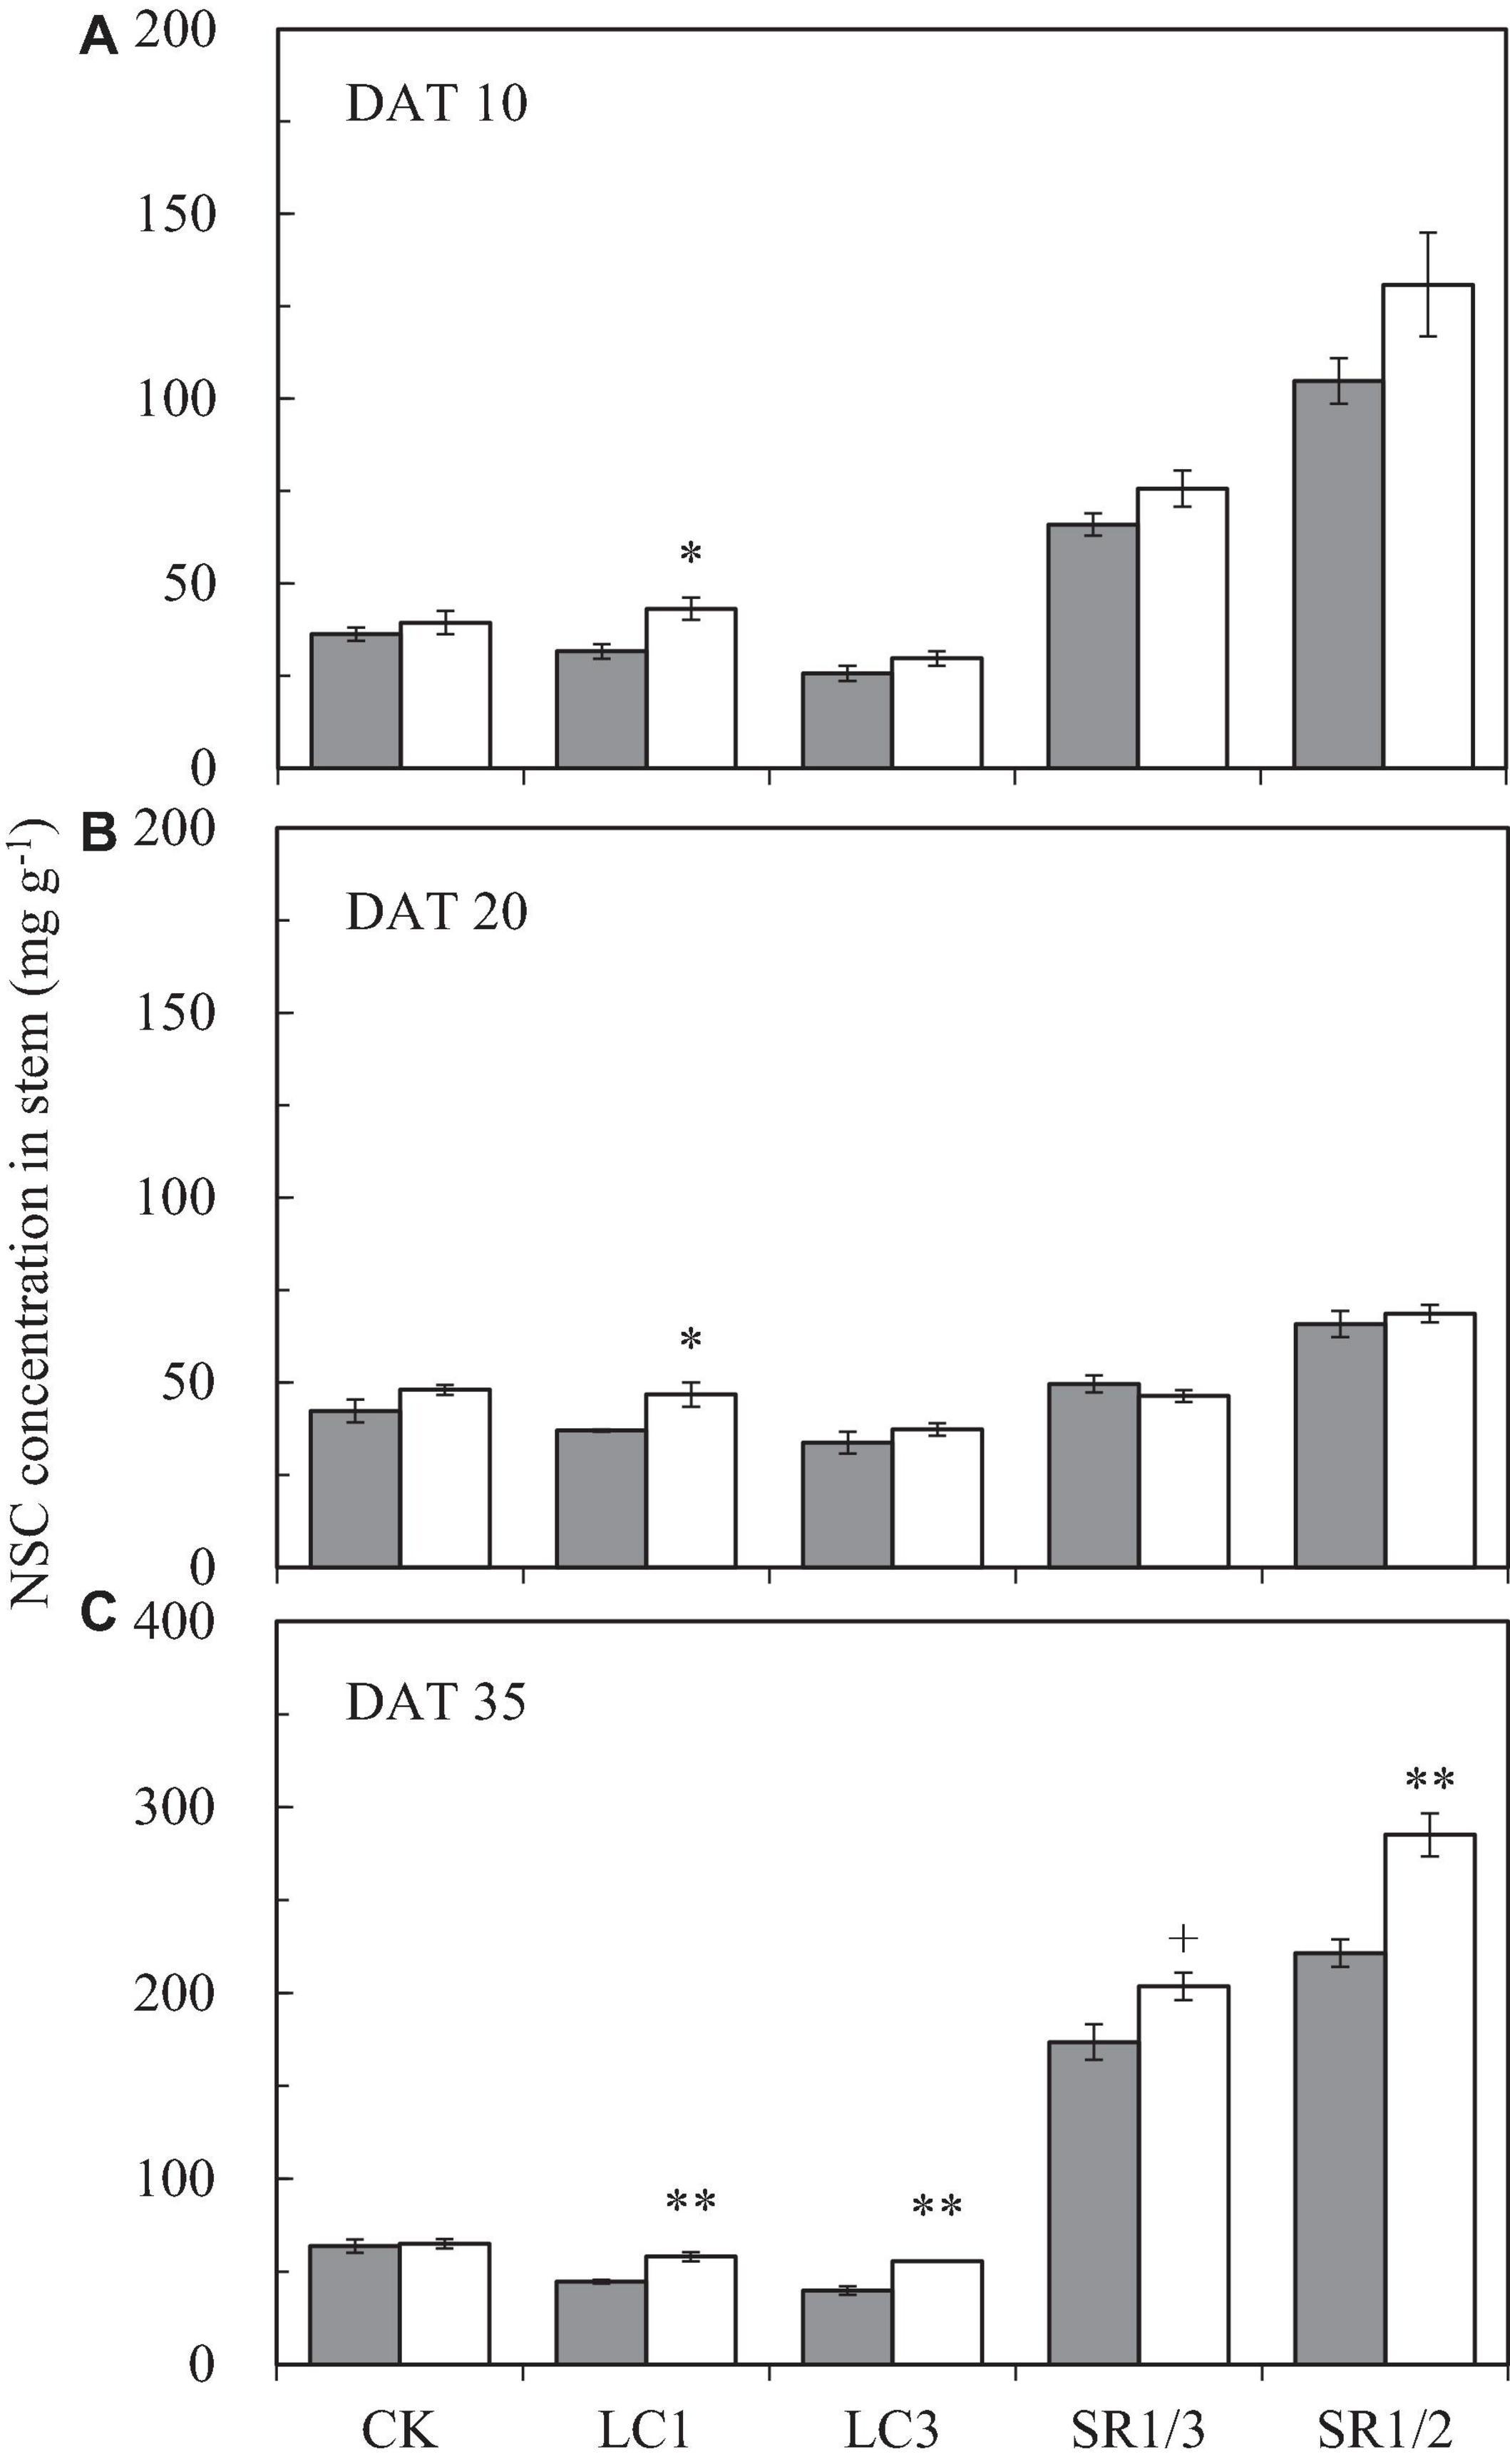
Figure 5. The NSC concentration in stem of WYJ27 at DAT10 (A), DAT20 (B), and DAT35 (C) affected by elevated CO2 and different source-sink treatments in 2017. Each bar in the figure represents the mean values across three plots for ambient CO2 (aCO2, filled square) or elevated CO2 (eCO2, aCO2 + 200 ppm, unfilled square); vertical bars represent standard error (n = 3). CK, no leaf cutting or spikelet removing; LC1, cutting off the flag leaf; LC3, cutting off top three leaves; SR1/3, removing one branch in every three branches of a panicle; SR1/2, removing one branch in every two branches of a panicle. DAT, day after source-sink treatment. **P < 0.01, *P < 0.05, +P < 0.1.
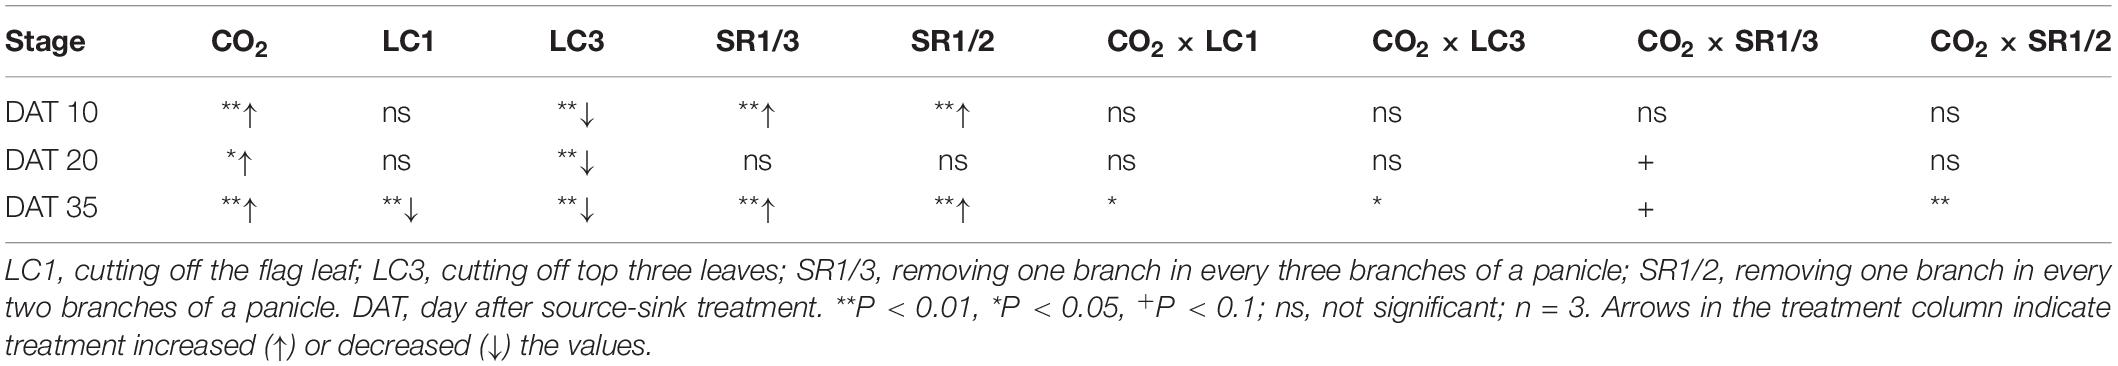
Table 5. Significance test for the NSC concentration in stem of WYJ27at DAT10, DAT20, and DAT35 affected by elevated CO2 and different source-sink treatments in 2017.
We observed that the Pn of the flag leaf gradually decreased with the growth stage. Compared with ambient CO2, eCO2 significantly increased the Pn of the flag leaf by 9.3% on average during the grain filling stage (Figure 6A). The response of SR crops to eCO2 at DAT10 and DAT20 was less pronounced than that of CK. Compared with CK, SR1/3 and SR1/2 significantly reduced the Pn of the flag leaf by 5.7 and 8.5% on average over the three stages, respectively. However, no interaction was observed among CO2, SR, and stage (Table 6).
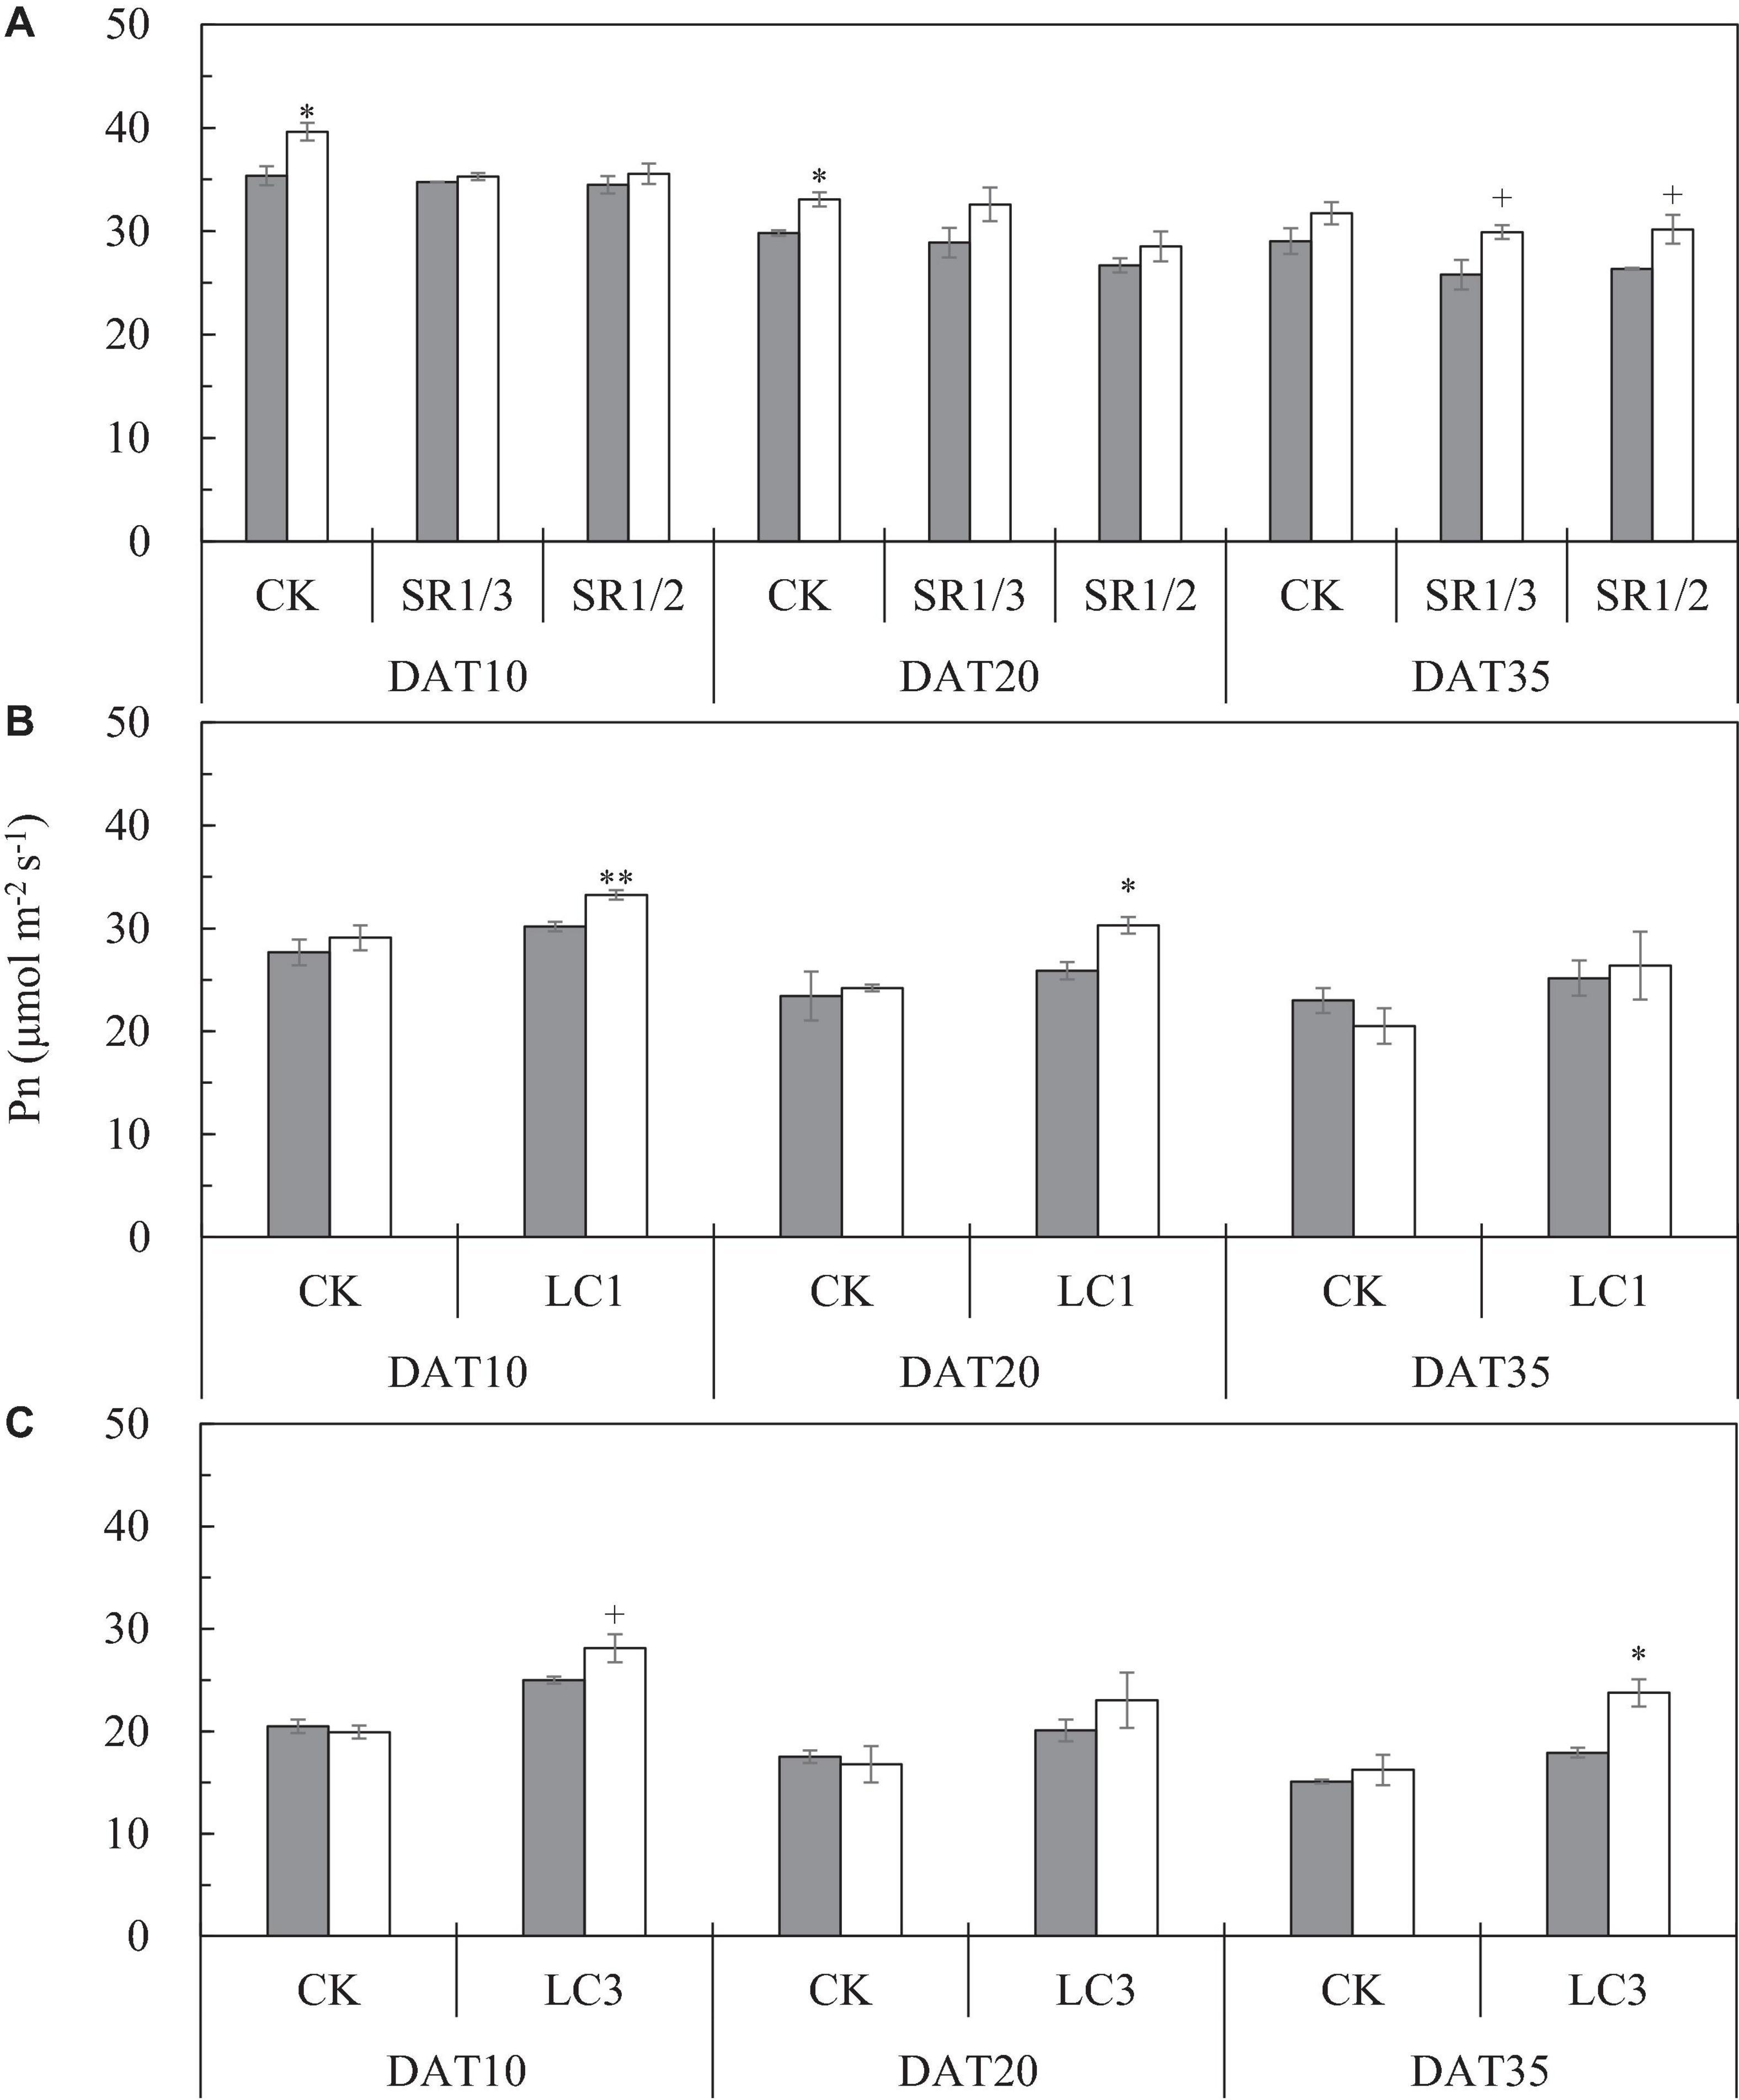
Figure 6. The Pn of flag leaf [(A); CK, SR1/3, and SR1/2], second leaf [(B); CK and LC1], and fourth leaf [(C); CK and LC3] of WYJ27 at different stages affected by elevated CO2 and different source-sink treatments in 2017. Each bar in the figure represents the mean values across three plots for ambient CO2 (aCO2, filled square) or elevated CO2 (eCO2, aCO2 + 200 ppm, unfilled square); vertical bars represent standard error (n = 3). SR, spikelet removing treatments; CK, no leaf cutting or spikelet removal; LC1, cutting off the flag leaf; LC3, cutting off top three leaves; SR1/3, removing one branch in every three branches of a panicle; SR1/2, removing one branch in every two branches of a panicle. DAT, day after source-sink treatment. **P < 0.01, *P < 0.05, +P < 0.1.
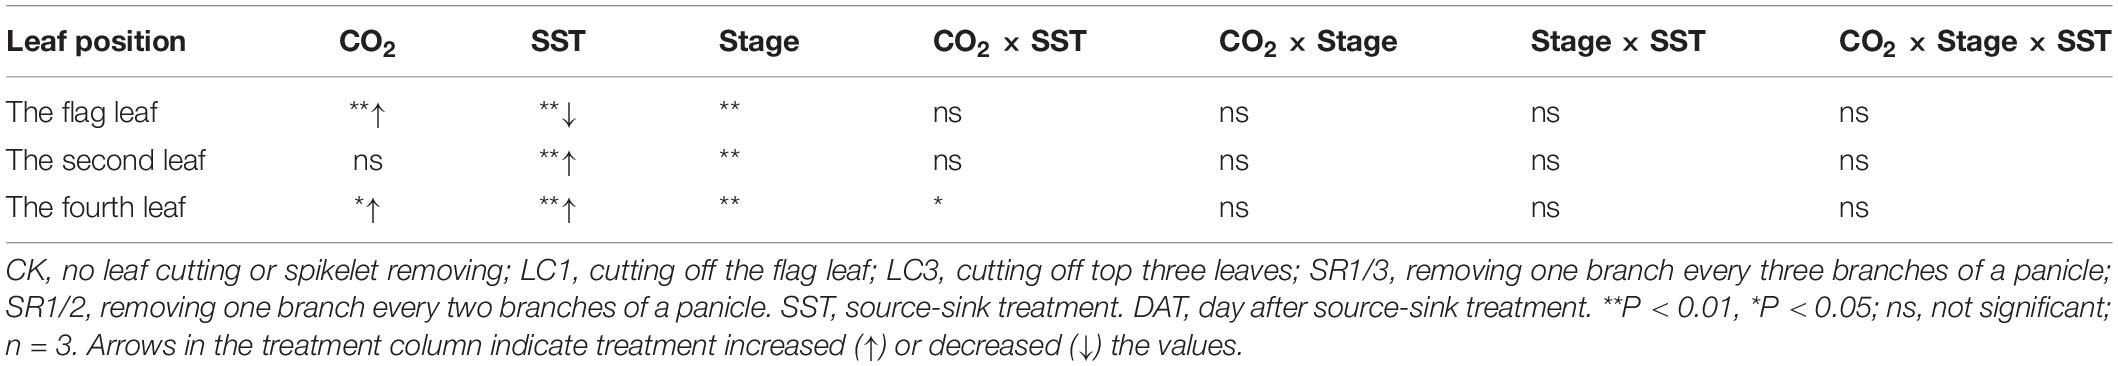
Table 6. Significance test for the Pn of flag leaf (CK, SR1/3, and SR1/2 crops), second leaf (CK and LC1 crops) and fourth leaf (CK and LC3 crops) of WYJ27 at different stages as affected by elevated CO2 and different source-sink treatments in 2017.
To compare the Pn values of the same leaf of CK and LC1 crops, we measured Pn of the second leaf, which also gradually decreased during the grain filling stage (Figure 6B). Averaged over two SSTs (CK and LC1) and three determination stages, eCO2 increased the Pn of the second leaf by 5.4%, and this was mainly related to the significant increase of LC1 crops (10.7%), whereas CK crops showed no significant response. Compared with CK, the Pn of LC1 crops showed an advantageous response to eCO2, especially at the early and middle stages of grain filling. Compared with CK, LC1 significantly increased the Pn of the second leaf during the grain filling stage by 15.7%. There was no interaction effect among CO2, LC1, and stage on the Pn of the second leaf.
We measured the Pn of the fourth leaf of CK and LC3 crops to compare the Pn values of the same leaf position. The Pn of the fourth leaf gradually decreased during the grain filling stage (Figure 6C). Compared with ambient CO2, eCO2 significantly increased the Pn of the fourth leaf by 10.1% on average, and that of LC3 crops was significantly increased by 18.9%; in contrast, CK was not affected. The response of LC3 crops in the FACE plots was more apparent at DAT35, indicating that LC3 rice could weaken or prevent photosynthetic adaptation at the later stage of grain filling. Compared with CK, LC3 significantly increased the Pn of the fourth leaf by about 30% on average. A significant interaction between CO2 and LC3 was observed on the Pn of the fourth leaf.
We showed that a CO2 concentration elevated by 200 ppm in a FACE system resulted in similar yield increases for naturally grown (CK) rice in both seasons (14% in 2017 and 16% in 2018). This was comparable to the yield increase for japonica rice in a recent integrated analysis of FACE studies (12.7%) (Hu et al., 2021). However, little is known about the alterations in source-sink relations and their effects on rice yield responses to eCO2. Therefore, different leaf-cutting or spikelet removal treatments were used at the heading stage to change the original source-sink relationship of rice. The EXP1 showed that yield increases of LC1 (18%) and LC3 (25%) crops were higher than that of CK when the CO2 level was increased to 580 ppm. The more leaves were cut, the more significantly increased the yield response; however, this trend was slightly decreased under SR1/3 and SR1/2. Only the top three leaves were cut off in 2018 (EXP2), and the yield increase of LC3 crops by eCO2 was about 10% higher than that of CK (Figure 3). These results indicate that changing the source-sink relationship artificially had a relatively significant regulatory effect on the response of yield to eCO2. Reviews (Wang et al., 2015; Hu et al., 2021) have shown that the growth and yield responses of hybrid and indica rice under eCO2 are significantly higher than those of japonica rice. Therefore, whether human-induced source-sink regulation affects the yield response of indica or hybrid rice to eCO2 needs to be investigated in further studies.
A meta-analysis of FACE studies (Hu et al., 2021) has shown that the increase of rice yield under eCO2 is mainly related to the increase of PNA and FGP, whereas SNP or FGW do not change significantly. We verified these results for two seasons. The changes in IGP and EGP suggest that the response of FGP to eCO2 was mainly caused by the change of EGP. Except for removing spikelets, which significantly reduced SNP, all main factors (CO2 and SSTs) and their interactions had no significant impacts on PNA or SNP. Most likely, this was because the process of rice tillering and spikelet formation had finished before SST, indicating that the samples selected for the SST were adequately represented in this study.
The main purpose of artificial SST at the heading stage was to observe any changes in grain filling capacity, which was generally expressed by FGP and FGW. The responses of FGP of LC1 and LC3 crops in the FACE plots were more than two and three times the CK, which were comparable to the yield, whereas SR1/3 and SR1/2 crops showed only slight changes. The AGW also reflected fertilization and grain filling, the responses of which to eCO2 and SSTs were similar to that of FGP. Correlation analysis also showed that the yield response to eCO2 was significantly positively correlated with FGP and AGW, indicating that adjustment by SST to the final yield response is mainly related to the response of AGW, especially FGP. In the present study, the starting time of treatment of FACE was after seedling transplanting, while the specific effect of CO2 treatment time on the results is worthy of further study.
By separating grains into SS, MS, and IS, corresponding to spikelets located at the upper, middle, and lower parts of a panicle, respectively, we analyzed the effects of eCO2 and high-intensity leaf cutting (LC3) on the yield components in EXP2. Generally, SS responded only slightly to environmental changes, whereas MS and IS were more sensitive. This has been reported in previous studies about rice under high-temperature stress (Mohammed and Tarpley, 2010), CO2-enrichment (Hu et al., 2019), and ozone-inducement (Shao et al., 2020). Our results also indicate that eCO2 increased the yield of grains located at different positions in a panicle, following the order IS > MS > SS; this was more obvious for LC3 crops. Similarly, this order was also observed for the yield reduction by LC3 compared with CK (Figure 3). As mentioned above, different responses of yield to different conditions are mainly related to FGP and AGW. The effects of eCO2 or LC3 on these two parameters are shown as an SS less than MS or IS. Therefore, the grain-filling capacity of the middle and lower panicles has a greater plasticity. Greater plasticity in response to a changing climate, especially in resource-rich (increasing CO2) environments, can provide advantages over plants with low plasticity (Kikuchi et al., 2017). Exploiting the filling capacity of these grains under eCO2 is essential to maximize eCO2 use.
Our results suggest that eCO2 significantly increased the NSC content of the stem, which was comparable to the results of a previous FACE study by Zhu et al. (2016), indicating that the increase in atmospheric CO2 concentration significantly promotes rice growth, leading to an AGB increase (Wang et al., 2020). From the point of view of biomass accumulation and distribution, eCO2 had no significant influence on the dry weight ratio of the panicle for crops under different SSTs; therefore, the yield increase under eCO2 is mainly related to the increase of photosynthetic production capacity, whilst the distribution of photosynthetic products to panicles does not change.
The positive response of leaf net photosynthesis to eCO2 is essential for rice growth and yield increase (Cai et al., 2020). Previous studies have shown that eCO2 can increase the net photosynthesis in the short term (Drake et al., 1997). However, crops growing under eCO2 over a long period can achieve photosynthetic adaptation or down-regulation (Zhu et al., 2014). In the present study, eCO2 significantly increased flag leaf Pn of naturally growing (CK) crops at the early stage of grain filling. However, this gradually decreased over time. Obviously, the photosynthetic adaptation is not conducive to increase the rice yield potential under eCO2. There is no consensus on why this happens and how to reduce or avoid it. In our study, the Pn response of flag leaf to eCO2 of the spikelet removal crops was weakened, especially at DAT10 and DAT20, compared with that of CK. Because photosynthesis measurements were not made at the same time during the day, this may have affected the comparison of Pn between treatments. However, this effect may be small; for example, in some previous studies (Shao et al., 2014; Yuan et al., 2018), the Pn values in the morning were similar to those in the afternoon over the measuring period we selected. The mitigation of the photosynthesis level for the SR treatment under eCO2 was due to the increase in NSC in the leaves (Supplementary Figure 5 and Supplementary Table 1). Fabre et al. (2020) also pointed out that low source-sink ratio cultivars had greater gains in photosynthesis because they accumulated less NSCs in the flag leaf than high source-sink ratio cultivars. Conversely, leaf-cutting treatments (LCs) enhanced the Pn response of the remaining leaves to eCO2 (i.e., LC1 enhanced Pn of the second leaf and LC3 enhanced Pn of the fourth leaf). This phenomenon was observed throughout the whole grain-filling period. Spikelet removal resulted in a significant decrease in dry weight ratio of the panicle, which is consistent with Shimono et al. (2010). The proportion of the ‘sink’ is significantly smaller than that of the ‘source,’ increasing the ratio of source to sink. Crops with a high source-sink ratio waste the ‘source’ supply under eCO2, since part of the photosynthate cannot be transferred to the grain. Stems are sites of temporary carbon storage that can be remobilized to reproductive tissues, significantly contributing to grain filling in later developmental stages (Hirose et al., 2006). However, for crops with high SSTs (spikelet removal), the carbon may not be remobilized to compensate for a lack of photosynthesis during the grain filling phase under eCO2 (MacNeill et al., 2017; Fabre et al., 2020), potentially causing a feedback inhibition effect on the net photosynthetic rate of rice (Ding et al., 2005). Our findings suggest that the Pn of flag leaf was significantly lower than that of CK because of the removal of spikelets, especially at the beginning of the grain-filling period. Fabre et al. (2019) also indicate that the Pn of crops with pruning treatment (a total removal of the panicles) is lower than that of CK, and this phenomenon is more pronounced under eCO2. In our study, plants with low SSTs (leaf cutting) showed an increase in NSC reserves under eCO2, probably because these plants mobilized stem reserves less exhaustively under eCO2 for grain filling. Plants therefore do not rely on these reserves because of the greater level of photosynthesis. The LCs decreased the sources-sink ratio, and the grain was ‘hungry’ due to insufficient assimilate supply during grain filling. Plants will determine the priority of assimilate acquisition among various organs to achieve balanced growth and development (Lemoine et al., 2013). Therefore, assimilates may preferably be supplied to the grain, and part of the stem NSC is consumed to increase the grain supply at the same time. Crops with a low source-sink ratio can reduce the excessive accumulation of assimilation substances in the stem, which is more suitable for the continuous extraction of assimilates from ‘source’ organs to ‘sink’ organs, improving the response of Pn to eCO2. In addition, this also occurs at the later stage of grain filling, indicating that photosynthetic adaptation can be weakened or even eliminated. As we cannot really decide on the role of sugars in the present study, more research is needed on the regulation of carbohydrate accumulation and remobilization in the context of source-sink relationships.
Fabre et al. (2020), using five naturally contrasting cultivars in terms of their source-sink ratio to investigate the response of photosynthetic capacity to eCO2, found a negative correlation between source-sink ratio and the response of Pn. Therefore, compared with a high source-sink ratio, a low source-sink ratio may be more conducive to improve photosynthetic capacity and maximize the ‘fertilizer effect’ of eCO2. Similar phenomena have been observed for other C3 plants. For example, high sink-strength varieties of tobacco (Ruiz-Vera et al., 2017) and cassava (Ruiz-Vera et al., 2020) could prevent the photosynthetic down-regulation of leaves under FACE conditions. Nitrogen availability by the plant is an essential factor that can explain the variations of photosynthesis (Wang et al., 2015; Ruiz-Vera et al., 2017). It will be also important to consider this factor in future studies that we could not evaluate here. Our study not only serves as a reference for breeders (see also Dingkuhn et al., 2020), but also indicates that the source-sink ratio of rice can be appropriately adjusted by agronomic management practices against the background of increasing CO2 levels.
Artificial reduction of the source-sink ratio (such as cutting off leaves) could enhance the ‘fertilizer effect’ of CO2, whereas increasing the source-sink ratio (such as removing spikelets) had a tendency to weaken the ‘fertilizer effect.’ The former was mainly related to the increase of the responses of FGP and AGW to eCO2, and the latter decreased those responses. Removing spikelets increased the source-sink ratio and significantly increased the NSC content of the stem compared with CK, which resulted in a feedback inhibition to enhance the photosynthetic adaptation and reduce the final yield increase under eCO2. Conversely, cutting off leaves, which reduced the source-sink ratio, could match the sink strength by increasing the net photosynthesis of the remaining leaf to enhance the yield increase caused by eCO2. Our findings suggest that the source-sink ratio of a field population can be reduced by appropriate agronomic management (such as using flower fertilizer to promote spikelet differentiation to enlarge the sink capacity, the use of breeding cultivars with a lower ratio of source to sink, controlling ineffective tillers, and reducing ineffective and inefficient leaf area by water management) to achieve a higher level of source-sink balance in a CO2-rich environment, which will be more conducive to maximizing the ‘fertilizer effect’ of CO2. Since only one japonica rice variety was used in this study, further studies are needed to determine whether these findings can be extrapolated to other varieties, such as indica or hybrid rice.
The original contributions generated for this study are included in the article/Supplementary Material, further inquiries can be directed to the corresponding author.
BG: conceptualization, methodology, data curation, investigation, and writing – original draft. SH, LJ, and XN: data curation. YXW: supervision, validation, and funding acquisition. JZ: supervision and validation. YLW: supervision and writing – review and editing. LY: conceptualization, methodology, writing – review and editing, supervision, and funding acquisition. All authors contributed to the article and approved the submitted version.
This work was supported by the National Natural Science Foundation of China (Nos. 31671618, 31701352, 31571597, and 31471437) and the Priority Academic Program Development of Jiangsu Higher Education Institutions.
The authors declare that the research was conducted in the absence of any commercial or financial relationships that could be construed as a potential conflict of interest.
The Supplementary Material for this article can be found online at: https://www.frontiersin.org/articles/10.3389/fpls.2021.700159/full#supplementary-material
Ainsworth, E. A. (2008). Rice production in a changing climate: a meta-analysis of responses to elevated carbon dioxide and elevated ozone concentration. Glob. Chang. Biol. 14, 1642–1650. doi: 10.1111/j.1365-2486.2008.01594.x
Ainsworth, E. A., and Long, S. P. (2005). What have we learned from 15 years of free-air CO2 enrichment (FACE)? A meta-analytic review of the responses of photosynthesis, canopy properties and plant production to rising CO2. N. Phytol. 165, 351–372. doi: 10.1111/j.1469-8137.2004.01224.x
Ainsworth, E. A., and Long, S. P. (2021). 30 years of free-air carbon dioxide enrichment (FACE): what have we learned about future crop productivity and its potential for adaptation? Glob. Chang. Biol.27, 27–49. doi: 10.1111/gcb.15375
Alexandratos, N., and Bruinsma, J. (2012). World Agriculture Towards 2030/2050: The 2012 Revision. ESA Working Paper No. 12-03. Rome: FAO.
Cai, C., Li, G., Di, L. J., Ding, Y. J., Fu, L., Guo, X. H., et al. (2020). The acclimation of leaf photosynthesis of wheat and rice to seasonal temperature changes in T-FACE environments. Glob. Chang. Biol. 26, 539–556. doi: 10.1111/gcb.14830
Ding, Z. Y., Yang, S. M., Yuan, J. C., E, S. Z., Yu, X. P., and Yao, F. J. (2005). Effects of leaf-cutting and spikelet-thinning on net photosynthesis rate of rice during grain filling. Chin. Agric. Sci. Bull. 21, 179–182.
Dingkuhn, M., Luquet, D., Fabre, F., Muller, B., Yin, X. Y., and Paul, M. J. (2020). The case for improving crop carbon sink strength or plasticity for a CO2-rich future. Curr. Opin. Plant Biol. 56, 259–272. doi: 10.1016/j.pbi.2020.05.012
Dong, M. H., Gu, J. R., Zhang, L., Chen, P. F., Liu, T. F., Deng, J. H., et al. (2014). Comparative proteomics analysis of superior and inferior spikelets in hybrid rice during grain filling and response of inferior spikelets to drought stress using isobaric tags for relative and absolute quantification. J. Proteom. 109, 382–399. doi: 10.1016/j.jprot.2014.07.001
Drake, B. G., Gonzàlez-meler, M. A., and Long, S. P. (1997). More efficient plants: a consequence of rising atmospheric CO2. Annu. Rev. Plant Physiol. Plant Mol. Biol. 48, 609–639. doi: 10.1146/annurev.arplant.48.1.609
Fabre, D., Dingkuhn, M., Yin, X. Y., Clément-Vidal, A., Roques, S., Soutiras, A., et al. (2020). Genotypic variation in source and sink traits affects the response of photosynthesis and growth to elevated atmospheric CO2. Plant Cell Environ. 43, 579–593. doi: 10.1111/pce.13693
Fabre, D., Yin, X. Y., Dingkuhn, M., Clément-Vidal, A., Roques, S., Rouan, L., et al. (2019). Is triose phosphate utilization involved in the feedback inhibition of photosynthesis in rice under conditions of sink limitation? J. Exp. Bot. 70, 5773–5785. doi: 10.1093/jxb/erz318
Fan, X. R., Tang, Z., Tan, Y. W., Zhang, Y., Luo, B. B., Yang, M., et al. (2016). Overexpression of a pH-sensitive nitrate transporter in rice increases crop yields. Proc. Natl. Acad. Sci. U.S.A. 113, 7118–7123. doi: 10.1073/pnas.1525184113
Finkelstein, R. R. (2010). “The role of hormones during seed development and germination,” in Plant Hormones, ed. P. J. Davies (Dordrecht: Springer), 549–573.
Hirose, T., Ohdan, T., Nakamura, Y., and Terao, T. (2006). Expression profiling of genes related to starch synthesis in rice leaf sheaths during the heading period. Physiol. Plant. 128, 425–435. doi: 10.1111/j.1399-3054.2006.00758.x
Hu, S. W., Wang, Y. X., and Yang, L. X. (2021). Response of rice yield traits to elevated atmospheric CO2 concentration and its interaction with cultivar, nitrogen application rate and temperature: a meta-analysis of 20 years FACE studies. Sci. Total Environ. 764:142797. doi: 10.1016/j.scitotenv.2020.142797
Hu, S. W., Zhang, X., Jing, L. Q., Lai, S. K., Wang, Y. X., Zhu, J. G., et al. (2019). Effects of elevated CO2 concentration on grain filling capacity and quality of rice grains located at different positions on a panicle. Chin. J. Appl. Ecol. 30, 3725–3734. doi: 10.13287/j.1001-9332.201911.022
Intergovernmental Panel on Climate Change [IPCC] (2007). “Climate change 2007: the physical science basis,” in Contribution of Working Group I to the Fourth Annual Assessment Report of the Intergovernmental Panel on Climate Change, eds S. Solomon, D. Qin, M. Manning, Z. Chen, M. Marquis, K. B. Averyt, et al. (Cambridge: Cambridge University Press), 996.
Intergovernmental Panel on Climate Change [IPCC] (2013). “The physical science basis,” in Contribution of Working Group to the Fifth Annual Assessment Report of the IPCC, eds V. A. Lisa, K. A. Simon, and L. B. Nathaniel (Cambridge: Cambridge University Press), 29.
Jing, L. Q., Chen, C., Lu, Q., Wang, Y. X., Zhu, J. G., Lai, S. K., et al. (2021). How do elevated atmosphere CO2 and temperature alter the physiochemical properties of starch granules and rice taste? Sci. Total Environ. 766:142592. doi: 10.1016/j.scitotenv.2020.142592
Kikuchi, S., Bheemanahalli, R., Jagadish, K. S. V., Kumagai, E., Masuya, Y., Kuroda, E., et al. (2017). Genome-wide association mapping for phenotypic plasticity in rice. Plant Cell Environ. 40, 1565–1575. doi: 10.1111/pce.12955
Lemoine, R., Camera, S. L., Atanassova, R., Dédaldéchamp, F., Allario, T., Pourtau, N., et al. (2013). Source-to-sink transport of sugar and regulation by environmental factors. Front. Plant Sci. 4:272. doi: 10.3389/fpls.2013.00272
Long, S. P. (2012). Virtual Special Issue on food security-greater than anticipated impacts of near-term global atmospheric change on rice and wheat. Glob. Chang. Biol. 18, 1489–1490. doi: 10.1111/j.1365-2486.2012.02676.x
Long, S. P., Ainsworth, E. A., Leakey, A. D. B., Nösberger, J., and Ort, D. R. (2006). Food for thought: lower-than-expected crop yield stimulation with rising CO2 concentrations. Science 312, 1918–1921. doi: 10.1126/science.1114722
MacNeill, G. J., Mehrpouyan, S., Minow, M. A. A., Patterson, J. A., Tetlow, I. J., and Emes, M. J. (2017). Starch as a source, starch as a sink: the bifunctional role of starch in carbon allocation. J. Exp. Bot. 68, 4433–4453. doi: 10.1093/jxb/erx291
McLeod, A. R., and Long, S. P. (1999). Free-air Carbon Dioxide Enrichment (FACE) in global change research: a review. Adv. Ecol. Res. 28, 1–56. doi: 10.1016/S0065-2504(08)60028-8
Mohammed, A. R., and Tarpley, T. (2010). Effects of high night temperature and spikelet position on yield-related parameters of rice (Oryza sativa L.) plants. Eur. J. Agron. 33, 117–123. doi: 10.1016/j.eja.2009.11.006
Ruiz-Vera, U. M., Souza, A. P. D., Ament, M. R., Gleadow, R. M., and Ort, D. R. (2020). High sink strength prevents photosynthetic down-regulation in cassava grown at elevated CO2 concentration. J. Exp. Bot. 72, 542–560. doi: 10.1093/jxb/eraa459
Ruiz-Vera, U. M., Souza, A. P. D., Long, S. P., and Ort, D. R. (2017). The role of sink strength and nitrogen availability in the down-regulation of photosynthetic capacity in field-grown Nicotiana tabacum L. at elevated CO2 concentration. Front. Plant Sci. 8:998. doi: 10.3389/fpls.2017.00998
Shao, Z. S., Zhang, Y. L., Mu, H. R., Wang, Y. L., Wang, Y. X., and Yang, L. X. (2020). Ozone-induced reduction in rice yield is closely related to the response of spikelet density under ozone stress. Sci. Total Environ. 712:136560. doi: 10.1016/j.scitotenv.2020.136560
Shao, Z. S., Zhao, Y. P., Song, Q. L., Jia, Y. L., Wang, Y. X., Yang, L. X., et al. (2014). Impact of elevated atmospheric carbon dioxide and ozone concentrations on leaf photosynthesis of ‘Shanyou 63’ hybrid rice. Chin. J. EcoAgric. 22, 422–429.
Shimono, H., Suzuki, K., Aoki, K., Hasegawa, T., and Okada, M. (2010). Effect of panicle removal on photosynthetic acclimation under elevated CO2 in rice. Photosynthetica 48, 530–536. doi: 10.1007/s11099-010-0070-z
Sonnewald, U., and Fernie, A. R. (2018). Next-generation strategies for understanding and influencing source-sink relations in crop plants. Curr. Opin. Plant Biol. 43, 63–70. doi: 10.1016/j.pbi.2018.01.004
Wang, J. Y., Wang, C., Chen, N. N., Xiong, Z. Q., Wolfe, D., and Zou, J. W. (2015). Response of rice production to elevated CO2 and its interaction with rising temperature or nitrogen supply: a meta-analysis. Clim. Change 130, 529–543. doi: 10.1007/s10584-015-1374-6
Wang, W. L., Cai, C., He, J., Gu, J. F., Zhu, G. L., Zhang, W. Y., et al. (2020). Yield, dry matter distribution and photosynthetic characteristics of rice under elevated CO2 and increased temperature conditions. Field Crops Res. 248:107605. doi: 10.1016/j.fcr.2019.107605
Wang, Y. L., Yao, Y. L., Li, T. Y., and Cai, J. Z. (1995). Ripening abilities of spikelets on different position of panicle in rice (Oryza sativa L.). Acta Agronomica Sin. 21, 434–441.
Yang, J. C., Peng, S. B., Visperas, R. M., Sanico, A. L., Zhu, Q. S., and Gu, S. L. (2000). Grain filling pattern and cytokinin content in the grains and roots of rice plants. Plant Growth Regul. 30, 261–270. doi: 10.1023/A:1006356125418
Yang, L. X., Liu, H. J., Wang, Y. X., Zhu, J. G., Huang, J. Y., Liu, G., et al. (2009). Yield formation of CO2-enriched inter-subspecific hybrid rice cultivar Liangyoupeijiu under fully open-air field condition in a warm sub-tropical climate. Agric, Ecosyst. Environ. 129, 193–200. doi: 10.1016/j.agee.2008.08.016
Yoshida, S., Forno, D. A., Cock, J. H., and Gomez, K. A. (1976). Laboratory Manual for Physiological Studies of Rice, 3rd Edn. Laguna: The International Rice Research Institute, 46–49.
Yoshinaga, S., Tokida, T., Usui, Y., Sakai, H., Nakamura, H., Hasegawa, T., et al. (2020). Analysis of factors related to varietal difierences in the yield of rice (Oryza sativa L.) under Free-Air CO2 Enrichment (FACE) conditions. Plant Prod. Sci. 23, 19–27. doi: 10.1080/1343943X.2019.1683455
Yuan, M. M., Zhu, J. G., Liu, G., and Wang, W. L. (2018). Responses of diurnal variation of flag-leaf photosynthesis and photosynthetic pigment content to elevated atmospheric CO2 concentration and temperature of Japonica rice during late growth stage: a FACE study. Chin. J. Appl. Ecol. 29, 167–175.
Zhang, G. Y., Sakai, H., Tokida, T., Usui, Y., Zhu, C. W., Nakamura, H., et al. (2013). The effects of free-air CO2 enrichment (FACE) on carbon and nitrogen accumulation in grains of rice (Oryza sativa L.). J. Exp. Bot. 64, 3179–3188. doi: 10.1093/jxb/ert154
Zhang, G. Y., Sakai, H., Usui, Y., Tokida, T., Nakamura, H., Zhu, C. W., et al. (2015). Grain growth of different rice cultivars under elevated CO2 concentrations affects yield and quality. Field Crops Res. 179, 72–80. doi: 10.1016/j.fcr.2015.04.006
Zhang, J. S., Li, D. F., Xu, X., Ziska, L. H., Zhu, J. G., Liu, G., et al. (2019). The potential role of sucrose transport gene expression in the photosynthetic and yield response of rice cultivars to future CO2 concentration. Physiol. Plant. 168, 218–226. doi: 10.1111/ppl.12973
Zhao, X. Y., Zhou, N., Lai, S. K., Frei, M., Wang, Y. X., and Yang, L. X. (2019). Elevated CO2 improves lodging resistance of rice by changing physicochemical properties of the basal internodes. Sci. Total Environ. 647, 223–231. doi: 10.1016/j.scitotenv.2018.07.431
Zhu, C. W., Xu, X., Wang, D., Zhu, J. G., Liu, G., and Seneweera, S. (2016). Elevated atmospheric CO2 stimulates sugar accumulation and cellulose degradation rates of rice straw. Glob. Chang. Biol. Bioenergy 8, 579–587. doi: 10.1111/gcbb.12277
Keywords: climate change, free-air CO2 enrichment, Oryza sativa, source-sink ratio, yield, photosynthesis
Citation: Gao B, Hu S, Jing L, Niu X, Wang Y, Zhu J, Wang Y and Yang L (2021) Alterations in Source-Sink Relations Affect Rice Yield Response to Elevated CO2: A Free-Air CO2 Enrichment Study. Front. Plant Sci. 12:700159. doi: 10.3389/fpls.2021.700159
Received: 25 April 2021; Accepted: 08 June 2021;
Published: 02 July 2021.
Edited by:
Alistair McCormick, The University of Edinburgh, United KingdomCopyright © 2021 Gao, Hu, Jing, Niu, Wang, Zhu, Wang and Yang. This is an open-access article distributed under the terms of the Creative Commons Attribution License (CC BY). The use, distribution or reproduction in other forums is permitted, provided the original author(s) and the copyright owner(s) are credited and that the original publication in this journal is cited, in accordance with accepted academic practice. No use, distribution or reproduction is permitted which does not comply with these terms.
*Correspondence: Lianxin Yang, bHh5YW5nQHl6dS5lZHUuY24=
Disclaimer: All claims expressed in this article are solely those of the authors and do not necessarily represent those of their affiliated organizations, or those of the publisher, the editors and the reviewers. Any product that may be evaluated in this article or claim that may be made by its manufacturer is not guaranteed or endorsed by the publisher.
Research integrity at Frontiers
Learn more about the work of our research integrity team to safeguard the quality of each article we publish.