 Xiaohui Song
 Guozhong Zhu
 Sen Hou
 Yamei Ren
 Wangzhen Guo
94% of researchers rate our articles as excellent or good
Learn more about the work of our research integrity team to safeguard the quality of each article we publish.
Find out more
ORIGINAL RESEARCH article
Front. Plant Sci., 05 August 2021
Sec. Plant Breeding
Volume 12 - 2021 | https://doi.org/10.3389/fpls.2021.695503
Fiber length, fiber strength, and fiber micronaire are the main fiber quality parameters in cotton. Thus, mining the elite and stable loci/alleles related to fiber quality traits and elucidating the relationship between the two may accelerate genetic improvement of fiber quality in cotton. Here, genome-wide association analysis (GWAS) was performed for fiber quality parameters based on phenotypic data, and 56,010 high-quality single nucleotide polymorphisms (SNPs) using 242 upland cotton accessions under 12 field environments were obtained. Phenotypic analysis exhibited that fiber length (FL) had a positive correlation with fiber strength (FS) and had a negative correlation with fiber micronaire (Mic). Genetic analysis also indicated that FL, FS, and Mic had high heritability of more than 80%. A total of 67 stable quantitative trait loci (QTLs) were identified through GWAS analysis, including 31 for FL, 21 for FS, and 22 for Mic. Of them, three pairs homologous QTLs were detected between A and D subgenomes, and seven co-located QTLs with two fiber quality parameters were found. Compared with the reported QTLs, 34 co-located with previous studies, and 33 were newly revealed. Integrated with transcriptome analysis, we selected 256, 244, and 149 candidate genes for FL, FS, and Mic, respectively. Gene Ontology (GO) analysis showed that most of the genes located in QTLs interval of the three fiber quality traits were involved in sugar biosynthesis, sugar metabolism, microtubule, and cytoskeleton organization, which played crucial roles in fiber development. Through correlation analysis between haplotypes and phenotypes, three genes (GH_A05G1494, GH_D11G3097, and GH_A05G1082) predominately expressed in fiber development stages were indicated to be potentially responsible for FL, FS, and Mic, respectively. The GH_A05G1494 encoded a protein containing SGS-domain, which is related to tubulin-binding and ubiquitin-protein ligase binding. The GH_D11G3097 encoded 20S proteasome beta subunit G1, and was involved in the ubiquitin-dependent protein catabolic process. The GH_A05G1082 encoded RAN binding protein 1 with a molecular function of GTPase activator activity. These results provide new insights and candidate loci/genes for the improvement of fiber quality in cotton.
Cotton is cultivated in many countries globally because it provides the most important natural textile fiber (Chen et al., 2007). Cotton has four cultivated species: namely, the two diploid species Gossypium herbaceum and Gossypium arboretum, and the two tetraploid species (Gossypium hirsutum and Gossypium barbadense) (Huang et al., 2017). The upland cotton (Gossypium hirsutum), in particular, contributes to more than 95% of total cotton production (Su et al., 2019). Cotton fiber has been used in various textile specifications, with the benefits of warmth, moisture absorption, breathability, and wearing comfort. However, with the advancement of textile technology, low-quality cotton fiber has difficulty meeting the machining requirements; therefore, improving fiber quality has become an essential goal for modern cotton breeding.
The fiber quality traits, namely, fiber length (FL), fiber strength (FS), and fiber micronaire (Mic), are complex quantitative traits regulated by multiple genes (Paterson et al., 2003; Shen et al., 2007). Several quantitative trait loci (QTLs) for fiber quality traits have been identified by using bi-parental linkage mapping analysis (Said et al., 2013, 2015), which provided the candidate loci for the improvement of fiber quality traits. However, due to the low density of molecular markers, these QTLs often flanked large genetic regions and made mining key genes challenging. Based on the high-density single nucleotide polymorphisms (SNPs), genome-wide association study (GWAS) has been identified as an effective tool for discovering QTLs and genes associated with target traits in various crops such as wheat (Juliana et al., 2019), rice (Chen et al., 2014), soybean (Lu et al., 2020), and maize (Wang et al., 2020).
Several studies have been reported in cotton. A total of 46 significant SNPs and 612 unique candidate genes associated with fiber quality traits were identified through GWAS by using 719 diverse upland cotton accession in multiple environments (Sun et al., 2017). Su et al. (2020) also reported 25 stable QTLs related to five fiber quality traits [FL, FS, Mic, fiber uniformity (FU), and fiber elongation (FE), respectively] under normal and salt environments using 279 sea island cotton accessions through GWAS. Ma et al. (2018), on the other hand, found 7,383 SNPs involved significantly in fiber quality using 419 genotypes of upland cotton in 12 environments. Thus, the QTLs and candidate genes identified through GWAS exhibit significant potential in cotton breeding for fiber quality improvement.
In this study, a total of 242 upland cotton accessions grown in 12 different natural environments were used for GWAS to identify QTLs/genes for three fiber quality parameters: FL, FS, and Mic. A total of 67 stable QTLs were identified, and key genes contributing to fiber quality were analyzed. These stable QTLs/genes can be used to develop cotton varieties with higher fiber quality.
In this study, a total of 242 upland cotton accessions were used for GWAS. These accessions were collected from different regions of China and introduced from the United States. All accessions were preserved and planted by the Cotton Research Institute of Nanjing Agricultural University. All necessary permits for planting and investigating natural populations were obtained from Nanjing Agricultural University, China.
With random block design and two replicates for each accession in every environment, all the accessions were planted in 12 field environments from 2011 to 2018. The 12 environments were Xinjiang-Korla, Henan-Xinxiang, and Henan-Nanyang in 2011, 2012, and 2013, respectively, Xinjiang-Shawan in 2017, and Jiangsu-Yancheng and Anhui-Dangtu in 2018 (Supplementary Table 1). All agronomic practices were applied following the local management. In each environment, 10 plants for each accession were selected randomly at 70% boll opening, and 20 well-developed bolls with 2 bolls/plant from the middle branches were collected to measure FL (mm), FS (cN·tex−1), and Mic. The three fiber quality parameters were measured by the Center of Cotton Fiber Quality Inspection and Testing, Ministry of Agriculture and Rural Affairs.
The Best Linear Unbiased Prediction method using the “lmer” function in the lme4 package was used to estimate the breeding value of each accession (Bates et al., 2014). The broad-sense heritability (h2) of each trait was calculated using SAS software (Institute, 2013). Statistical analyses of the phenotypic data were conducted using SPSS 25.0 software. The correlation coefficient and its significance among traits based on the Best Linear Unbiased Prediction (BLUP) value were calculated using the R software “PerformanceAnalytics” package.
Young leaves were collected from 242 accessions for DNA extraction (Paterson et al., 1993), and CottonSNP80K array containing 77,774 SNPs was used for genotyping (Cai et al., 2017). Under the Illumina protocols, qualified DNA was hybridized to the CottonSNP80K array. The array was then scanned by the Illumina iScan array scanner, and the GenomeStudio Genotyping software (V2011.1, Illumina, Inc.) was used to cluster SNP alleles and genotyping. To determine the physical location of SNP on the reference genome, we mapped the probe sequences back to the TM-1 V2.1 genome (Hu et al., 2019). In total, 56,010 high-quality SNPs [calling rate ≥0.9 and minor allele frequency (MAF) ≥0.05] were obtained for subsequent analysis.
GWAS was conducted under the framework of multi-locus random-SNP-effect mixed linear model (mrMLM). The mrMLM was used in the “mrMLM” package of R software, including six association methods: mrMLM (Wang et al., 2016), FASTmrMLM (fast multi-locus random-SNP-effect mixed linear model) (Tamba and Zhang, 2018), FASTmrEMMA (fast multi-locus random-SNP-effect efficient mixed model association) (Wen et al., 2017), pLARmEB (polygenic-background-control-based least angle regression plus empirical Bayes) (Zhang et al., 2017), pKWmEB (polygenic-background-control-based Kruskal-Wallis test with empirical Bayes) (Ren et al., 2018), and ISIS EM-BLASSO (iterative modified-sure independence screening Expectation-Maximization-Bayesian least absolute shrinkage and selection operator) (Tamba et al., 2017). For the critical LOD (log of odds) scores of all methods, all the QTNs with their LOD scores ≥3.0 were regarded as significant QTNs. The Q+K model was also adopted for GWAS analysis. According to our previous study (Zhu et al., 2019), the K value is 3, and the population structure was calculated using admixture 1.3.0 software. The population relationship K matrix was calculated using the “mrMLM” package.
Due to the uneven distribution of the genotyped SNPs, we selected the lowest LD (linkage disequilibrium) of the chromosome, ~200 kb, on both sides of the physical position of quantitative trait nucleotides (QTN) as the initial QTL (Su et al., 2020). The overlapping QTL was then merged the as the same QTL. When the merged QTL contained or overlapped with the previously reported QTL identified with marker location, we regarded them as the co-located QTL. According to the physical location of the QTL, candidate genes were searched from the reference genome (Hu et al., 2019). To further determine the relationship between genes and fiber quality traits, we downloaded the transcriptome profiles of TM-1 tissues from National Center of Biotechnology Information (NCBI) Sequence Read Archive collection PRJNA490626. The reads were mapped to the TM-1 reference genome using the mapping software Hisat2 with default parameters (Pertea et al., 2016). The number of reads for each gene was then counted using HTSeq-Count (Anders et al., 2015), followed by calculation of the Transcripts Per Million (TPM) value of each tissue. The sampling tissues included fibers and ovules at −3, 0, 1, 3, and 5 days, and fibers at 10, 15, 20, and 25 DPA (day post anthesis). When TPM of a gene was >3, it was considered to be expressed during fiber development. We further selected the genes with the higher expression in these tissues rather than other vegetative tissues, and Gene Ontology (GO) analysis was performed online (http://www.omicshare.com/tools) to investigate the function of the candidate genes.
Fiber quality parameters exhibited significant variation among 242 accessions evaluated in 12 different environments. The phenotypic values of FL, FS, and Mic ranged from 23.41 to 34.30 mm, 21.41 to 41.30 cN·tex−1, 2.38 to 6.72, respectively (Table 1). Coefficients of variation (CV) were the largest for Mic (7.09–12.81%), followed by FS (4.90–8.56%), and lowest for FL (3.70–4.80%). The breeding value (marked as BLUP) was applied to eliminate interference of environmental factors on phenotypic value. The BLUP showed that FL, FS, and Mic ranged from 26.19 to 31.31 mm, 25.76 to 32.47 cN·tex−1, and 3.80 to 5.56, respectively (Figure 1 and Table 1). The h2 of FL was 89.55%, FS was 80.95%, and Mic was 84.82%, respectively (Table 1). Correlation analysis revealed that the same trait from different environments had a high correlation (Supplementary Figures 1–3). Based on the BLUP, FL exhibited a high positive correlation with FS and a negative correlation with Mic (Figure 1).
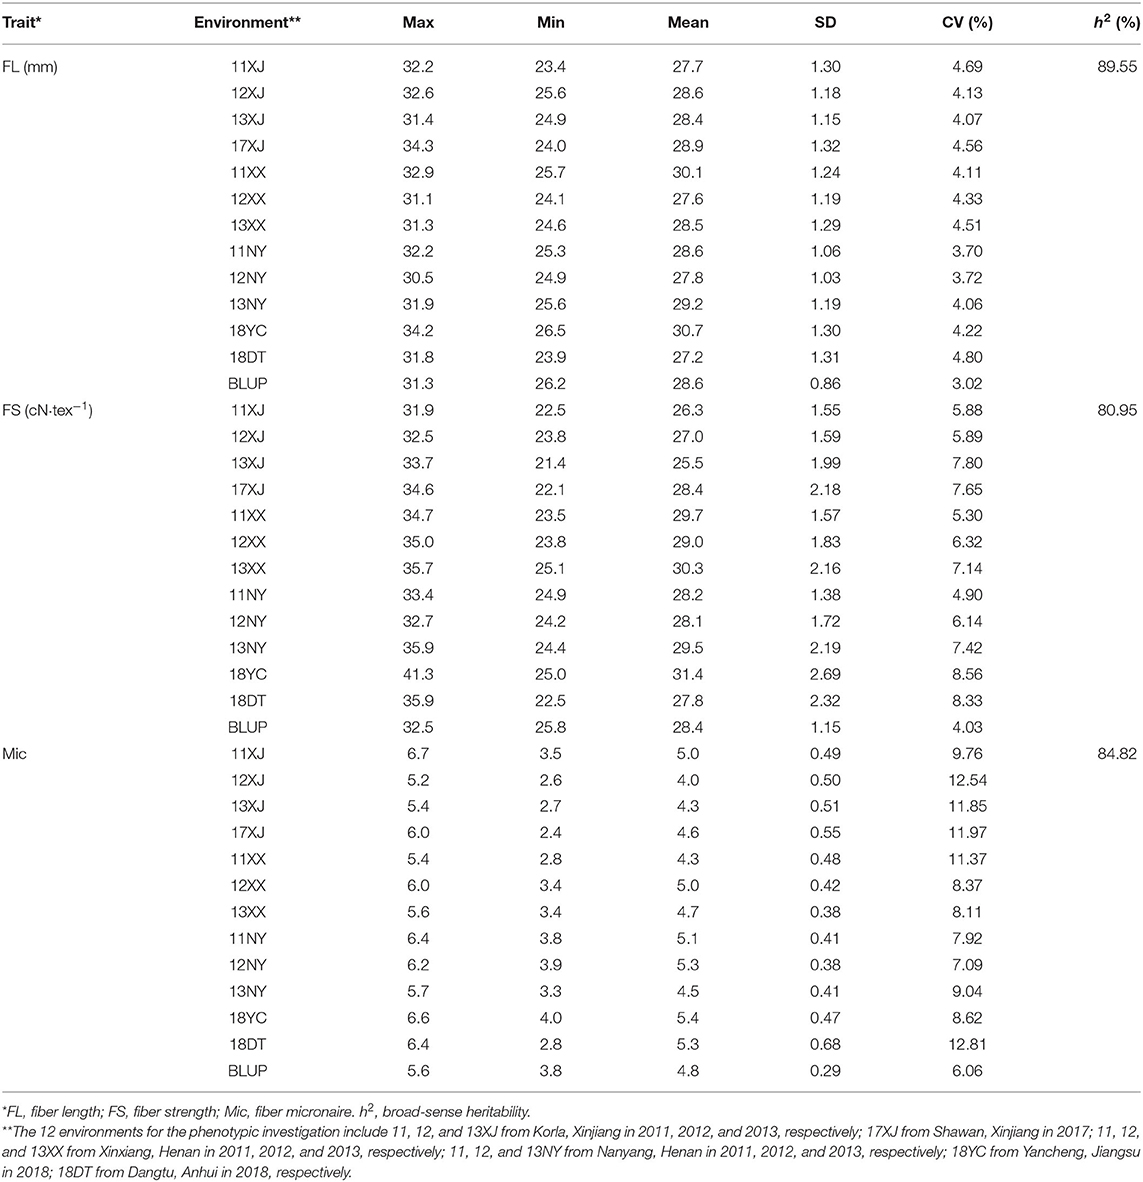
Table 1. Phenotypic variation for three fiber quality traits in multiple field environments and their heritability.
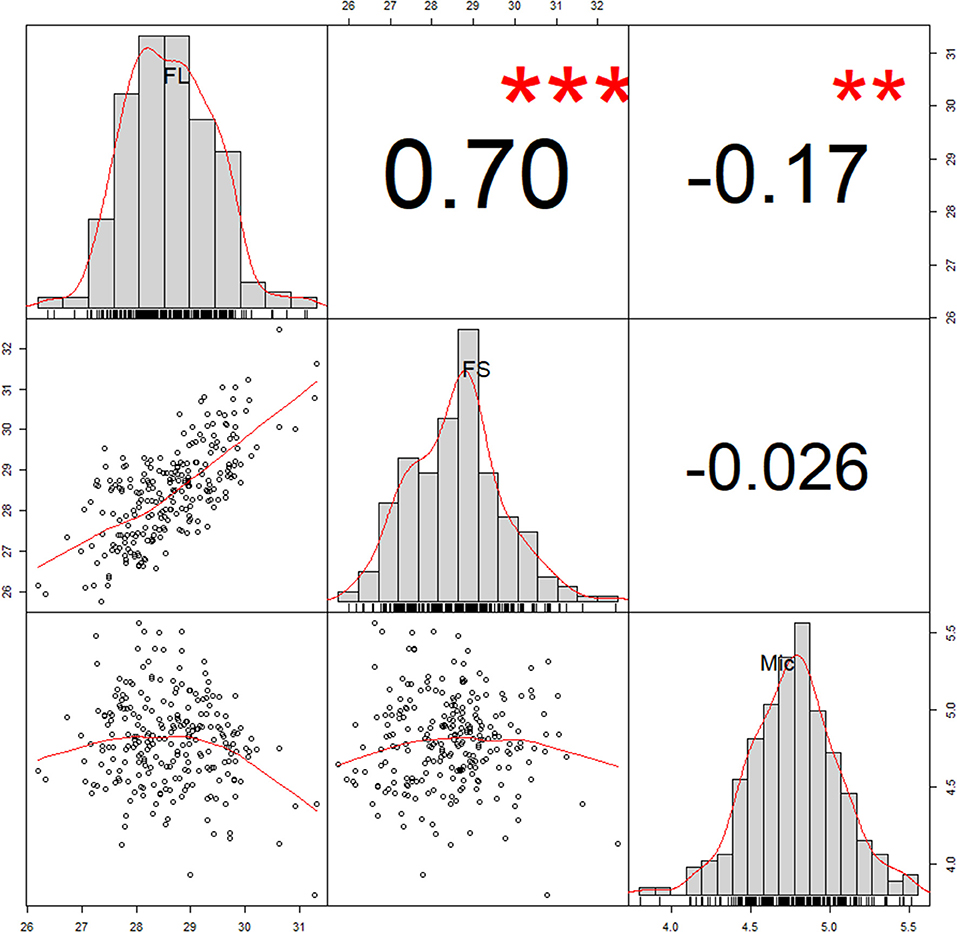
Figure 1. Correlation analysis of three fiber quality traits. The number in these boxes indicated correlation coefficient (R value). The correlation coefficient and the significance between traits were conducted using Best Linear Unbiased Prediction (BLUP) values. **P < 0.01, ***P < 0.001. FL, fiber length; FS, fiber strength; Mic, fiber micronaire.
We used the CottonSNP80K array to genotype 242 upland cotton accessions and obtained 56,010 high-quality SNPs (Supplementary Table 2), of which 30,933 were located on At subgenome and 25,077 were located on Dt subgenome, with wide distribution on chromosomes (Supplementary Figure 4). A04 and D04 showed the lowest SNP density, while A08 showed the highest SNP density. The polymorphism information content (PIC) values ranged from 0.222 and 0.308 among chromosomes, and the mean PIC of the At and Dt subgenomes were 0.278 and 0.274, respectively (Supplementary Table 2).
Using multi-locus mixed linear model, a total of 387 QTNs were identified for FL, FS, and Mic. By merging QTN with flanking 200 kb interval as the same QTL, a total of 273 QTLs were obtained (Supplementary Table 3). To reduce false positives, we considered the QTL associated with two or more environments as stable QTL. As a result, 67 stable QTLs were identified, including 31 of FL, 21 of FS, and 22 of Mic, respectively, with 7 QTLs detected simultaneously to be associated with 2 of the 3 traits (Figure 2, Table 2, and Supplementary Table 4). Of them, 34 QTLs co-located with previous studies and 33 QTLs were newly revealed in this study (Table 2). In addition, 17 co-located QTLs were reported to be associated with more than 2 traits in previous studies. For example, qtl15 was related to Mic in this study, but it was also reported to be simultaneously associated with FL, FS, FU, and Mic (Nie et al., 2020). Of seven QTLs detected simultaneously to be associated with two traits, five QTLs were associated simultaneously with FL and FS, one for FL and Mic, and one for FS and Mic, respectively (Supplementary Figure 5). Furthermore, three pairs homologous QTLs, namely, qtl6/qtl45, qtl20/qtl52, and qtl21/qtl55, were detected between A and D subgenomes. These results showed the high genetic stability, significant correlation, and common selection of subgenomes in partial chromosome segments among the three fiber quality traits in the process of breeding.
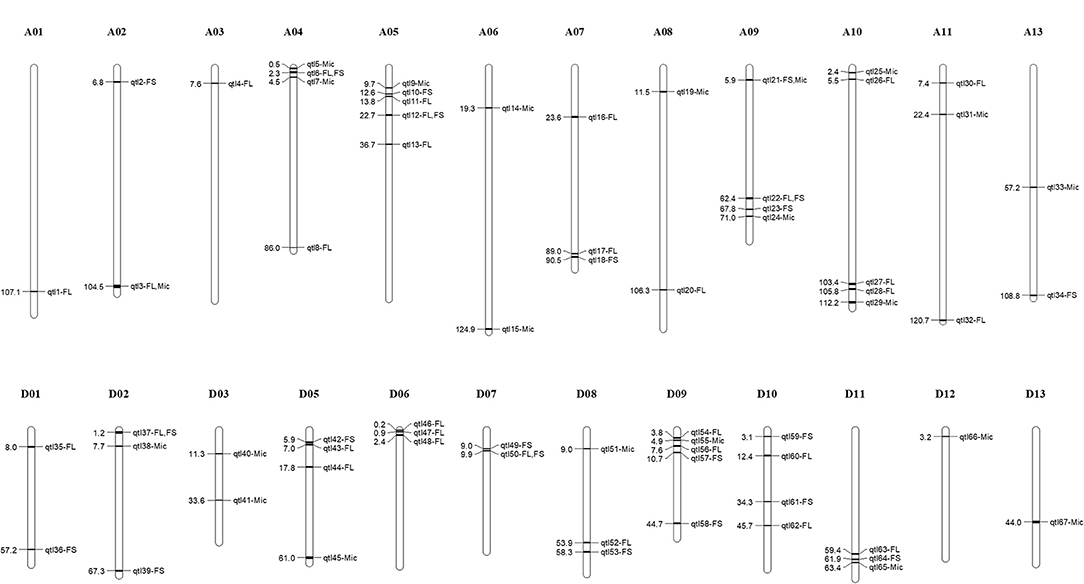
Figure 2. Chromosome distribution of stable quantitative trait loci (QTLs) associated with three fiber quality traits. The numbers on the left of chromosome indicates physical location of the corresponding QTLs. FL, fiber length; FS, fiber strength; Mic, fiber micronaire.
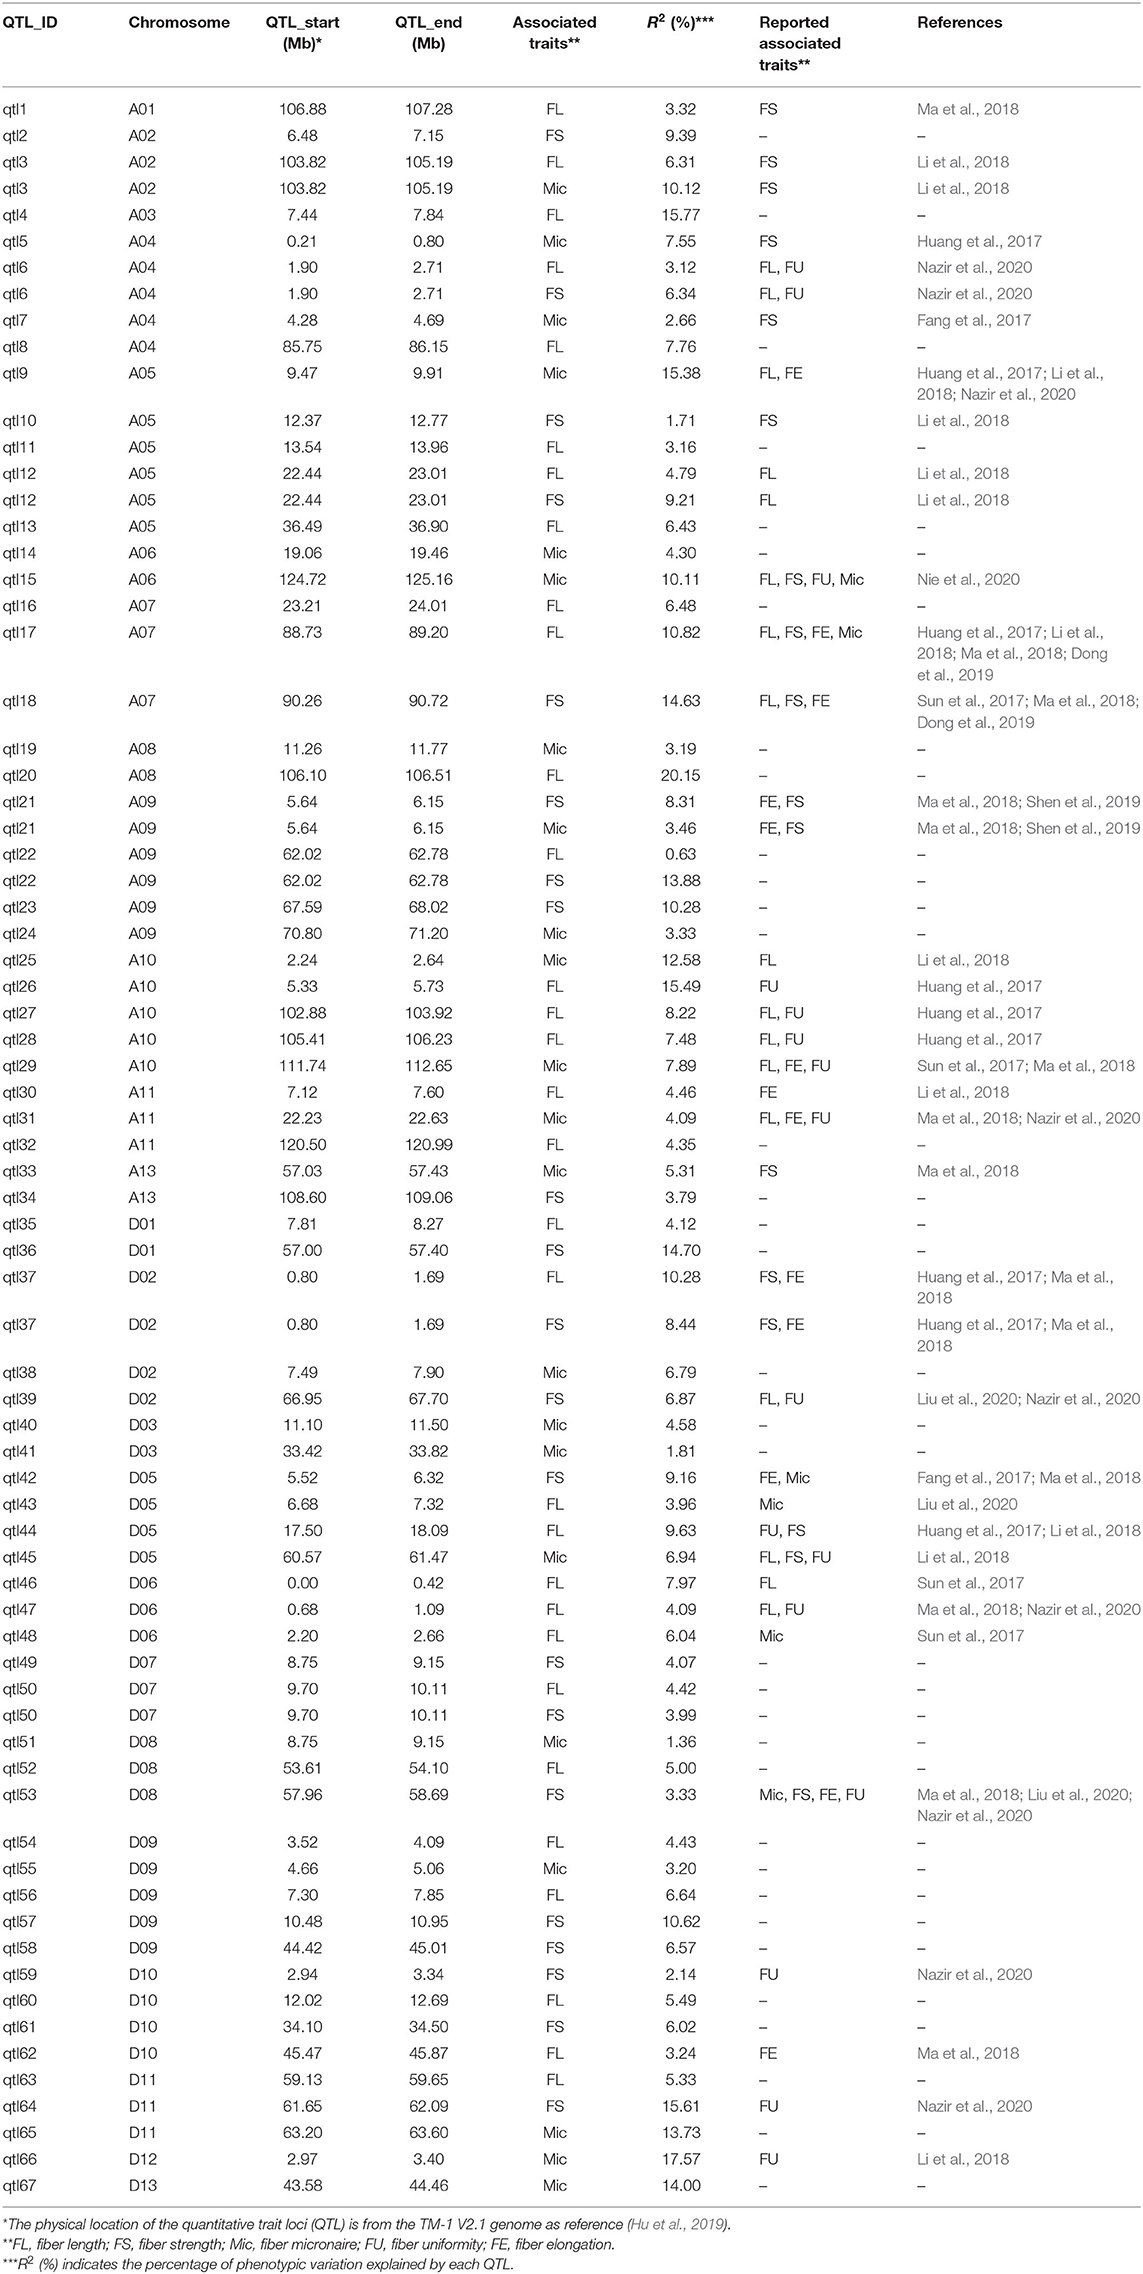
Table 2. Stable QTLs and co-located QTLs identified for fiber length, fiber strength, and fiber micronaire.
The candidate genes in the QTL intervals were extracted, and their expression patterns during the fiber development were analyzed based on the released G. hirsutum TM-1 genome (Hu et al., 2019). As a result, 649 candidate genes were identified, with 256 of FL, 244 of FS, and 149 of Mic (Supplementary Table 5). GO analysis was then conducted to explore the biological functions of the candidate genes (Figure 3 and Supplementary Table 6). For FL, the enriched processes contained regulation of pollen tube growth, gluconeogenesis, and UDP-L-arabinose metabolic process. For FS, the candidate genes were involved in kinase activity and flowering related process, including regulation of hydrolase activity, regulation of GTPase activity, and long-day photoperiodism. GO terms related to microtubule and cytoskeleton organization were also enriched in FL and FS, respectively. For Mic, the genes were mainly enriched in glycol-metabolism related processes, such as gluconeogenesis, carbohydrate derivative biosynthetic process, hexose biosynthetic process, and monosaccharide biosynthetic process. Besides, other processes closely related to fiber development were also enriched, such as the long-chain fatty acid biosynthetic process, thiamine biosynthetic process, and thylakoid membrane organization.
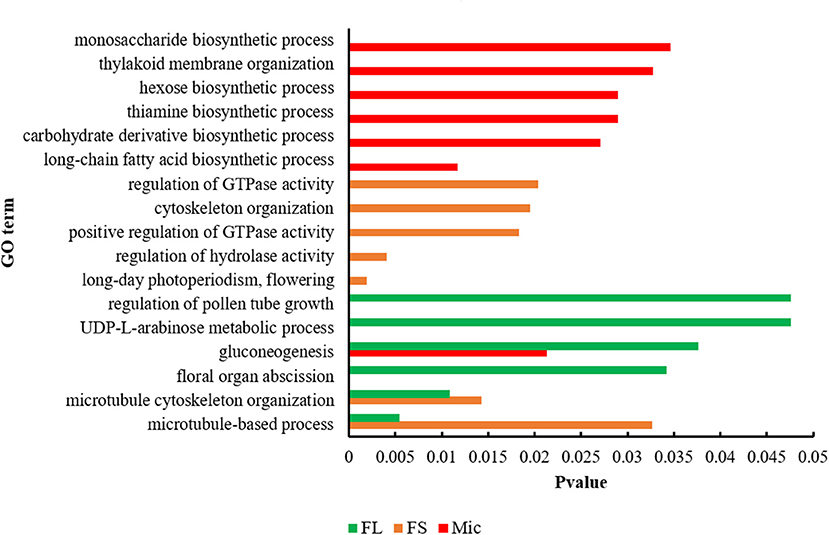
Figure 3. Function characterization of candidate genes associated with three fiber quality traits by Gene Ontology (GO) analysis. FL, fiber length; FS, fiber strength; Mic, fiber micronaire.
Of the stable QTLs, a QTL hotspot (D06: 0–1.09 Mb) which contained two QTLs, namely, qtl46 and qtl47, both associated with FL, were found (Figure 2 and Table 2). This QTL hotspot had also been reported to be related to FL in previous studies (Sun et al., 2017; Ma et al., 2018). In the QTL hotspot region, 24 candidate genes were identified, and most of them were involved in fiber development, such as GH_D06G0024 encoded gibberellin-regulated family protein and GH_D06G0025 encoded SNARE-like superfamily protein (Supplementary Table 5). We further focused on QTLs associated with multiple traits (Figure 2, Supplementary Figure 5, and Table 2). Three genes (GH_A05G2302, GH_A05G2316, and GH_A08G0793) that expressed highly from 10 to 25 DPA during fiber development were found in QTLs associated with both FL and FS (Supplementary Table 5). The GH_A05G2302 encoded NAD(P)-binding Rossmann-fold superfamily protein involved in sphingolipid biosynthetic process (Chao et al., 2011). The GH_A05G2316 encoded Glycosyl hydrolase superfamily protein, and was related to the carbohydrate metabolic process (Nibbering et al., 2020). The GH_A08G0793 encoded C2H2-type zinc finger family protein, which also plays a crucial role in fiber development (Salih et al., 2019).
We also found three genes with different haplotypes to be significantly related to the corresponding fiber quality trait. The qtl11 (A05: 13.54–13.96 Mb) on chromosome A05 was associated with FL, and seven candidate genes were detected in the interval (Figure 4A and Table 2). Of the genes, the GH_A05G1494 encoded an SGS domain-containing protein with high expression at 3DPA, 5 DPA, and 10DPA during fiber development (Figure 4B), which was related to tubulin-binding and ubiquitin-protein ligase binding. A QTN (TM10597) in UTR of GH_A05G1494 was then used to investigate the correlation between the two haplotypes and FL phenotype. The FL values with an A genotype were significantly higher than that with a C genotype (Figure 4C), implying its vital role in improving FL. The qtl64 (D11: 61.65–62.09 Mb) on chromosome D11 was associated with FS and 14 candidate genes were detected (Figure 5A, Supplementary Figure 6, and Table 2). The GH_D11G3097 (named as PBG1) encoded 20S proteasome beta subunit G1, and was related to the ubiquitin-dependent protein catabolic process. Via tissue and organ transcriptome profiling, PBG1 was highly expressed at 3 DPA, 5 DPA, 15 DPA, and 25 DPA of fiber development (Figure 5B). We also found that a QTN (TM77015) in GH_D11G3097 exon produced two different haplotypes. The FS values with a C genotype were significantly higher than that with an A genotype (Figure 5C), indicating its potential functions in increasing FS. For Mic, the GH_A05G1082 (named as RANBP1) from qtl9 (A05: 9.47–9.91 Mb) on chromosome A05 was identified (Figure 6A, Supplementary Figure 7, and Table 2). RANBP1 encoded RAN binding protein 1 with a molecular function of GTPase activator activity, which was highly expressed at 3 DPA to 5 DPA and 10 DPA to 25 DPA of fiber development, respectively (Figure 6B). By analyzing the QTN TM10467 located in the gene region, the Mic value with a G genotype was found to be significantly finer than that with an A genotype (Figure 6C).
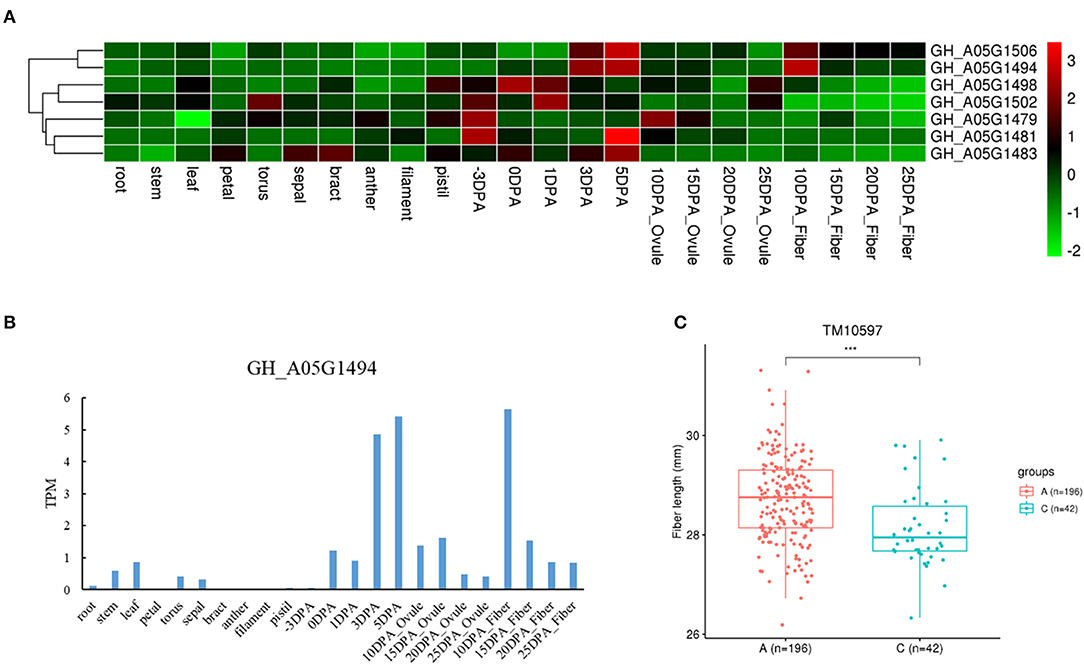
Figure 4. Quantitative trait loci (QTLs) and candidate genes located on qtl11 on chromosome A05. (A) Expression heatmap of candidate genes in the qtl11. (B) The expression patterns of the GH_A05G1494 in different tissues. (C) Boxplots for the phenotypic values of quantitative trait nucleotide (QTN) in UTR region of the GH_A05G1494. ***P < 0.001.
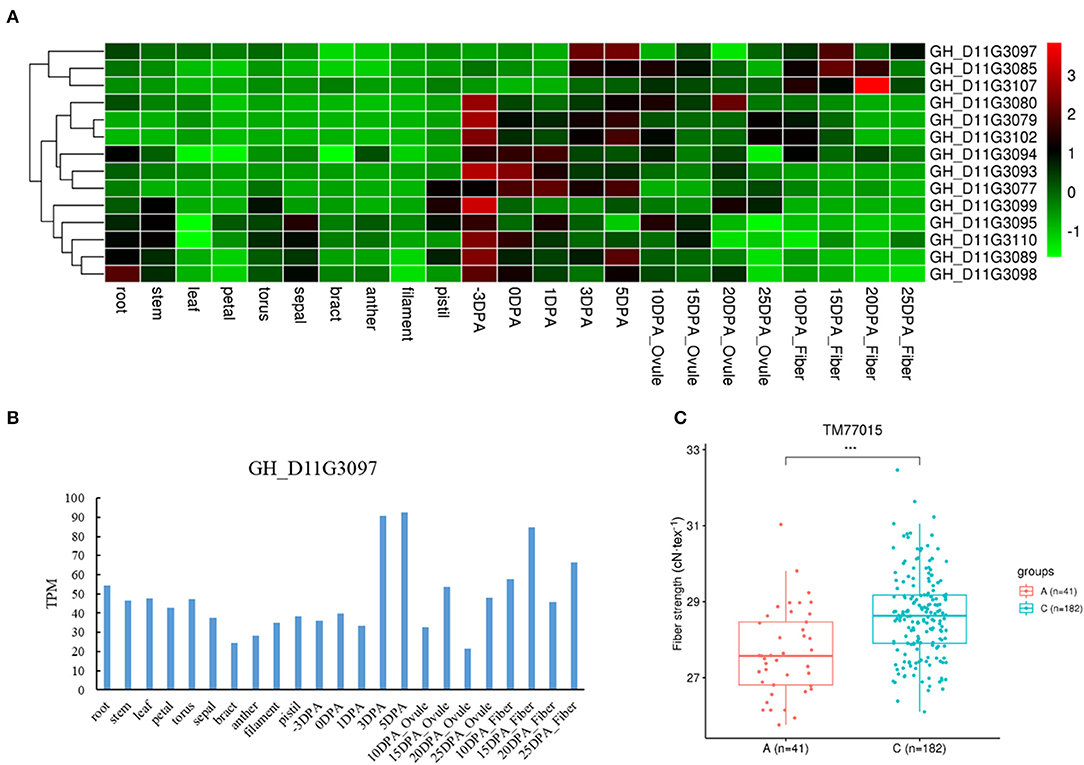
Figure 5. Quantitative trait loci (QTLs) and candidate genes located on qtl64 on chromosome D11. (A) Expression heatmap of candidate genes in the qtl64. (B) The expression patterns of the GH_D11G3097 in different tissues. (C) Boxplots for the phenotypic values of quantitative trait nucleotide (QTN) in exon of the GH_D11G3097. ***P < 0.001.
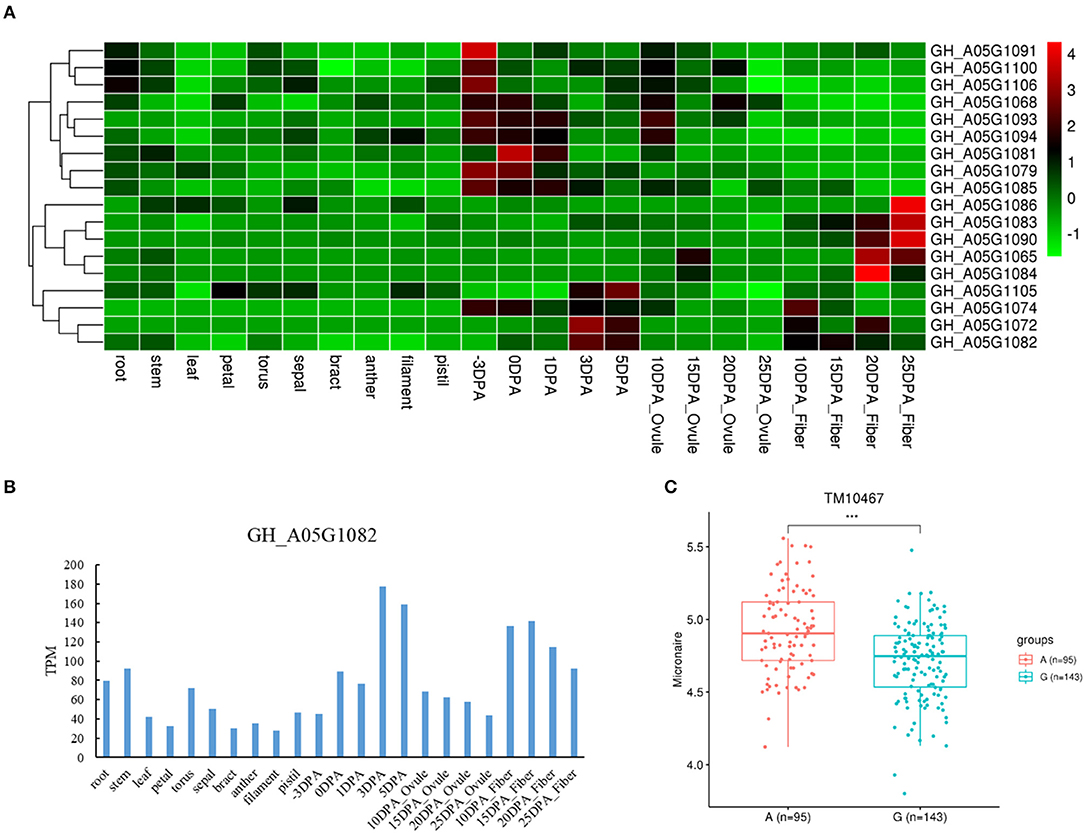
Figure 6. Quantitative trait loci (QTLs) and candidate genes located on qtl9 on chromosome A05. (A) Expression heatmap of candidate genes in the qtl9. (B) The expression patterns of the GH_A05G1082 in different tissues. (C) Boxplots for the phenotypic values of quantitative trait nucleotide (QTN) in exon of the GH_A05G1082. ***P < 0.001.
The need for elite cultivars with higher fiber quality has further increased with machine-picking of cotton and textile technology improvement. FL, FS, and Mic are critical fiber traits to evaluate cotton fiber quality. Thus, QTLs and candidate genes related to fiber quality traits may accelerate cotton genetic improvement. With the development of high-density cotton array (Hulse-Kemp et al., 2015; Cai et al., 2017) and genomic re-sequencing analysis, numerous QTLs and genes associated with fiber quality traits were identified (Sun et al., 2017; Ma et al., 2018; Su et al., 2020). However, due to the complex nature of quantitative traits, the stability and validity these QTLs still need to be further verified across multiple environments. Exploring the stable loci and candidate genes involved in fiber quality traits by integrating multiple field environments phenotype data will promote fiber quality, breeding accuracy, and efficiency.
In the current study, we observed large phenotypic variations for FL, FS, and Mic in natural populations of 242 genotypes for multiple years. Compared to yield and components (Su et al., 2016; Nie et al., 2020), fiber quality traits had a higher heritability of more than 80%, consistent with previous reports (Zhang et al., 2019; Liu et al., 2020). Correlation analysis showed that each trait had high correlations in different environments, indicating the genetic stability of fiber quality traits. Furthermore, FL was correlated positively with FS and correlated negatively with Mic, which was also consistent with previous studies (Sun et al., 2017; Ma et al., 2018). These results indicate that fiber quality traits are more suitable for genetic improvement by molecular breeding.
By combining phenotype data from multiple environments with genotypic data, stable QTLs and candidate genes for fiber quality may be revealed through GWAS analysis. In contrast to traditional QTL mapping, GWAS analysis can simultaneously locate multiple traits with greater precision. GWAS has been widely applied in other crops, such as wheat (Juliana et al., 2019), rice (Chen et al., 2014), soybean (Lu et al., 2020), and maize (Wang et al., 2020). In cotton, a large number of associated loci for fiber quality have also been reported via GWAS analysis (Zhang et al., 2019; Liu et al., 2020). Nevertheless, multi-year and -environment phenotype investigation is more effective to mine stable QTLs and genes related to fiber quality due to the complex genetic nature of quantitative traits. In the current study, 67 stable QTLs were identified with 33 novel and 34 co-located with previously reported QTLs. The function analysis of 649 candidate genes identified in the stable QTL intervals indicated that numerous enriched processes were closely related to fiber development, including sugar biosynthesis, sugar metabolism, microtubule, and cytoskeleton organization (Whittaker and Triplett, 1999; Li et al., 2002; Zhang et al., 2015). Several co-located QTLs, such as qtl9, qtl17, and qtl18, were also found in previous reports, indicating stable and effective contribution to fiber development. In qtl9 region, the GH_A05G1083 encoded a Kinase interacting (KIP1-like) family protein. It has been reported that KIP-related protein could regulate cell elongation by affecting the expression of genes involved in plant cell wall organization (Jégu et al., 2013; Li et al., 2020). Furthermore, the GH_A07G2172 from qtl17, encoded a heat shock protein 89 (HSP89). In cotton, HSP inhibition can disturb the H2O2 balance and lead to the generation of oxidative stress, which suppresses cotton fiber development (Sable et al., 2018). The qtl20 which explained high phenotypic variation (20.15%) for FL was also identified as a novel QTL in this study. Interestingly, only one gene with the unknown function was found in qtl20 interval. The candidate gene and the related mechanism in this QTL interval is worth further studying for fiber quality improvement.
Identifying key genes involved in fiber quality will accelerate the process of fiber quality breeding in cotton. The GH_A05G1494 located in qtl11 encoded an SGS domain-containing protein, and highly expressed at 3 DPA, 5 DPA, and 10 DPA during fiber development. Function analysis showed that GH_A05G1494 was involved in tubulin-binding and ubiquitin-protein ligase binding. The tubulin plays a vital role in cotton cell elongation and cellulose biosynthesis (Whittaker and Triplett, 1999; Li et al., 2002), and protein ubiquitination also plays key roles in plant developmental and plant-environment interactions (Shu and Yang, 2017). Furthermore, the GH_A05G1082 identified in qtl9 encoded RAN binding protein 1 with GTPase activator activity (Lee et al., 2007), and was also predominantly expressed from 3 DPA to 25 DPA during fiber development, consistent with the previous study (Trainin et al., 1996; Kim and Triplett, 2004). GTPase is widely reported as an essential regulator of cotton fiber elongation, such as GhRac1 (Kim and Triplett, 2004) and GhGRAM (Ye et al., 2021). In addition, two candidate genes were identified in a QTL hotspot (qtl46 and qlt47). The two genes were also highly expressed during fiber development. The GH_D06G0024 encoded gibberellin-regulated family protein, and gibberellin had an important role in cotton fiber development (Ma et al., 2018). The GH_D06G0025 was related to vesicle-mediated transport, and vesicles were involved in the transport of growth substances in fiber and promoted the elongation of fiber cells (Yu et al., 2019). The candidate genes identified in the current study might contribute to cotton fiber quality improvement through speed breeding with accuracy and efficiency.
In this study, a set of natural populations comprising 242 upland cotton accessions showed large phenotypic variation for FL, FS, and Mic value. The h2 of the three traits further indicated the potential of genetic improvement for cotton fiber quality through molecular breeding. Combined with multi-year and -environment phenotypic data, we identified 67 stable QTLs related to the 3 fiber quality traits, with 33 novel and 34 co-located with previous reported QTLs. The function analysis of candidate genes in the stable QTL regions exhibited that numerous enriched processes were closely related to fiber development, including sugar biosynthesis, sugar metabolism, microtubule, and cytoskeleton organization. Integrated with transcriptome analysis, several fiber predominantly expressed genes were indicated to have potential for fiber quality improvement in cotton, such as GH_A05G1494 and GH_A05G1082.
The datasets presented in this study can be found in online repositories. The names of the repository/repositories and accession number(s) can be found in the article/Supplementary Material.
Experiments were designed by WG. Experiments were performed by XS, GZ, SH, YR, and WL. XS and GZ drafted the manuscript, and WG and MA revised the manuscript. All authors read and approved the final manuscript.
This program was financially supported in part by the National Key R & D Program for Crop Breeding (2018YFD0100400), the Fundamental Research Funds for the Central Universities (KYZZ201904 and KYYJ202007), and Jiangsu Collaborative Innovation Center for Modern Crop Production project (No. 10). The funders were not involved in the experimental design of the study, data collection, analysis and interpretation, and writing of the manuscript.
The authors declare that the research was conducted in the absence of any commercial or financial relationships that could be construed as a potential conflict of interest.
All claims expressed in this article are solely those of the authors and do not necessarily represent those of their affiliated organizations, or those of the publisher, the editors and the reviewers. Any product that may be evaluated in this article, or claim that may be made by its manufacturer, is not guaranteed or endorsed by the publisher.
We thank the members and collaborators of Cotton Germplasm Enhancement and Application Engineering Research Center (Ministry of Education) in Nanjing Agricultural University for continuous phenotypic investigation of the set of natural population for years and environments. Many thanks to the high-performance computing platform of Bioinformatics Center in Nanjing Agricultural University for providing data analysis facilities, and the National Medium-term Gene Bank of Cotton in China for providing some landraces seeds.
The Supplementary Material for this article can be found online at: https://www.frontiersin.org/articles/10.3389/fpls.2021.695503/full#supplementary-material
Supplementary Table 1. Information of 242 upland cotton accessions used in this study.
Supplementary Table 2. Information of high-quality SNPs genotyped by CottonSNP80K array.
Supplementary Table 3. QTNs and QTLs of fiber length (FL), fiber strength (FS), and fiber micronaire (Mic) detected by multi-loci MLM model.
Supplementary Table 4. The information of QTL and QTNs in the QTL interval.
Supplementary Table 5. Expression profile of candidate genes related to fiber length (FL), fiber strength (FS), and fiber micronaire (Mic).
Supplementary Table 6. GO analysis of genes in candidate QTL intervals related to fiber length (FL), fiber strength (FS), and fiber micronaire (Mic).
Supplementary Figure 1. Correlation analysis of fiber length from different environments. The number in these boxes indicated correlation coefficient (R value). ***indicated P value at the 0.001 levels.
Supplementary Figure 2. Correlation analysis of fiber strength from different environments. The number in these boxes indicated correlation coefficient (R value). *indicated P value at the.05 levels, **indicated P value at the 0.01 levels, ***indicated P value at the 0.001 levels.
Supplementary Figure 3. Correlation analysis of fiber micronaire from different environments. The number in these boxes indicated correlation coefficient (R value). *indicated P value at the 0.05 levels, **indicated P value at the 0.01 levels, ***indicated P value at the 0.001 levels.
Supplementary Figure 4. Density distribution map of 56010 high-quality SNPs in 26 chromosomes.
Supplementary Figure 5. Venn diagram of QTLs associated with fiber length (FL), fiber strength (FS), and fiber micronaire (Mic).
Supplementary Figure 6. Manhattan plot of FL on Chr. D11. Black dashed line represents the significance threshold (LOD score = 3). Pink dot indicates the position of TM77015.
Supplementary Figure 7. Manhattan plot of Mic on Chr. A05. Black dashed line represents the significance threshold (LOD score = 3). Pink dot indicates the position of TM10467.
BLUP, The best linear unbiased prediction; FL, Fiber length; FS, Fiber strength; Mic, Fiber micronaire; GO, Gene ontology; GWAS, Genome-wide association studies; MAF, Minor allele frequency; QTLs, Quantitative trait loci; QTNs, quantitative trait nucleotides; SNP, Single nucleotide polymorphism.
Anders, S., Pyl, P. T., and Huber, W. (2015). HTSeq–a Python framework to work with high-throughput sequencing data. Bioinformatics 31, 166–169. doi: 10.1093/bioinformatics/btu638
Bates, D., Mächler, M. B, and Walker, S. (2014). Fitting linear mixed-effects models using lme4. Stat. Comput. 1406, 133–199. doi: 10.18637/jss.v067.i01
Cai, C. P., Zhu, G. Z., Zhang, T. Z., and Guo, W. Z. (2017). High-density 80 K SNP array is a powerful tool for genotyping G. hirsutum accessions and genome analysis. BMC Genomics 18:654. doi: 10.1186/s12864-017-4062-2
Chao, D. Y., Gable, K., Chen, M., Baxter, I., Dietrich, C. R., Cahoon, E. B., et al. (2011). Sphingolipids in the root play an important role in regulating the leaf ionome in Arabidopsis thaliana. Plant Cell 23, 1061–1081. doi: 10.1105/tpc.110.079095
Chen, W., Gao, Y. Q., Xie, W. B., Gong, L., Lu, K., Wang, W. S., et al. (2014). Genome-wide association analyses provide genetic and biochemical insights into natural variation in rice metabolism. Nat. Genet. 46, 714–721. doi: 10.1038/ng.3007
Chen, Z. J., Scheffler, B. E., Dennis, E., Triplett, B. A., Zhang, T., Guo, W., et al. (2007). Toward sequencing cotton (Gossypium) genomes. Plant Physiol. 145, 1303–1310. doi: 10.1104/pp.107.107672
Dong, C., Wang, J., Yu, Y., Ju, L., Zhou, X., Ma, X., et al. (2019). Identifying functional genes influencing Gossypium hirsutum fiber quality. Front. Plant Sci. 9:1968. doi: 10.3389/fpls.2018.01968
Fang, L., Wang, Q., Hu, Y., Jia, Y., Chen, J., Liu, B., et al. (2017). Genomic analyses in cotton identify signatures of selection and loci associated with fiber quality and yield traits. Nat. Genet. 49, 1089–1098. doi: 10.1038/ng.3887
Hu, Y., Chen, J. D., Fang, L., Zhang, Z. Y., Ma, W., Niu, Y. C., et al. (2019). Gossypium barbadense and Gossypium hirsutum genomes provide insights into the origin and evolution of allotetraploid cotton. Nat. Genet. 51, 739–748. doi: 10.1038/s41588-019-0371-5
Huang, C., Nie, X. H., Shen, C., You, C. Y., Li, W., Zhao, W. X., et al. (2017). Population structure and genetic basis of the agronomic traits of upland cotton in China revealed by a genome-wide association study using high-density SNPs. Plant Biotechnol. J. 15, 1374–1386. doi: 10.1111/pbi.12722
Hulse-Kemp, A. M., Lemm, J., Plieske, J., Ashrafi, H., Buyyarapu, R., Fang, D. D., et al. (2015). Development of a 63K SNP array for cotton and high-density mapping of intraspecific and interspecific populations of Gossypium spp. G3 5, 1187–1209. doi: 10.1534/g3.115.018416
Institute, S. (2013). Base SAS 9.4 Procedures Guide: Statistical Procedures. Cary, NC: SAS Institute Inc.
Jégu, T., Latrasse, D., Delarue, M., Mazubert, C., Bourge, M., Hudik, E., et al. (2013). Multiple functions of Kip-related protein5 connect endoreduplication and cell elongation. Plant Physiol. 161, 1694–1705. doi: 10.1104/pp.112.212357
Juliana, P., Poland, J., Huerta-Espino, J., Shrestha, S., Crossa, J., Crespo-Herrera, L., et al. (2019). Improving grain yield, stress resilience and quality of bread wheat using large-scale genomics. Nat. Genet. 51, 1530–1539. doi: 10.1038/s41588-019-0496-6
Kim, H. J., and Triplett, B. A. (2004). Characterization of GhRac1 GTPase expressed in developing cotton (Gossypium hirsutum L.) fibers. Biochim. Biophys. Acta 1679, 214–221. doi: 10.1016/j.bbaexp.2004.06.008
Lee, Y., Roux, S. J., and Kim, S. H. (2007). Biochemical characterization of a family of proteins that stabilizes a plant Ran protein in its GTP-bound conformation. Plant Physiol Biochem. 45, 515–520. doi: 10.1016/j.plaphy.2007.03.003
Li, C., Fu, Y., Sun, R., Wang, Y., and Wang, Q. (2018). Single-locus and multi-locus genome-wide association studies in the genetic dissection of fiber quality traits in upland cotton (Gossypium hirsutum L.). Front. Plant Sci. 9:1083. doi: 10.3389/fpls.2018.01083
Li, X. B., Cai, L., Cheng, N. H., and Liu, J. W. (2002). Molecular characterization of the cotton GhTUB1 gene that is preferentially expressed in fiber. Plant Physiol. 130, 666–674. doi: 10.1104/pp.005538
Li, Z., Wang, P., You, C., Yu, J., Zhang, X., Yan, F., et al. (2020). Combined GWAS and eQTL analysis uncovers a genetic regulatory network orchestrating the initiation of secondary cell wall development in cotton. N. Phytol. 226, 1738–1752. doi: 10.1111/nph.16468
Liu, W., Song, C., Ren, Z., Zhang, Z., Pei, X., Liu, Y., et al. (2020). Genome-wide association study reveals the genetic basis of fiber quality traits in upland cotton (Gossypium hirsutum L.). BMC Plant Biol. 20:395. doi: 10.1186/s12870-020-02611-0
Lu, S. J., Dong, L. D., Fang, C., Liu, S. L., Kong, L. P., Cheng, Q., et al. (2020). Stepwise selection on homeologous PRR genes controlling flowering and maturity during soybean domestication. Nat. Genet. 52, 428–436. doi: 10.1038/s41588-020-0604-7
Ma, Z. Y., He, S. P., Wang, X. F., Sun, J. L., Zhang, Y., Zhang, G. Y., et al. (2018). Resequencing a core collection of upland cotton identifies genomic variation and loci influencing fiber quality and yield. Nat. Genet. 50, 803–813. doi: 10.1038/s41588-018-0119-7
Nazir, M. F., Jia, Y., Ahmed, H., He, S., Iqbal, M. S., Sarfraz, Z., et al. (2020). Genomic insight into differentiation and selection sweeps in the improvement of upland cotton. Plants 9:711. doi: 10.3390/plants9060711
Nibbering, P., Petersen, B. L., Motawia, M. S., Jørgensen, B., Ulvskov, P., and Niittylä, T. (2020). Golgi-localized exo-β1,3-galactosidases involved in cell expansion and root growth in Arabidopsis. J. Biol. Chem. 295, 10581–10592. doi: 10.1074/jbc.RA120.013878
Nie, X., Wen, T., Shao, P., Tang, B., Nuriman-Guli, A., Yu, Y., et al. (2020). High-density genetic variation maps reveal the correlation between asymmetric interspecific introgressions and improvement of agronomic traits in Upland and Pima cotton varieties developed in Xinjiang, China. Plant J. 103, 677–689. doi: 10.1111/tpj.14760
Paterson, A. H., Brubaker, C. L., and Wendel, J. F. (1993). A rapid method for extraction of cotton (Gossypium spp.) genomic DNA suitable for RFLP or PCR analysis. Plant Mol. Biol. Rep. 11, 122–127. doi: 10.1007/BF02670470
Paterson, A. H., Saranga, Y., Menz, M., Jiang, C. X., and Wright, R. J. (2003). QTL analysis of genotype × environment interactions affecting cotton fiber quality. Theor. Appl. Genet. 106, 384–396. doi: 10.1007/s00122-002-1025-y
Pertea, M., Kim, D., Pertea, G. M., Leek, J. T., and Salzberg, S. L. (2016). Transcript-level expression analysis of RNA-seq experiments with HISAT, StringTie and Ballgown. Nat. protocols. 11, 1650–1667. doi: 10.1038/nprot.2016.095
Ren, W. L., Wen, Y. J., Dunwell, J. M., and Zhang, Y. M. (2018). pKWmEB: integration of Kruskal-Wallis test with empirical bayes under polygenic background control for multi-locus genome-wide association study. Heredity 120, 208–218. doi: 10.1038/s41437-017-0007-4
Sable, A., Rai, K. M., Choudhary, A., Yadav, V. K., Agarwal, S. K., and Sawant, S. V. (2018). Inhibition of Heat Shock proteins HSP90 and HSP70 induce oxidative stress, suppressing cotton fiber development. Sci Rep. 8:3620. doi: 10.1038/s41598-018-21866-0
Said, J. I., Knapka, J. A., Song, M., and Zhang, J. (2015). Cotton QTLdb: a cotton QTL database for QTL analysis, visualization, and comparison between Gossypium hirsutum and G. hirsutum × G. barbadense populations. Mol. Genet. Genom. 290, 1615–1625. doi: 10.1007/s00438-015-1021-y
Said, J. I., Lin, Z., Zhang, X., Song, M., and Zhang, J. (2013). A comprehensive meta QTL analysis for fiber quality, yield, yield related and morphological traits, drought tolerance, and disease resistance in tetraploid cotton. BMC Genom. 14:776. doi: 10.1186/1471-2164-14-776
Salih, H., Odongo, M. R., Gong, W., He, S., and Du, X. (2019). Genome-wide analysis of cotton C2H2-zinc finger transcription factor family and their expression analysis during fiber development. BMC Plant Biol. 19:400. doi: 10.1186/s12870-019-2003-8
Shen, C., Wang, N., Huang, C., Wang, M., Zhang, X., and Lin, Z. (2019). Population genomics reveals a fine-scale recombination landscape for genetic improvement of cotton. Plant J. 99, 494–505. doi: 10.1111/tpj.14339
Shen, X. L., Guo, W. Z., Lu, Q. X., Zhu, X. F., Yuan, Y. L., and Zhang, T. Z. (2007). Genetic mapping of quantitative trait loci for fiber quality and yield trait by RIL approach in upland cotton. Euphytica 155, 371–380. doi: 10.1007/s10681-006-9338-6
Shu, K., and Yang, W. (2017). E3 Ubiquitin Ligases: ubiquitous actors in plant development and abiotic stress responses. Plant Cell Physiol. 58, 1461–1476. doi: 10.1093/pcp/pcx071
Su, J., Fan, S., Li, L., Wei, H., Wang, C., Wang, H., et al. (2016). Detection of favorable QTL alleles and candidate genes for lint percentage by GWAS in Chinese upland cotton. Front. Plant Sci. 7:1576. doi: 10.3389/fpls.2016.01576
Su, J. J., Wang, C. X., Hao, F. S., Ma, Q., Wang, J., Li, J. L., et al. (2019). Genetic detection of lint percentage applying single-Locus and multi-Locus genome-wide association studies in chinese early-maturity upland cotton. Front. Plant Sci. 10:964. doi: 10.3389/fpls.2019.00964
Su, X. J., Zhu, G. Z., Song, X. H., Xu, H. J., Li, W. X., Ning, X. Z., et al. (2020). Genome-wide association analysis reveals loci and candidate genes involved in fiber quality traits in sea island cotton (Gossypium barbadense). BMC Plant Biol. 20:289. doi: 10.1186/s12870-020-02502-4
Sun, Z. W., Wang, X. F., Liu, Z. W., Gu, Q. S., Zhang, Y., Li, A. K., et al. (2017). Genome-wide association study discovered genetic variation and candidate genes of fibre quality traits in Gossypium hirsutum L. Plant Biotechnol J. 15, 982–996. doi: 10.1111/pbi.12693
Tamba, C. L., Ni, Y. L., and Zhang, Y. M. (2017). Iterative sure independence screening EM-Bayesian LASSO algorithm for multi-locus genome-wide association studies. PLoS Comput. Biol. 13:1005357. doi: 10.1371/journal.pcbi.1005357
Tamba, C. L., and Zhang, Y. M. (2018). A fast mrMLM algorithm for multi-Locus genome-wide association studies. bioRxiv. doi: 10.1101/341784
Trainin, T., Shmuel, M., and Delmer, D. P. (1996). In vitro prenylation of the small GTPase Rac13 of cotton. Plant Physiol. 112, 1491–1497. doi: 10.1104/pp.112.4.1491
Wang, B. B., Lin, Z. C., Li, X., and Zhao, B. B. (2020). Genome-wide selection and genetic improvement during modern maize breeding. Nat. Genet. 52, 565–571. doi: 10.1038/s41588-020-0616-3
Wang, S. B., Feng, J. Y., Ren, W. L., Huang, B., Zhou, L., Wen, Y., et al. (2016). Improving power and accuracy of genome-wide association studies via a multi-locus mixed linear model methodology. Sci Rep. 6:19444. doi: 10.1038/srep19444
Wen, Y. J., Zhang, H. W., Ni, Y. L., Huang, B., Zhang, J., Feng, J. Y., et al. (2017). Methodological implementation of mixed linear models in multi-locus genome-wide association studies. Brief. Bioinform. 19, 700–712. doi: 10.1093/bib/bbw145
Whittaker, D. J., and Triplett, B. A. (1999). Gene-specific changes in alpha-tubulin transcript accumulation in developing cotton fibers. Plant Physiol. 121, 181–188. doi: 10.1104/pp.121.1.181
Ye, Z., Qiao, L., Luo, X., Chen, X., Zhang, X., and Tu, L. (2021). Genome-wide identification of cotton GRAM family finds GhGRAM31 regulates fiber length. J. Exp. Bot. 72, 2477–2490. doi: 10.1093/jxb/eraa597
Yu, Y., Wu, S., Nowak, J., Wang, G., Han, L., Feng, Z., et al. (2019). Live-cell imaging of the cytoskeleton in elongating cotton fibres. Nat. Plants 5, 498–504. doi: 10.1038/s41477-019-0418-8
Zhang, J., Feng, J. Y., Ni, Y. L., Wen, Y. J., Niu, Y., Tamba, C. L., et al. (2017). pLARmEB: integration of least angle regression with empirical bayes for multi-locus genome-wide association studies. Heredity 118, 517–524. doi: 10.1038/hdy.2017.8
Zhang, K., Kuraparthy, V., Fang, H., Zhu, L., Sood, S., and Jones, D. C. (2019). High-density linkage map construction and QTL analyses for fiber quality, yield and morphological traits using CottonSNP63K array in upland cotton (Gossypium hirsutum L.). BMC Genom. 20:889. doi: 10.1186/s12864-019-6214-z
Zhang, T., Hu, Y., Jiang, W., Fang, L., Guan, X., Chen, J., et al. (2015). Sequencing of allotetraploid cotton (Gossypium hirsutum L. acc. TM-1) provides a resource for fiber improvement. Nat. Biotechnol. 33, 531–537. doi: 10.1038/nbt.3207
Keywords: fiber quality traits, genome-wide association study, upland cotton, single nucleotide polymorphism, quantitative trait loci
Citation: Song X, Zhu G, Hou S, Ren Y, Amjid MW, Li W and Guo W (2021) Genome-Wide Association Analysis Reveals Loci and Candidate Genes Involved in Fiber Quality Traits Under Multiple Field Environments in Cotton (Gossypium hirsutum). Front. Plant Sci. 12:695503. doi: 10.3389/fpls.2021.695503
Received: 15 April 2021; Accepted: 16 June 2021;
Published: 05 August 2021.
Edited by:
Venugopal Mendu, Texas Tech University, United StatesReviewed by:
Qian-Hao Zhu, Plant Industry (CSIRO), AustraliaCopyright © 2021 Song, Zhu, Hou, Ren, Amjid, Li and Guo. This is an open-access article distributed under the terms of the Creative Commons Attribution License (CC BY). The use, distribution or reproduction in other forums is permitted, provided the original author(s) and the copyright owner(s) are credited and that the original publication in this journal is cited, in accordance with accepted academic practice. No use, distribution or reproduction is permitted which does not comply with these terms.
*Correspondence: Wangzhen Guo, bW9lbGFiQG5qYXUuZWR1LmNu
†These authors have contributed equally to this work
Disclaimer: All claims expressed in this article are solely those of the authors and do not necessarily represent those of their affiliated organizations, or those of the publisher, the editors and the reviewers. Any product that may be evaluated in this article or claim that may be made by its manufacturer is not guaranteed or endorsed by the publisher.
Research integrity at Frontiers
Learn more about the work of our research integrity team to safeguard the quality of each article we publish.