 Lucie Slawinski†
 Abir Israel†
 Caroline PaillotFlorence ThibaultRichard Cordaux
 Rossitza Atanassova
 Fabienne Dédaldéchamp
 Maryse Laloi*
- Laboratoire Ecologie et Biologie des Interactions, UMR Centre National de la Recherche Scientifique 7267, Université de Poitiers, Poitiers, France
Carbon management by plants involves the activity of many sugar transporters, which play roles in sugar subcellular partitioning and reallocation at the whole organism scale. Among these transporters, the early response to dehydration six-like (ESL) monosaccharide transporters (MSTs) are still poorly characterized although they represent one of the largest sugar transporter subfamilies. In this study, we used an evolutionary genomic approach to infer the evolutionary history of this multigenic family. No ESL could be identified in the genomes of rhodophytes, chlorophytes, and the brown algae Ectocarpus siliculosus, whereas one ESL was identified in the genome of Klebsormidium nitens providing evidence for the early emergence of these transporters in Streptophytes. A phylogenetic analysis using the 519 putative ESL proteins identified in the genomes of 47 Embryophyta species and being representative of the plant kingdom has revealed that ESL protein sequences can be divided into three major groups. The first and second groups originated in the common ancestor of all spermaphytes [ζ: 340 million years ago (MYA)] and of angiosperms (ε: 170–235 MYA), respectively, and the third group originated before the divergence of rosids and asterids (γ/1R: 117 MYA). In some eudicots (Vitales, Malpighiales, Myrtales, Sapindales, Brassicales, Malvales, and Solanales), the ESL family presents remarkable expansions of gene copies associated with tandem duplications. The analysis of non-synonymous and synonymous substitutions for the dN/dS ratio of the ESL copies of the genus Arabidopsis has revealed that ESL genes are evolved under a purifying selection even though the progressive increase of dN/dS ratios in the three groups suggests subdiversification phenomena. To further explore the possible acquisition of novel functions by ESL MSTs, we identified the gene structure and promoter cis-acting elements for Arabidopsis thaliana ESL genes. The expression profiling of Arabidopsis ESL unraveled some gene copies that are almost constitutively expressed, whereas other gene copies display organ-preferential expression patterns. This study provides an evolving framework to better understand the roles of ESL transporters in plant development and response to environmental constraints.
Introduction
In higher plants, sugars display numerous important roles. They constitute the sources of cellular energy and carbon skeletons necessary for different biosynthetic pathways such as starch and cellulose biosynthesis. Acting as compatible osmolytes, they can prevent cellular damages caused by various abiotic stresses. Sugars also represent important signal molecules. They are distributed through the plant via sugar transporters, which are involved not only in the long-distance transport of sugars via the loading and unloading of the conducting complex but also in the sugar allocation from source and sink organs. Sugar carriers belong to a major facilitator superfamily (MFS), including disaccharide transporters [sucrose transporter (SUC)/suc transporter (SUT)] (Sauer, 2007; Reinders et al., 2012) and monosaccharide transporters (MSTs) (Büttner, 2007), which are characterized by 12 transmembrane domains, and also belong to the sugar will be eventually exported transporter (SWEET) family (Chen et al., 2010) characterized by only seven transmembrane domains. The MST family can be divided into seven subfamilies, and the early response to dehydration six-like (ESL) subfamily is one among the subfamilies. The ESL family is in many species the largest subfamily, encompassing 19 members in Arabidopsis (Büttner, 2007) and 22 in Vitis vinifera (Afoufa-Bastien et al., 2010). The lineage Brassica presents a very large ESL subfamily, with 24 and 30 ESL copies between B. rapa, B. oleracea, and the allotetraploid B. napus (A and C subgenomes) (Zhang et al., 2020). In Fabaceae, the ESL family is as small as Medicago (Medicago truncatula; comprising 10 MtESL) and pea (Pisum sativum; comprising 9 PsESL) (Doidy et al., 2019). Similarly, the genome of Malus domestica (Wei et al., 2014), Solanum lycopersicum (Reuscher et al., 2014), Ricinus communis (Mao et al., 2017), and Oryza sativa (Deng et al., 2019) contains 11, 10, 9, and 6 ESL genes, respectively. The genome of root parasitic angiosperm weeds, such as Striga hermonthica, Triphysaria versicolor, Mimulus guttatus, and Phelipanche aegyptiaca, contains 8, 6, 6, and 5 ESL genes, respectively (Misra et al., 2019). By searching the EST databases of various species representing all terrestrial plants, Johnson et al. (2006) could detect one ESL gene in the genomes of Selaginella and P. patens, four in Pinus taeda and Zea mays. Lalonde and Frommer (2012) also identified one ESL gene in the genome of Selaginella but none in P. patens genome. These findings demonstrate that ESL genes are also present in early diverging embryophyte lineages. The comparison of Arabidopsis and rice revealed that in rice, the sugar transport protein (STP) and polyol transporter (PLT) subfamilies were greatly expanded, whereas the ESL subfamily was much larger in Arabidopsis (Johnson and Thomas, 2007). This difference might be due to tandem duplication events in their evolutionary histories, and it has been proposed that the expansion of the ESL subfamily occurs via two segmental duplications and six tandem duplications (Johnson et al., 2006). Finally, in Grapevine (V. vinifera), 14 VvESL open reading frames were found to be located in tandem on chromosome 14 (Afoufa-Bastien et al., 2010). Altogether, these results put into question the biological relevance of so many duplicated ESL genes in some plant genomes.
Despite a high number of genes, only a few ESL genes have been studied until now, and their biological functions remain largely unknown. The first ESL gene, named as ERD6 (At1g08930), has been identified by using a differential screening of the complementary DNA (cDNA) library from Arabidopsis thaliana plants exposed to dehydration stress (Kiyosue et al., 1994). AtERD6 expression is upregulated by drought (Kiyosue et al., 1998; Seki et al., 2002; Yamada et al., 2010) and low temperature (Kiyosue et al., 1998) and is repressed in leaves by high salinity and ABA (Yamada et al., 2010). AtESL1 (for ERD six-like 1—At1g08920) is a low affinity facilitator, which is able to transport different hexoses (glucose, fructose, galactose, mannose, and xylose) across the tonoplast. Its expression is highly upregulated by high salinity and ABA in roots and slightly induced by drought (Yamada et al., 2010). AtSFP1 and AtSFP2 (sugar porter family proteins 1 and 2—At5g27350 and At5g27360) are two tandem duplicated genes located on chromosome 5. These two genes displayed different expression patterns during leaf development. AtSFP1 was detected in seedlings 9 days after germination but not detected in mature plant organs (leaves, flowers, flower buds, stem, and roots), whereas AtSFP2 was expressed in all tested plant organs and in seedlings. Further analysis showed that only SFP1 is induced during leaf senescence but the expression of AtSFP2 remains stable during this process (Quirino et al., 2001). AtZIF2 (a zinc-induced facilitator—At2g48020) is a tonoplastic transporter, which is expressed in different organs, mainly in the roots, to promote the sequestration of zinc into the vacuole (Remy et al., 2014). AtERDL6 (Early Responsive to Dehydration-Like six - At1g75220) is a tonoplastic H+g/glucose symporter involved in the export of glucose from the vacuole under the conditions that require the mobilization of vacuolar carbohydrate reserves. The expression of AtERDL6 was upregulated under the conditions of darkness, heat stress, and wounded leaves and was downregulated under cold stress and exogen glucose supply, allowing its accumulation in the vacuole (Poschet et al., 2011). Furthermore, atesl1.2 mutant showed an increase in the vacuolar glucose content (more than 90%) compared to the wild type (86%) (Poschet et al., 2011), whereas Arabidopsis lines overexpressing AtERDL6 had lower glucose levels than wild-type plants (Klemens et al., 2014). Only three ESL genes from other species has been characterized. The apple MdERDL6-1, a homolog of AtERDL6 in Arabidopsis, was recently identified. It is highly expressed in fruits; its encoded protein seems to be localized at the tonoplast and acts as an H+/glucose symporter with a low affinity for glucose. In contrary to AtERDL6, the overexpression of MdERDL6-1 leads to an increase rather than a decrease in sugar levels in apple and the leaves and fruits of tomato (Zhu et al., 2021). In Pineapple (Ananas comosus), the screening of a leaf cDNA library using a degenerated PCR led to the identification of AcMST1, an ESL localized in the tonoplast (Antony et al., 2007). Breia et al. (2020) showed that the grapevine VvERD6l13 gene was induced in fruits upon infection by necrotrophic or biotrophic pathogens such as Botrytis cinerea and Erysiphe necator. VvERD6l13 is the first ESL described to be localized in the plasma membrane. Even more surprisingly, using yeast as a heterologous system, VvERD6l13 has been characterized as a low affinity H+/sucrose symporter (Breia et al., 2020). Moreover, Desrut et al. (2020) showed that six AtESL genes were differentially regulated in the presence of plant growth-promoting rhizobacteria (PGPR). Indeed, ERD6-like7, ERD6-like12, and ERD6-like16, as well as ERD6-like18, were downregulated in shoots and roots, respectively, whereas ERD6-like13 and ERD6-like15 were upregulated in roots in response to PGPR (Desrut et al., 2020). Taken together, the above-cited studies emphasize the structural and functional diversity of ESL transporters. The transporters, which are localized on the tonoplast or plasma membrane, can transport not only monosaccharides but also sucrose and might be involved in many plant responses to abiotic and biotic environmental cues. The biological relevance of so many duplicated ESL genes in several plant genomes prompted us to investigate the evolutionary history of the ESL subfamily. For this, we performed a phylogenetic analysis using the ESL proteins identified in 47 embryophyte proteomes, and identified tandem duplicates copies, gene structures and ESL protein motifs. We analyzed the selection regime experienced by the Brassicaceae family, studied, for A. thaliana, the gene expression pattern, and searched the putative cis-regulatory motifs in AtESL promoters.
Materials and Methods
Plant Materials and Growth Conditions
Arabidopsis thaliana plants (ecotype Columbia: Col-0) were grown in ArasystemTM (BETATECH bvba, Ghent, Belgium) containing an autoclaved mix of compost/vermiculite (3/1) into a growth chamber under a 10-h light (22°C)/14 h dark (18°C) photoperiod, with 50% (light) to 90% (dark) relative humidity. Fully expanded leaves, roots, flower buds, flowers, and siliques were used for sampling. The roots were separated from soil by multiple careful washings with water before sampling.
ERD6-Like Sequence Identification
Previously identified ESL proteins of A. thaliana, Brachypodium distachyon, Cucumis melo, Musa acuminata, O. sativa, Populus trichocarpa, Solanum lycopericum, V. vinifera, and Z. mays were collected from the Aramemnon online database (http://aramemnon.uni-koeln.de). The ESL sequences from other species were identified through the protein basic local alignment search tool (BLASTp) analysis (Altschul, 1997) using the 18 full-length V. vinifera ESL protein sequences as queries (Afoufa-Bastien et al., 2010) and an E-value of 10−60 against the online server Phytozome v10.0 (https://phytozome.jgi.doe.gov/pz/portal.html) with the exceptions of P. taeda (http://congenie.org), Galdieria sulphuraria, Chondrus crispus, Pyropia yezoensis, Chlorella vulgaris, Phoenix dactylifera, Nelumbo nucifera, Cicer arietinum, Genlisea aurea, Ectocarpus siliculosus (https://www.ncbi.nlm.nih.gov), Lotus japonicus (http://www.kazusa.or.jp/lotus/), and Klebsormidium nitens (https://phycocosm.jgi.doe.gov/Klenit1/Klenit1.home.html). Only full-length sequences were collected, and the potential isoform sequences were eliminated from the study. The species and the identified sequences are summarized in Supplementary Table 1.
Phylogenetic Analysis
Alignments of the identified ESL protein sequences were performed by using the BioEdit software (https://bioedit.software.informer.com) and the ClustalW method. A phylogenetic analysis was performed by using the MEGA v.6.0 software (Tamura et al., 2013) and the Maximum Likelihood method [the phylogeny software based on the maximum-likelihood principle (PhyML)] with 1,000 bootstrap replicates. The prior alignment performed by MEGA v.6.0 followed the Jones–Taylor–Thornton (JTT) amino acid model. The sucrose transporter (SUC) A. thaliana sucrose carrier 2 (AtSUC2) protein sequence and one referent of each monosaccharide transporter (MST) subfamily [A. thaliana PLT 5 (AtPLT5), A. thaliana inositol transporter 1 (AtINT1), A. thaliana STP 13 (AtSTP13), A. thaliana vacuolar glucose transporter 1 (AtVGT1), A. thaliana tonoplastic monosaccharide transporter (AtTMT1), and A. thaliana plastidic glucose transporter 1 (AtpGlt)] were used as an outgroup to root the phylogenetic tree. From the inference of a phylogenetic tree, all dates, periods, and evolutionary data used to reconstruct the evolutionary history of the ESL family in land plants were obtained from the Time Tree of Life (http://www.timetree.org) (Hedges et al., 2006; Kumar et al., 2017).
Estimation of Selection Pressures
Early response to dehydration six-like coding sequences (CDSs) from A. thaliana, Arabidopsis lyrata, Arabidopsis halleri, and Capsella rubella were aligned by MEGA 6.0 using the neighbor-joining method, 1,000 bootstrap, and the JTT amino acid substitution model. This led to the definition of the 18 monophyletic groups of ESL sequences, each containing at least 1 A. thaliana ESL sequence as well as a sequence of C. rubella (when possible: 16 of the 18 groups). For each group, a second alignment was performed by using the BioEdit free software (https://bioedit.software.informer.com) and ClustalW method and was manually realigned to keep the same open reading frame for all the aligned CDS. In total, four sequences (Ah04425s02, Cr10000845, Cr10015811, and Cr10021344) were removed from the study due to non-possiblity of aligning the sequences correctly. The dN/dS (KaKs) ratio of ESL sequences was calculated by the Datamonkey online server (http://www.datamonkey.org), using the GA-branch method (Kosakovsky Pond and Frost, 2005; Delport et al., 2010) following the HKY85 model. The user tree set was defined as (((Ah; Al), At), Cr), which reflected the evolution of these four species.
Gene Structure and Protein Motifs Determination
Early response to dehydration six-like gene structures were determined by using the GSDS v.2.0 online server (Gen Structure Display Server: http://gsds.cbi.pku.edu.cn/) developed by Beijing University's Bio-Informatics Center (Hu et al., 2015). Gene structures were determined via the alignment of genomic sequence and CDSs. Each sequence was represented with all exons in the same scale and the same size for all introns. L. japonicus sequences were not included.
The conserved motifs of ESL and other sugar transporters were analyzed by using multiple EM for motif elicitation (MEME) suite 5.3.3 program (https://meme-suite.org/meme/tools/meme) with the following parameters: optimum width, 3–60; the maximum number of motifs 50, and an E-value of 10−60.
Promoter Analysis
About 1,000-bp-long promoter sequences of 19 AtESL genes were retrieved from The Arabidopsis Information Resource (TAIR) database. These sequences were then scanned for the presence of cis-regulatory elements by using the plant cis-acting regulatory DNA element (PLACE) database (https://www.dna.affrc.go.jp/PLACE/?action=newplace) (Higo et al., 1999).
RNA Extraction and Real-Time Quantitative PCR Analysis
Total RNA was extracted from the frozen ground A. thaliana tissues according to Kay et al. (1987). RNA quantity and quality were verified by using a Microdrop (Thermo Fischer, Waltham, MA, USA) and an agarose gel. Total RNA was treated with DNAse I (Sigma-Aldrich, St. Louis, MO, USA), and the reverse transcription was performed by using M-MLV reverse transcriptase (Promega, Madison, WI, USA). Real-time quantitative PCR (RT-qPCR) was carried out by using the GoTaq qPCR Master Mix (Promega, Madison, WI, USA) with a Mastercycler realplex2 instrument (Eppendorf, Hamburg, Germany). The results of the target gene expression were normalized with the average Ct value of the reference gene, AtPP2a (At1g13320) (Czechowski et al., 2005). The results were expressed as the relative gene expression according to the 2−ΔCt method. Primers were designed by using Oligo 7 and tested for specificity and efficiency (≥90%). The primer sequences used in this study are listed in Supplementary Table 2.
Statistical Analyses
Statistical analyses were performed by using XLStats 2011 (Addinsoft, Paris, France).
Results
ESL Transporters Emerged With Streptophyta and Diverged Into Three Major Groups in Terrestrial Plants
To study the evolution of ESL transporters, we performed the protein BLAST (BLASTp) analysis using 18 V. vinifera ESL protein sequences as queries against 63 proteomes from photosynthetic organisms representing the main groups of algae and the plant kingdom. BLASTp analysis of the genomes of 13 algae, including stramenopiles (E. siliculosus), rhodophytes (C. crispus, Cyanidioschyzon merolae, G. sulphuraria, and P. yezoensis), chlorophytes (C. reinhardtii, V. carteri, C. vulgaris, D. salina, C. subtellipsoidea, O. lucimarinus, and M. pusilla), and streptophytes (K. nitens), led to the identification of a single ESL protein in the genome of K. nitens. In the genomes of 50 embryophytes, a total of 526 sequences were identified, and mosses and lycophytes have <5 ESL copies (2 for Marchantia polymorpha, 3 for Physcomitrella patens, 1 for Sphagnum fallax, and 2 for Selaginella moellendorffii). Gymnosperms and angiosperms have 5 to 19 ESL genomes, with a few exceptions of those having fewer ESL copies (S. polyrhiza: 3, P. dactylifera: 4, and T. pratense: 4) or a very high number of copies (B. rapa: 30, L. usitatissimum: 30, and E. grandis: 37). These data suggest that ESL transporters could have appeared with streptophytes and have considerably diversified in Embryophyta (Figure 1 and Supplementary Table 1).
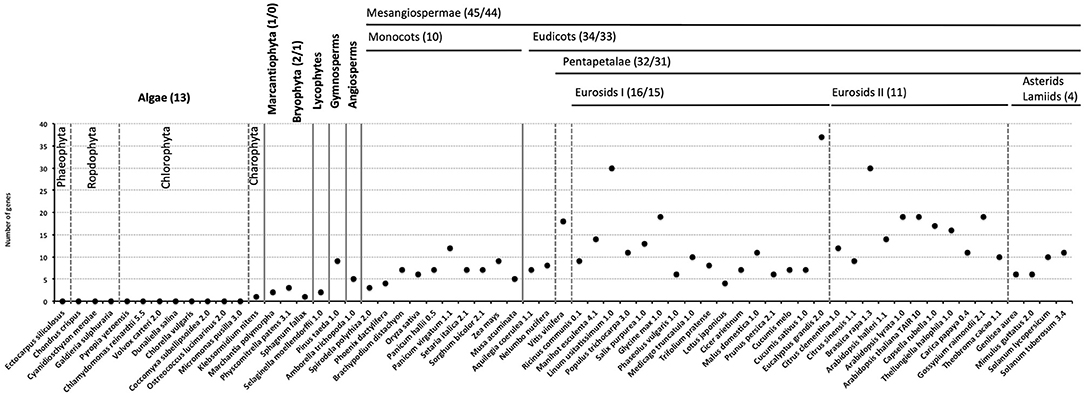
Figure 1. The number of early response to dehydration six-like (ESL) proteins identified in each species. The classification of the species is indicated at the top of the graph. Numbers in bracket indicate the total sequence number/the number of sequences included in a phylogenetic analysis.
A phylogenetic analysis performed on the 519 protein sequences isolated from 47 Embryophyta shows that the ESL proteins of angiosperms can be divided into three main groups, namely ESL1, ESL2, and ESL3. The group ESL1 (Figure 2) is supported by a high bootstrap value (96%) and contains 44 angiosperms with 123 sequences, including 1 of the 5 sequences of A. trichopoda. All the sequences identified in moss and fern (the tree sequences of P. patens ans the two sequences od S. moellendorffii) and 5 of the 9 sequences of the gymnosperm P. taeda are located at the basis of this group. Altogether, the 133 ESL protein sequences (25.6% of all sequences) form a cluster wherein the 47 analyzed species are represented by at least 1 protein sequence. The sequences of moss and fern form a monophyletic group and show a similarity higher than those of P. taeda and angiosperms. In the groupe ESL1 (Figure 3), monocots sequences form a monophyletic group supported by a bootstrap value of 89%. One sequence of A. trichopoda, two of N. nucifera, two of A. caerulea and one of V. vinifera are located at the basis of this monocots group. This observation suggests that monocots ESL1 are related to ESL of basal angiosp, basal eudicots and vitales. On the contrary, asterid sequences are split into two distinct groups, including both Solanaceae, Phrymaceae, and Lentibulariaceae, whereas for eurosid sequences, at least, two separated groups for most botanical families can be observed and most are supported by high bootstrap values. Fabaceae sequences are split into three groups, and a single group is observed for Rosaceae and Myrtaceae. According to Figure 2, the four other sequences of the gymnosperm P. taeda are located at the basis of groups ESL2 and ESL3, and no sequences of moss and fern are present. This suggests a first diversification event in the common ancestor of seed plants.
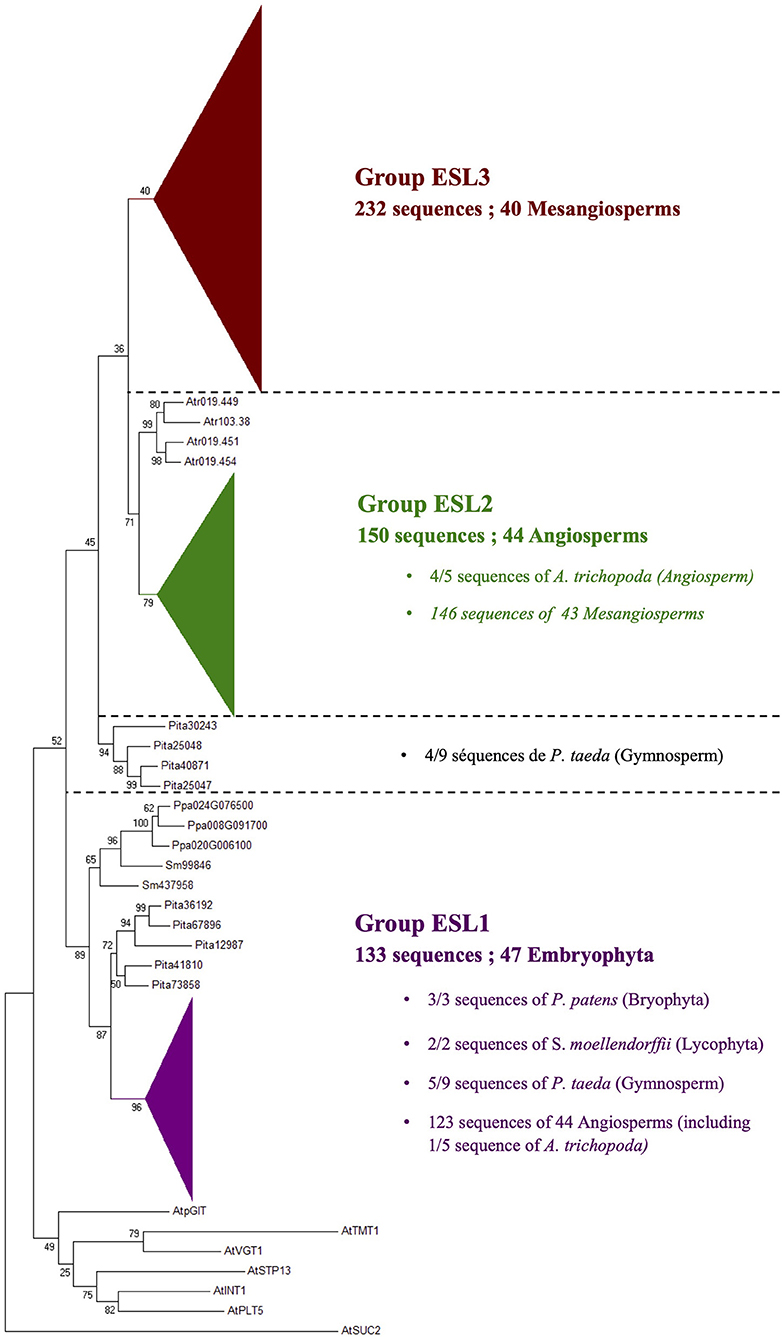
Figure 2. The maximum likelihood phylogeny of ESL sugar transporter proteins. The tree was produced by aligning 519 amino acid ESL sequences identified in 47 Embryophyta using ClustalW and was then built using the software Molecular Evolutionary Genetics Analysis (MEGAv6, Tamura et al., 2013). Jones–Taylor–Thornton (JTT) amino acid substitution model was used and the bootstrap consensus tree was inferred from 1,000 replicates. The percentage of replicate trees in which the associated taxa clustered together in the bootstrap test is shown next to the branches. The tree is drawn to scale, with branch lengths measured in the number of substitutions per site. A. thaliana sucrose carrier 2 (AtSUC2), A. thaliana polyol transporter 5 (AtPLT5), A. thaliana inositol transporter 1 (AtINT1), A. thaliana sugar transport protein 13 (AtSTP13), A. thaliana vacuolar glucose transporter 1 (AtVGT1), A. thaliana tonoplastic monosaccharides transporter 1 (AtTMT1), and A. thaliana plastidic glucose transporter 1 (AtpGlT). For the annotation of other sequences, see Supplementary Table 1.
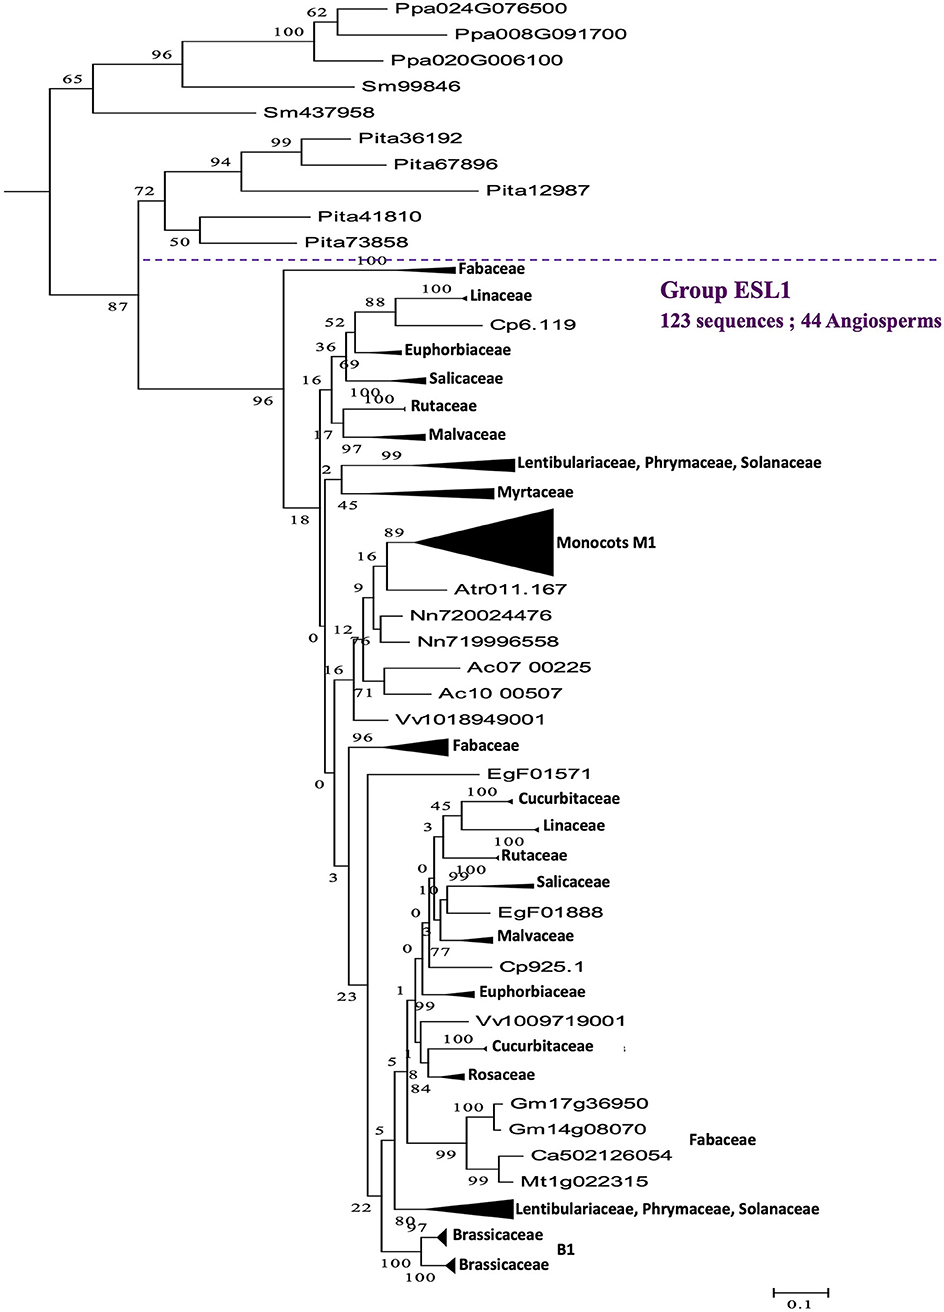
Figure 3. The maximum likelihood phylogeny of ESL sugar transporter proteins: The details of group ESL1. The tree was produced by aligning 519 amino acid ESL sequences identified in 47 Embryophyta using ClustalW and was then built using the software Molecular Evolutionary Genetics Analysis (MEGAv6, Tamura et al., 2013). JTT amino acid substitution model was used and the bootstrap consensus tree was inferred from 1,000 replicates. The percentage of replicate trees in which the associated taxa clustered together in the bootstrap test is shown next to the branches. The tree is drawn to scale, with branch lengths measured in the number of substitutions per site. For the annotation of sequences, see Supplementary Table 1.
The group ESL2 (Figure 2) is formed by 150 sequences of angiosperms (28.9% of all sequences). It is noteworthy that the 4 sequences of A. trichopoda are located at the basis of a mesangiosperm group (a bootstrap value of 79%), which contains the 146 sequences identified in the genomes of 43 species. In this group (Figure 4), monocots and eudicots separate clearly into two specific groups. The monocot group (monocots G2) contains 24 sequences (10 species). The eudicot group can be subdivided into two main subgroups: ESL2a (72 sequences, 32 species, excluding L. japonicus) and ESL2b (48 sequences, 32 species, excluding E. grandis). In each group, the protein sequences separate mainly according to the botanical families. There are two groups of ESL for Fabaceae, Rosaceae, Cucurbitaceae, Rutaceae, Malvaceae, Malpighiales, and Asterids, and three groups of ESL for Brassicaceae.
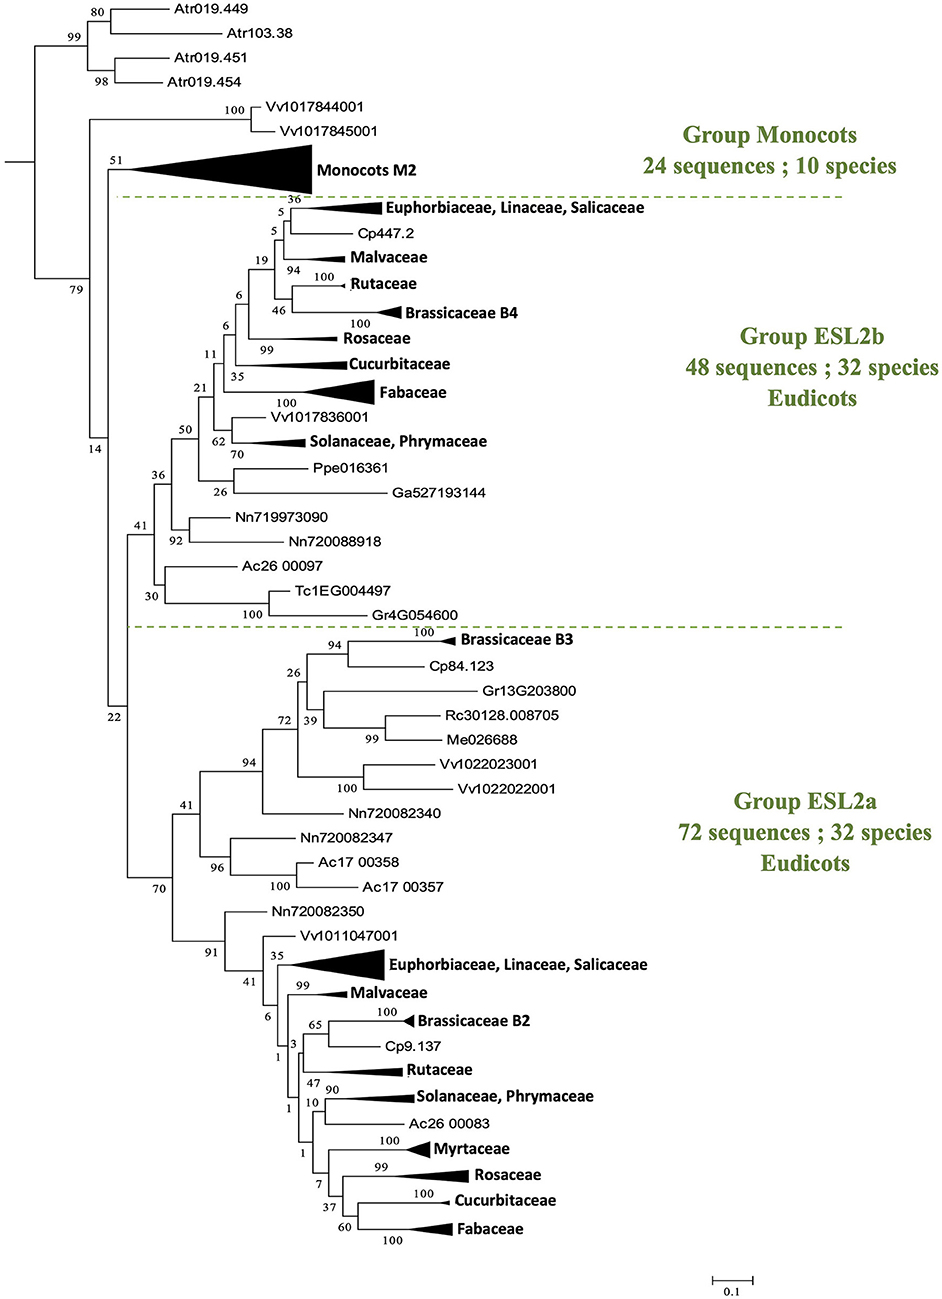
Figure 4. The maximum likelihood phylogeny of ESL sugar transporter proteins: The details of group ESL2. The tree was produced by aligning 519 amino acid ESL sequences identified in 47 Embryophyta using ClustalW and was then built using the software Molecular Evolutionary Genetics Analysis (MEGAv6, Tamura et al., 2013). JTT amino acid substitution model was used and the bootstrap consensus tree was inferred from 1,000 replicates. The percentage of replicate trees in which the associated taxa clustered together in the bootstrap test is shown next to the branches. The tree is drawn to scale, with branch lengths measured in the number of substitutions per site. For the annotation of sequences, see Supplementary Table 1.
The group ESL3 (Figure 2) is specific to mesangiosperms as no sequences of A. trichopoda (one of the earliest divergent lineages within angiosperms) are present. This group contains the 232 sequences of 40 species (44.7% of all sequences). S. polyrhiza (one of the earliest divergent lineages within monocots), O. sativa, and G. aurea are not represented in this group. The group ESL3 can be subdivided into three subgroups, namely ESL3a, ESL3b, and ESL3c (Figure 5). The subgroup ESL3a contains 62 sequences (11.95% of all sequences) from 39 mesangiosperms. One monocot-specific group (monocots G3) is related to a sequence of the two basal eudicots: A. caerulea and N. nucifera. All Pentapetalae (Vitaceae, Eurosids, and Asterids) form a single group in which the sequences are separated according to the botanical families. The subgroup ESL3b contains the 47 sequences (9.05% of all sequences) identified in V. vinifera and 14 Eurosids, and the subgroup ESL3c contains 123 sequences (23.7% of all sequences) from V. vinifera, Solanaceae (S. lycopersicum and S. tuberosum), and 17 Eurosids.
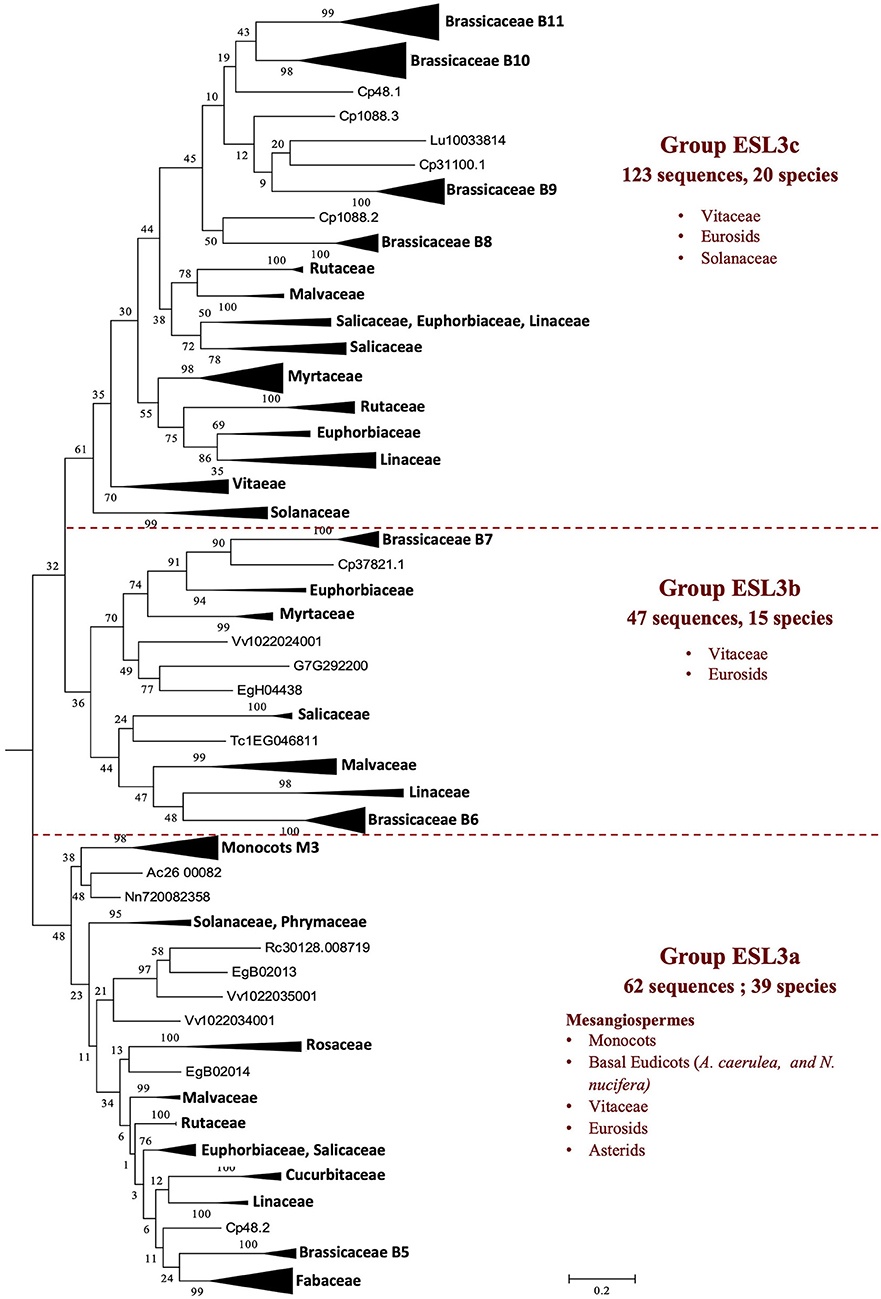
Figure 5. The maximum likelihood phylogeny of ESL sugar transporter proteins: the details of group ESL3. The tree was produced by aligning 519 amino acid ESL sequences identified in 47 Embryophyta using ClustalW and was then built using the software Molecular Evolutionary Genetics Analysis (MEGAv6, Tamura et al., 2013). JTT amino acid substitution model was used, and the bootstrap consensus tree was inferred from 1,000 replicates. The percentage of replicate trees, in which the associated taxa clustered together in the bootstrap test is shown next to the branches. The tree is drawn to scale, with branch lengths measured in the number of substitutions per site. For the annotation of sequences, see Supplementary Table 1.
In conclusion, the distribution of ESL sequences in the three main ESL groups varies according to the botanical groups, and four distribution types can be observed (Supplementary Table 3): (1) The group ESL1 contains most of the sequences of Poaceae (49%) and Lamiales (58%) and is closely related to half of the sequences of P. taeda (56%) and to all the sequences of P. patens and S. moellendorffii. (2) The group ESL2 contains the highest number of ESL sequences of A. trichopoda (Amborellaceae, 80%), A. corulea (Ranunculaceae, 57%), N. nucifera (Nelumbonaceae, 63%), most of the Fabaceae (39%), all Rosaceae (53%), and Cucurbitaceae (43%). (3) For V. vinifera (Vitaceae 56%), all Malpighiales (52%), E. grandis (Myrtaceae, 59%), Rutaceae (52%), Brassicales (71%), and Malvaceae (48%), the highest number of proteins is found in the group ESL3. This high number is generally correlated with the presence of a high number of sequences in group ESL3c (55 to 81% of ESL3 sequences) except for malvaceae and euphorbiaceae. (4) For Solanales, the groups ESL1 and ESL3 contain the same number of sequences (38% each), which is more than the group ESL2 (24%). In monocots and Fabaceae, this distribution varies according to the species.
Tandem Duplications Are at the Origin of the Expansion of the ESL Family in Some Monocots and Eudicots
The genome analysis has revealed the presence of tandem duplicated genes for many species, which could explain the heterogeneous distribution of ESL into three ESL groups. To test this hypothesis, we determined the number of tandem duplicated ESL genes for each species and studied their distribution. L. japonicus and G. aurea were not included in this analysis (Figure 6 and Supplementary Table 3). For a few species, including the moss P. patens, the fern S. moellendorffii, the monocot M. acuminate, and the asterid M. guttatus, no tandem duplicated gene was identified. This could be in agreement, at least for the moss and the fern, with a few numbers of ESL genes found in their genomes. The gymnosperm P. taeda, the basal angiosperm A. trichopoda, and the basal monocot S. polyrhiza (alismatales) only have two duplicated ESL2 genes. For monocots, P. dactylifera (arecales) contains two duplicated genes (one ESL2 and one ESL3a), whereas in Poaceae, all species have three to six tandem duplicated ESL belonging to ESL1 and/or ESL2. In addition, P. hallii, P. panicum, and S. bicolor have two duplicated ESL3. Therefore, Poaceae mainly have ESL1 (45%) and ESL2 (36%) duplicated genes. For eudicots, only three species have duplicated ESL1: E. grandis (Myrtales) with four duplicated ESL1 (16% of the EgESL) and two Fabaceae, G. max and M. truncatula, which have two and four tandem duplicated ESL1, respectively, representing 35% of the total Fabaceae sequences. The basal eudicots, A. coerulea and N. nucifera have more than 70% of the duplicated ESL2 genes and two Rosaceae only ESL2 tandem genes. V. vinifera, E. grandis, Rutaceae, and Brassicaceae have more than 85% duplicated ESL3, whereas Cucurbitaceae, C. papaya, and Solanaceae only have duplicated ESL3. In sum, among the 509 analyzed ESL, 246 are tandem duplicated genes, including 25 ESL1 from 10 species (Poaceae: 60% and eudicots: 40%), 51 ESL2 from 23 species (eudicots: 63% and monocots: 29%), and 170 ESL3 mostly from eudicots (96%). Furthermore, duplicated ESL3 genes are not homogeneously distributed among the ESL3 subgroups. The subgroup ESL3a contains 33 duplicated eudicot genes (82.5%) and only 7 monocot genes (17.5%) that are identified in 23 species. The subgroups ESL3b and ESL3c have 31 and 99 eudicot duplicated genes, respectively, all from Pentapetalae species, including V. vinifera, Malpighiales, E. grandis, Brassicales, and Malvales. ESL3c also contains duplicated genes from Rutaceae and Solanaceae (Figure 7 and Supplementary Table 3). The group ESL3, which has the highest number of sequences, also contains the most tandem duplicated genes. In fact, we observed a good correlation between the number of tandem-duplicated genes and the number of ESL genes per species (Supplementary Figure 1A), which is not surprising. A similar correlation is observed between the number of duplicated ESL3 and the number of ESL genes per species as well as the number of eudicot ESL (Supplementary Figures 1B,C), which makes sense as eudicot species are more represented in this study. However, a correlation is also found between the number of duplicated ESL3c and the number of ESL3 genes per species (Supplementary Figures 1D,E), indicating that a high number of ESL3c (123 genes) is presumed due to numerous eudicot tandem gene duplications, which have occurred in 20 species.
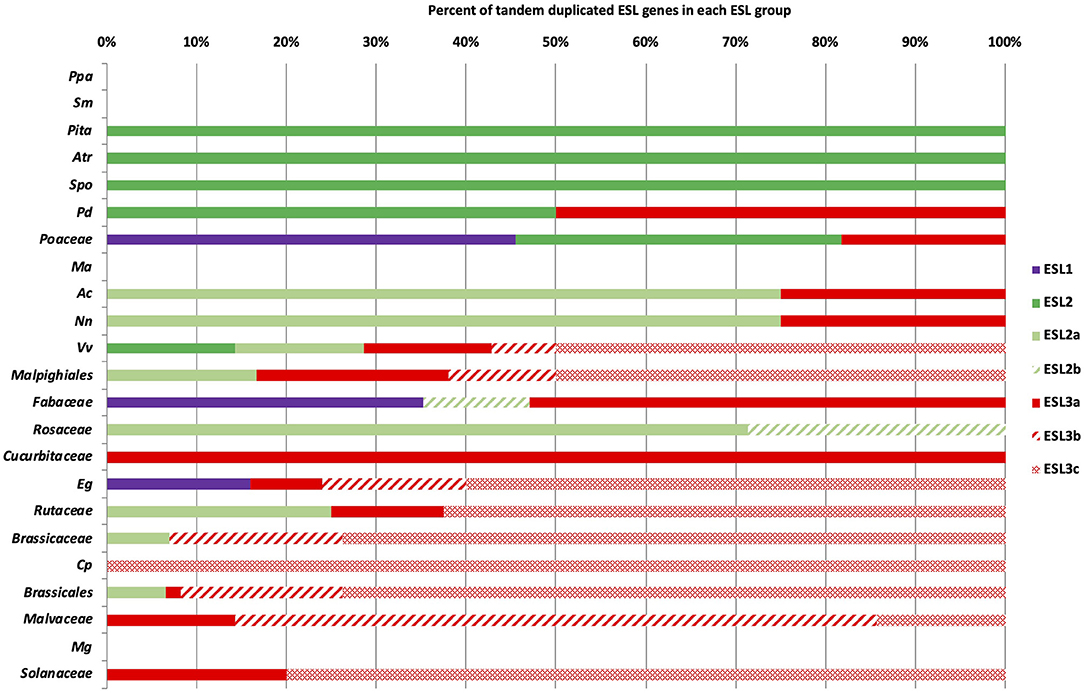
Figure 6. The distribution of tandem duplicated ESL genes in the different ESL groups. % represents the percentage of tandem duplicated genes relative to the total number of ESL per species or botanical groups. Purple is for ESL1, green for ESL2, and red for ESL3. For abbreviations see Supplementary Data 1.
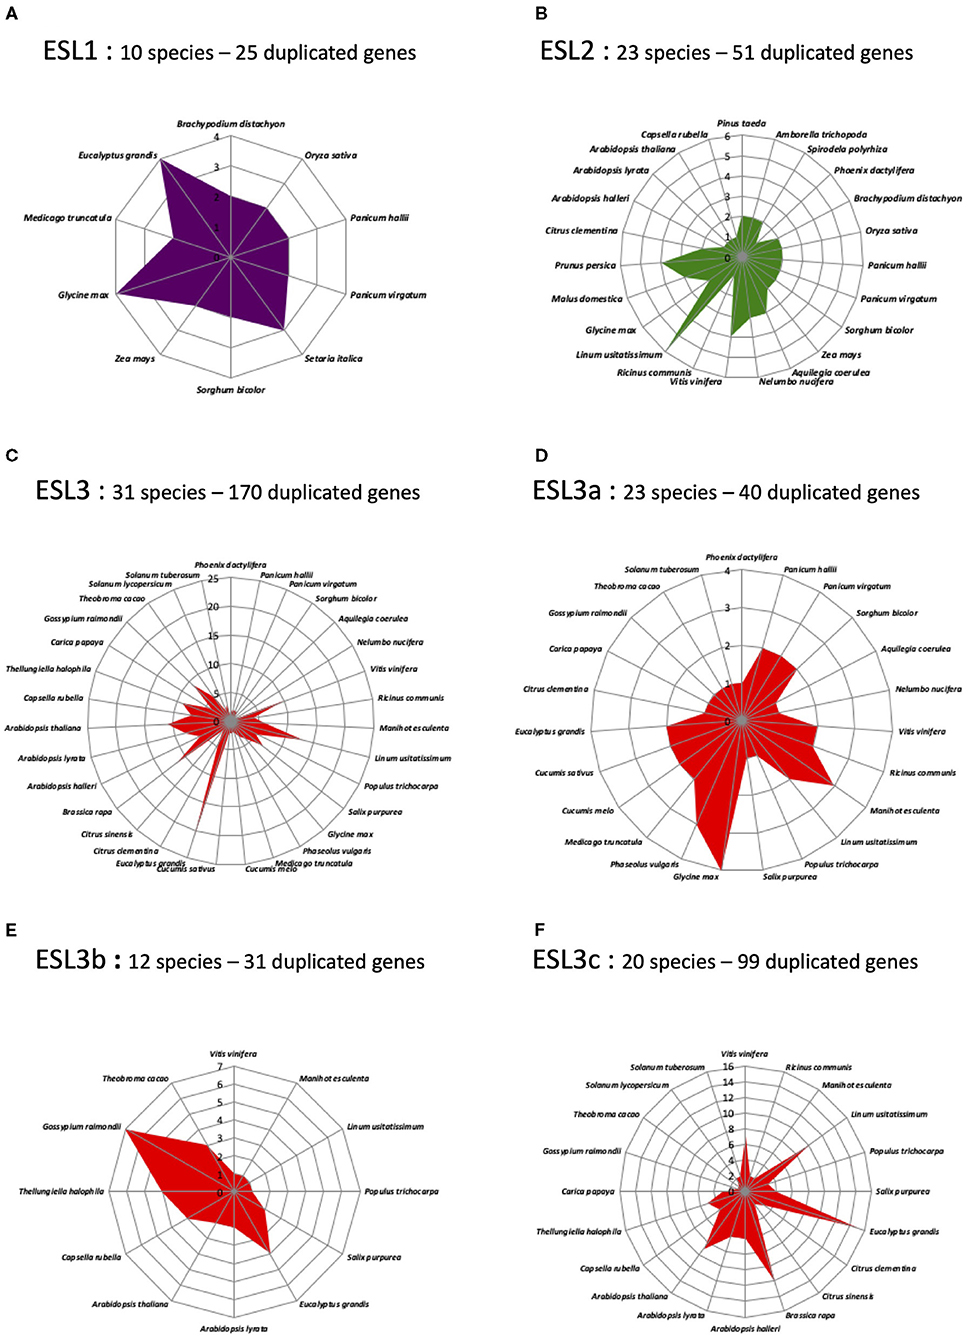
Figure 7. The distribution of the tandem duplicated ESL genes in the different ESL groups. Values correspond to the number of tandem duplicated genes for each species. (A) ESL1, (B) ESL2, (C) ESL3, (D) ESL3a, (E) ESL3b, and (F) ESL3c.
ESL Genes From Monocots and Brassicaceae Present Specific Gene Structures
To identify the potential structural specificities for ESL genes, we performed a comparative analysis of the intron/exon arrangement of 515 sequences from 46 species (L. japonicus was excluded from this analysis as no CDSs could be recovered on the Lotus genome website). As shown in Figure 8A, the number of exons present in the ESL genes varies from 6 to 35. However, 14 exon/intron arrangements with each representing <4% of the total number of sequences might arise from incomplete sequences or erroneous CDS or represent the exceptional structures that would only concern a small number of ESL sequences. By contrast, the arrangements with 16, 17, and 18 exons have been identified in 8.35%, 24.08%, and 50.49% of the ESL sequences, respectively.
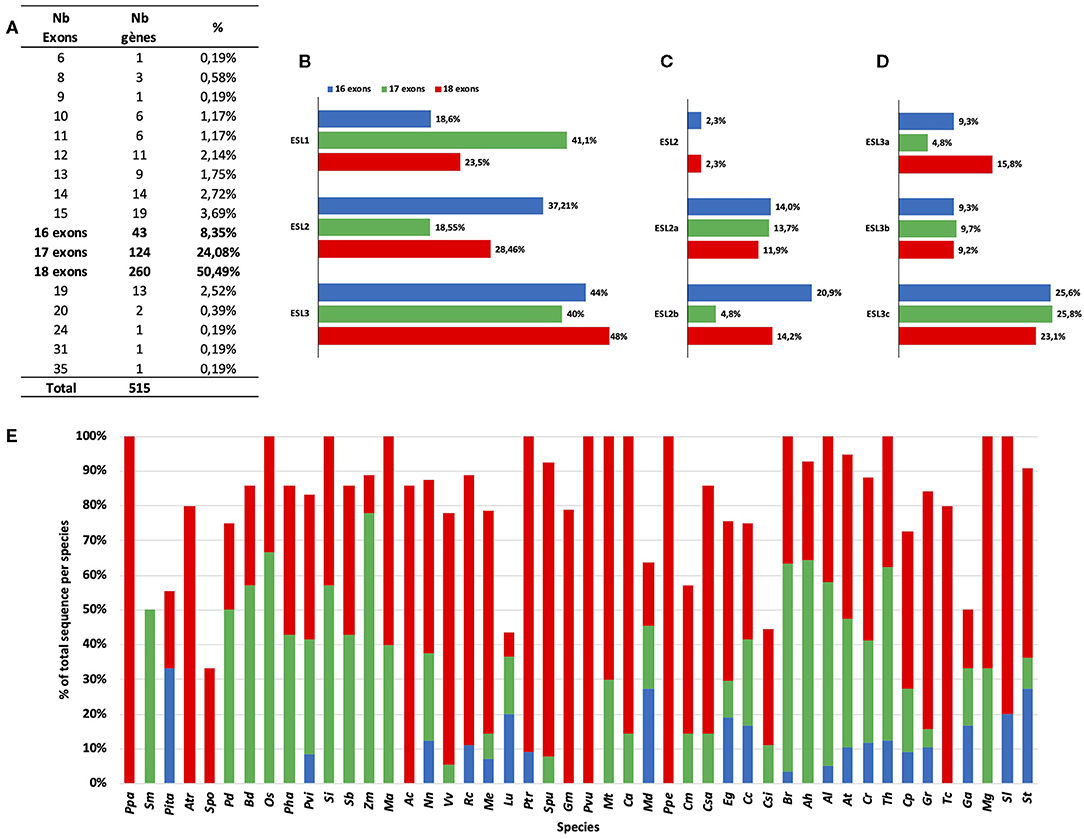
Figure 8. The percentage and the distribution of the different ESL gene structures (exons–introns). (A) The gene number per structure and the percentage of total ESL. (B) The distribution of the three main structures in the three ESL groups (% is related to the number of ESL having the same type of structure and belonging to the same ESL group). (C) Distribution amount of the ESL2 group. (D) Distribution amount of the ESL3 group. (E) The percentage of each type of structure per species.
The structure with 18 exons, named as structure 1 (Figures 8, 9), is the most widespread structure and is present in 260 embryophyte sequences (50.49%). It is found in all species except the fern S. moellendorffii. It is the only one found in the sequences of P. patens (moss), P. vulgaris (Fabaceae), and P. persica (Rosaceae). It is present in more than 80% of the sequences of the basal angiosperm A. trichopoda, the basal eudicot A. coerulea, the salicaceae P. trichopoda and S. purpurea, the Fabaceae C. arietinum, the Malvaceae T. cacao, and the Solanaceae S. lycopersicum. For the other species, it represents 20–80% of the ESL sequences, except in the cases of monocot Z. maize, the linaceae L. usitatissimun, and the lentibulatiaceae G. aurea, which have this structure for <20% of the sequences (Figure 8E). About 48% of the ESL sequences with this 18-exon structure are ESL3 genes, including ESL3c being 23% (Figures 8B–D).
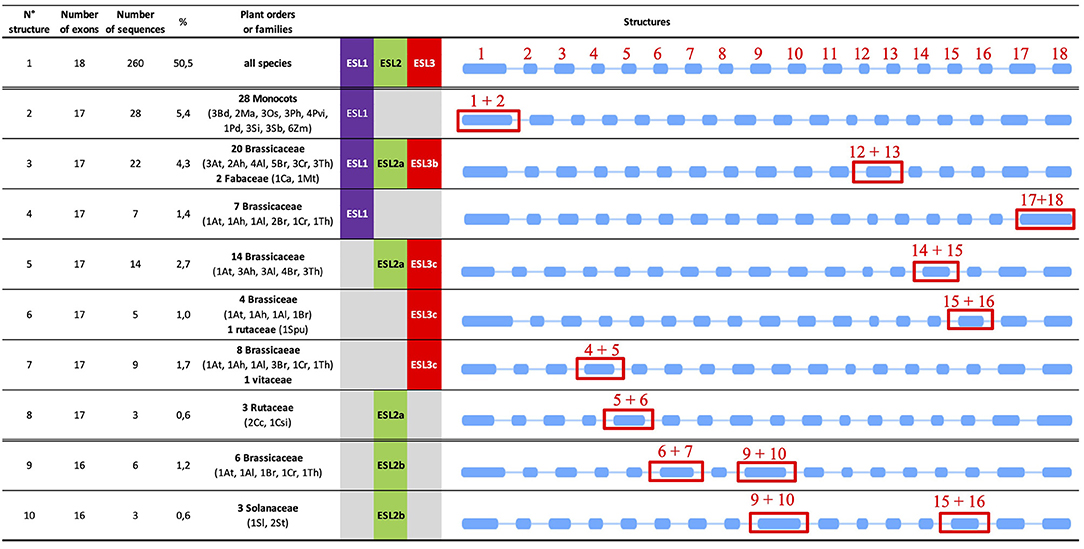
Figure 9. Major types of introns/exons structure identified in ESL genes. The blue rectangles represent the exons and the lines the introns. The introns are represented with a scale that does not take into account their real length. Red numbers indicate the exons and the red rectangles highlight the differences. For each structure, the number of exons and the number of sequences are indicated as well as the percentage of total ESL sequences and the botanical groups in which they have been detected.
The arrangements with 17 exons are less widespread and have been identified in 124 embryophyte sequences (24.08%). They are present in more than 35% of the sequences of the fern S. moellendorffii, the Poaceae and the Brassicacea except for the cases of P. virgatum (33.3%), and C. rubella (29.4%). For M. trucatula and M. guttatus, they represent 30 and 33%, respectively, whereas, for all other species, they represent between 5.6 and 25% of the sequences. Genes with 17-exon arrangements are equally split into ESL1 (41.1%) and ESL3 (40%) groups, whereas only 18.55% are ESL2 genes. In the ESL3 group, a quarter of them are ESL3c (Figures 8A–D). In fact, 7 different structures with 17 exons (named as structures 2–8) were identified (Figure 9). Structure 2 should result from the merging of exons 1 and 2 relative to structure 1. It is specific to the monocot ESL1 as it was identified in 28 monocot sequences from 9 Poaceae and from P. dactilyfera (arecaceae) and M. acuminata (musaceae). Only the ESL from the basal monocot S. polyrhiza does not have such a structure. Five 17-exon structures are more or less Brassicaceae specific. Structure 3 (the merging of exons 12 and 13) was identified in 22 sequences essentially from Brassicaceae (20 sequences) and Fabaceae (2 sequences) and concerned ESL1, ESL2a, and ESL3b genes. Structure 4 (the merge of exons 17 and 18) is specific to Brassicaceae ESL1 as it is found in only seven ESL1. Structure 5 (the merge of exons 14 and 15) is specific to Brassicaceae and concerns 14 ESL2a and ESL3c genes. Structure 6 (the merging of exons 15 and 16) is specific to ESL3c and was identified in four Brassicaceae and in one S. purpurea (Rutaceae) genes. Structure 7 (the merging of exons 4 and 5) is specific to ESL3c and is identified in eight Brassicaceae and in one V. vinifera genes. Finally, the structure 8 (the merging of exons 5 and 6) is specific to ESL2a and is identified in three Rutaceae genes.
The arrangements with 16 exons are less abundant. They have been identified in 43 sequences (8.35%) from 20 species (Figures 8A–D). They are more present in ESL2 (37.21%) and in ESL3 (44%), especially in ESL2b (20.9%) and ESL3c (25.6%). They represent 33% of the ESL of P. taeda, 27% of those of M. domestica and S. lycopersicum, 20% of S. tuberosum and L. usitatissimum, and 3–12.5% of the ESL of Brassicaceae. Contrary to 17- and 18-exon structures, only the two types of 16-exon structures could be identified (Figure 9). Structure 9 (the merging of exons 6 and 7 as well as 9 and 10) is specific to ESL2b Brassicaceae and concerns six sequences in Brassicaceae. Structure 10 (the merging of exons 9 and 10 as well as 15 and 16) is observed for the three sequences of ESL2b of Solanaceae.
A striking result is that the ESL1 from monocots have a 17-exon structure (structure 2), whereas ESL2 and ESL3 have mainly an 18-exon structure (structure 1). Furthermore, 17-exon structures are highly represented in Brassicaceae, of which five structures have been identified, including one specific to ESL1 (structure 4), one specific to ESL2a (structure 8), two specific to the ESL3c (structures 6 and 7), and two others with less specificity (structures 5 and 3), to which a 16-exon structure specific to ESL2b is added (structure 9). Thus, we sought to determine whether there is a correlation between the observed structures and the different subgroups of monocots and Brassicaceae identified in the phylogenetic analysis, to highlight a possible link between ESL evolution and functional differences. In the phylogenetic analysis, 3 monocots (named as Mx) and 11 Brassicaceae (named as Bx) monophyletic groups were identified (Figures 2–5 and Supplementary Figure 2). Monocot 17-exon structure is only found in the group M1. Meanwhile, 18-exon structures are the majority in M2 and M3 groups. For the ESL1 of Brassicaceae, the group B1 contains 15 sequences and can be divided into two subgroups each of which containing at least one sequence of the six species and characterized either by the 17-exon structure 3 or 4. Brassicaceae ESL2a genes are divided into two subgroups B2 and B3 having six ESL with 17-exon structure 5 and four ESL with the 17-exon structure 3, respectively. For ESL2b genes, the group B4 contains six sequences having the 16-exon structure 9. For ESL3a, the group B5 contains five sequences with the 18-exon structure 1. ESL3b genes are divided into two subgroups B6, containing 13 sequences with the 18-exon structure 1, and B7, containing eight sequences with the 17-exon structure 3. ESL3c genes are split into four subgroups: B8 containing nine sequences with the 18-exon structure 1, B9 may be subdivided into two parts: one characterized by the 17-exon structure 7 and the other containing two different structures, the 17-exon structure 7 and the 18-exon structure 1, B10 is formed by 13 sequences with the 17-exon structure 5 and B11 contains 18 sequences characterized by the 18-exon structure 1. In summary, the ESL genes that belong to the same Brassicaceae group present the same gene structure except the cases of groups B1 and B9 for which, two or three structures are present, certainly because they could be divided into subgroups.
ESL Proteins From Monocots and Brassicaceae Present Conserved Protein Motifs
To identify the common features and differences between ESL proteins and other sugar transporters, we used the MEME website search program and compared the protein domains in 193 ESL sequences (67 monocots and 126 Brassicales), 197 MSTs, and 31 SUCs. We have identified (Supplementary Table 5) 2 motifs common to the 3 sugar transporter families, named as ST-1 and ST-2, found in 95 and 79% of the sequences, respectively, 2 motifs common to the STP, 10 motifs common to the tonoplast MSTs (TMT), and 6 motifs for polyol/MSTs (PLT). Furthermore, the eight protein motifs identified in MSTs were also present in 91–97% of the ESL sequences. All these motifs were already described in Saccharum (Zhang et al., 2021). 13 motifs (ESL-motif 1 - 13) might be specific to ESL as they were not identified in other MST and SUC carriers. ESL-motif 1 and ESL-motif 2 are present in 92% and 96% of the ESL sequences, which means the same in all ESL groups. All the monocot ESL1 have the ESL-motif 3 (RDSSVSALLCTLIVAL) and some of them, the ESL-motif 5 (MSFRDZESGGEDGGRT), and ESL-motif 6 (TSNRGGGGAGEESGSDHDGGLR). Among them, the ESL-motif 3 is the only one to be present in the Brassicales ESL1 proteins (Supplementary Figures 4, 5). The Brassicales ESL2 contain the ESL-motif 8 (VTEPLLQKERKEEDSE) and the ESL2b have in addition the ESL-motif 12 (REIKDVERGEIVNKVE), which was not detected in the ESL2 of monocots. Brassicales ESL3b are split into two groups B6 and B7 (Figure 10), which differ in the presence of ESL-motif 9 (SSSPSSSSSLLSEISNA1STRPFVLAFTVGSC) and the absence of ESL-motif 7 (AMVJLSTSVAVC) in the group B6, whereas, in the group B7, ESL-motif 7, ESL-motif 8, and ESL-motif 13 (SDKGIRVNDGDGDGPV) are present. About 18% of the ESL3c are characterized by ESL-motif 11 (MEEQRSMEKGLLLKKN). Finally, ESL-motif 10 (RERKFPNEDAFLETGLSRKSPR) is specific to the group B9b (Figure 10) of ESL3c Brassicales.
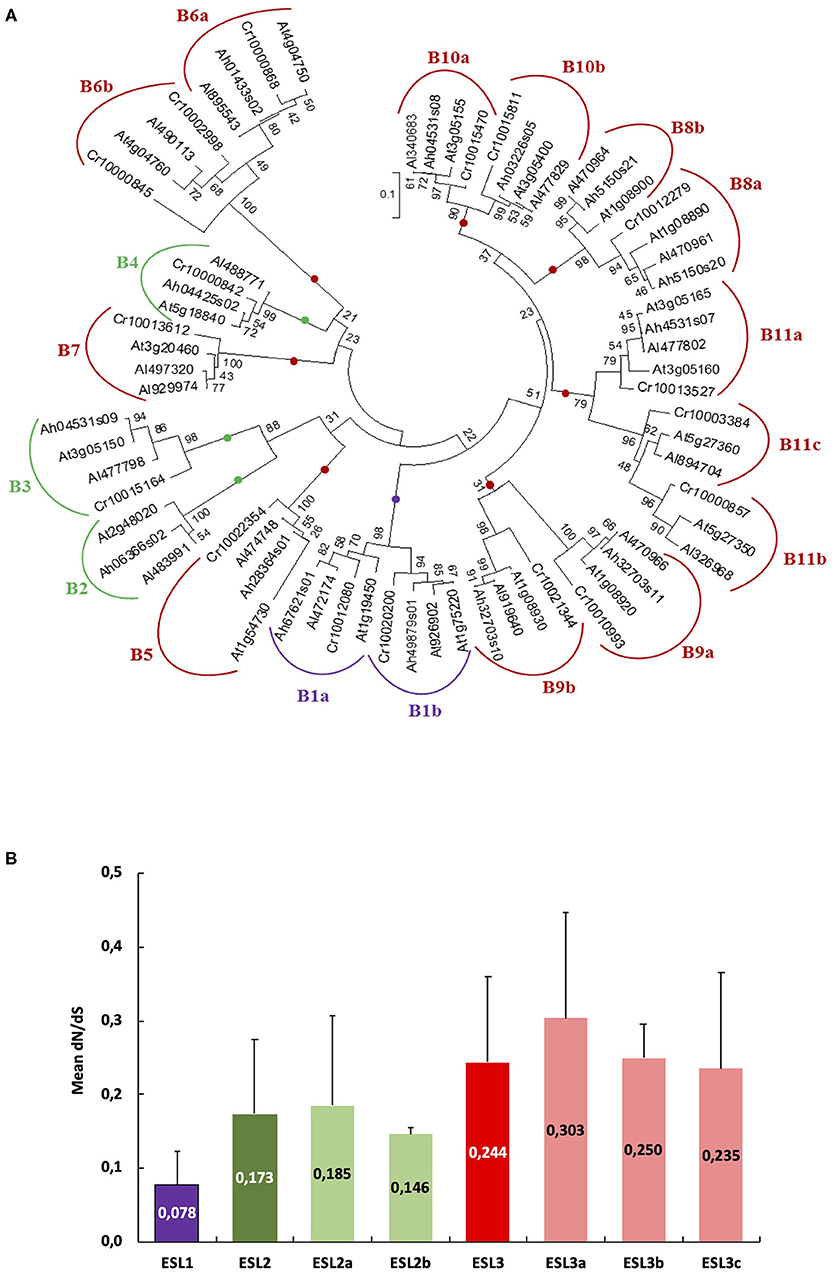
Figure 10. Nucleotide substitution analysis (dN/dS) for Arabidopsis ESL. (A) Phylogenetic tree produced via the alignment, using ClustalW, of 69 nucleotide ESL sequences from Arabidopsis halleri, Arabidopsis lyrata, Arabidopsis thaliana, and Capsella rubella used as an outgroup. The tree was built by using the software Molecular Evolutionary Genetics Analysis (MEGAv7, Tamura et al., 2013). JTT amino acid substitution model was used and the bootstrap consensus tree was inferred from 1,000 replicates. Purple is for ESL1, green for ESL2, and red for ESL3. (B) The means of the dN/dS values in each ESL group. Group ESL1 = 8 sequences, group ESL2 = 10 sequences, group ESL2a = 7 sequences, group ESL2b = 3 sequences, group ESL3 = 48 sequences, group ESL3a = 4 sequences, group ESL3b = 11 sequences, and group ESL3c =33.
ESL Transporters Genes in Arabidopsis Genus Are Under Negative Selection Pressure
For Brassicaceae, we identified 11 groups of ESL proteins (B1–B11), the presence of 68 tandem duplicated genes, and 7 different intron/exon structures. To better understand the evolutionary mechanisms involved in the genesis of the ESL Brassicaceae family, we aimed at determining the selection regime experienced by the family. We performed an analysis of nucleotide substitutions or dN/dS ratio for the Arabidopsis genus, the only one for which in our study the ESL genes have been identified in three different species (A. thaliana, A. halleri, and A. lyrata). The ESL sequences identified in C. rubella (another Brassicaceae) were used as an outgroup. To determine the number of alignments to be performed before calculating dN/dS ratios, a tree was built with the 65 CDSs of the three Arabidopsis and C. rubella (Figure 10A). 18 groups, named as B1 to B11c, could be defined. They correspond to the 11 groups of Brassicaceae identified in the phylogenetic tree of protein sequences (Figures 2–5). Considering all sequences, the average dN/dS ratio is 0.205, with the values always lower than 1 and ranging from 0.021 to 0.677. This indicates that the rate of non-synonymous substitutions is lower than that of synonymous substitutions. These results suggest that the ESL sequences are under a strong purifying (negative) selection pressure, which tends to conserve the sequences and potentially their functions. However, small differences can be detected between the means of the dN/dS ratios relative to each ESL group (Figure 10B). The value of the dN/dS ratio for the group ESL1 (0.078) is the lowest one, whereas the value of the group ESL3 is the highest (0.244) and the values of the subgroups ESL2a (0.185) and ESL2b (0.146) are intermediate. Among the ESL3 subgroups, ESL3a shows the highest value (0.303). This suggests that even if the ESL genes are under a purifying selection, the selection pressure might be less stringent for the ESL3 genes than for another ESL, especially ESL1.
Expression of Tandem Duplication Genes Presents Different Patterns in Arabidopsis Plant
To determine whether some of the functions of ESL genes are conserved or, on the contrary, diverge, we analyzed the expression of the ESL genes from A. thaliana. First and foremost, we propose a new nomenclature for those genes according to the three main ESL groups we have identified in the present phylogenetic analysis. The nomenclature (AtESL1.xx, AtESL2.xx, and AtESL3.xx), as summarized in Table 1, emphasizes the ESL name of the group they belong to. As two tandem duplicated genes AtESL3.09 (At5g05155) and AtESL3.12 (At5g05165) could not be analyzed because no specific primers could be designed, the expression level of 17 genes was measured in leaves, roots, buds, flowers, and siliques, by using real-time reverse transcription-PCR (qRT-PCR) (Figure 11). The two AtESL1 genes have median expression levels in the five tested organs, which range from 0.47 in roots and siliques to 0.82 in leaves for AtESL1.01 and from 0.68 in siliques to 1.06 in buds for AtESL1.02. AtESL1.02 is slightly more expressed than AtESL1.01 in all organs. The three AtESL2 genes present a lower expression level. AtESL2.01/ZIF2 and AtESL02.2 are constantly expressed in all organs, whereas AtESL2.03 is more expressed in roots (1.72 ± 0.94) than in the other organs (0.11 ± 0.81). AtESL3 genes present very diverse expression levels. AtESL3.02, AtESL3.03, AtESL3.04, and AtESL3.13/SFP1 are the least expressed ESL3 genes in all organs, and their expression level is equivalent to that of AtESL2 genes. On the contrary, AtESL3.08/ERD6 is the most expressed gene in all tested organs. Its expression level is 3.5 and 11 times more important in leaves and roots than the mean of the expression values for all ESL in the corresponding organs. AtESL3.01 is expressed in all organs but shows a weaker expression in roots. The other AtESL3c present clear organ specificities: AtESL3.05/ESL3 expression level is 3.5 times higher in leaves (1.74 ± 1.04) than in other organs (0.37 ± 0.34), AtESL3.06/ESL2 is more expressed in leaves (1.33 ± 0.45) and siliques (0.74 ± 0.31), AtESL3.07/ESL1 is more expressed in roots, flowers, and siliques than in leaves and buds, AtESL3.10, AtESL3.11, and AtESL3.14/SFP2 are more expressed in siliques (1.16 ± 0.63), leaves (1.09 ± 0.26), buds (1.12 ± 0.46), respectively. The normalization of the total mean expression in each organ highlights that six ESL (ESL3.08, ESL3.05, ESL3.06, ESL3.11, ESL1.02 and ESL1.01) are highly expressed in leaves, three (ESL3.8, ESL2.03, and ESL3.07) in roots, five (ESL3.08, ESL1.02, ESL3.10, ESL1.01, and ESL3.14) in buds, six (ESL3.08, ESL3.14, ESL1.02, ESL3.07, ESL3.10 and ESL1.01) in flowers and five (ESL3.08, ESL3.10, ESL3.07, ESL3.06, and ESL1.02) in siliques.
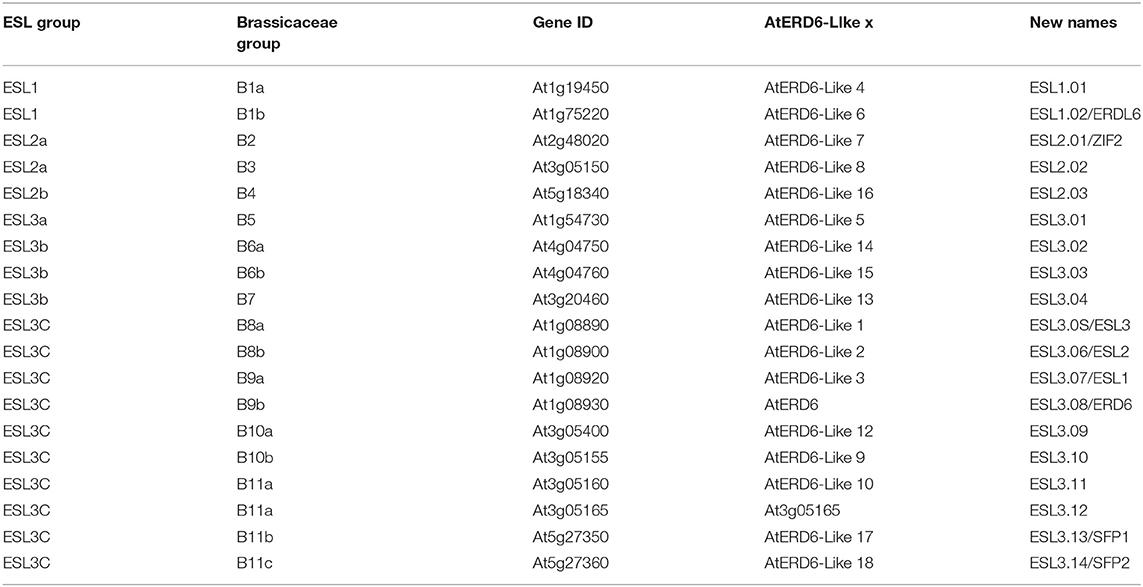
Table 1. Nomenclature of Arabidopsis thaliana early response to dehydration six-like (ESL) genes.
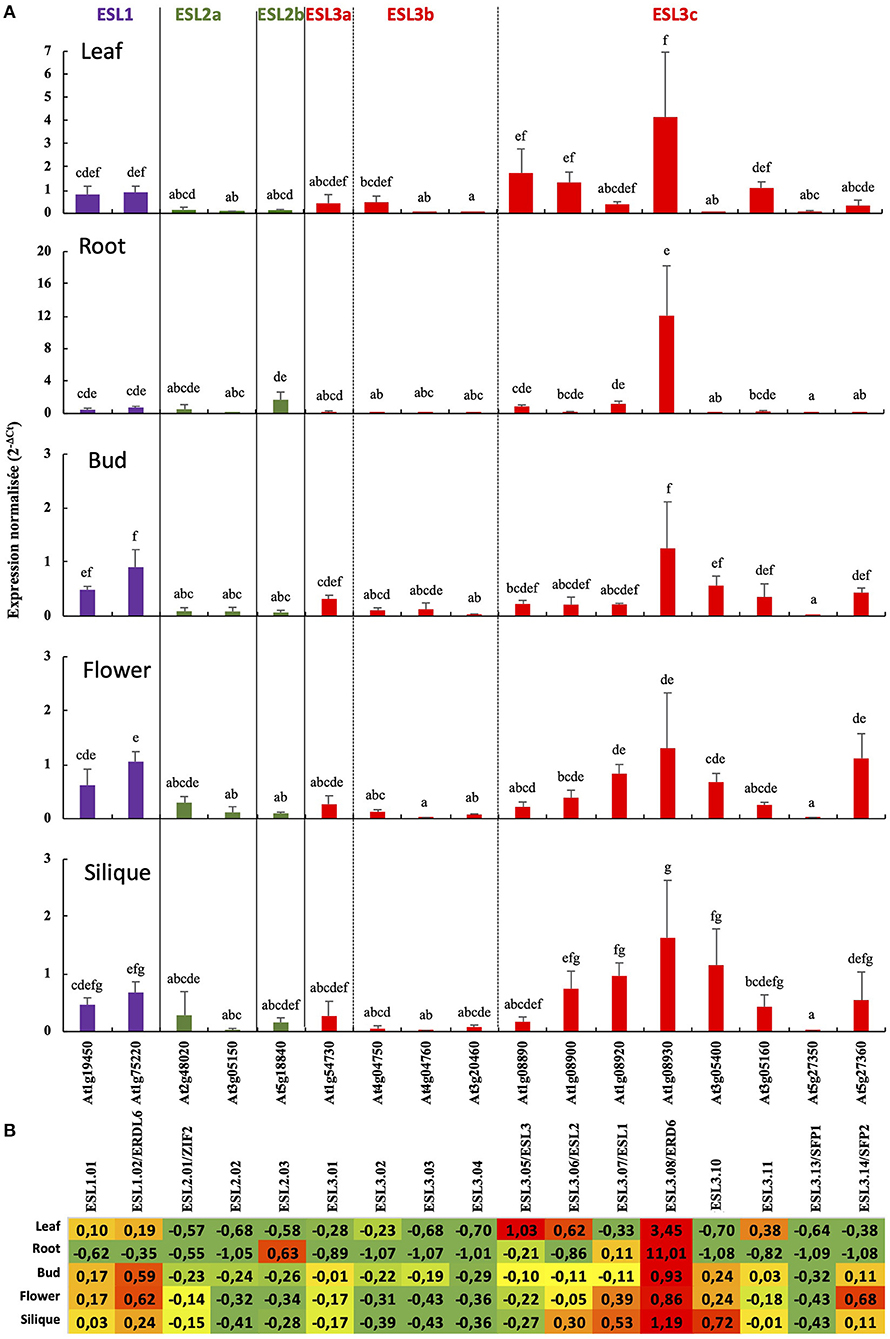
Figure 11. The relative expression of 17 A. thaliana ESL genes in different organs measured by real-time reverse transcription-PCR (qRT-PCR). (A) The 2−ΔCt values are normalized according to AtPP2a expression and represent the mean of 3 biological repeats (ecartype). Statistical analysis was performed using the Kruskal-Wallis test and the multiple comparison test of Dunn corrected by Bonferroni. Values significantly different are indicated by distinct letters. Purple is for ESL1, green for ESL2, and red for ESL3. (B) The ESL gene expression relative to the average expression of all ESL in each tested organs. The values indicated for each gene correspond to the variation from the mean of 2−ΔCt values determined for all ESL genes expressed in the considered organ. These means are equal to 0.71 in leaf, 1.09 in root, 0.32 in flower bud, 0.44 in flower, and 0.45 in silique. The relative expression values on a red, yellow or green background indicate that the expression of the considered gene is higher, equal or lower than the average of the mean expression of all ESL, in the indicated organ.
The bioinformatic analysis led to the identification of five tandem duplications (ESL2.02/ESL3.11, ESL3.02/ESL3.03, ESL3.05/ESL3.06, ESL3.07/ESL3.08, and ESL3.13 /ESL3.14). We therefore compared the expression patterns of tandem genes as well as that of the two ESL1 (Figure 12). The expression level of ESL1.01 and ESL1.02 is similar in all organs even if ESL1.01 is a little bit more expressed in flowers (Figure 12A). ESL3.11 is higher expressed in most organs and especially in leaves (36x) and siliques (14x) than ESL2.02 (Figure 12B). Compared to ESL3.03, ESL3.02 is significantly more expressed in leaves (16x), flowers (10.7x), and siliques (5x) (Figure 12C) even if the expression level of both genes is weak. No significant difference was observed between ESL3.05 and ESL3.06, which are expressed at the same level in all tested organs (Figure 12D). ESL3.07 and ESL3.08 have highly different expression levels in vegetative organs: compared to ESL3.07, ESL3.08 is more highly expressed in leaves (10.6x) and roots (10x), whereas, in reproductive organs, this difference disappears as both are weakly expressed. On the opposite, ESL3.13 and ESL3.14 present more different expression levels in reproductive organs than in vegetative organs. Compared to ESL3.13, ESL3.14 is 71.6x, 111x, and 91.6x times more expressed in buds, flowers, and siliques, respectively.
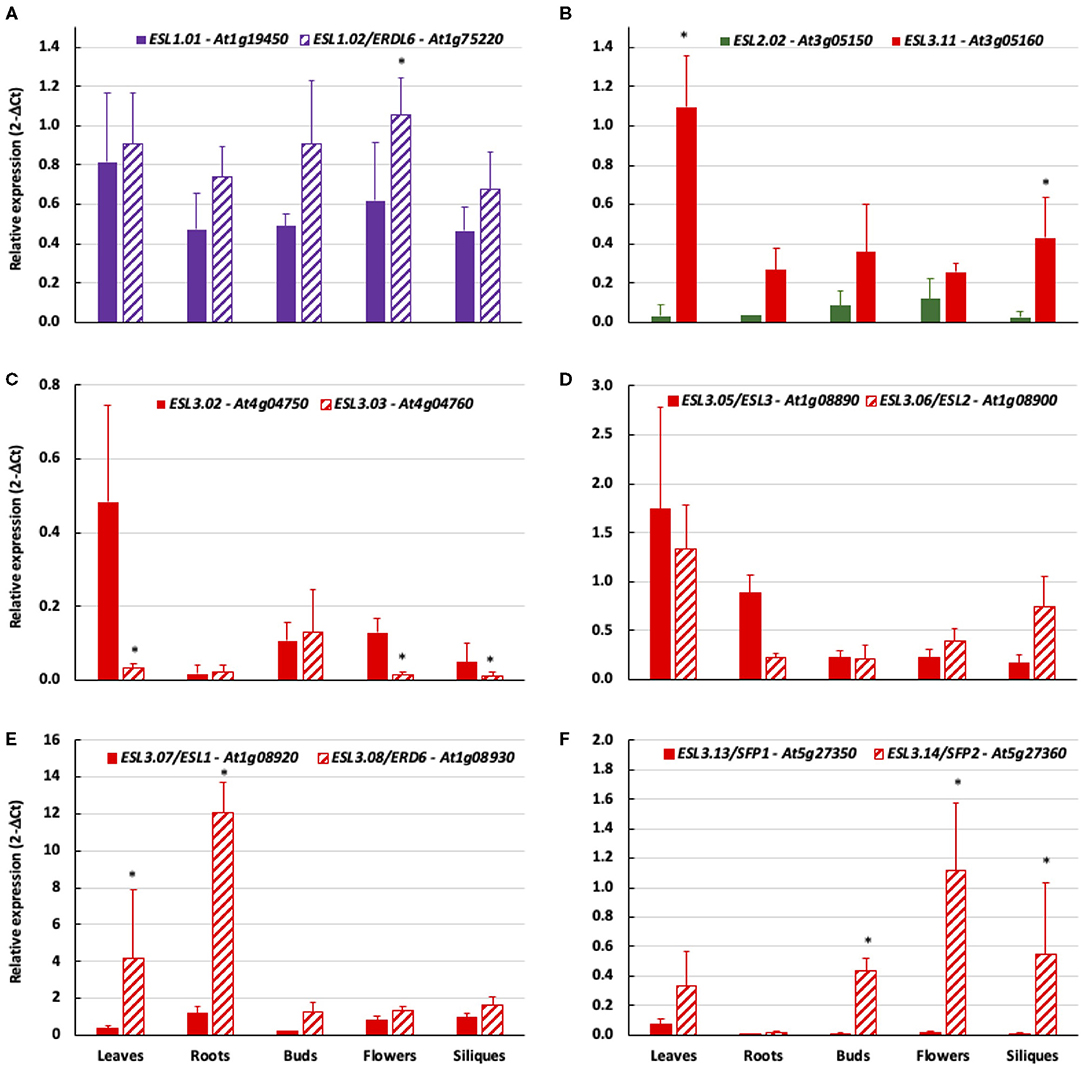
Figure 12. The comparison of the relative expression of tandem duplicated ESL genes in different organs measured by qRT-PCR. 2−ΔCt values are normalized according to AtPP2a expression and represent the mean of three biological repeats (± ecartype). Statistical analysis was performed by using the Kruskal–Wallis test and the multiple comparison test of Dunn corrected by Bonferroni. Values significantly different are indicated by distinct letters. (A) ESL1.01/ESL1.02, (B) ESL2.02/ESL3.11, (C) ESL3.02/ESL3.03, (D) ESL3.05/ESL3.06, (E) ESL3.07/ESL3.08, and (F) ESL3.13/ESL3.14.
Cis-Acting Elements Putatively Involved in the Transcriptional Regulation of AtESL Transporters
We performed a PLACE analysis on the 1-kb promoter region of each of the 19 AtESL, and found 186 cis-acting elements that were classified into three main categories: growth and development, hormone response, and stress response, the last ones are the most numerous ones (Supplementary Figure 3). 12 common motifs were found in all analyzed ESL genes (Supplementary Figure 3B). These motifs are highly repetitive (up to 27 copies), which might be due to their limited length (4–6 bases). Among the 12 cis-acting elements, some of the elements are able to regulate the expression in different plant organs such as leaves, pollen, and roots, and the rest of the elements are involved in hormonal signaling (cytokinin, gibberellic acid, and salicylic acid) or in response to biotic and abiotic environmental factors such as light and salinity. Interestingly, one motif (WBOXHVISO1: sequence TGACT) involved in sugar regulation, is present in all ESL promoters, in a few copies. Cis-elements regulating the expression in leaves or mesophyll cells are the most represented ones. In addition to the common cis-regulatory elements, we identified 30 cis-acting elements, which were only found in a single promoter, thereby suggesting expression specificity (Supplementary Table 4). Their length varied from 6 to 19 bp. Interestingly, among the 30 identified gene-specific motifs, 5 are only present in the ESL3.08/ERD6 promoter and 4 in ESL3.01 and ESL3.05/ESL3, whereas ESL1.02/ERDL6, ESL2.02, ESL3.03, ESL3.04, and ESL3.06/ESL2 do not have specific elements. These motifs can be grouped into different functional categories, which are related to hormonal regulation (6), abiotic stresses (5), cellular development (6), nutrition (3), and plant growth and development (1).
In silico analysis of AtESL promoters resulted in the identification of the 13 motifs that are potentially involved in sugar-regulated transcription (Figure 13A). We found cis-acting elements involved in sucrose induction such as SP8 and WBOXHVISO1 (sequences enabling the binding of some WRKY-type proteins in the example of SPF and SUSIBA2), SURE boxes (SURE2STPAT21), and the CGACGOSAMY3. Four elements are involved in sugar repression (ACGTABOX, SREATMSD, TATCCAYMOTIFOSRAMY3D, and PYRIMIDINEBOXOSRAMY1A), and 5 cis-elements are involved in common hormonal and metabolic (sugar) signal perception such as the GARC complex comprising the AMYBOX1 and 2, the MYBGAHV for gibberellins (GAs) induction and sugar repression, the PYRIMIDINE boxes for GAs, ABA, and TATCCOSAMY, a sequence enabling the binding of MYB proteins. It is noteworthy that the number and the distribution of these sugar elements are really different between the tandem duplicated copies with the exception of ESL3.13/SFP1 and ESL3.14/SFP2 and the two ESL1.
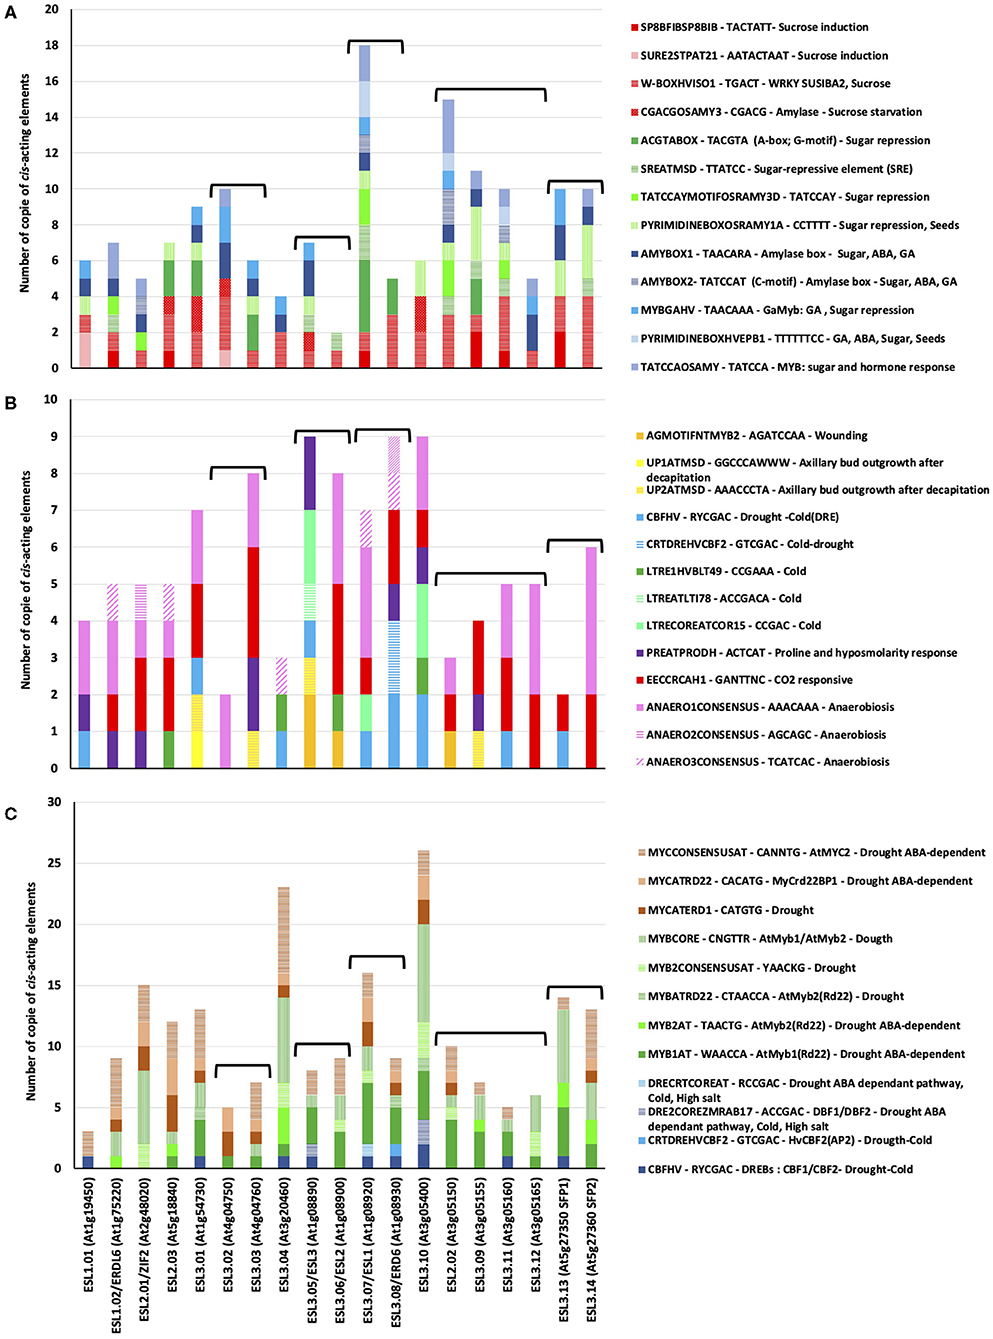
Figure 13. Sugar and stress Cis-regulatory elements found in the 1-kb promoter of Arabidopsis thaliana ESL genes. (A) Cis-elements involved in sugar regulation. (B) Cis-elements involved in abiotic stresses response. (C) Cis-elements involved in drought response.
We also found numerous cis-acting elements involved in diverse stress responses (Figure 13B). The two most abundant ones are the elements involved in anaerobiosis (ANAEROxCONCENSUS), which are found in all AtESL except ESL3.05/ESL2, ESL3.09, and ESL3.13 and a CO2-responsive element (EECCRAH1) found in most AtESL with the exception of ESL1.01, ESL3.02, and ESL3.05/ESL2. Five elements involved in cold response are mainly present in the promoter of ELS3 genes as well as three others involved in wounding and axillary bud outgrowth after decapitation. The number and the distribution of these elements are really different between ESL1.01 and ESL1.02 as well as the two tandem genes ESL3.07/ESL1 and ESL3.08/ERD6. Differences could be observed between the two pairs of tandem genes: ESL3.02 only has an ANAERO1CONSENSUS element, whereas ESL3.03 also has cis-elements for hypo-osmolarity, CO2, and wounding responses. ESL3.13/SPF1 has cis-elements involved in cold response, whereas ES13.14/SFP2 has elements for CO2 response. Finally, we detected numerous drought-responsive cis-elements in all AtESL promoters (Figure 13C) such as DREB or element enabling either the binding of MYB or MYC transduction factors. The cis-elements that seem to be most abundant are the MYB motifs. Some differences can be observed between ESL1.01 and ESL1.02, which does not have cis-acting elements for MYB but instead DREB elements, and the number of cis-acting elements in ESL3.07/ESL1 is higher than that found in ESL3.07/ERD6. This analysis suggests that AtESL might be differentially regulated by sugar, hormones, and diverse abiotic stresses such as drought and opens perspectives for future research.
Discussion
The present study provides evidence for the early origin of ESL MSTs in streptophytes. This hypothesis is based on the fact that no ESL was identified in any of the chlorophyte (eight species) and rhodophyte (three species) genomes as well as in that of the brown algae E. siliculosus, whereas a single ESL was identified in the genome of K. nitens (Figure 1). It is noteworthy that a high stringency imposed in the search of ESL proteins could be restrictive for the identification of MSTs in algae displaying a low level of homology to Embryophyta ESL. However, our conclusion is supported by the fact that carriers similar to sucrose and other MSTs have been identified in algae. SUC homologs have been identified in the genomes of the characean algae Chlorokybus atmosphyticus (Reinders et al., 2012), rhodophytes (C. merolae and G. sulphuraria), and chlorophytes (O. lucimarinus and O. tauri) (Peng et al., 2014), even though some chlorophytes do not have SUC homologs, such as C. reinhardtii and V. carterii (Reinders et al., 2012). Close homologs of MSTs (HUP1, HUP2, and HUP3) have been found in the green algae Chlorella (Sauer and Tanner, 1989; Caspari et al., 1994; Stadler et al., 1995; Johnson et al., 2006). However, they are more closely related to the STP monosaccharide transporter subfamily than to the ESL. Taken together, these data suggest the existence of some hexoses and SUCs in algae and support the hypothesis that ESL carriers have arisen after sucrose and STP transporters.
The identification of an ESL transporter in K. nitens is in agreement with the generally accepted hypothesis that the ancestors of terrestrial plants are closely related to the charophytes (Lewis and McCourt, 2004; Leliaert et al., 2012; Timme et al., 2012). The analysis of the genomes of K. flaccidum (Hori et al., 2014) and C. braunii reveals that both organisms have acquired several plant genes, involved in the production of phytohormone, tolerance to a high-intensity light and to reactive oxygen species, as well as transcription factors (Hori et al., 2014; Nishiyama et al., 2018). This suggests that charophytes have already acquired the necessary features required for an adaptation to terrestrial life, such as the tolerance to drought and freezing, as demonstrated for some Klebsormidium species (Morison and Sheath, 1985; Elster et al., 2008; Nagao et al., 2008; Karsten and Holzinger, 2012). As characterized ESL carriers have been described to be regulated in response to environmental constraints (cold, drought, high salinity, temperature, wounding, and heavy metals), they may be involved in the adaptation of streptophytes to terrestrial environments.
The presence of ESL in all analyzed embryophytes genomes, with a lower number of copies in bryophytes and lycophytes (one for S. fallax, two for M. polymorpha and S. moellendorffii, and three for P. patens) than in seed plants (3–37 copies), suggests that ESL carriers have undergone a significant expansion and have become a large multigenic family in angiosperms, particularly in eudicots. Our phylogenetic analysis of 519 ESL proteins identified in the proteomes of 47 Embryophytes provides evidence for the existence of three ESL monophyletic groups, namely ESL1, ESL2, and ESL3 (Figure 2). Group ESL1 encompasses the sequences from each studied embryophyte, including all copies present in the genomes of P. patens (bryophyte), S. moellendorffii (lycophyte), and half of those of P. taeda (gymnosperm) (Figure 3). Thus, group ESL1 may represent the most ancestral ESL group. The fact that the sequences of gymnosperms and angiosperms are the only ones to split into two distinct groups and that the sequences of P. taeda are located on the basis of both ESL2 and ESL3 groups (Figures 2, 3) suggest a diversification in the common ancestor of seed plants (Figure 14). This event may match the most ancient whole genome duplication (WGD) named as paleopolyploidy (or ζ) which occurred approximately 340 MYA in the common ancestors of all spermaphytes (Jiao et al., 2011). Similarly, mesangiosperm sequences are split to form ESL2 and ESL3 groups, whereas the ESL sequences of the basal angiosperm A. trichopoda are present only on the basis of group ESL2 and are absent in group ESL3, which is therefore specific to mesangiosperms. These observations suggest a second diversification event in the common ancestor of the mesangiosperms (Figure 14), which could be related to the WGD ε described in the angiosperm lineage with the occurrence of 170–235 MYA (Jiao et al., 2011). The ESL3 group can be clearly divided into three subgroups, namely ESL3a, ESL3b, and ESL3c. The sequences of the monocots and of the basal eudicots: A. coerulea and N. nucifera only belong to the ESL3a and are excluded from the ESL3b and ESL3c groups, which thus represent Pentapetalae- (rosids and asterids) specific subgroups. This suggests a third diversification event in the common ancestor of the Pentapetalae (Figure 14), possibly corresponding to the whole genome triplication event (WGT) γ/1R that has been placed early in the evolution of eudicots evolution, around 117 MYA, before the separation of rosids and asterids and after the split of monocots and dicots (Jiao et al., 2012). This event witnessed the existence of an ancient hexaploidy for the eudicots. The absence of sequences of the basal eudicots in the groups ESL3b and ESL3c is in total agreement with the fact that the γ/1R triplication event has been placed after the divergence of the ranunculales and core eudicots (Jiao et al., 2012) and that the genome of N. nucifera has undergone another duplication event named λ (Ming et al., 2013). The fact that monocots are also not present in ESL3b and ESL3c groups is in agreement with the description of two important WGD, named ρ and σ, that have occurred before the divergence of Poaceae and are independent of the γ/1R event (Blanc and Wolfe, 2004; Paterson et al., 2004; Tang et al., 2010; D'Hont et al., 2012). Thus, we suggest that the ESL3b and ESL3c sequences, the only sequences from Vitaceae, Eurosids, and asterids, may be related to the γ/1R triplication event (Figure 14). However, ESL3b and ESL3c copies may also be the marks of more recent duplication events. Such events have been described for Salicaceae (Tuskan et al., 2006), Fabaceae (Cannon et al., 2005, 2006; Sato et al., 2008; Varshney et al., 2013) M. domestica (Velasco et al., 2010), and Malvaceae (Argout et al., 2011; Wang et al., 2012). For Brassicaceae, in addition to the γ/1R, 2 WGD, named as α/3R and β/2R (Bowers et al., 2003; Jiao et al., 2011), have been described to occur after the divergence of Brassicaceae and Caricaceae around 47 and 124 MYA, respectively (Kagale et al., 2014). The six Brassicaceae ESL groups observed in ESL3b and ESL3c groups might, therefore, be related to these three WGD events. In addition, the genus Brassica underwent a triplication (WGT) event around 7.9 and 14.6 MYA (Lysak et al., 2005; Beilstein et al., 2010), which could explain the high number of ESL genes (30 genes) identified in B. rapa genome. Segmental duplications may also explain the ESL diversification. It might be the case for L. usitatissimum, for which a specific WGD event detected around 5–9 MYA has been described, as well as numerous segmental duplications (Wang et al., 2012).
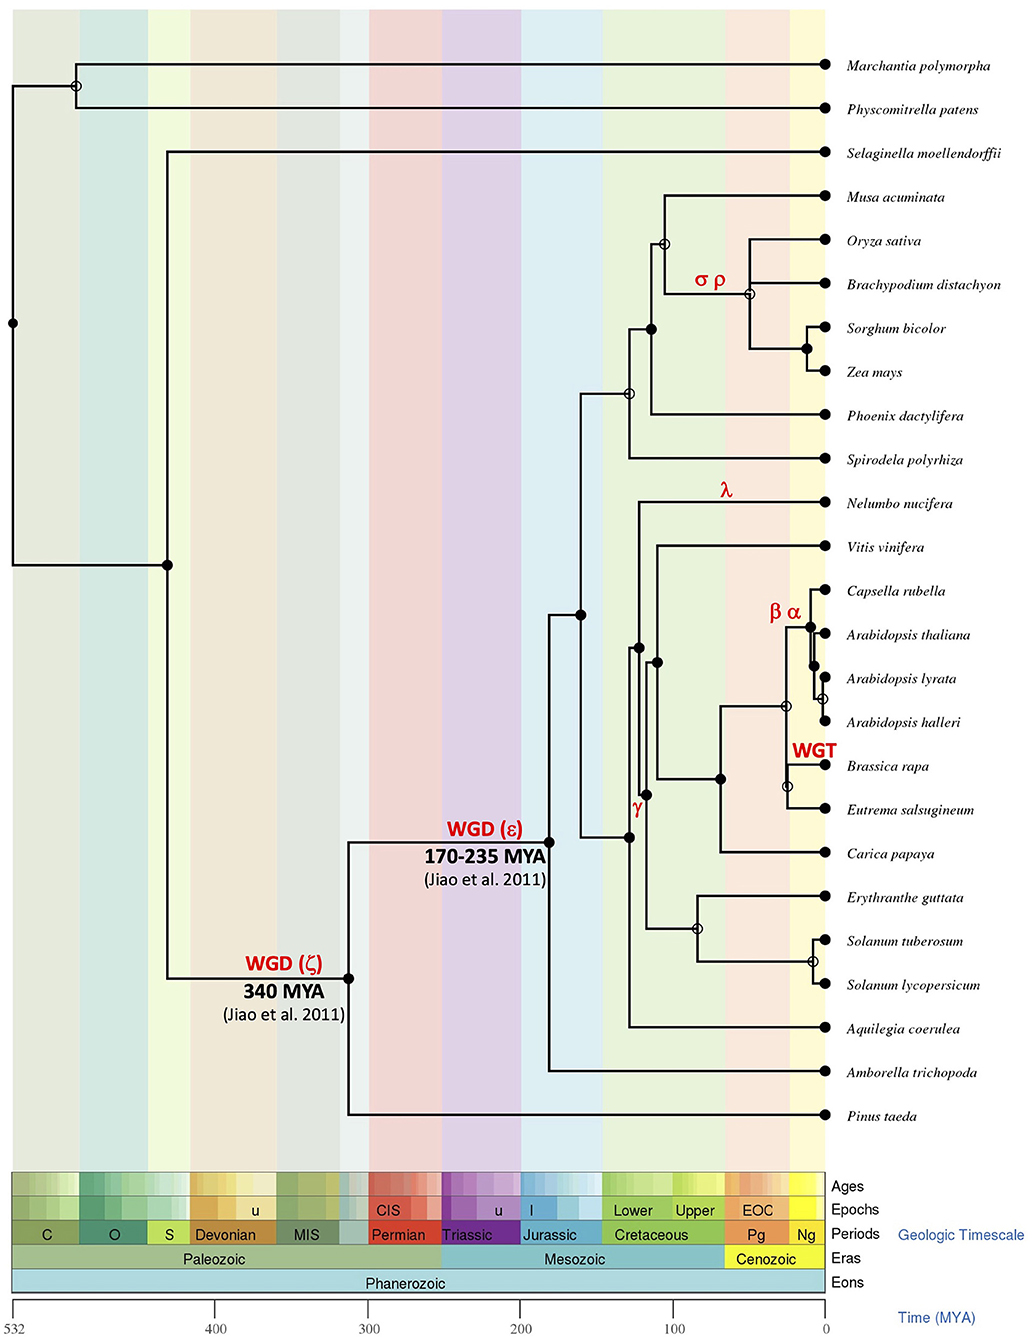
Figure 14. The phylogenetic tree inference of the evolution of ESL genes in the plant kingdom. All dates, periods, and evolutionary data used to rebuild the evolutionary history of the ESL family through the evolution of land plants were obtained from the Time Tree of Life (http://www.timetree.org, Hedges et al., 2006; Kumar et al., 2017). For readability reasons, only the most striking species have been considered. Major duplication events are indicated according to the literature.
An interesting result is the observation of a high number of tandem duplications in the ESL subfamily. We identified 246 duplicated genes representing 47% of the 519 analyzed ESL. Their proportion varies with ESL groups. Furthermore, tandem duplicated genes are presented more in number in the ESL3c group compared with ESL3a and ESL3b. In this regard, we observed a good correlation between the number of tandem duplicated ESL3c genes and the total number of ESL3 per species (Figure 7, Supplementary Figure 1, and Supplementary Table 3). ESL3c tandem duplications are dominant in Vitis, Eurosids, and Solanales but were not detected in Fabales, Rosaceae, Cucurbitales, and Phrymaceae. For Fabales, this is certainly correlated to a weaker expansion of ESL genes than those observed for other monosaccharide carrier subfamilies such as STP, PLT, and INT (Johnson et al., 2006; Doidy et al., 2019). E. grandis presents a remarkable expansion with 37 ESL genes among which 25 are genes in tandem repeats (67.6%). The observation is in agreement with the study of Myburg et al. (2014), who described in this species the largest number of genes in tandem repeats (34% of the total genes). These results suggest that tandem duplications are also involved in the expansion of the ESL family, in particular for ESL3c genes. The analysis of the phylogenetic distribution of tandem duplications in the seven Brassicales genomes (six Brassicaceae and one Caricaceae) suggests that those are specific to Brassicaceae and therefore are unrelated to genome doubling events alpha, beta, and to the specific Brassica WGT. Based on the Time Tree of Life, this translates into 25.6–68 MYA. It has been reported that tandem duplicated genes, which are retained in a lineage-specific manner, are mostly responsive to environmental biotic (Hanada et al., 2008) or abiotic (Zhang et al., 2016) stimuli. Likewise, the observation of a high number of tandem duplications for ESL suggests the involvement of these transporters in response to environmental cues, such as those already demonstrated for both abiotic (Kiyosue et al., 1998; Quirino et al., 2001; Yamada et al., 2010; Poschet et al., 2011; Remy et al., 2014) or biotic stresses (Breia et al., 2020) for few ESL.
The analysis of non-synonymous and synonymous mutations using the dN/dS ratios of the ESL copies of the genus Arabidopsis revealed that all these recently diverged genes are subjected to a purifying selection, acting in favor of the sequence conservation at the protein level and, consequently, of their functions as sugar transporters. It is noteworthy that the dN/dS value increases progressively from the group ESL1 (dN/dS = 0.081) through the group ESL2 (dN/dS = 0.172) to the group ESL3 (dN/dS = 0.233), suggesting a slow decrease of the selection pressure. Even though the threshold of one is not reached, we speculate that the progressive increase of dN/dS ratio acts in favor of neutralization or subdiversification toward a possible acquisition of novel functions by ESL MSTs.
As structural changes in protein-coding regions are a phenomenon that can lead to subfunctionalization or neofunctionalization following gene duplication, we analyzed the protein motifs for 421 sequences, including ESL, MST, and SUC as well as the gene structure of the 519 identified ESL. We found two conserved protein motifs common to ESL and other sugar transporters and eight motifs conserved with the monosaccharide carriers. The different ESL groups discriminate in the presence or the absence of particular motifs located preferentially in the N-term region. We determined 10 major gene structure types, including 1 specific to ESL1 of monocots, 1 specific to ESL2a of Rutaceae, 1 specific to ESL2b of Solanaceae, and 6 specific to Brassicaceae. The first one, named as structure 1, is an 18-exon structure found in more than 50% of the ESL sequences, including those from early diverging species. Thus, it seems likely to be an ancestral type that has been preserved throughout evolution. The other 9 17-exon and 16-exon structures have probably appeared in the course of evolution by an intron loss. This hypothesis is in agreement with the literature as it was reported for Arabidopsis and rice, that after gene duplication, the rate of intron loss is higher than that of intron gain (Roy and Gilbert, 2005; Lin et al., 2006). However, it is surprising that ESL1 for monocots and Brassicaceae, which might represent ancient copies, present a 17-exon structure (structures 2 and 4; Figure 9), which implies a more complex evolution. As the exon and intron boundaries play key roles in the evolution of multigene families, the structure of the sugar transporter genes has been analyzed in pears (Pyrus bretschneideri Rehd), and it has been demonstrated that the exon numbers of its 75 sugar transporter genes range from 2 to 18 (Li et al., 2015). Our results are in agreement with already demonstrated differences in the structure of different sugar transporter subfamilies, where the PLT, TMT, INT, and STP display more conserved structures with an exon number restricted between one and six, whereas pGlcT, SUT, SFP, and VGT have more exons, ranging from 2 to 18 (Li et al., 2015; Zhang et al., 2021). Taken together our results and data from the literature, it was revealed that exon gain and loss occurring during the evolution of the sugar transporter gene family might lead to the functional diversity of closely related genes.
Although AtESL expression levels are variable from gene to gene in A. thaliana organs, our expression analysis has shown that the expression of 17 genes could be detected in 5 organs, demonstrating that they are all expressed. On the contrary, ESL3.09 (At3g05155) and ESL3.12 (At3g05165) could not be amplified nor analyzed as no specific primers could be correctly designed. This is in agreement with the fact that no expression data are available in the Genevestator and BAR databases, suggesting that they are pseudogenes. At least for ESL3.09 (At3g05155), this is corroborated by its short sequence presenting only 13 exons. ESL1.01 and ESL1.02 are expressed more or less constitutively in all tested organs and in similar levels. The lack of organ specificity for these ESL1 genes potentially allows them to respond to a wide range of developmental and/or environmental signals. This is consistent with the hypothesis that ESL1 genes are related to the copies present in the genomes of P. patens (moss) and S. moellendorffii (fern). ESL2 genes are rather weakly expressed and only ESL2.03 shows a preferential expression in roots. In our experimental conditions, ESL2.01/ZIF2, is a weakly expressed gene, maybe slightly more expressed in roots, flowers, and siliques. This is in agreement with Remy et al. (2014) who showed a higher expression in roots and flowers. However, they have identified differences in the expression levels of two splice variants, which were not taken into account in our study. For ESL3 genes, our results highlight a low level of expression for ESL3.03, ESL3.04, and ESL3.1/SFP13 and the fact that ESL3.08/ERD6 is the most expressed ESL in all tested organs. We demonstrate a preferential expression pattern of ESL3.08/ERD6 in vegetative organs than in reproductive organs, and conversely, the highest expression of ESL3.10 in reproductive organs compared to vegetative ones, especially in siliques. The AtESL3c genes, whose dN/dS within the genus Arabidopsis suggests relaxed negative selection pressure, show different expression patterns in the five tested organs. This suggests a more rapid evolution and some subfunctionalization for these copies. Among the ESL tandem pairs, no or weak differences in the expression between the two copies could be detected for the two pairs ESL1.01/ESL1.02 and ESL3.05/ESL3.06. Inversely, a highly significant differential expression is clearly demonstrated for the following tandems: ESL2.02/ESL3.11 in leaves and siliques; ESL3.02/ESL3.03 in leaves, flowers, and siliques; ESL3.13/ESL3.14 in reproductive organs; and ESL3.07/ESL3.08 in vegetative organs. ESL3.13/SFP1 shows a weaker expression than ESL3.14/ SFP2 in all organs and is the weakest expressed ESL3c. This result corroborates the Northern blot analysis demonstrating that ESL3.13/SFP1 is undetectable in young and fully expanded leaves, stems, and roots, whereas ESL3.14/SFP2 is expressed in these organs (Quirino et al., 2001). ESL3.13/SFP1 is strongly expressed in seedlings and is highly induced in senescent leaves, whereas ESL3.14/SFP2 is not (Quirino et al., 2001). ESL3.08/ERD6 is more expressed than ESL2.08/ESL1 at least in leaves, roots, and buds. This result is in perfect accordance with the results of Yamada et al. (2010), who also showed that ESL3.08/ERD6 is more expressed than ESL2.08/ESL1 in the leaves from the plants growing under normal conditions. They also determined that the transcriptional activity conferred by the promoters of ESL3.08/ERD6 and ESL3.07/ESL1 is preferentially located in the same organs, i.e., shoots, sepals, and roots. In roots, ESL3.08/ERD6 is specifically expressed in epidermal and cortical cells, whereas ESL3.07/ESL1 is expressed in endoderm, pericycle, and xylemic parenchyma cells (Yamada et al., 2010). The latter data and our own results showing differential and organ-preferential expression suggest possible mechanisms of subfunctionalization for most tandem duplicated AtESL.
Conclusion
The authors performed an evolutionary analysis of plant ESL transporters using the protein sequences from various species representing the main groups of the plant kingdom and demonstrated that these genes arose with streptophytes and have considerably diversified in Embryophytes. Even though the AtESL genes are evolving under a purifying selection, their highly variable gene structure and organ-preferential expression emphasize the onset of a plausible diversification. A plethora of promoter cis-acting elements tightly related to developmental and environmental cues opens novel perspectives for further elucidation of their biological functions.
Data Availability Statement
The original contributions presented in the study are included in the article/Supplementary Material, further inquiries can be directed to the corresponding author/s.
Author Contributions
FD, LS, ML, RA, and RC designed the experiments, discussed the data, and revised the article. AI, CP, FT, and LS performed the experiments. FD, LS, ML, and RA wrote the article. All authors approved the final manuscript.
Funding
This study was funded by the 2015–2020 State-Region Planning Contracts (CPER), European Regional Development Fund (FEDER), and intramural funds from the Centre National de la Recherche Scientifique and the University of Poitiers.
Conflict of Interest
The authors declare that the research was conducted in the absence of any commercial or financial relationships that could be construed as a potential conflict of interest.
Publisher's Note
All claims expressed in this article are solely those of the authors and do not necessarily represent those of their affiliated organizations, or those of the publisher, the editors and the reviewers. Any product that may be evaluated in this article, or claim that may be made by its manufacturer, is not guaranteed or endorsed by the publisher.
Acknowledgments
The authors would like to thank Vincent Lebeurre for plant production. They acknowledge Mathilde Aimé, Armand Vergnault, and Vianney Souday, three students who contributed to this study, especially for gene structure and protein motif identification. They gratefully thank Hristo Atanassov for the revision of the manuscript.
Supplementary Material
The Supplementary Material for this article can be found online at: https://www.frontiersin.org/articles/10.3389/fpls.2021.681929/full#supplementary-material
Supplementary Figure 1. The linear correlation of the number of tandem duplicated early response to dehydration six-like (ESL). (A) The total number of duplicated ESL with the total number of ESL in each species. (B) The total number of duplicated ESL3 with the total number of ESL in each species. (C) The total number of eudicots duplicated ESL3 with the total number of ESL in each eudicots species. (D) The total number of eudicots duplicated ESL3c with the total number of ESL in each eudicots species. (E) The total number of eudicots duplicated ESL3c with the total number of ESL3 in each eudicots species.
Supplementary Figure 2. Brassicaceae and monocot ESL gene structures. Blue rectangles are for exons and lines are for introns. Exons are represented with the same scale and introns with the same length. Red numerals indicate the number of exons.
Supplementary Figure 3. Cis-regulatory elements found in the 1-kb promoter of A. thaliana ESL genes. (A) The distribution of cis-elements according to their specificity. (B) Common motifs found in all analyzed ESL genes.
Supplementary Figure 4. The maximum likelihood phylogeny of monocot ESL sugar transporter proteins and conserved protein motifs. The tree was produced by aligning 67 amino acid ESL sequences identified in 10 species (Spo, Pd, Ph, Pvi, Si, Sb, Bd, Ma, Os, and Zm) using ClustalW and then build using the software Molecular Evolutionary Genetics Analysis (MEGAv10). Jones–Taylor–Thornton (JTT) amino acid substitution model was used and the bootstrap consensus tree was inferred from 1,000 replicates. Motifs were determined by using MEME.
Supplementary Figure 5. The maximum likelihood phylogeny of Brassicales ESL sugar transporter proteins and conserved protein motifs. The tree was produced by aligning the 126 amino acid ESL sequences identified in 7 species (Ah, Al, At, Br, Cp, Cr, and Th) using ClustalW and then build using the software Molecular Evolutionary Genetics Analysis (MEGAv10). JTT amino acid substitution model was used and the bootstrap consensus tree was inferred from 1,000 replicates. Motifs were determined by using MEME.
Supplementary Table 1. Early response to dehydration six-like (ESL) genes identified in this study.
Supplementary Table 2. Primers used for the expression analysis of AtESL par real-time reverse transcription-PCR (qRT-PCR).
Supplementary Table 3. Number of ESL genes and tandem duplicated ESL identified in this study.
Supplementary Table 4. Unique cis-acting elements identified only in the promoter sequence of a single Arabidopsis thaliana ESL transporter gene.
Supplementary Table 5. Protein motifs identified in the sequence of ESL and other sugar transporters proteins. For one motif, each line represents a single analysis performed with a set of sequences indicated in the last column entitled “Analyzed transporters.” The analysis was performed by using an E-value < E−60; however, a few motifs with a higher E-value are presented as they are specific to ESL group containing few genes.
References
Afoufa-Bastien, D., Medici, A., Jeauffre, J., Coutos-Thévenot, P., Lemoine, R., Atanassova, R., et al. (2010). The Vitis vinifera sugar transporter gene family: phylogenetic overview and macroarray expression profiling. BMC Plant Biol. 10, 245. doi: 10.1186/1471-2229-10-245
Altschul, S. (1997). Gapped BLAST and PSI-BLAST: a new generation of protein database search programs. Nucleic Acids Res. 25, 3389–3402. doi: 10.1093/nar/25.17.3389
Antony, E., Taybi, T., Courbot, M., Mugford, S. T., Smith, J. A. C., and Borland, A. M. (2007). Cloning, localization and expression analysis of vacuolar sugar transporters in the CAM plant Ananas comosus (pineapple). J. Exp. Bot. 59, 1895–1908. doi: 10.1093/jxb/ern077
Argout, X., Salse, J., Aury, J.-M., Guiltinan, M. J., Droc, G., Gouzy, J., et al. (2011). The genome of Theobroma cacao. Nat. Genet. 43, 101–108. doi: 10.1038/ng.736
Beilstein, M. A., Nagalingum, N. S., Clements, M. D., Manchester, S. R., and Mathews, S. (2010). Dated molecular phylogenies indicate a Miocene origin for Arabidopsis thaliana. Proc. Natl. Acad. Sci. U.S.A. 107, 18724–18728. doi: 10.1073/pnas.0909766107
Blanc, G., and Wolfe, K. H. (2004). Widespread paleopolyploidy in model plant species inferred from age distributions of duplicate genes. Plant Cell 16, 1667–1678. doi: 10.1105/tpc.021345
Bowers, J. E., Chapman, B. A., Rong, J., and Paterson, A. H. (2003). Unravelling angiosperm genome evolution by phylogenetic analysis of chromosomal duplication events. Nature 422, 433–438. doi: 10.1038/nature01521
Breia, R., Conde, A., Conde, C., Fortes, A. M., Granell, A., and Gerós, H. (2020). VvERD6l13 is a grapevine sucrose transporter highly up-regulated in response to infection by Botrytis cinerea and Erysiphe necator. Plant Physiol. Biochem. 154, 508–516. doi: 10.1016/j.plaphy.2020.06.007
Büttner, M. (2007). The monosaccharide transporter(-like) gene family in Arabidopsis. FEBS Lett. 581, 2318–2324. doi: 10.1016/j.febslet.2007.03.016
Cannon, S. B., Crow, J. A., Heuer, M. L., Wang, X., Cannon, E. K. S., Dwan, C., et al. (2005). Databases and information integration for the Medicago truncatula genome and transcriptome. Plant Physiol. 138, 38–46. doi: 10.1104/pp.104.059204
Cannon, S. B., Sterck, L., Rombauts, S., Sato, S., Cheung, F., Gouzy, J., et al. (2006). Legume genome evolution viewed through the Medicago truncatula and Lotus japonicus genomes. Proc. Natl. Acad. Sci. U.S.A. 103, 14959–14964. doi: 10.1073/pnas.0603228103
Caspari, T., Stadler, R., Sauer, N., and Tanner, W. (1994). Structure/function relationship of the Chlorella glucose/H+ symporter. J. Biol. Chem. 269, 3498–3502
Chen, L.-Q., Hou, B.-H., Lalonde, S., Takanaga, H., Hartung, M. L., Qu, X.-Q., et al. (2010). Sugar transporters for intercellular exchange and nutrition of pathogens. Nature 468, 527–532. doi: 10.1038/nature09606
Czechowski, T., Stitt, M., Altmann, T., Udvardi, M. K., and Scheible, W.-R. (2005). Genome-wide identification and testing of superior reference genes for transcript normalization in Arabidopsis. Plant Physiol. 139, 5–17. doi: 10.1104/pp.105.063743
Delport, W., Poon, A. F. Y., Frost, S. D. W., and Kosakovsky Pond, S. L. (2010). Datamonkey 2010: a suite of phylogenetic analysis tools for evolutionary biology. Bioinforma. Oxf. Engl. 26, 2455–2457. doi: 10.1093/bioinformatics/btq429
Deng, X., An, B., Zhong, H., Yang, J., Kong, W., and Li, Y. (2019). A novel insight into functional divergence of the MST gene family in rice based on comprehensive expression patterns. Genes 10:239. doi: 10.3390/genes10030239
Desrut, A., Moumen, B., Thibault, F., Le Hir, R., Coutos-Thévenot, P., and Vriet, C. (2020). Beneficial rhizobacteria Pseudomonas simiae WCS417 induce major transcriptional changes in plant sugar transport. J. Exp. Bot. 71, 7301–7315. doi: 10.1093/jxb/eraa396
D'Hont, A., Denoeud, F., Aury, J.-M., Baurens, F.-C., Carreel, F., Garsmeur, O., et al. (2012). The banana (Musa acuminata) genome and the evolution of monocotyledonous plants. Nature 488, 213–217. doi: 10.1038/nature11241
Doidy, J., Vidal, U., and Lemoine, R. (2019). Sugar transporters in Fabaceae, featuring SUT MST and SWEET families of the model plant Medicago truncatula and the agricultural crop Pisum sativum. PLoS ONE 14, e0223173. doi: 10.1371/journal.pone.0223173
Elster, J., Degma, P., Kováčik, L., Valentov,á, L., Šramkov,á, K., and Batista Pereira, A. (2008). Freezing and desiccation injury resistance in the filamentous green alga Klebsormidium from the Antarctic, Arctic and Slovakia. Biologia 63, 843–851. doi: 10.2478/s11756-008-0111-2
Hanada, K., Zou, C., Lehti-Shiu, M. D., Shinozaki, K., and Shiu, S.-H. (2008). Importance of lineage-specific expansion of plant tandem duplicates in the adaptive response to environmental stimuli. Plant Physiol. 148, 993–1003. doi: 10.1104/pp.108.122457
Hedges, S. B., Dudley, J., and Kumar, S. (2006). TimeTree: a public knowledge-base of divergence times among organisms. Bioinforma. Oxf. Engl. 22, 2971–2972. doi: 10.1093/bioinformatics/btl505
Higo, K., Ugawa, Y., Iwamoto, M., and Korenaga, T. (1999). Plant cis-acting regulatory DNA elements (PLACE) database: 1999. Nucleic Acids Res. 27, 297–300. doi: 10.1093/nar/27.1.297
Hori, K., Maruyama, F., Fujisawa, T., Togashi, T., Yamamoto, N., Seo, M., et al. (2014). Klebsormidium flaccidum genome reveals primary factors for plant terrestrial adaptation. Nat. Commun. 5:3978. doi: 10.1038/ncomms4978
Hu, B., Jin, J., Guo, A.-Y., Zhang, H., Luo, J., and Gao, G. (2015). GSDS 2.0: an upgraded gene feature visualization server. Bioinforma. Oxf. Engl. 31, 1296–1297. doi: 10.1093/bioinformatics/btu817
Jiao, Y., Leebens-Mack, J., Ayyampalayam, S., Bowers, J. E., McKain, M. R., McNeal, J., et al. (2012). A genome triplication associated with early diversification of the core eudicots. Genome Biol. 13, R3. doi: 10.1186/gb-2012-13-1-r3
Jiao, Y., Wickett, N. J., Ayyampalayam, S., Chanderbali, A. S., Landherr, L., Ralph, P. E., et al. (2011). Ancestral polyploidy in seed plants and angiosperms. Nature 473, 97–100. doi: 10.1038/nature09916
Johnson, D. A., Hill, J. P., and Thomas, M. A. (2006). The monosaccharide transporter gene family in land plants is ancient and shows differential subfamily expression and expansion across lineages. BMC Evol. Biol. 6:64. doi: 10.1186/1471-2148-6-64
Johnson, D. A., and Thomas, M. A. (2007). The monosaccharide transporter gene family in Arabidopsis and rice: a history of duplications, adaptive evolution, and functional divergence. Mol. Biol. Evol. 24, 2412–2423. doi: 10.1093/molbev/msm184
Kagale, S., Robinson, S. J., Nixon, J., Xiao, R., Huebert, T., Condie, J., et al. (2014). Polyploid evolution of the Brassicaceae during the Cenozoic era. Plant Cell 26, 2777–2791. doi: 10.1105/tpc.114.126391
Karsten, U., and Holzinger, A. (2012). Light, temperature, and desiccation effects on photosynthetic activity, and drought-induced ultrastructural changes in the green alga Klebsormidium dissectum (Streptophyta) from a high alpine soil crust. Microb. Ecol. 63, 51–63. doi: 10.1007/s00248-011-9924-6
Kay, R., Chan, A., Daly, M., and McPherson, J. (1987). Duplication of CaMV 35S promoter sequences creates a strong enhancer for plant genes. Science 236, 1299–1302. doi: 10.1126/science.236.4806.1299
Kiyosue, T., Abe, H., Yamaguchi-Shinozaki, K., and Shinozaki, K. (1998). ERD6, a cDNA clone for an early dehydration-induced gene of Arabidopsis, encodes a putative sugar transporter. Biochim. Biophys. Acta 1370, 187–191. doi: 10.1016/s0005-2736(98)00007-8
Kiyosue, T., Yamaguchi-Shinozaki, K., and Shinozaki, K. (1994). Cloning of cDNAs for genes that are early-responsive to dehydration stress (ERDs) in Arabidopsis thaliana L.: identification of three ERDs as HSP cognate genes. Plant Mol. Biol. 25, 791–798. doi: 10.1007/BF00028874
Klemens, P. A. W., Patzke, K., Trentmann, O., Poschet, G., Büttner, M., Schulz, A., et al. (2014). Overexpression of a proton-coupled vacuolar glucose exporter impairs freezing tolerance and seed germination. New Phytol. 202, 188–197. doi: 10.1111/nph.12642
Kosakovsky Pond, S. L., and Frost, S. D. W. (2005). Not so different after all: a comparison of methods for detecting amino acid sites under selection. Mol. Biol. Evol. 22, 1208–1222. doi: 10.1093/molbev/msi105
Kumar, S., Stecher, G., Suleski, M., and Hedges, S. B. (2017). TimeTree: a resource for timelines, timetrees, and divergence times. Mol. Biol. Evol. 34, 1812–1819. doi: 10.1093/molbev/msx116
Lalonde, S., and Frommer, W. B. (2012). SUT sucrose and MST monosaccharide transporter inventory of the Selaginella genome. Front. Plant Sci. 3, 24. doi: 10.3389/fpls.2012.00024
Leliaert, F., Smith, D. R., Moreau, H., Herron, M. D., Verbruggen, H., Delwiche, C. F., et al. (2012). Phylogeny and molecular evolution of the green algae. Crit. Rev. Plant Sci. 31, 1–46. doi: 10.1080/07352689.2011.615705
Lewis, L. A., and McCourt, R. M. (2004). Green algae and the origin of land plants. Am. J. Bot. 91, 1535–1556. doi: 10.3732/ajb.91.10.1535
Li, J.-M., Zheng, D., Li, L., Qiao, X., Wei, S., Bai, B., et al. (2015). Genome-wide function, evolutionary characterization and expression analysis of sugar transporter family genes in pear (Pyrus bretschneideri Rehd). Plant Cell Physiol. 56, 1721–1737. doi: 10.1093/pcp/pcv090
Lin, H., Zhu, W., Silva, J. C., Gu, X., and Buell, C. R. (2006). Intron gain and loss in segmentally duplicated genes in rice. Genome Biol. 7:R41. doi: 10.1186/gb-2006-7-5-r41
Lysak, M. A., Koch, M. A., Pecinka, A., and Schubert, I. (2005). Chromosome triplication found across the tribe Brassiceae. Genome Res. 15, 516–525. doi: 10.1101/gr.3531105
Mao, G.-L., Yan, Y., Chen, Y., Wang, B.-F., Xu, F.-F., Zhang, Z.-X., et al. (2017). Family of Ricinus communis monosaccharide transporters and RcSTP1 in promoting the uptake of a glucose-fipronil conjugate. J. Agric. Food Chem. 65, 6169–6178. doi: 10.1021/acs.jafc.7b02044
Ming, R., VanBuren, R., Liu, Y., Yang, M., Han, Y., Li, L.-T., et al. (2013). Genome of the long-living sacred lotus (Nelumbo nucifera Gaertn.). Genome Biol. 14:R41. doi: 10.1186/gb-2013-14-5-r41
Misra, V. A., Wafula, E. K., Wang, Y., dePamphilis, C. W., and Timko, M. P. (2019). Genome-wide identification of MST, SUT and SWEET family sugar transporters in root parasitic angiosperms and analysis of their expression during host parasitism. BMC Plant Biol. 19:196. doi: 10.1186/s12870-019-1786-y
Morison, M. O., and Sheath, R. G. (1985). Responses to desiccation stress by Klebsormidium rivulare (Ulotrichales, Chlorophyta) from a Rhode Island stream. Phycologia 24, 129–145. doi: 10.2216/i0031-8884-24-2-129.1
Myburg, A. A., Grattapaglia, D., Tuskan, G. A., Hellsten, U., Hayes, R. D., Grimwood, J., et al. (2014). The genome of Eucalyptus grandis. Nature 510, 356–362. doi: 10.1038/nature13308
Nagao, M., Matsui, K., and Uemura, M. (2008). Klebsormidium flaccidum, a charophycean green alga, exhibits cold acclimation that is closely associated with compatible solute accumulation and ultrastructural changes. Plant Cell Environ. 31, 872–885. doi: 10.1111/j.1365-3040.2008.01804.x
Nishiyama, T., Sakayama, H., de Vries, J., Buschmann, H., Saint-Marcoux, D., Ullrich, K. K., et al. (2018). The Chara genome: secondary complexity and implications for plant terrestrialization. Cell 174, 448.e24–464.e24. doi: 10.1016/j.cell.2018.06.033
Paterson, A. H., Bowers, J. E., and Chapman, B. A. (2004). Ancient polyploidization predating divergence of the cereals, and its consequences for comparative genomics. Proc. Natl. Acad. Sci. U.S.A. 101, 9903–9908. doi: 10.1073/pnas.0307901101
Peng, D., Gu, X., Xue, L.-J., Leebens-Mack, J. H., and Tsai, C.-J. (2014). Bayesian phylogeny of sucrose transporters: ancient origins, differential expansion and convergent evolution in monocots and dicots. Front. Plant Sci. 5:615. doi: 10.3389/fpls.2014.00615
Poschet, G., Hannich, B., Raab, S., Jungkunz, I., Klemens, P. A. W., Krueger, S., et al. (2011). A novel Arabidopsis vacuolar glucose exporter is involved in cellular sugar homeostasis and affects the composition of seed storage compounds. Plant Physiol. 157, 1664–1676. doi: 10.1104/pp.111.186825
Quirino, B. F., Reiter, W. D., and Amasino, R. D. (2001). One of two tandem Arabidopsis genes homologous to monosaccharide transporters is senescence-associated. Plant Mol. Biol. 46, 447–457. doi: 10.1023/a:1010639015959
Reinders, A., Sivitz, A. B., and Ward, J. M. (2012). Evolution of plant sucrose uptake transporters. Front. Plant Sci. 3:22. doi: 10.3389/fpls.2012.00022
Remy, E., Cabrito, T. R., Batista, R. A., Hussein, M. A. M., Teixeira, M. C., Athanasiadis, A., et al. (2014). Intron retention in the 5'UTR of the novel ZIF2 transporter enhances translation to promote zinc tolerance in Arabidopsis. PLoS Genet. 10:e1004375. doi: 10.1371/journal.pgen.1004375
Reuscher, S., Akiyama, M., Yasuda, T., Makino, H., Aoki, K., Shibata, D., et al. (2014). The sugar transporter inventory of tomato: genome-wide identification and expression analysis. Plant Cell Physiol. 55, 1123–1141. doi: 10.1093/pcp/pcu052
Roy, S. W., and Gilbert, W. (2005). Rates of intron loss and gain: implications for early eukaryotic evolution. Proc. Natl. Acad. Sci. U.S.A. 102, 5773–5778. doi: 10.1073/pnas.0500383102
Sato, S., Nakamura, Y., Kaneko, T., Asamizu, E., Kato, T., Nakao, M., et al. (2008). Genome structure of the legume, Lotus japonicus. DNA Res. Int. J. Rapid Publ. Rep. Genes Genomes 15, 227–239. doi: 10.1093/dnares/dsn008
Sauer, N. (2007). Molecular physiology of higher plant sucrose transporters. FEBS Lett. 581, 2309–2317. doi: 10.1016/j.febslet.2007.03.048
Sauer, N., and Tanner, W. (1989). The hexose carrier from Chlorella. cDNA cloning of a eucaryotic H+-cotransporter. FEBS Lett. 259, 43–46. doi: 10.1016/0014-5793(89)81489-9
Seki, M., Narusaka, M., Ishida, J., Nanjo, T., Fujita, M., Oono, Y., et al. (2002). Monitoring the expression profiles of 7000 Arabidopsis genes under drought, cold and high-salinity stresses using a full-length cDNA microarray. Plant J. Cell Mol. Biol. 31, 279–292. doi: 10.1046/j.1365-313x.2002.01359.x
Stadler, R., Wolf, K., Hilgarth, C., Tanner, W., and Sauer, N. (1995). Subcellular localization of the inducible Chlorella HUP1 monosaccharide-H+ symporter and cloning of a Co-induced galactose-H+ symporter. Plant Physiol. 107, 33–41. doi: 10.1104/pp.107.1.33
Tamura, K., Stecher, G., Peterson, D., Filipski, A., and Kumar, S. (2013). MEGA6: Molecular Evolutionary Genetics Analysis version 6.0. Mol. Biol. Evol. 30, 2725–2729. doi: 10.1093/molbev/mst197
Tang, H., Bowers, J. E., Wang, X., and Paterson, A. H. (2010). Angiosperm genome comparisons reveal early polyploidy in the monocot lineage. Proc. Natl. Acad. Sci. U.S.A. 107, 472–477. doi: 10.1073/pnas.0908007107
Timme, R. E., Bachvaroff, T. R., and Delwiche, C. F. (2012). Broad phylogenomic sampling and the sister lineage of land plants. PLoS ONE 7:e29696. doi: 10.1371/journal.pone.0029696
Tuskan, G. A., Difazio, S., Jansson, S., Bohlmann, J., Grigoriev, I., Hellsten, U., et al. (2006). The genome of black cottonwood, Populus trichocarpa (Torr. and Gray). Science 313, 1596–1604. doi: 10.1126/science.1128691
Varshney, R. K., Song, C., Saxena, R. K., Azam, S., Yu, S., Sharpe, A. G., et al. (2013). Draft genome sequence of chickpea (Cicer arietinum) provides a resource for trait improvement. Nat. Biotechnol. 31, 240–246. doi: 10.1038/nbt.2491
Velasco, R., Zharkikh, A., Affourtit, J., Dhingra, A., Cestaro, A., Kalyanaraman, A., et al. (2010). The genome of the domesticated apple (Malus × domestica Borkh.). Nat. Genet. 42, 833–839. doi: 10.1038/ng.654
Wang, K., Wang, Z., Li, F., Ye, W., Wang, J., Song, G., et al. (2012). The draft genome of a diploid cotton Gossypium raimondii. Nat. Genet. 44, 1098–1103. doi: 10.1038/ng.2371
Wei, X., Liu, F., Chen, C., Ma, F., and Li, M. (2014). The Malus domestica sugar transporter gene family: identifications based on genome and expression profiling related to the accumulation of fruit sugars. Front. Plant Sci. 5:569. doi: 10.3389/fpls.2014.00569
Yamada, K., Osakabe, Y., Mizoi, J., Nakashima, K., Fujita, Y., Shinozaki, K., et al. (2010). Functional analysis of an Arabidopsis thaliana abiotic stress-inducible facilitated diffusion transporter for monosaccharides. J. Biol. Chem. 285, 1138–1146. doi: 10.1074/jbc.M109.054288
Zhang, L., Zhang, C., Yang, B., Xiao, Z., Ma, J., Liu, J., et al. (2020). Genome-wide identification and expression profiling of monosaccharide transporter genes associated with high harvest index values in rapeseed (Brassica napus L.). Genes 11:653. doi: 10.3390/genes11060653
Zhang, Q., Hua, X., Liu, H., Yuan, Y., Shi, Y., Wang, Z., et al. (2021). Evolutionary expansion and functional divergence of sugar transporters in Saccharum (S. spontaneum and S. officinarum). Plant J. Cell Mol. Biol. 105, 884–906. doi: 10.1111/tpj.15076
Zhang, Y., Liu, Z., Khan, A. A., Lin, Q., Han, Y., Mu, P., et al. (2016). Expression partitioning of homeologs and tandem duplications contribute to salt tolerance in wheat (Triticum aestivum L.). Sci. Rep. 6, 21476. doi: 10.1038/srep21476
Keywords: sugar transporters, monosaccharides carriers, ERD6-like, ESL, evolution, gene duplication, Arabidopsis
Citation: Slawinski L, Israel A, Paillot C, Thibault F, Cordaux R, Atanassova R, Dédaldéchamp F and Laloi M (2021) Early Response to Dehydration Six-Like Transporter Family: Early Origin in Streptophytes and Evolution in Land Plants. Front. Plant Sci. 12:681929. doi: 10.3389/fpls.2021.681929
Received: 17 March 2021; Accepted: 09 July 2021;
Published: 06 September 2021.
Edited by:
Jon Pittman, The University of Manchester, United KingdomReviewed by:
Baolei Jia, Chung-Ang University, South KoreaQing Zhang, Agricultural Genomics Institute at Shenzhen, Chinese Academy of Agricultural Sciences (CAAS), China
Copyright © 2021 Slawinski, Israel, Paillot, Thibault, Cordaux, Atanassova, Dédaldéchamp and Laloi. This is an open-access article distributed under the terms of the Creative Commons Attribution License (CC BY). The use, distribution or reproduction in other forums is permitted, provided the original author(s) and the copyright owner(s) are credited and that the original publication in this journal is cited, in accordance with accepted academic practice. No use, distribution or reproduction is permitted which does not comply with these terms.
*Correspondence: Maryse Laloi, maryse.laloi@univ-poitiers.fr
†These authors have contributed equally to this work