 Eduardo Bernal
 Loïc Deblais
 Gireesh Rajashekara
 David M. Francis
- 1Department of Horticulture and Crop Science, Ohio Agricultural Research and Development Center, The Ohio State University, Wooster, OH, United States
- 2Food Animal Health Research Program, Ohio Agricultural Research and Development Center, The Ohio State University, Wooster, OH, United States
Imaging technology can provide insight into biological processes governing plant-pathogen interactions. We created and used a bioluminescent strain of Xanthomonas hortorum pv. gardneri (Xgb) to quantify infection processes in plants using tomato as a model. An X. hortorum pv. gardneri is one of the four Xanthomonas species that causes bacterial spots in tomatoes. We used Xgb to quantify bacterial growth in planta, to assess disease severity in resistant and susceptible tomato lines, and to observe infection routes in leaves. A positive and significant linear correlation r (67) = 0.57, p ≤ 0.0001 was observed between bioluminescence signals emitted by Xgb in planta and bacterial populations determined through dilution plating. Based on bioluminescence imaging, resistant and susceptible tomato lines had significantly different average radiances. In addition, there was a positive and significant correlation r = 0.45, p = 0.024 between X. hortorum pv. gardneri-inoculated tomato lines evaluated by bioluminescence imaging and tomatoes rated in the field using the Horsfall-Barrat Scale. Heritability was calculated to compare the genetic variance for disease severity using bioluminescence imaging and classical field ratings. The genetic variances were 25 and 63% for bioluminescence imaging and field ratings, respectively. The disadvantage of lower heritability attained by bioluminescence imaging may be offset by the ability to complete germplasm evaluation experiments within 30 days rather than 90–120 days in field trials. We further explored X. hortorum pv. gardneri infection routes on leaves using spray and dip inoculation techniques. Patterns of bioluminescence demonstrated that the inoculation technique affected the distribution of bacteria, an observation verified using scanning electron microscopy (SEM). We found significant non-random distributions of X. hortorum pv. gardneri on leaf surfaces with the method of inoculation affecting bacterial distribution on leaf surfaces at 4 h postinoculation (hpi). At 18 hpi, regardless of inoculation method, X. hortorum pv. gardneri localized on leaf edges near hydathodes based on bioluminescence imaging and confirmed by electron microscopy. These findings demonstrated the utility of bioluminescent X. hortorum pv. gardneri to estimate bacterial populations in planta, to select for resistant germplasm, and to detect likely points of infection.
Introduction
Bioluminescence imaging has become widely used as a method to visualize and monitor molecules, cells, and protein-protein interactions in vitro and biological systems (Thouand and Marks, 2016). Enzyme-substrate systems emitting light are found in hundreds of luminescent organisms, including fireflies, bacteria, and marine animals (Thouand and Marks, 2016). In luminescent bacteria, the luxCDABE operon includes five genes, which encode enzymes that produce and oxidize substrates with blue/green light emitted as a reaction product (Fernández-Pinas and Wolk, 1994; Gupta et al., 2003; Thouand and Marks, 2016). The luxCDABE operon has been cloned into many phytopathogenic bacteria to monitor routes of infection, quantify bacterial populations, and assess disease resistance in different crops (Azegami et al., 2004; Vrisman et al., 2016; Du et al., 2017). Bioluminescence signals are generally well-correlated with bacterial populations in planta and therefore serve as a non-invasive technique to localize and measure the growth of pathogens in different pathosystems.
Image-based phenotyping is an expanding area of research with the goal of reducing time, costs, and resources used to screen and develop resistant plant varieties (Mutka and Bart, 2015; Furbank et al., 2019). Because bioluminescence imaging can measure quantitative variation in bacterial growth in planta, imaging systems have been leveraged to distinguish between resistant and susceptible germplasm in different crops. For example, a bioluminescent Xanthomonas campestris pv. campestris (Xcc) strain was developed to assess resistance and susceptibility in cabbage (Dane, 1993). The susceptible genotype displayed bacteria colonizing at hydathodes, whereas bacterial entry in the resistant cultivar was mainly through wounds on leaves (Dane, 1993). A bioluminescent Xanthomonas campestris pv. vesicatoria (now X. euvesicatoria) strain showed significant differences in growth on resistant and susceptible tomato lines (Dane and Dane, 1994), further suggesting that bioluminescence could be used to study plant-host interactions. More recently, a bioluminescent Ralstonia solanacearum strain causing bacterial wilt was developed to study infection in pepper lines (Du et al., 2017). The resistant pepper line restricted the multiplication of R. solanacearum in the roots relative to a susceptible line suggesting that visualizing bioluminescence can elucidate mechanistic differences in infection processes. These studies emphasize the potential for bioluminescence imaging to supplement field-based phenotyping approaches to identify and select germplasm.
In tomato, bacterial species can infect through natural openings or wounds. For example, Pseudomonas syringae causing bacterial speck on tomato colonizes and infects through stomata (Preston, 2000). Similarly, Xanthomonas perforans and X. euvesicatoria, two of the four Xanthomonas species causing bacterial spots in tomatoes also appear to colonize stomata (Zhang et al., 2009; Wang et al., 2017). Hydathode pores found on the margins of leaflets are another natural opening that may also be a point of entry by Xanthomonas species (Cerutti et al., 2019). Hydathodes are referred to as water stomata due to their function in discharging water from the inner leaf, in a process known as guttation (Chhabra et al., 1977). Guttation droplets serve as infection courts for the bacterial canker pathogen, Clavibacter michiganesis subsp. michiganesis (Carlton et al., 1998). Entry through guttation droplets on tomato has also been seen with Salmonella enterica Typhimurium, among other routes of entry (Gu et al., 2013). In both cases, bacteria colonized and reproduced within intercellular spaces in the leaf and moved into the vascular system. Infection of crucifers through hydathodes by Xcc has been well-characterized (Dane, 1993; Cerutti et al., 2017). A role for hydathode infection for Xanthomonas species causing bacterial spots in tomatoes remains to be described.
With bioluminescence imaging technology providing promise for quantifying pathogen populations and assessing colonization, the goal of this study was to describe the infection process by X. hortorum pv. gardneri (formerly X. gardneri) on tomato. We developed and utilized a lux operon-expressing virulent X. hortorum pv. gardneri strain to quantify bacterial populations, and observe infection processes on leaf surfaces. We confirmed and validated observations facilitated by bioluminescence using scanning electron microscopy (SEM). The main objectives of this study were (i) to quantify bioluminescence signals as a function of bacterial growth in tomato seedlings, (ii) to determine whether bioluminescence can be used to differentiate between tomato lines resistant and susceptible to X. hortorum pv. gardneri, (iii) to compare the accuracy of field disease ratings and bioluminescence seedling screening assays, and (iv) to observe X. hortorum pv. gardneri colonization of the tomato leaf surface.
Materials and Methods
Plant Material and Greenhouse Conditions
The germplasm used in this study was previously developed for resistance against X. hortorum pv. gardneri, X. perforans, and X. euvesicatoria (Bernal et al., 2020). Near Isogenic Lines (NILs), Quantitative Trait Locus 11A (QTL-11A), QTL-11A (+) Xv3, QTL-11B, and QTL-11C, have distinct QTL on chromosome 11, a major resistance locus Xv3, or a combination of both (Bernal et al., 2020). Wild tomato lines PI 114490 (Solanum lycopersicum var. cerasiforme), LA2533 (Solanum pimpinellifolium), NIL parent sources 01-BR-7087, FG12-433E-43, and OH087633, advanced QTL11 NILs, and susceptible control Ohio 88119 (OH88119) were used in germplasm screening experiments. The pedigree information is described in detail in Bernal et al. (2020). OH88119 was used to study bacterial colonization of leaf tissue and is the recurrent parent for the NILs.
Tomato seedlings were grown in a Biosafety Level 2 plant (BSL2P) certified greenhouse in the Department of Horticulture and Crop Science at The Ohio State University, Wooster, OH. Seedlings were grown in all experiments using standard cultural practices (Yang et al., 2005). The greenhouse temperature was maintained between 23 and 28°C under a 14-h photoperiod. Seedlings were kept in a 3 ft3 PVC pipe chamber covered in transparent plastic to maintain high relative humidity conducive to bacterial spots. The relative humidity inside the chamber was maintained between 70 and 95% as measured by a digital wireless thermo-hygrometer (Ambient Weather, Chandler, AZ, USA).
Construction of BioluminescentX. hortorum pv. gardneri (Xgb)
The bioluminescent kanamycin-resistant Xgb strain was created using the pUWGR4 plasmid as previously described (Rajashekara et al., 2005; Deblais et al., 2018). Briefly, electro-competent cells were prepared by growing X. hortorum pv. gardneri SM761 in nutrient broth yeast extract (NBY) at 28°C for 24 h, followed by centrifugation and washing twice in sterile distilled water then once in 10% glycerol. The pellet was resuspended in 1/50th of the original volume in 10% sterile glycerol. A 100 μl aliquot of competent cells was electroporated in a 2 mm ice-cold electroporation cuvette containing 2 μl of EZ::TN/lux-kan cassette using MicroPulser (Biorad, Hercules, CA) at 2,400 V, 25 μF, and 400 Ω. EZ::TN/lux-kan cassette was prepared using the plasmid pUWGR4, as described previously (Rajashekara et al., 2005). Briefly, the pUWGR4 plasmid was digested with PvuII, and the 8 kb linear DNA fragment containing the lux operon and kanR genes flanked by transposon mosaic ends was gel-purified using a QIAquick gel extraction kit. The transposome complex was prepared by mixing 200 ng of purified DNA (2 μl), 4 μl of EZ::TN transposase (Epicentre, Madison, WI), and 2 μl of 100% glycerol, and the reaction mixture was incubated for 40 min at room temperature. Following electroporation, 900 μl Super Optimal broth with Catabolites repression (S.O.C.) medium (Hanahan, 1983) was immediately added to the electroporated cells, which were incubated at 28°C for 3 h (180 rpm). Following incubation, the cells were plated on Yeast Dextrose Carbonate (YDC) agar supplemented with 50 μg/ml kanamycin and incubated for 72 h at 28°C. Kanamycin-resistant bioluminescent colonies were further confirmed by Polymerase chain reaction (PCR) using primers specific to the kanamycin resistance gene, 1221 bp, (KAN-F: GTGAGAATGGCAAAAGCTTATGCATT and KAN-R: GAAAACAGCATTCGAGGTATTAGAAG).
Bacterial Strain and Inoculum Preparation
Bioluminescent SM775-12 (Xgb) was grown in NBY medium supplemented with 50 μg/ml of kanamycin. Cultures were maintained at 28°C or stored frozen in 15% glycerol at −80°C. For spray inoculation experiments, bacteria were resuspended in autoclaved ddH2O and subsequently standardized to an absorbance of 600 nm = 0.15 in a 10-mm path length spectrophotometer, corresponding to a concentration of ~3.0 × 10⁸ CFU/ml. Xgb suspension was sprayed to runoff with a compressed air sprayer (Preval sprayer, Coal City, IL) as described previously (Liabeuf et al., 2018). For dip inoculation, the suspension was standardized to the same concentration with the addition of 0.05% (vol/vol) Silwett L77 (PhytoTech Labs, Lenexa, KS, USA). Subsequently, tomato seedlings were inverted and submerged in the Xgb suspension for 30 s in dip inoculation experiments (Gu et al., 2011).
Bacterial Spot Evaluation in the Field
Field trials were conducted in the summer of 2016, 2017, and 2018. X. hortorum pv. gardneri strain SM775-12, the non-bioluminescent precursor isolate, was grown on nutrient yeast broth (NYB) agar media at 28°C for 48–72 h and subsequently resuspended in autoclaved ddH20 with concentrations adjusted as above. The bacterial suspension was sprayed to run-off with a compressed air sprayer (Preval sprayer, Coal City, IL) in the greenhouse 1 week before transplanting to the field. Disease ratings were conducted on a per plot basis. The severity of bacterial spots was measured using the Horsfall-Barratt scale (Horsfall and Barratt, 1945) where 1 = no disease present to 12 = complete defoliation. Susceptible and resistant controls were used to monitor the progression of the disease over the growing season. Two ratings for each field conducted at time points corresponding to 80% of the fruit in plots were at the mature green (early) or ripe-fruit (late) stage of maturity (Bernal et al., 2020). The mature stage field rating was used in comparative analyses.
Quantification of Bacterial Growth in planta
Tomato genotypes QTL11A (+) Xv3 and OH88119 were selected as the resistant and susceptible lines for bacterial growth studies. The 4-week-old tomato seedlings were placed inside the humidity chamber in the greenhouse 2 days before inoculation. Seedlings were spray inoculated with the bioluminescent Xgb in the morning and removed from the plastic chamber 48 h postinoculation (hpi). In the first experiment at 3, 4, 5, 8, and 9 days postinoculation (hpi), three leaflets from the second true leaf of each genotype were randomly selected, excised, and processed as described below. In the second experiment 3, 4, 5, 6, 7, 8, and 9 hpi were used as timepoints. In addition, a subset of OH88119 seedlings was spray-inoculated with the untransformed strain to compare virulence to Xgb. Individual leaflets were analyzed using the in vivo imaging system Lumina III IVIS (PerkinElmer, Inc., Waltham, MA, USA) to measure Total Flux in photons per second (p/sec) or Radiance in photons per second that leave a square centimeter of tissue and radiate into 1 unit of solid angle for a sphere, steradian (sr), (p/sec/cm2/sr). Each sample was measured using a 570 nm filter, and the exposure time was set at 3 min. Subsequently, each leaflet was weighed and macerated in 1 ml of ddH20. Individual extracts were serial diluted, through a 10-fold dilution series, and plated in NBY media with kanamycin. As noted above, the experiment was conducted twice. Bacterial colonies were counted 26 h after plating and adjusted to log colony-forming units per gram of leaf tissue (CFU/g).
Analysis of Tomato Germplasm With IVIS
Greenhouse germplasm screens were conducted as completely randomized experiments with three to four replications over four independent experiments. Selected NILs, wild species, and susceptible controls were randomly sown in a seedling tray and placed in the humidity chamber 4 weeks later. Seedlings were spray-inoculated with a suspension of Xgb, and bottom watered throughout the whole experiment. Seedlings were removed from the chamber at 48 hpi and kept on the bench in the greenhouse. Seedlings were removed from the greenhouse at 9 hpi and analyzed using IVIS. Each seedling was imaged using a 570 nm filter, and the exposure time was set at 3 min.
Scanning Electron Microscopy Imaging of Leaf Natural Openings
To investigate the distribution of bacteria on leaflets relative to surfaces and natural openings, samples from the abaxial, adaxial, and edges of leaflets were processed and analyzed using SEM. Four seedlings of OH88119 each were either spray or dip inoculated with a suspension of X. hortorum pv. gardneri Xgb as described above inside the humidity chamber. Samples were removed and analyzed at 4 hpi and 18 hpi with IVIS using 570 nm and 3-min exposure time. Subsequently, samples were prepared for SEM. All samples were processed at the Molecular and Cellular Imaging Center (MCIC) in Wooster, OH.
Infected leaf tissue sections (~1 × 1 mm) were cut from leaflets from the second true leaf. Uninfected tissue was also processed for SEM to quantify differences between natural openings on different surfaces of the leaflets. Leaf tissue samples were fixed in 3% glutaraldehyde, 2% paraformaldehyde in 0.1 M potassium phosphate buffer (PB), pH 7.0. Samples were vacuum infiltrated in fixative and placed on a tissue rocker overnight. Subsequently, samples were washed with 0.1 M PB for 15 min, then rinsed with sterile distilled water for 15 min three times. Fixed samples were dehydrated in a series of ethanol (ETOH) concentrations of 50, 70, and 90% for 15 min each. Fixed samples were then dehydrated in 100% ETOH four times for 15 min each and dried using liquid carbon dioxide. Samples were mounted on SEM stubs and coated in 15–40 mm of platinum. Samples were examined using a Hitachi Schottky field emission SU5000 microscope housed at the MCIC, The Ohio State University, Wooster, OH.
When processing images for data analysis, images were collected using the same parameters and adjusted using the Fiji Image J Software (Schindelin et al., 2012). The set scale function under “analyze” in Fiji was used to standardize any images during data collection. A stereological approach was used to quantify the number and size of natural openings, and the density of bacteria within a superimposed grid. This method was conducted using the plugin grid in Fiji (Rønn et al., 2000). Bacterial cells and natural openings on leaflets were counted using the Cell Counter plugin (Kurt De Vos, University of Sheffield;a3VydC5kZXZvc0Bpb3Aua2NsLmFjLnVr).
Bacterial Growth Analysis
The data for bacterial growth quantification based on log CFU/g and luminescent signals measured through IVIS were combined from both experiments. Data were analyzed using the fixed-effect linear model for ANOVA: Yijk = u + Gi +Tij +Dik+ Bk + eijk, with Yijk being the Total Flux or log (CFU/g) for the ith leaflet within Genotype (Gi) and Experiment (Tij) for kth replicate within Experiment (Bk) and Day (Dik) for the ith individual within the experiment. A regression analysis was accomplished using the “lm” function in the R Core Package (R Core Team, 2017).
Plant Germplasm Screening
The data for tomato near-isogenic lines were analyzed independently using the fixed-effect linear model for ANOVA: Yik = u + Gi + Bk + eik, with yik the radiance measured by IVIS the ith individual in the kth block (Bk). In a different model, we estimated the best linear unbiased predictors (BLUPs) for radiance measured by IVIS but included multiple plant genotypes, including NILs, parents, and wild sources for all experiments. BLUPs were estimated to normalize the data across the four experiments because the design was unbalanced; all genotypes were not replicated in all experiments. BLUPs were calculated using the random model: Yijk = u + Gi +Ej + Bk + eijk, with Yijk the value of the phenotypic trait, for the ith individual within a genotype (Gi) for the jth experiment (E) and Bk for replicate within the experiment (Bk). The variance explained by genotype for radiance measured by IVIS was calculated based on the random model. We also estimated BLUPs for disease ratings for the same plant genotypes evaluated in X. hortorum pv. gardneri-inoculated field trials were conducted between 2016 and 2018. The random model was: Yijk = u + Li +Yj +Rk + eijk, with Yijk being the field rating, for the ith individual within a genotype (Li) for the jth field year (Yj) and kth for replicate within a year (Rk). BLUPs were estimated using the function “ranef” in the lme4 package version 1.1.18.1 (Bates et al., 2015).
Heritability estimates for both IVIS and field ratings were calculated using the formula where and are the estimates of variance for the genotype and residual error, n is the number of experimental or year replications (Cotteril, 1987). Main effects for experiments or years were dropped as described by Cotteril (1987). In addition, we calculated Reliability for radiance and field disease ratings using the formula , where is the variance for either year or experiment (Bernardo, 2020).
Analysis of Natural Openings and Bacterial Colonization
To analyze the spatial distribution of natural openings and bacteria, we used stereological principles and tested the null hypothesis of spatial randomness using a chi-square distribution (Rønn et al., 2000; Mazzucato et al., 2008). The stereological analysis is used to obtain quantitative data from three-dimensional images by superimposing two-dimensional grids. A 140 μM2 grid with four quadrants was used to quantify the size and number of natural openings on the abaxial, adaxial, and tip of leaf lobes. The sampling was done using the same four quadrants in every biological replicate. To quantify the number of bacteria the same approach was applied, with a 30 μM2 grid having nine quadrants. The grid size was reduced to accommodate the size difference between bacteria and natural openings and the need to increase the magnification of images to visualize bacteria.
Data for the size of natural openings on the abaxial and edge of leaflets were analyzed using the fixed-effect linear model for ANOVA: Yik = u + Li + Bk + eik, with yik being the length or width (uM) for the ith natural opening within the location of the leaflet (Li) for kth replicate within the experiment (Bk). Data were analyzed using the “lm” function in the R core package version 3.5.1 (R Core Team, 2017).
A chi-square analysis (χ2) was used for specific comparisons including the type of inoculation method, time-points, and distribution of bacteria on the abaxial, adaxial, or leaf margin. First, we utilized a χ2 analysis to determine if there were statistically significant differences in bacterial densities depending on the type of inoculation method (df, 1). Second, we tested the null hypothesis that X. hortorum pv. gardneri populations are randomly distributed on leaf surfaces. With different inoculation methods and time points, we conducted four chi-square analyses (df, 2) to test the random distribution of bacteria on different leaf surfaces. All χ2 analyses were conducted using the function “chisq.test” in the R core package (R Core Team, 2017).
Results
Verification of Bioluminescent X. hortorum pv. gardneri Transformation
Bioluminescent transformants were confirmed using an IVIS Model 100 (PerkinElmer, Waltham, MA, USA) and by PCR amplification targeting the kanamycin resistance gene (837 base pairs). In vitro insertion stability of the transposable cassette was confirmed by serial passaging (cycles of 24 h, repeated 10 times; approximately 50 generations) at 28°C without antibiotic, as previously described by Deblais et al. (2018). Bacterial growth on LB and MMX broth was not different when Xgb and Xgh (wild-type SM775-12) were compared (Srivastava et al., 2021). There were no differences observed between Xgh and Xgb bacterial populations in OH88119 based on dilution plating on NYB media with and without kanamycin and log CFU/g counts (Figure 1A).
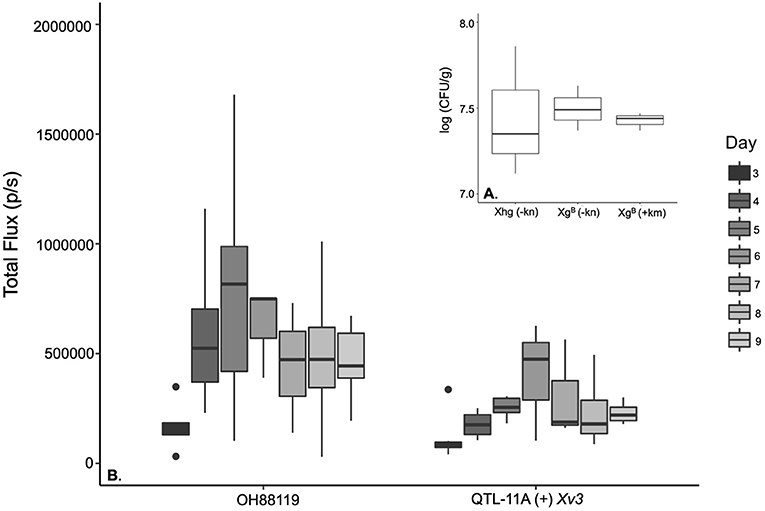
Figure 1. Boxplots comparing the growth of Xanthomonas hortorum pv. gardneri Xgb and wild-type strain (Xhg) measured as log colony-forming units per gram of leaf tissue (CFU/g) in susceptible tomato and illustrating the population changes over time as Total Flux measured through in vivo imaging system (IVIS) for susceptible and resistant near-isogenic tomato lines. (A) No significant differences were observed for X. hortorum pv. gardneri. Xhg compared to the lux operon transformed strain Xgb based on dilution plating and log CFU/g counts [F(2, 4) = 0.059, p = ≤ 0.94]. Bacterial colonies were counted on nutrient yeast broth (NYB) media with (+) and without kanamycin (–). (B) illustrates the Total Flux due to Xgb growing on the susceptible genotype OH88119 and the resistant Near Isogenic Lines (NIL), QTL-11A + Xv3 through a time course.
Quantification of X. hortorum pv. gardneri Populations by IVIS and Dilution Plating
A higher level of bioluminescent signals was observed in the susceptible line OH88119 compared to resistant line QTL-11A (+) Xv3. Total Flux (p/s) was highest on day 5 and day 6 for OH88119 and QTL-11A (+) Xv3 (Figure 1B). A positive and significant linear correlation was observed between bioluminescent signals (Total Flux) from inoculated tomato seedlings and bacterial population determined by dilution plating. There were significant differences for genotype: the resistant line QTL-11A (+) Xv3 displayed lower Total Flux levels relative to the susceptible line OH88119 F (1,55) = 16.60, p = ≤ 0.001. Significant differences for genotype were also found when assessing CFU/g of leaf tissue F(1, 55) = 10.12, p = ≤ 0.002. There were no significant differences between experiments using total flux measured by IVIS to assess bacterial growth in planta F(1, 55) = 0.15, p ≤ 0.73. However, we did see significant differences in colony counts in different experiments.
A regression analysis was conducted across all time points between bacterial colony-forming units/ml and Total Flux. A positive and significant correlation r (67) = 0.57, p ≤ 0.0001 was observed between Total Flux (p/s) and log colony forming unit per gram (CFU/g) when all resistant and susceptible data points (n = 69) were combined (Figure 2). Three data points were not included because no bacterial colonies were present after plating. Independently resistant and susceptible genotypes also displayed a positive and significant correlation between log CFU/g and IVIS r (33) = 0.49, p ≤ 0.0003, and r (32) = 0.60, p ≤ 0.0002, respectively (Figure 2). Differences in bacterial growth measured by log CFU/g were seen between resistant and susceptible genotypes in the young seedlings with resistant QTL11A + Xv3 having a lower slope relative to susceptible OH88119.
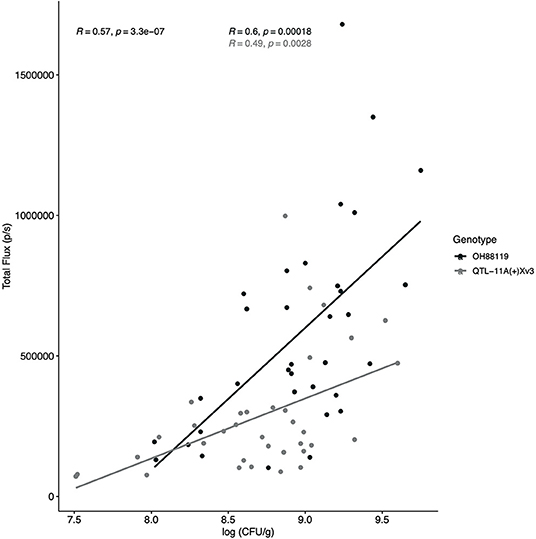
Figure 2. Regression analysis between Total Flux (p/s) measured through IVIS and bacterial populations. An X. hortorum pv. gardneri strain, Xgb, expressing the lux operon was developed to visualize and quantify bacteria in planta. Regression analysis was conducted to compare total flux (p/s) as measured through IVIS and log10 of bacterial populations in tomato leaf tissue (CFU/g). Bacterial colonies were counted at seven time points using resistant NIL, QTL-11A + Xv3, and the susceptible genotype OH88119. The regression experiment was conducted twice, the figure represents all data points. A significant and positive relationship was observed for combined data (R = 0.57, p < −0.0001) resistant NIL (gray line and points; R = 0.49, p < −0.0028) and susceptible, OH88119 (black line and points; R = 0.6, p < −0.0002).
In vivo Imaging System vs. Field Screening of Genotypes
In vivo imaging system measurements of average radiance differentiated between resistant NILs and susceptible lines. The fixed effect ANOVA model comparing NILs detected significant differences for genotype F(3, 9) = 10.14, p = ≤ 0.003. The replicate effect was insignificant F(3, 9) = 0.46, p = ≤ 0.71. Fisher's LSD was conducted to show differences between specific NILs. Tomato genotype OH88119, the susceptible control, displayed significantly higher average radiance than genotypes QTL11A only and QTL11A (+) Xv3 inoculated with X. hortorum pv. gardneri Xgb (Figure 3). We observed bioluminescent signals on the edge of the leaf suggesting that bacteria may be colonizing through hydathodes on the leaf margin (Figure 3).
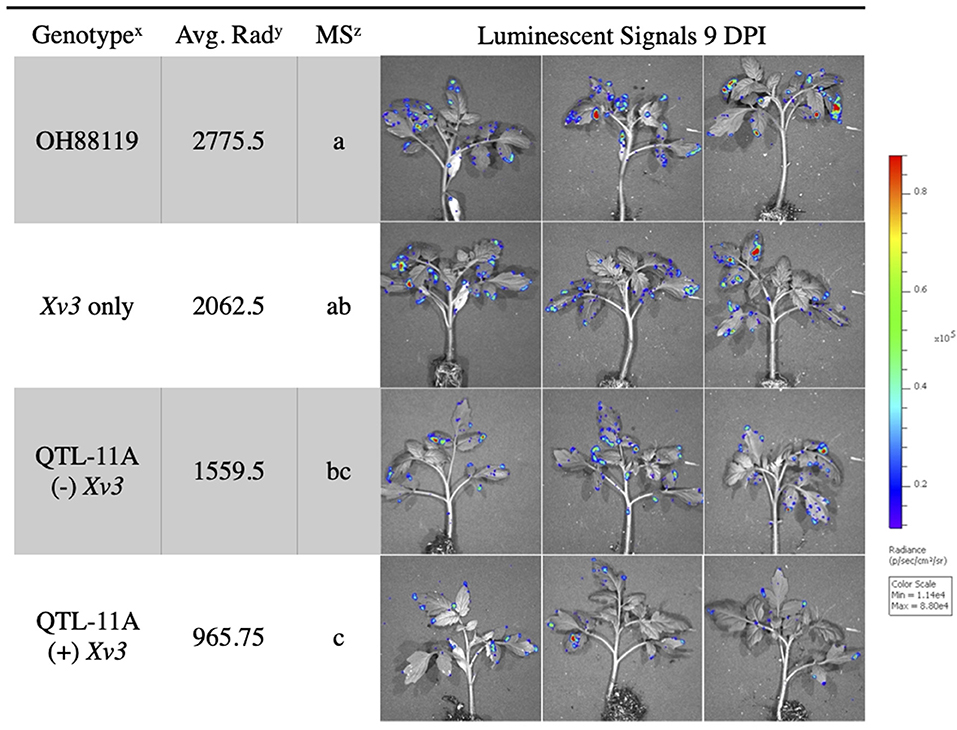
Figure 3. Average radiance measured through IVIS of resistant NILs and susceptible control OH88119 spray inoculated with lux operon expressing X. hortorum pv. gardneri (Xgb). Seedlings were spray inoculated and luminescent signals were measured 9 days post-inoculation. The luminescence quantification scale is located on the right. Genotypex = QTL-11A (+) Xv3 contains both a QTL and gene of resistance, QTL-11A (–) Xv3, contains only QTL-11A, Xv3 only has no QTL, OH88119 is the susceptible control. Average Rady = is the average radiance (p/sec/cm2/sr) for four replicates of genotype. Mean Separationz = represents the Fisher's Least Significance test (α = 0.05) performed following ANOVA (protected LSD).
Best linear unbiased predictors for IVIS average radiance and X. hortorum pv. gardneri bacterial spot field ratings were estimated for NILs, parent sources, and wild species in combined experiments. In both phenotypic approaches, OH88119 displayed the most disease severity. In contrast, wild species PI 114490 showed a high level of resistance. The comparison of BLUPs for X. hortorum pv. gardneri bacterial spot field ratings with IVIS average radiance showed a positive and significant correlation r (9) = 0.45, p ≤ 0.024 between data collected from both systems (Table 1).
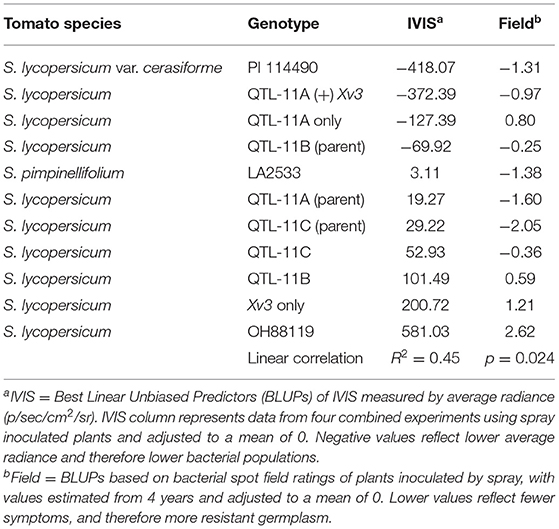
Table 1. Comparison of BLUPs estimated using IVIS average radiance and field ratings for a bacterial spot in tomato genotypes inoculated with X. hortorum pv. gardneri.
Heritability and reliability are functions of the variance components and were greater for field ratings than for average radiance measured by IVIS. The statistical model using average radiance values showed that 25% of the total variance was explained by genetics. However, 63% of the total variance was explained by residual error. Replication within the experiment and between experiments explained very little variance in average radiance as measured by IVIS. The model using bacterial spot field rating data as the dependent variable showed that genotype differences (genetics) explained most of the variance, accounting for 63% of the total. The replication based on year explained 6% of the total variance, and the within-field variation effect was negligible. The residual error explained 30% of the variance for field rating data (Table 2). For average radiance data obtained from IVIS, heritability was 0.58 and reliability was 0.25. For field ratings, heritability was 0.86 and reliability was 0.63 (Table 2). Despite lower heritability and reliability, quantification of luminescent signals through IVIS may prove useful for conducting germplasm screenings during the off-season, for rapid confirmation of disease resistance, or experiments requiring rapid generation turnover. On average, IVIS evaluation of seedlings required 24 days from initial sowing to data acquisition. In contrast, field studies required 90–120 days.
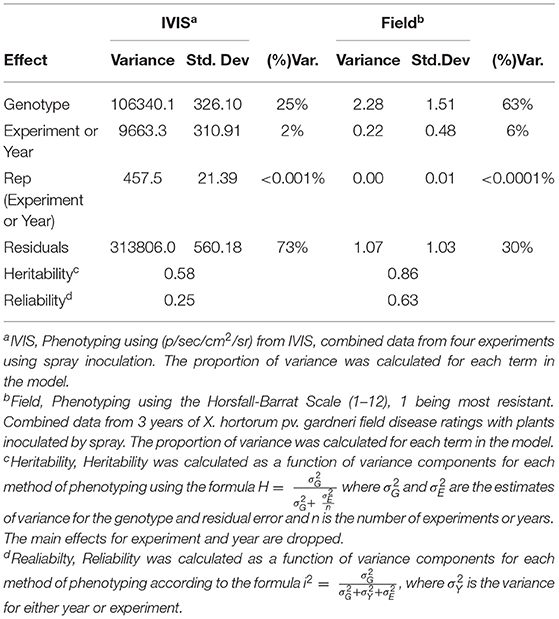
Table 2. Variance partitioning of IVIS and field ratings using random models.
The Tomato Leaf and Bacterial Colonization
In vivo imaging system observations of average radiance due to X. hortorum pv. gardneri strongly implicate infection on the leaf margins and suggested hydathodes could be a point of entry. SEM provided an alternative method to observe and quantify bacterial location relative to natural openings on the leaf. The appearance of stomatal pores was similar, though significant differences in the size of stomata on the leaf surface and hydathodes on the leaf margin were observed (Figure 4). Hydathode pores had greater length and width than stomates, F(1, 19) = 52.5, p = ≤ 0.001 and F(1, 19) = 19.9, p ≤ 0.001. The average length (μM) and width (μM) of tomato hydathode pores were 25.66 ± 3.76 and 19.45 ± 2.61, respectively. The average length and width of tomato stomates were 18.86 ± 1.86 and 16.02 ± 1.96, respectively. In addition, hydathodes possessed a characteristic rise or rim (Figure 4) not observed on stomatal pores on the leaf surface.
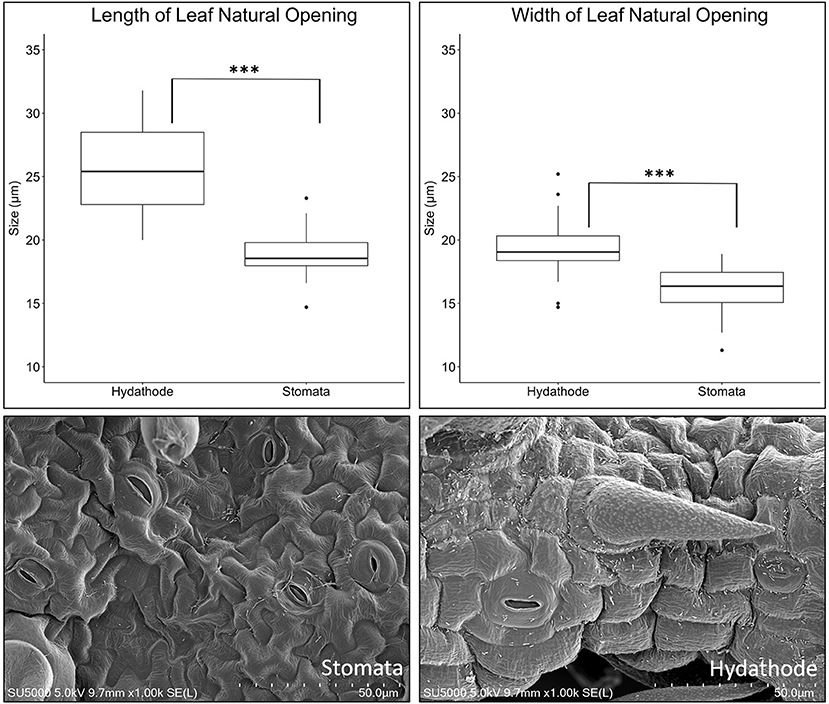
Figure 4. Differences in size between abaxial stomata vs. leaf margin hydathode pores of tomato line OH88119. The boxplots illustrate differences in size for abaxial stomata vs. leaf margin hydathode pores. Hydathode pores are greater in length and width compared to stomata (P < 0.0001***). Hydathode pores (right image) tend to have a more pronounced pore rim compared to stomata. Scanning electron microscopy (SEM) display X. hortorum pv. gardneri colonizing natural pores.
Bioluminescence detects the presence of Xgb prior to symptom development. We observed no clear symptoms using spray inoculation through 9 days of observation. With dip inoculation using a surfactant, susceptible leaves often appear necrotic at 48–72 h. No bioluminescence signals were observed at 4 and 18 hpi with spray inoculation of Xgb. Signal detection often took 3 days when inoculated by spray. However, with dip inoculation containing surfactant, bioluminescence signals were observed at 4 and 18 hpi (Figure 5). Further, bioluminescence was detected across the entire leaf surface with dip inoculation (Figure 5), an observation that contrasted with the observations of infection patterns with spray inoculation where bioluminescence was first observed concentrated at the leaf margins at 72 h. The different distributions of bacteria based on the inoculation method observed using IVIS were also detected when quantifying bacteria from SEM images. A greater density of bacteria on leaf surfaces was observed when using dip inoculation vs. spray inoculation at 4 hpi, χ2 (1, N = 301) = 48.64, p < 0.0001. The same result was also observed at 18 hpi χ2 (1, N = 213) = 11.11, p < 0.0001. No significant differences were observed in the density of bacteria when comparing 4 and 18 hpi for dip inoculation, F(1, 2) = 7.27, p = ≤ 0.11. When comparing the density of bacteria using the spray inoculation at 4 and 18 hpi we also did not see any significant differences, F(1, 2) = 0.019, p = ≤ 0.70.
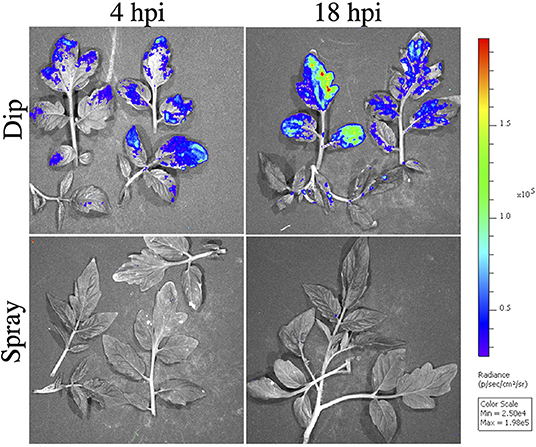
Figure 5. Observed X. hortorum pv. gardneri (Xgb) bacterial populations on tomato OH88119 leaf surfaces using in vivo imaging. OH88119 tomato seedlings were sprayed or dip inoculated with a suspension of Xgb, expressing the lux operon. Leaf surfaces were imaged via IVIS 4 h post-inoculation (hpi) and 18 hpi. No bioluminescence signal was observed at 4 or 18 hpi using spray inoculation, however, a bioluminescence signal was observed using dip inoculation. Strong bioluminescence signals were observed on leaf margins.
We compared the distribution of Xgb on leaf surfaces at 4 hpi using dip or spray inoculation. At 4 hpi with dip inoculation containing surfactant, the distribution of bacteria was random on the leaf surfaces, χ2 (2, N = 209) = 5.29, p > 0.05. At 4 hpi with spray inoculation the bacteria were not randomly distributed, χ2 (2, N = 90) = 7.20, p < 0.05, with flat surfaces containing more bacteria per unit area (Table 3). At 18 hpi for spray inoculation, the distribution of bacteria was also not random and there was a shift toward a higher density observed on the leaf margins, χ2 (2, N = 75) = 26.96, p < 0.05. At 18 hpi with dip inoculation, we also observed a higher density of bacteria on the leaf margins, χ2 (1, N = 138) = 47.13, p < 0.05 (Figure 4). Dip inoculation in the presence of Silwett L77 resulted in a more rapid infection across the entire leaf surface by 4 h. With spray inoculation, bacteria concentrated on the leaf edges by 18 h, consistent with luminescence patterns, which indicated infection on the leaf margins by 3 days after inoculation.
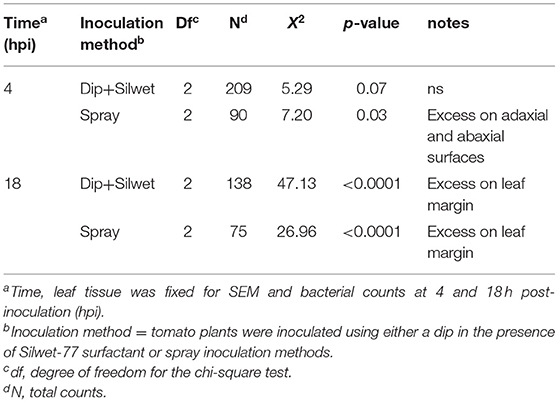
Table 3. Chi-square test for X. hortorum pv. gardneri (Xgb) distribution on adaxial surface, abaxial surface, and leaf margin of OH88119.
Discussion
Observations facilitated through bioluminescence have helped improve the understanding of biological interactions. Previous studies in various plant-pathogen systems have used bioluminescence to describe the infection processes (Dane and Dane, 1994; Azegami et al., 2004; Xu et al., 2010; Vrisman et al., 2016; Du et al., 2017). In this study, we utilized an X. hortorum pv. gardneri strain expressing the lux operon, Xgb, to study infection and assess disease severity in resistant and susceptible tomato lines. We showed increases in bacterial populations with a plateau between 5 and 7 days post-inoculation and significant correlations between bacterial counts measured by dilution plating and bioluminescence signals, demonstrating the ability to rapidly estimate bacterial populations in planta. There was variation experiment to experiment suggesting that although accurate relative estimates are possible, precise estimates of bacterial counts will require the generation of a standard curve for each experiment. A positive and significant correlation between bioluminescence signals and bacterial populations in planta has been observed in other plant-host interactions including R. solanacearum on pepper and potato, C. michiganesis subsp. michiganesis on tomato, and X. campestris pv. vesicatoria (now X. euvesicatoria) on tomato (Dane and Dane, 1994; Xu et al., 2010; Cruz et al., 2014; Du et al., 2017). This study describes X. hortorum pv. gardneri strain Xgb as a resource.
Bioluminescent strains of various plant pathogens have been utilized to assess in planta growth dynamics on resistant and susceptible germplasm. For example, a bioluminescent P. syringae strain was used to monitor bacterial growth in resistant and susceptible bean lines (Paynter et al., 2006). Bioluminescence identified a dynamic in which bioluminescence signals decreased after 48 h in the resistant line but increased in the susceptible line. These results are interpreted as resistance suppressing bacterial populations early during infection. Bioluminescent R. solanacearum strains have been used to assess disease severity in potato germplasm and pepper lines (Cruz et al., 2014; Du et al., 2017). Bioluminescence patterns indicated the presence of bacteria in symptomless potato germplasm (Cruz et al., 2014). The marked strains permitted the detection of latent infection via bioluminescence 5 days post-inoculation. Infection of pepper by a bioluminescent R. solanacearum showed that resistant lines restricted bacterial multiplication in roots and stems (Du et al., 2017). Thus, the use of bioluminescence has provided insight into the time and location of infection.
We further explored the use of the bioluminescent X. hortorum pv. gardneri for rapid screening of germplasm. The use of IVIS to quantify bioluminescence signals allowed us to separate known resistant and susceptible lines. Screening based on total flux resulted in lower estimates of heritability and reliability relative to field screens, suggesting that the technique provided less accuracy in measuring genetic signals and for separating germplasm relative to classical field-based phenotyping. Plant breeders assess selection strategies gain under selection, gain per cycle, gain per unit time, and gain per dollar invested in screening. The practicality of IVIS as a screening method, therefore, needs to consider the relative efficiency of selection. Relative efficiency per cycle of selection is 0.53, calculated as where rg is the genetic correlation between the BLUPs estimated from total flux measured by IVIS and X. hortorum pv. gardneri field rating, hI, and hF are the square root heritabilities of IVIS and field rating BLUPs. Selection using IVIS is therefore expected to be 53% as efficient as a direct selection in the field per cycle of selection. Because screening germplasm via IVIS only requires 30–40 days compared to 90–120 days in the field, it is possible to increase cycles of selection on a per-year basis. The tomato reproductive cycle would be the only limitation to screening rather than available field seasons in any given year. IVIS is a tool proved to be efficient in terms of time for phenotyping disease resistance and the method may have a role in future germplasm screens for this reason alone.
It may be possible to increase the heritability of disease screening using IVIS by accounting for morphological features and growth. Tomato plants grow at different rates and possess distinct leaf morphologies, especially wild tomato germplasm. Digital methodologies that account for leaf area could be incorporated in future analyses. In these studies, we initially used NILs, which are highly genetically similar and therefore differences in growth rate or leaf morphology were not an issue. However, when we expanded the selection of germplasm to include wild species, error variance increased.
In germplasm screening experiments using spray inoculation, we observed strong bioluminescence signals at the leaf margins suggesting that X. hortorum pv. gardneri colonized hydathodes. We used microscopic observations to obtain quantitative data of X. hortorum pv. gardneri distribution on leaf surfaces. Spatial statistics in combination with microscopy has been a useful tool to study patterns of microbial colonization on the plant rhizosphere and phyllosphere (Dandurand et al., 1997; Remus-Emsermann et al., 2014; Schmidt et al., 2018). The statistical analyses use a formal hypothesis to test for random patterns on a specific location or surface (Schmidt et al., 2018). We applied similar approaches to quantify bacterial distributions on leaf surfaces infected with X. hortorum pv. gardneri. We observed differences in bacterial distribution on leaf surfaces at 4 hpi using different inoculation methods (spray vs. dip with surfactant). At 4 hpi using dip inoculation in the presence of surfactant, bacteria were randomly distributed on leaf surfaces, but the distribution was non-random following spray inoculation. This observation could suggest that bacteria are adhering to all leaf surfaces when dipped, but when sprayed the bacteria showed greater density on the abaxial and adaxial sides compared to the leaf edge. However, at 18 hpi both spray and dip inoculation showed a higher density of bacteria on leaf edges. The differences were observed between bacterial distributions due to inoculation methods, the more rapid detection of bacterial luminescence with the surfactant, and more rapid detection of symptoms with surfactant suggest that inoculation methods need to be considered when interpreting results. The IVIS observations were supported by SEM analysis showing that 18 h post spray inoculation, the distribution of bacteria would support ingress through hydathode water pores. These water pores are longer and wider than stomata and tend to exude extracellular fluid containing sugars, vitamins, and other solutes that may promote a conducive environment for bacterial growth and colonization (Cerutti et al., 2019). The distribution of bacteria as quantified by SEM and bioluminescence patterns suggest hydathode pores may be entry points for X. hortorum pv. gardneri.
Data Availability Statement
The raw data supporting the conclusions of this article will be made available by the authors, without undue reservation.
Author Contributions
DF established the experimental design and assisted with data analyses. EB established the experimental design, performed all inoculations, collected, and analyzed data. LD and GR developed the bioluminescent strain and provided support for the use of in vivo imaging system. All authors contributed to the article and approved the submitted version.
Conflict of Interest
The authors declare that the research was conducted in the absence of any commercial or financial relationships that could be construed as a potential conflict of interest.
Acknowledgments
We thank Dr. Francesca Rotondo and Dr. Sally Miller for maintaining the bacterial isolates for experimentation. We thank Khwannarin Khemsom and Dr. Tea Meulia at the Molecular & Cellular Imaging Center, Wooster, OH for sample preparation and training on the scanning electron microscope. We thank Jiheun Cho and Troy Aldrich for the greenhouse management of the research. This research was supported by Specialty Crop Research Initiative subaward 2015-51181-24312 from the University of Florida.
References
Azegami, K., Tsukamoto, T., Matsuura, T., Ohara, T., Inoue, Y., Mizuno, A., et al. (2004). Invasion and colonization of mature apple fruit by Erwinia amylovora tagged with bioluminescence genes. J. Gen. Plant. Pathol. 70, 336–341. doi: 10.1007/s10327-004-0155-2
Bates, D., Mächler, M., Bolker, B., and Walker, S. (2015). Fitting linear mixed-effects models using lme4. J. Stat. Softw. 67:48. doi: 10.18637/jss.v067.i01
Bernal, E., Liabeuf, D., and Francis, D. M. (2020). Evaluating quantitative trait locus resistance in tomato to multiple Xanthomonas spp. Plant Dis. 104, 423–429. doi: 10.1094/PDIS-03-19-0669-RE
Bernardo, R. (2020). Reinventing quantitative genetics for plant breeding: something old, something new, something borrowed, something BLUE. Heredity 125, 375–385. doi: 10.1038/s41437-020-0312-1
Carlton, W. M., Braun, E. J., and Gleason, M. L. (1998). Ingress of Clavibacter michiganensis subsp. michiganensis into tomato leaves through hydathodes. Phytopathology 88, 525–529. doi: 10.1094/PHYTO.1998.88.6.525
Cerutti, A., Jauneau, A., Auriac, M.-C., Lauber, E., Martinez, Y., Chiarenza, S., et al. (2017). Immunity at cauliflower hydathodes controls systemic infection by Xanthomonas campestris pv campestris. Plant Physiol. 174, 700–716. doi: 10.1104/pp.16.01852
Cerutti, A., Jauneau, A., Laufs, P., Leonhardt, N., Schattat, M. H., Berthom,é, R., et al. (2019). Mangroves in the leaves: anatomy, physiology, and immunity of epithemal hydathodes. Phytopathology 57, 91–116. doi: 10.1146/annurev-phyto-082718-100228
Chhabra, R., Ringoet, A., Lamberts, D., and Scheys, I. (1977). Chloride losses from tomato plants (Lycopersicon esculentumMill.). J. Plant Physio. 81, 89–94. doi: 10.1016/S0044-328X(77)80042-1
Cotterill, P. P. (1987). Short note: on estimating heritability according to practical applications. Silvae Genet. 36, 46–48.
Cruz, A. P. Z., Ferreira, V., Pianzzola, M. J., Siri, M. I., Coll, N. S., and Valls, M. (2014). A novel, sensitive method to evaluate potato germplasm for bacterial wilt resistance using a luminescent Ralstonia solanacearum reporter strain. Mol. Plant Microbe. Interact. 27, 277–285. doi: 10.1094/MPMI-10-13-0303-FI
Dandurand, L. M., Schotzko, D. J., and Knudsen, G. R. (1997). Spatial patterns of rhizoplane populations of Pseudomonas fluorescens. Appl. Environ. Microbiol. 63, 3211–3217. doi: 10.1128/AEM.63.8.3211-3217.1997
Dane, F. (1993). Growth of bioluminescent Xanthomonas campestris pv. campestris in susceptible and resistant host plants. Mol. Plant Microbe Interact 6, 786–789. doi: 10.1094/MPMI-6-786
Dane, F., and Dane, M. H. (1994). Growth of bioluminescent Xanthomonas campestris pv. vesicatoria in tomato cultivars. HortScience 29, 1037–1038. doi: 10.21273/HORTSCI.29.9.1037
Deblais, L., Helmy, Y. A., Kathayat, D., Huang, H.-,c., Miller, S. A., and Rajashekara, G. (2018). Novel imidazole and methoxybenzylamine growth inhibitors affecting Salmonella cell envelope integrity and its persistence in chickens. Sci. Rep. 8:13381. doi: 10.1038/s41598-018-31249-0
Du, H., Chen, B., Zhang, X., Zhang, F., Miller, S. A., Rajashekara, G., et al. (2017). Evaluation of Ralstonia solanacearum infection dynamics in resistant and susceptible pepper lines using bioluminescence imaging. Plant Dis. 101, 272–278. doi: 10.1094/PDIS-05-16-0714-RE
Fernández-Pinas, F., and Wolk, C. P. (1994). Expression of luxCD-E in Anabaena sp. can replace the use of exogenous aldehyde for in vivo localization of transcription by luxAB. Gene 150, 169–174. doi: 10.1016/0378-1119(94)90879-6
Furbank, R. T., Jimenez-Berni, J. A., George-Jaeggli, B., Potgieter, A. B., and Deery, D. M. (2019). Field crop phenomics: enabling breeding for radiation use efficiency and biomass in cereal crops. New Phytol. 223, 1714–1727. doi: 10.1111/nph.15817
Gu, G., Cevallos-Cevallos, J. M., van Bruggen, A. H. C., and Bereswill, S. (2013). Ingress of Salmonella enterica Typhimurium into tomato leaves through hydathodes. PLoS ONE 8:53470. doi: 10.1371/journal.pone.0053470
Gu, G., Hu, J., Cevallos-Cevallos, J. M., Richardson, S. M., Bartz, J. A., and van Bruggen, A. H. C. (2011). Internal colonization of Salmonella enterica serovar typhimurium in tomato plants. PLoS ONE 6:e27340. doi: 10.1371/journal.pone.0027340
Gupta, R. K., Patterson, S. S., Ripp, S., Simpson, M. L., and Sayler, G. S. (2003). Expression of the Photorhabdus luminescens lux genes (luxA, B, C, D, and E) in Saccharomyces cerevisiae. FEMS Yeast Res. 4, 305–313. doi: 10.1016/S1567-1356(03)00174-0
Hanahan, D. (1983). Studies on transformation of Escherichia coli with plasmids. J. Mol. Biol. 166, 557–580. doi: 10.1016/S0022-2836(83)80284-8
Horsfall, J. G., and Barratt, R. (1945). An improved grading system for measuring plant diseases. Phytopathology 35, 655–655.
Liabeuf, D., Sim, S.-C., and Francis, D. M. (2018). Comparison of marker-based genomic estimated breeding values and phenotypic evaluation for selection of bacterial spot resistance in tomato. Phytopathology 108, 392–401. doi: 10.1094/PHYTO-12-16-0431-R
Mazzucato, A., Papa, R., Bitocchi, E., Mosconi, P., Nanni, L., Negri, V., et al. (2008). Genetic diversity, structure and marker-trait associations in a collection of Italian tomato (Solanum lycopersicum L.) landraces. Theor. Appl. Genet. 116, 657–669. doi: 10.1007/s00122-007-0699-6
Mutka, A. M., and Bart, R. S. (2015). Image-based phenotyping of plant disease symptoms. Front. Plant Sci. 5:734. doi: 10.3389/fpls.2014.00734
Paynter, C. D., Salisbury, V. C., Arnold, D. L., and Jackson, R. W. (2006). The use of bioluminescence for monitoring in planta growth dynamics of a Pseudomonas syringae plant pathogen. Eu. J. Plant Pathol. 115, 363–366. doi: 10.1007/s10658-006-9018-3
Preston, G. M. (2000). Pseudomonas syringae pv. tomato: the right pathogen, of the right plant, at the right time. Mol. Plant Pathol. 1, 263–275. doi: 10.1046/j.1364-3703.2000.00036.x
R Core Team (2017). R: A Language and Environment for Statistical Computing. R Foundation for Statistical Computing, Vienna, Austria. Available online at: http://www.R-project.org/
Rajashekara, G., Glover, D. A., Krepps, M., and Splitter, G. A. (2005). Temporal analysis of pathogenic events in virulent and avirulent Brucella melitensis infections. Cell Microbiol. 7, 1459–1473. doi: 10.1111/j.1462-5822.2005.00570.x
Remus-Emsermann, M. N. P., Lücker, S., Müller, D. B., Potthoff, E., Daims, H., and Vorholt, J. A. (2014). Spatial distribution analyses of natural phyllosphere-colonizing bacteria on Arabidopsis thaliana revealed by fluorescence in situ hybridization. Environ. Microbiol. 16, 2329–2340. doi: 10.1111/1462-2920.12482
Rønn, L. C. B., Ralets, I., Hartz, B. P., Bech, M., Berezin, A., Berezin, V., et al. (2000). A simple procedure for quantification of neurite outgrowth based on stereological principles. J. Neurosci. Methods 100, 25–32. doi: 10.1016/S0165-0270(00)00228-4
Schindelin, J., Arganda-Carreras, I., Frise, E., Kaynig, V., Longair, M., Pietzsch, T., et al. (2012). Fiji: an open-source platform for biological-image analysis. Nat. Methods 9, 676–682. doi: 10.1038/nmeth.2019
Schmidt, H., Nunan, N., Höck, A., Eickhorst, T., Kaiser, C., Woebken, D., et al. (2018). Recognizing patterns: spatial analysis of observed microbial colonization on root surfaces. Front. Environ. Sci. 6:61. doi: 10.3389/fenvs.2018.00061
Srivastava, V., Deblais, L., Kathayat, D., Rotondo, F., Helmy, Y. A., Miller, S. A., et al. (2021). Novel small molecule growth inhibitors of Xanthomonas spp. causing bacterial spot of tomato. Phytopathology in press.
Thouand, G., and Marks, R. (2016). Bioluminescence: Fundamentals and Applications in Biotechnology Volume 3. Cham: Springer International Publishing. doi: 10.1007/978-3-319-27407-2
Vrisman, C. M., Deblais, L., Rajashekara, G., and Miller, S. A. (2016). Differential colonization dynamics of cucurbit hosts by Erwinia tracheiphila. Phytopathology 106, 684–692. doi: 10.1094/PHYTO-11-15-0289-R
Wang, Y. Q., Zhang, X. F., Li, N., and Liu, X. (2017). Comparison of cellular responses to Xanthomonas perforans infection between resistant and susceptible tomato accessions. J. Plant Physio. 209, 105–114. doi: 10.1016/j.jplph.2016.11.011
Xu, X., Miller, S. A., Baysal-Gurel, F., Gartemann, K.-H., Eichenlaub, R., and Rajashekara, G. (2010). Bioluminescence imaging of clavibacter michiganensis subsp. michiganensis infection of tomato seeds and plants. Appl. Environ. Microbiol. 76, 3978–3988. doi: 10.1128/AEM.00493-10
Yang, W., Sacks, E. J., Lewis Ivey, M. L., Miller, S. A., and Francis, D. M. (2005). Resistance in Lycopersicon esculentum intraspecific crosses to race t1 strains of xanthomonas campestris pv. Vesicatoria causing bacterial spot of tomato. Phytopathology 95, 519–527. doi: 10.1094/PHYTO-95-0519
Keywords: bacterial spot, phenotyping, tomato, Solanum lycopersicum, disease screening, heritability
Citation: Bernal E, Deblais L, Rajashekara G and Francis DM (2021) Bioluminescent Xanthomonas hortorum pv. gardneri as a Tool to Quantify Bacteria in Planta, Screen Germplasm, and Identify Infection Routes on Leaf Surfaces. Front. Plant Sci. 12:667351. doi: 10.3389/fpls.2021.667351
Received: 12 February 2021; Accepted: 18 May 2021;
Published: 15 June 2021.
Edited by:
Adi Avni, Tel Aviv University, IsraelReviewed by:
Omri M. Finkel, University of North Carolina at Chapel Hill, United StatesBrian H. Kvitko, University of Georgia, United States
Copyright © 2021 Bernal, Deblais, Rajashekara and Francis. This is an open-access article distributed under the terms of the Creative Commons Attribution License (CC BY). The use, distribution or reproduction in other forums is permitted, provided the original author(s) and the copyright owner(s) are credited and that the original publication in this journal is cited, in accordance with accepted academic practice. No use, distribution or reproduction is permitted which does not comply with these terms.
*Correspondence: David M. Francis, ZnJhbmNpcy43N0Bvc3UuZWR1