- 1Institute of Horticulture, Henan Academy of Agricultural Sciences, Postgraduate T&R Base of Zhengzhou University, Zhengzhou, China
- 2School of Agricultural Sciences, Zhengzhou University, Zhengzhou, China
Flower color is an important trait in plants. However, genes responsible for the white flower trait in Chinese cabbage are rarely reported. In this study, we constructed an F2 population derived from the Y640-288 (white flower) and Y641-87 (yellow flower) lines for the fine mapping of the white flower gene BrWF3 in Chinese cabbage. Genetic analysis indicated that BrWF3 was controlled by a single recessive gene. Using BSA-seq and KASP assays, BrWF3 was fine-mapped to an interval of 105.6 kb. Functional annotation, expression profiling, and sequence variation analyses confirmed that the AtPES2 homolog, Bra032957, was the most likely candidate gene for BrWF3. Carotenoid profiles and transmission electron microscopy analysis suggested that BrWF3 might participate in the production of xanthophyll esters (particularly violaxanthin esters), which in turn disrupt chromoplast development and the formation of plastoglobules (PGs). A SNP deletion in the third exon of BrWF3 caused the loss of protein function, and interfered with the normal assembly of PGs, which was associated with reduced expression levels of genes involved in carotenoid metabolism. Furthermore, we developed and validated the functional marker TXBH83 for BrWF3. Our results provide insight into the molecular mechanism underlying flower color pigmentation and reveal valuable information for marker-assisted selection (MAS) breeding in Chinese cabbage.
Introduction
Flower color is one of the most important traits in plants, which provides a visual signal to attract insects for pollination (Kevan and Baker, 1983; Ariizumi et al., 2014). It also protects plants against disease and UV radiation and helps to maintain the normal physiological function of floral organs (Koes et al., 1994). In breeding, flower color can be used for identifying true/false hybrids and for evaluating seed purity in hybrid production (Zhang et al., 2018b). Carotenoids, flavonoids and betalains are three main classes of natural pigments contributing to different flower colors, among which the accumulation of carotenoids can cause yellow, orange and red colorations (DellaPenna and Pogson, 2006; Grotewold, 2006). In nature, greater than 800 structurally different carotenoid compounds have been identified (Nisar et al., 2015; Ding et al., 2019), which are further divided into two main groups, carotenes and xanthophylls (Nisar et al., 2015; Ding et al., 2019). In many cases, xanthophylls (i.e., letein, zeaxanthin, and violaxanthin) are the most prevalent carotenoids in yellow flowers (Ohmiya, 2011). The amount of carotenoids is a net result of biosynthesis, degradation and stable storage (Deruere et al., 1994; Li and Yuan, 2013; Ariizumi et al., 2014; Nisar et al., 2015; Yuan et al., 2015). Thus, factors that are associated with these processes act together to regulate the final carotenoid levels. Almost all of the genes and enzymes that catalyze the core reactions of carotenoid biosynthesis and degradation have been identified in plants (Yuan et al., 2015), whereas only a few genes have been reported to be involved in carotenoid sequestration and storage.
Carotenoids accumulate at high levels in chromoplasts, which possess a superior storage capacity to deposit carotenoids in carotenoid-lipoprotein sequestering structures, such as plastoglobules (PGs) (Li and Yuan, 2013; Yuan et al., 2015; Li et al., 2016). These structures contain carotenoids, polar lipids and carotenoid-associated proteins (van Wijk and Kessler, 2017). Carotenoids occupying the inner core interact with the acyl residues of polar lipids, which subsequently interact with carotenoid-associated proteins via polar head groups (Deruere et al., 1994; Vishnevetsky et al., 1999). Genes participating in the biogenesis of chromoplasts and the formation of carotenoid sequestration structures exert a strong effect on carotenoid metabolism in crops. For example, the Or gene, which encodes a DnaJ cysteine-rich domain-containing protein, triggers the differentiation of non-colored plastids into chromoplasts with an increased capacity to accumulate β-carotene in cauliflower and potato (Lu et al., 2006; Lopez et al., 2008). Either the fibrillin gene in pepper or the CHRC gene in cucumber, which encode carotenoid-associated proteins, is positively associated with carotenoid accumulation (Vishnevetsky et al., 1996; Pozueta-Romero et al., 1997). Overexpression of the pepper fibrillin gene in tomato increases the levels of carotenoids in fruits (Simkin et al., 2007). The PYP1 gene in tomato, which is homologous to PES2 (PHYTYL ESTER SYNTHASE 2) in Arabidopsis, plays a vital role in the production of xanthophyll esters in tomato anthers and petals (Ariizumi et al., 2014). Functional disruption of PYP1 converts flower color from yellow to pale yellow (Ariizumi et al., 2014). In pale-yellow-flowered petunia, the lower expression of xanthophyll esterase (XES) and lower proportions of esterified xanthophylls are the main reasons for low carotenoid accumulation (Kishimoto et al., 2019). Overexpression of XES from petals of Ipomoea obscura, tomato (PYP1 gene), and marigold (Tagetes erecta) in this pale-yellow-flowered petunia all increases the esterified xanthophylls and causes deeper yellow coloration in flowers (Kishimoto et al., 2020).
In Brassica species, several genes controlling flower color have been reported. In B.napus and B.oleracea, the white flower trait is controlled by a single dominant gene, carotenoid cleavage dioxygenase 4 (CCD4). A CACTA-like transposable element insertion in CCD4 results in a petal color transition from white to yellow (Zhang B. et al., 2015; Han et al., 2019). In B.juncea, two recessive genes (Bjpc1 and Bjpc2) control the white flower gene (Zhang et al., 2018a,b). These two genes, which are located on chromosomes A02 and B04, respectively, are homologous to AtPES2 and participate in xanthophyll esterification (Zhang et al., 2018a,b). In B.rapa, the carotenoid isomerase (BrCRTISO) gene controls orange flower color as well as the orange coloration of the inner leaves of Chinese cabbage (Su et al., 2014; Zhang J. X. et al., 2015). Recently, Zhang N. et al. (2020) reported that the white flower trait in Chinese cabbage is controlled by two recessive loci, Brwf1 and Brwf2. These two genes are located on chromosomes A01 and A09 and encode a plastid-lipid associated protein (PAP) and a carotenoid isomerase enzyme, respectively. Another study revealed that the white flower trait in B.rapa is controlled by a single recessive gene (Rahman, 2001). However, the gene underlying this white flower trait has not been reported thus far.
In this study, we conducted positional cloning of the white flower gene (BrWF3) in Chinese cabbage by using F2 populations derived from the white-flowered DH line ‘Y640-288’ and the yellow-flowered DH line ‘Y641-87’. The BrWF3 gene was mapped to chromosome A02, and Bra032957, which is homologous to AtPES2, was identified as the candidate gene. Based on carotenoids profile analysis and transmission electron microscopy (TEM) analysis, as well as transcriptome analysis, the BrWF3 gene was predicted to participate in carotenoids esterification and the biogenesis of PGs. A functional marker of BrWF3 was also developed and validated in our study. This work will promote molecular marker-assisted selection (MAS) breeding and the exploration of molecular mechanisms that regulate flower color variation in Chinese cabbage.
Materials and Methods
Plant Materials
Two Chinese cabbage DH lines, white-flowered Y640-288 and yellow-flowered Y641-87, were used as parental lines to generate F1 and F2 populations for inheritance analysis and gene mapping. Additionally, three F2 populations, (Y640-288 × SD369)-F2, (Y640-288 × Chiifu)-F2, (Y66-83 × R16-11)-F2, were generated for marker validation by crossing the white-flowered DH lines Y640-288 and Y66-83 with the yellow-flowered DH lines SD369, Chiifu and R16-11. Furthermore, ten white-flowered and ten yellow-flowered DH lines (Supplementary Table 1) were also used to analyze mutations in the candidate gene. All the materials used in this study were provided by Institute of Horticulture, Henan Academy of Agricultural Sciences.
Transmission Electron Microscopy (TEM) Analysis
Petals from Y640-288 and Y641-87 flowers at the flowering stage were used for transmission electron microscopy (TEM) analysis, which was performed according to Ariizumi et al. (2004).
Carotenoid Identification and Quantification
Carotenoid composition was measured by MetWare (Wuhan, China). Petals from 10 white-flowered F2 plants were combined to form one replicate W-bulk and petals from 10 yellow-flowered F2 plants were included in the Y-bulk. In total, three replicates were assessed. Fresh petals were frozen in liquid nitrogen and stored at −80°C until needed. The direct extraction steps were performed according to Zhou et al. (2020). The saponified extraction steps were performed according to Inbaraj et al. (2008) with some modification. The direct and saponified extracts were then analyzed using an LC-APCI-MS/MS system (UHPLC, ExionLCs AD; MS, Applied Biosystems 6500 Triple Quadrupole). The chromatographic conditions and parameters for API 6500 Q TRAP LC-MS/MS System were performed as previously reported (Liu et al., 2020; Wang et al., 2020; Zhou et al., 2020). Specific procedures for extraction, identification and quantification of carotenoids were supported in Supplementary Material 1.
Carotenoids were identified by comparing their retention times and ion pair information (Supplementary Table 2). In saponified extracts, the integrated peak area was substituted into the linear equations of standard (Sigma, St. Louis, MO, United States) curves for content calculation (Supplementary Table 3); finally, the absolute content data for the carotenoids in the actual samples were obtained. Carotenoid content (μg/g) = B∗C/1000/D, where B is the concentration (μg/mL) obtained by substituting the integrated peak area of a carotenoid in the sample into the corresponding standard curve, C is the resuspension volume (μL), and D is the mass of the weighed sample (g) (Liu et al., 2020; Wang et al., 2020; Zhou et al., 2020).
Bulked Segregant Analysis (BSA) by Resequencing
Using the modified cetyltrimethylammonium bromide (CTAB) method, total genomic DNA was isolated from young leaves of the parents and F2 (Y640-288 × Y641-87) plants (Liu et al., 2003). For BSA-seq, two DNA pools were constructed by mixing equal amounts of DNA from 50 white-flowered F2 individuals (W-pool) and 50 yellow-flowered F2 individuals (Y-pool). The Illumina HiSeq X Ten platform was used to generate 150-base paired-end reads for Y640-288, Y641-87, the W-pool and the Y-pool by Anoroad Biotech Co., Ltd. (Beijing, China). The raw data were deposited in the Sequence Read Archive (SRA) in NCBI as PRJNA682710.
The clean reads of Y640-288, Y641-87, the W-pool and the Y-pool were aligned to the B.rapa Chiifu reference genome version 1.5 using BWA software (Li and Durbin, 2010). SAMtools software package (version 1.3.1) (Li et al., 2009) was then used to call single-nucleotide polymorphism (SNP) and insertion/deletion (InDel) variants based on alignment files. To identify candidate regions associated with the white flower trait, the SNP-index and △(SNP-index) were calculated for all genomic positions in the W-pool and Y-pool. The SNP-index was estimated from the proportion of reads harboring SNPs among the entire number of reads compared to the reference genome sequence (Abe et al., 2012). Then △(SNP-index) was calculated by subtracting the SNP-index of the Y-pool from that of the W-pool (Takagi et al., 2013). We filtered out SNPs with SNP-index <0.3 or >0.8 simultaneously in the two bulked pools. Furthermore, SNPs with heterozygous genotypes in the parental lines were also excluded. A 1-Mb sliding window with a 50-kb increment was applied to slide across the genome, and Δ(SNP-index) graphs were plotted using the average Δ(SNP-index) against the positions of each sliding window. We calculated the statistical confidence intervals of Δ(SNP-index) among all SNP positions with given read depths under the null hypothesis of no major genes, and the 95% and 99% confidence intervals of the Δ(SNP-index) were then generated for each read depth according to Takagi et al. (2013).
Kompetitive Allele-Specific PCR (KASP) Marker and Linkage Map Development
To map the BrWF3 gene, we extracted the 70-bp upstream and downstream sequences of the selected SNP for KASP marker development. For each selected SNP, two allele-specific forward primers and one common reverse primer were designed using the Primer Premier 5.0 program (Singh et al., 1998) according to the standard KASP guidelines. The two allele-specific primers were added with the standard FAM (5′-GAAGGTGACCAAGTTCATGCT-3′) and HEX (5′-GAAGGTCGGAGTCAACGGATT-3′) tails at the 5′ end. The developed KASP markers were first validated in the two parental lines and F1 plants for polymorphism screening. Then, the polymorphic KASP markers (Supplementary Table 4) were employed to genotype the F2 population using 135 individuals. KASP assays were performed as described by Yang et al. (2020). The genetic linkage map was constructed using JoinMap 4.01 software. Recombination values were converted into genetic map distances (cM) following the Kosambi mapping function (Kosambi, 1944).
Cloning and Sequence Analysis of the Candidate Genes
To clone the DNA and cDNA sequences of the putative candidate genes, primers (Supplementary Table 5) were designed according to the B.rapa reference genome. PCR amplification was performed in a total volume of 25 μL according to the manual supplied with Phanta Max Master Mix (Vazyme Biotech Co., Ltd., Nanjing, China). The PCR products were sequenced by Sunya Biotech Co., Ltd. (Zhengzhou, China), and sequence alignments were performed using DNAMAN software. The complete coding sequences of candidate gene from Y641-87 and Y640-288 were submitted to GenBank under the accession numbers: MW362118 (Y641-87) and MW362119 (Y640-288), respectively.
Quantitative Real-Time PCR (qRT-PCR)
Total RNA was extracted using the RNAprep Pure Plant Kit (Tiangen, Beijing, China) according to the manufacturer’s instructions. First-strand cDNAs were synthesized in a 20 μL volume containing approximately 7 μg RNA and oligo (dT) primers using the TransScript One-Step gDNA Removal and cDNA Synthesis Kit (Trans, Beijing, China). qRT-PCR was performed with 2 × TB Green Premix Ex Taq II (TaKaRa, Japan) on a Roche LightCycler 480-II System (Roche Applied Sciences, Beijing, China). The Bractin gene was used as an internal control (Fujimoto et al., 2006; Takada et al., 2019). Each qRT-PCR experiment was performed in triplicate and the resultant mean value was used for qRT-PCR analysis (Zhang et al., 2013). Relative expression levels were calculated using the 2–Δ Δ Ct method (Livak and Schmittgen, 2001).
Transcriptome Analysis
The W-bulk and Y-bulk each with three replicates used for carotenoid analysis were also used for transcriptome analysis. Six cDNA libraries were constructed and sequenced on the Illumina HiSeq X Ten platform at Metware Biotech Co., Ltd. (Wuhan, China). Raw reads were filtered by removing low-quality reads and reads containing the adapter or ploy-N using in-house Perl scripts available from Metware Biotech Co., Ltd. (Wuhan, China). The clean reads were aligned to the B.rapa V1.5 reference genome using HISAT2 software (Kim et al., 2015). Differentially expressed genes (DEGs) were identified using the DESeq2 package (v1.30.0) (Love et al., 2014). The P-value of the DEGs between samples was adjusted using the Benjamini & Hochberg method (Benjamini and Hochberg, 2000). Genes with an adjusted P-value ≤0.05 and | log2 (fold change)| ≥ 1 were recognized as DEGs. To determine the biological significance of the DEGs, Kyoto Encyclopedia of Genes and Genomes (KEGG) pathway enrichment analysis was implemented using KOBAS software (Wu et al., 2006).
Results
Phenotypic Characterization and Genetic Analysis of White Flowers in Chinese Cabbage
The phenotypic analyses showed significant differences in flower color between the two parental lines. In Y641-87, the flower organs, particularly the petal tissue, showed stable yellow coloration at the flowering stage, whereas those of Y640-288 showed white coloration (Figures 1A,B). The flower color in Y640-288 was traditionally called white color. It was not like white papers as in B.napus and B.oleracea (Zhang B. et al., 2015; Han et al., 2019), but similar to that in B.juncea (Zhang et al., 2018a,b), the flowers of which still had pale yellow pigments. TEM analysis showed that the petals of Y641-87 had normal chromoplasts with numerous fully developed PGs, whereas the petals of Y640-288 showed abnormal chromoplasts with only a few irregular and small PGs (Figures 1C,D).
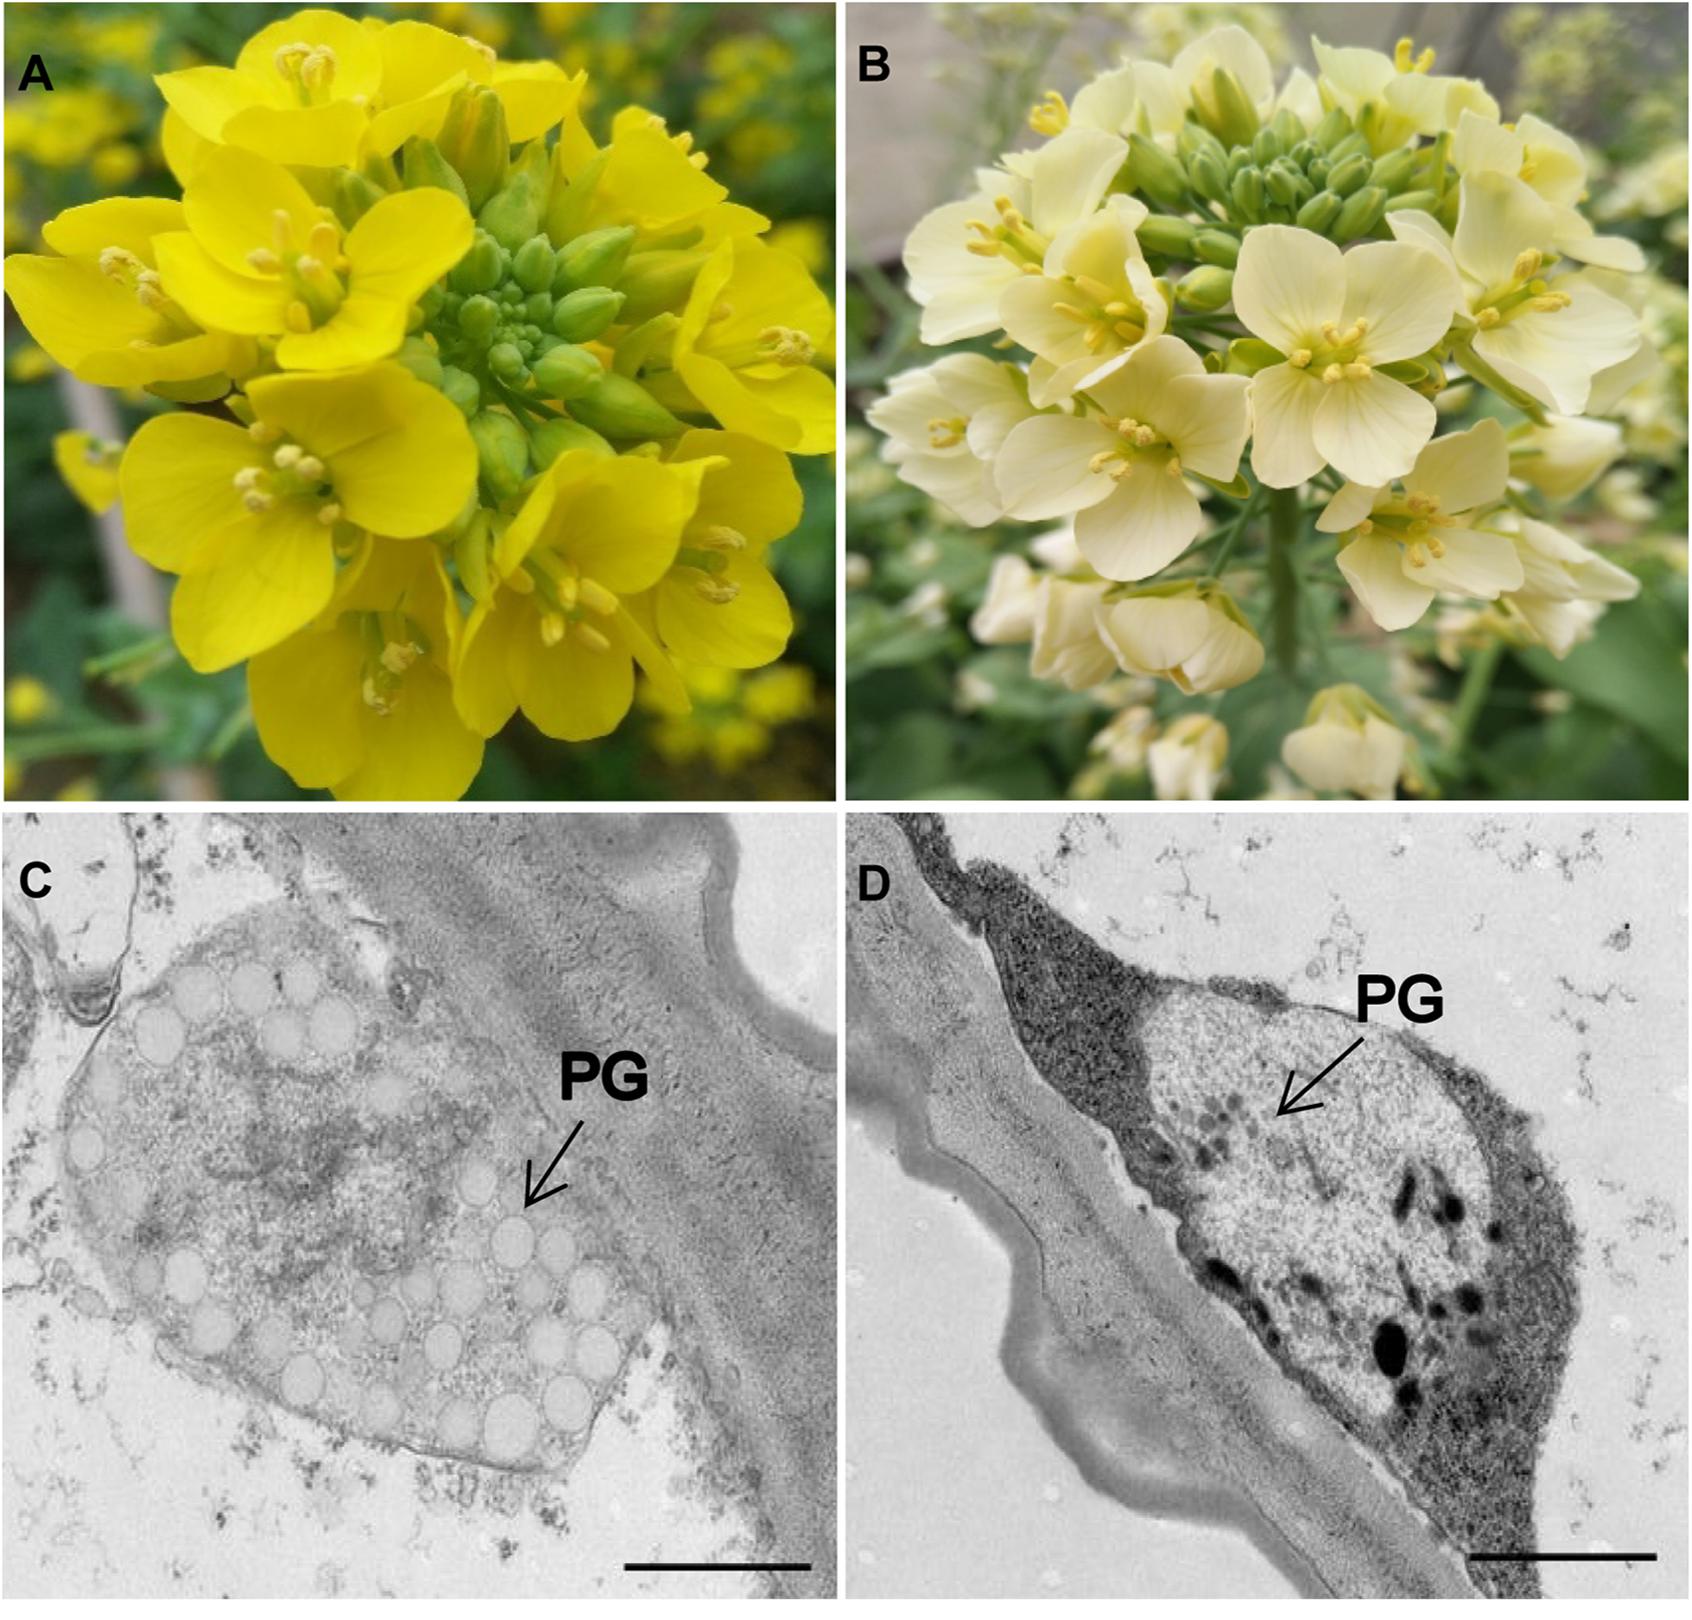
Figure 1. Flower coloration and chromoplast ultrastructure in the parental lines. (A) Yellow-flowered Y641-87. (B) White-flowered Y640-288. (C,D) Plastid ultrastructure in Y641-87 and Y640-288. PG, plastoglobule; Scale bar, 1 μm in (C,D).
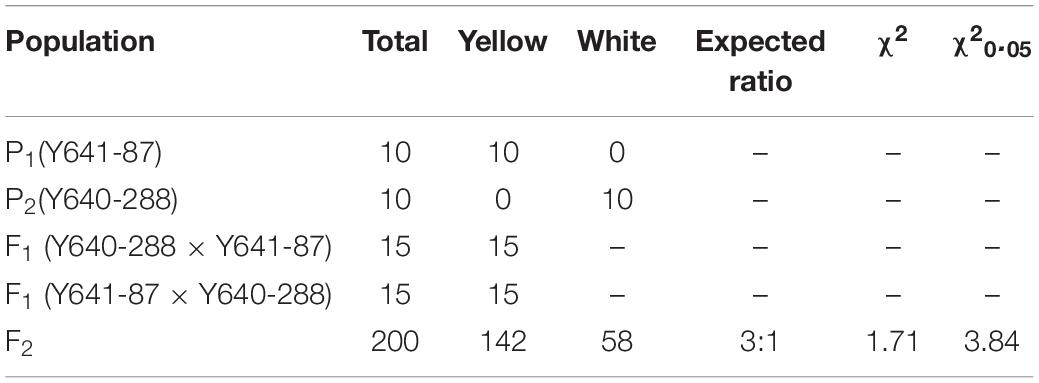
To investigate the genetic inheritance of white flowers in Chinese cabbage, we performed reciprocal crosses between Y641-87 and Y640-288. The resulting F1 plants all displayed a yellow flower phenotype. The flowers of F2 plants exhibited two types of colorations, corresponding to the coloration of either Y641-87 or Y640-288. Among 200 F2 individuals, 142 exhibited yellow flowers, and 58 showed white flowers, corresponding to a segregation ratio of 3:1 by the Chi-square test (Table 1). In a larger F2 population, the segregation ratio was also 3:1 (1775 yellow:596 white, χ2 = 0.02). These results demonstrated that the inheritance of the white flower trait in Y640-288 follows a monogenic recessive pattern. We named this white flower gene BrWF3.
Carotenoid Analysis in Yellow and White Flowers
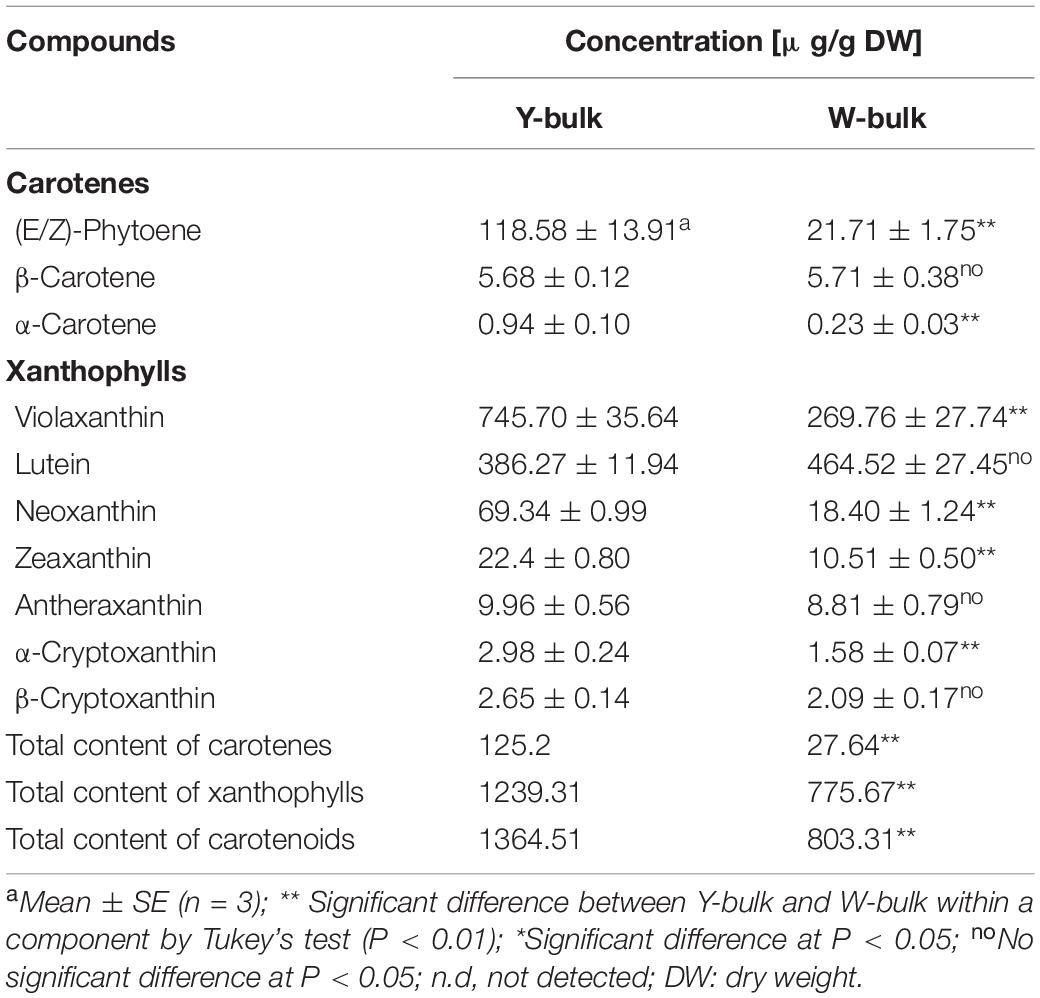
To investigate whether the lower pigmentation in white flowers was due to decreased carotenoid accumulation, we analyzed the carotenoid profiles of a white petal pool (W-bulk) and a yellow petal pool (Y-bulk). We detected 20 carotenoid peaks in the Y-bulk in the direct extracts (Figure 2 and Supplementary Table 6). Among these peaks, 9 peaks represented esterified carotenoids with retention times ranging from 5.5-7.5 min, as these peaks were not detected in the saponified sample (Figure 2). The esterified carotenoids are mostly derived from lutein and violaxanthin (Supplementary Table 6). In contrast, the composition and content of carotenoid esters in the W-bulk were much less than those in the Y-bulk (Figure 2). Analysis with saponification identified 10 carotenoids in both the W-bulk and Y-bulk (Figure 2 and Table 2). Two major xanthophylls, violaxanthin and lutein, accounted for approximately 83 and 91% of the total carotenoids in the Y-bulk and the W-bulk, respectively. The total average content of violaxanthin and all carotenoids in Y-bulk was about 2.76 and 1.70 times higher than that in the W-bulk, whereas lutein content did not significantly differ between Y-bulk and W-bulk (Table 2). Taken together, these results indicated that white petals accumulate less xanthophylls esters (likely violaxanthin esters) than yellow petals, resulting in lower carotenoid accumulation and color pigmentation.
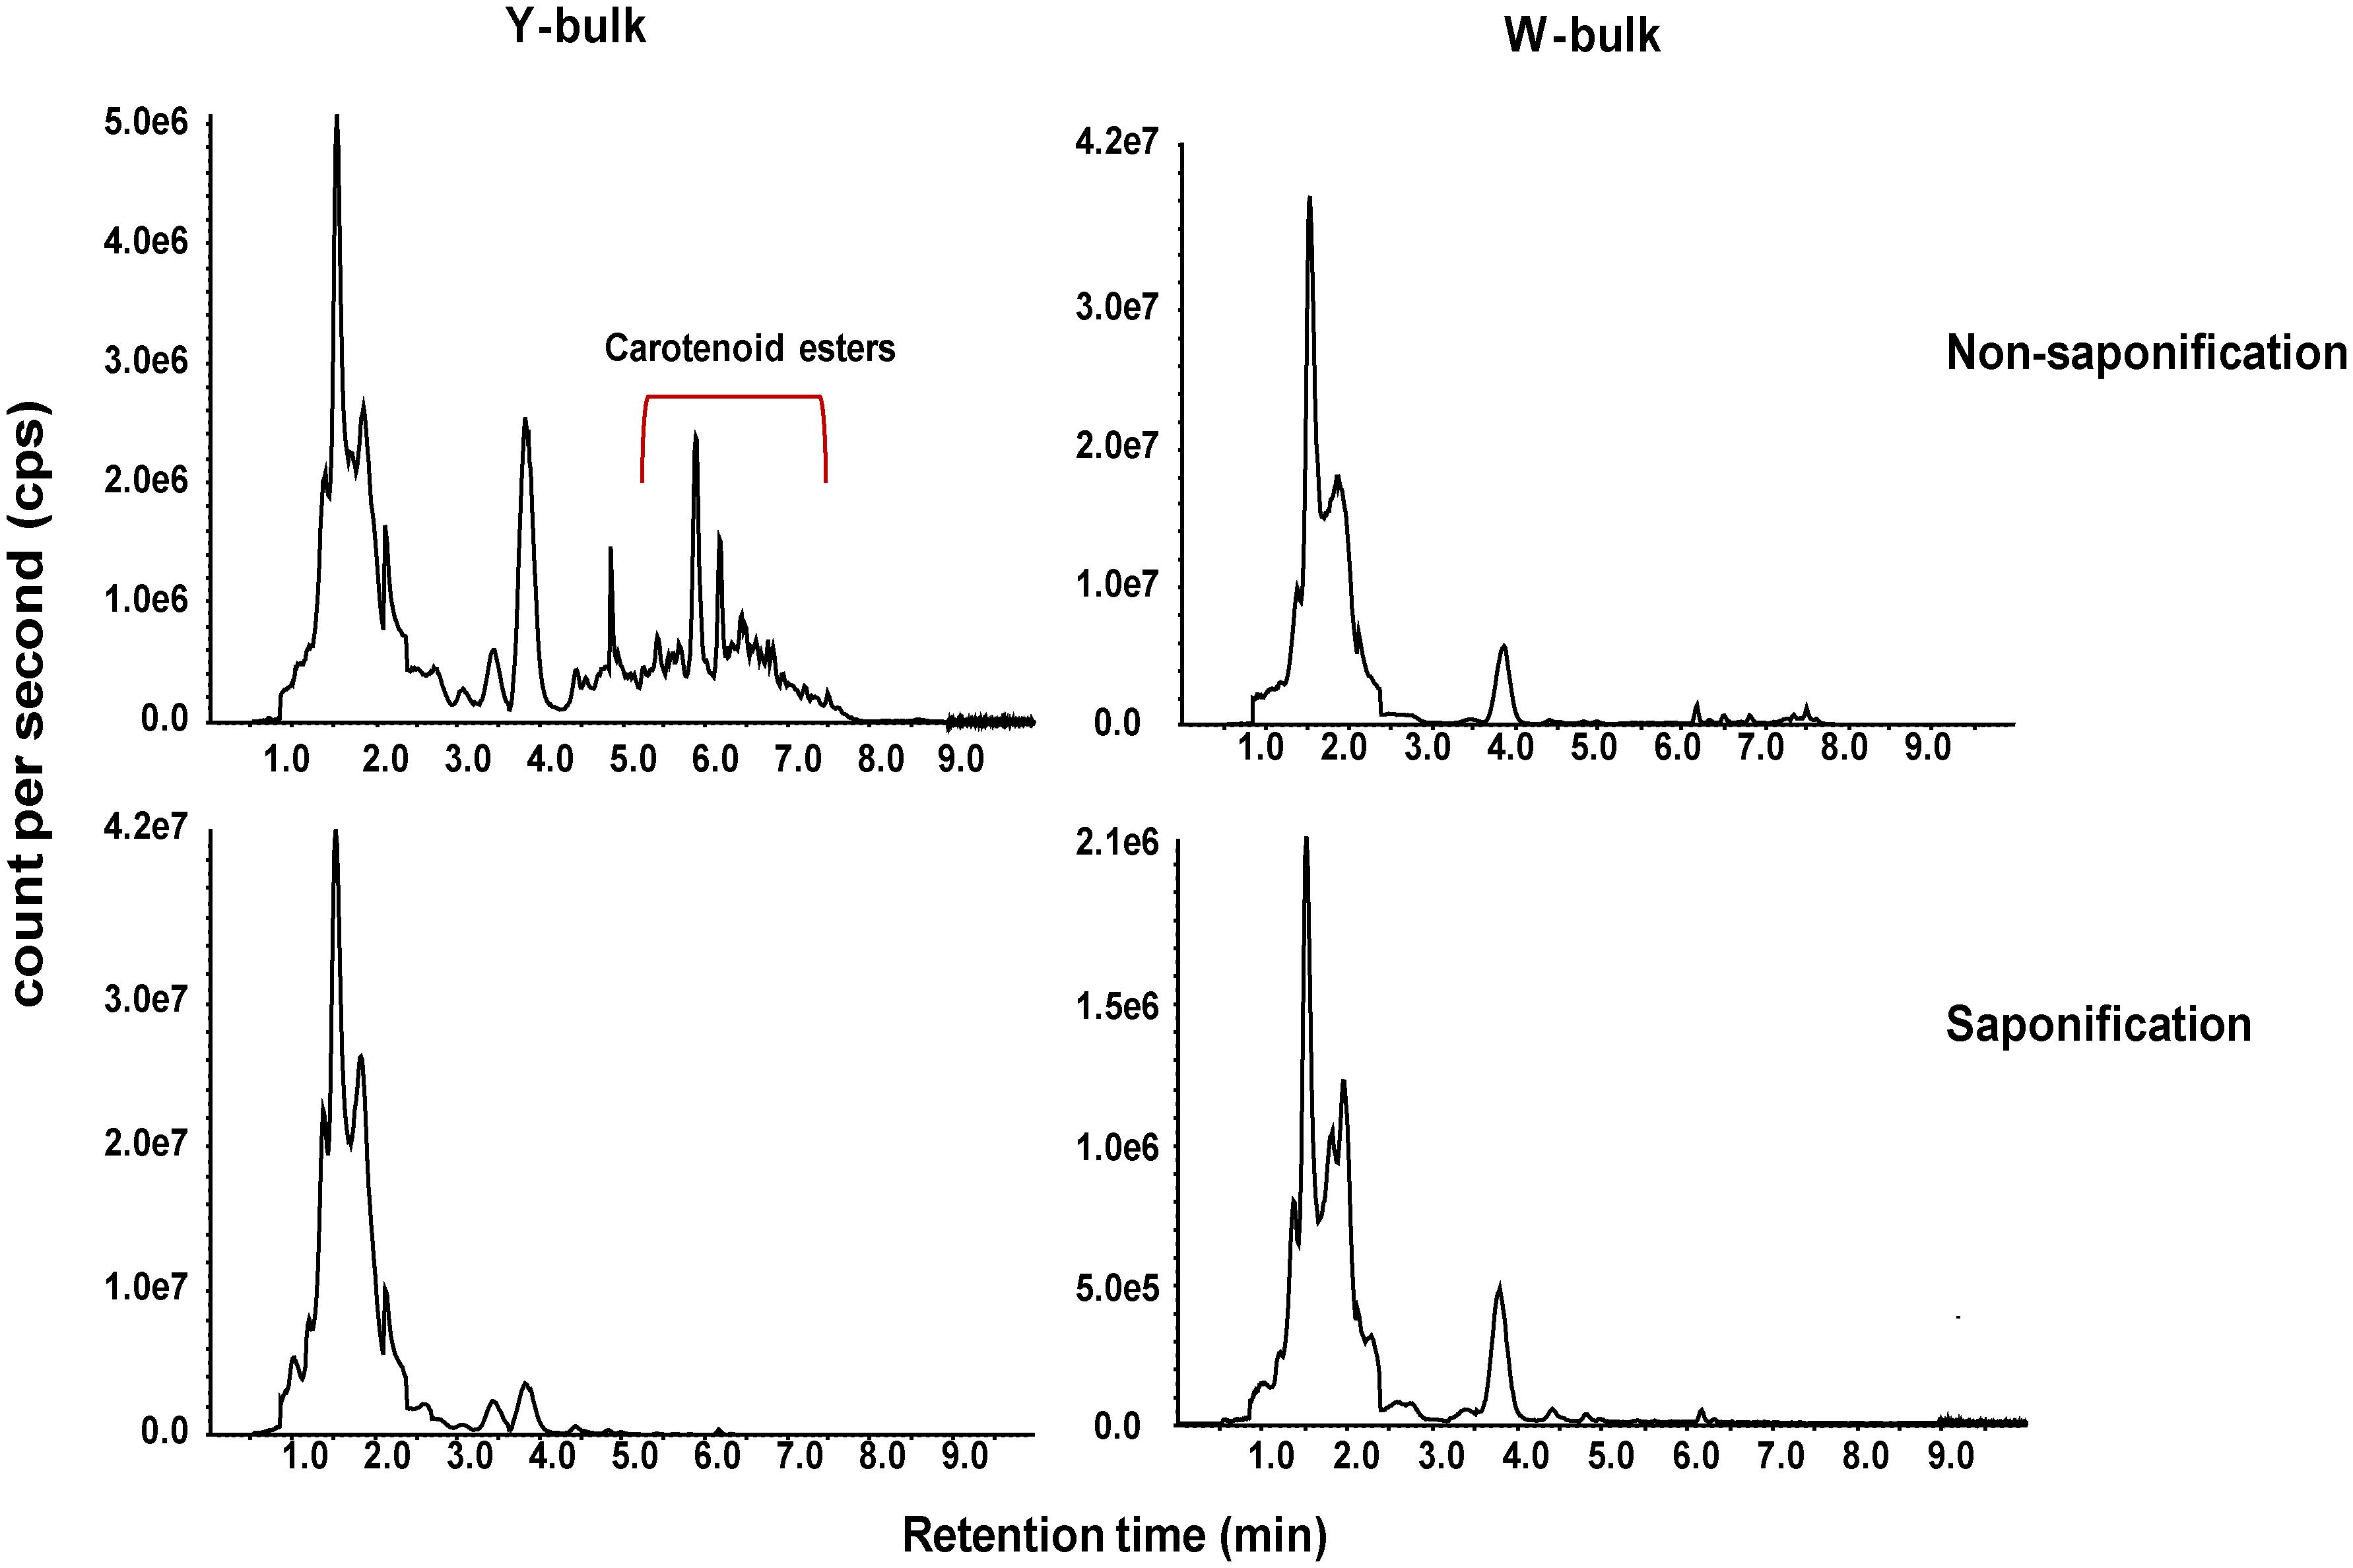
Figure 2. Total ion chromatograms of carotenoids in yellow and white petals. Carotenoids extracts from mature yellow (left column) and white (right column) petals were subjected to LC-APCI-MS/MS analysis under non-saponification (up row) and saponification (down row) treatments.
The BrWF3 Gene Is Located on Chromosome A02
To map the BrWF3 gene, we conducted BSA-seq using two pooled samples, which comprised 50 white-flowered (W-pool) and 50 yellow-flowered (Y-pool) F2 plants, and two parental lines, Y640-288 and Y641-87. In total, 204, 209, 120, and 86 million raw data were generated for the W-pool, Y-pool, Y640-288 and Y641-87 (Supplementary Table 7), representing approximately 63-, 64-, 37- and 26-fold genome coverage, respectively, based on the estimated genome size of 485 Mb (Wang et al., 2011). The clean reads of each sample were mapped to the reference genome of the Chiifu cultivar. After filtering, a total of 358,141 SNPs and 54,500 InDels, which were distributed merely on ten chromosomes, were identified between the W-pool and the Y-pool. The Δ(SNP-index) of each position was calculated for sliding window analysis. According to the null hypothesis, a total of five adjacent regions on chromosome A02 (Supplementary Figure 1 and Supplementary Table 8) exhibiting significant linkage disequilibrium were identified as the candidate region for white flower trait at a 95% significant level. These results were not consistent with the assumption that the white flower trait is controlled by a single recessive nuclear genetic locus. However, most of the genomic regions on other chromosomes exhibited a Δ(SNP-index) = 0. In theory, the SNP-index of the W- and Y-pools should be the same in the genomic regions that are not related to the phenotypic diference (SNP-index = 0.5), and Δ(SNP-index) should equal to 0 (Islam et al., 2016; Wang et al., 2017). Therefore, the most likely chromosome where BrWF3 located was A02.
Fine Mapping of the BrWF3 Gene
Based on BSA-seq analysis, 46 KASP markers previously available in our group (Yang et al., 2020) and 65 newly developed KASP markers, which were uniformly distributed across chromosome A02, were used to identify polymorphisms between the two parental lines (Y640-288 and Y641-87). The results showed that 29 KASP markers (Supplementary Table 4) exhibited polymorphism. These polymorphic markers were further genotyped in 135 F2 plants for linkage analysis (Supplementary Table 9). The 135 F2 plants is a sub-set from the ‘whole’ population containing 200 plants in Table 1. The results revealed no recombinant individuals between BrWF3 and markers TXBH57, TXBH58, TXBH62 and TXBH30 and 3 recombinant individuals between TXBH64 and BrWF3. The genetic distances between the BrWF3 locus and TXBH30 and TXBH64 were 0.7 and 2.0 cM, respectively (Figure 3A). The order of the markers in the genetic map is consistent with that in the physical map (Figure 3A).
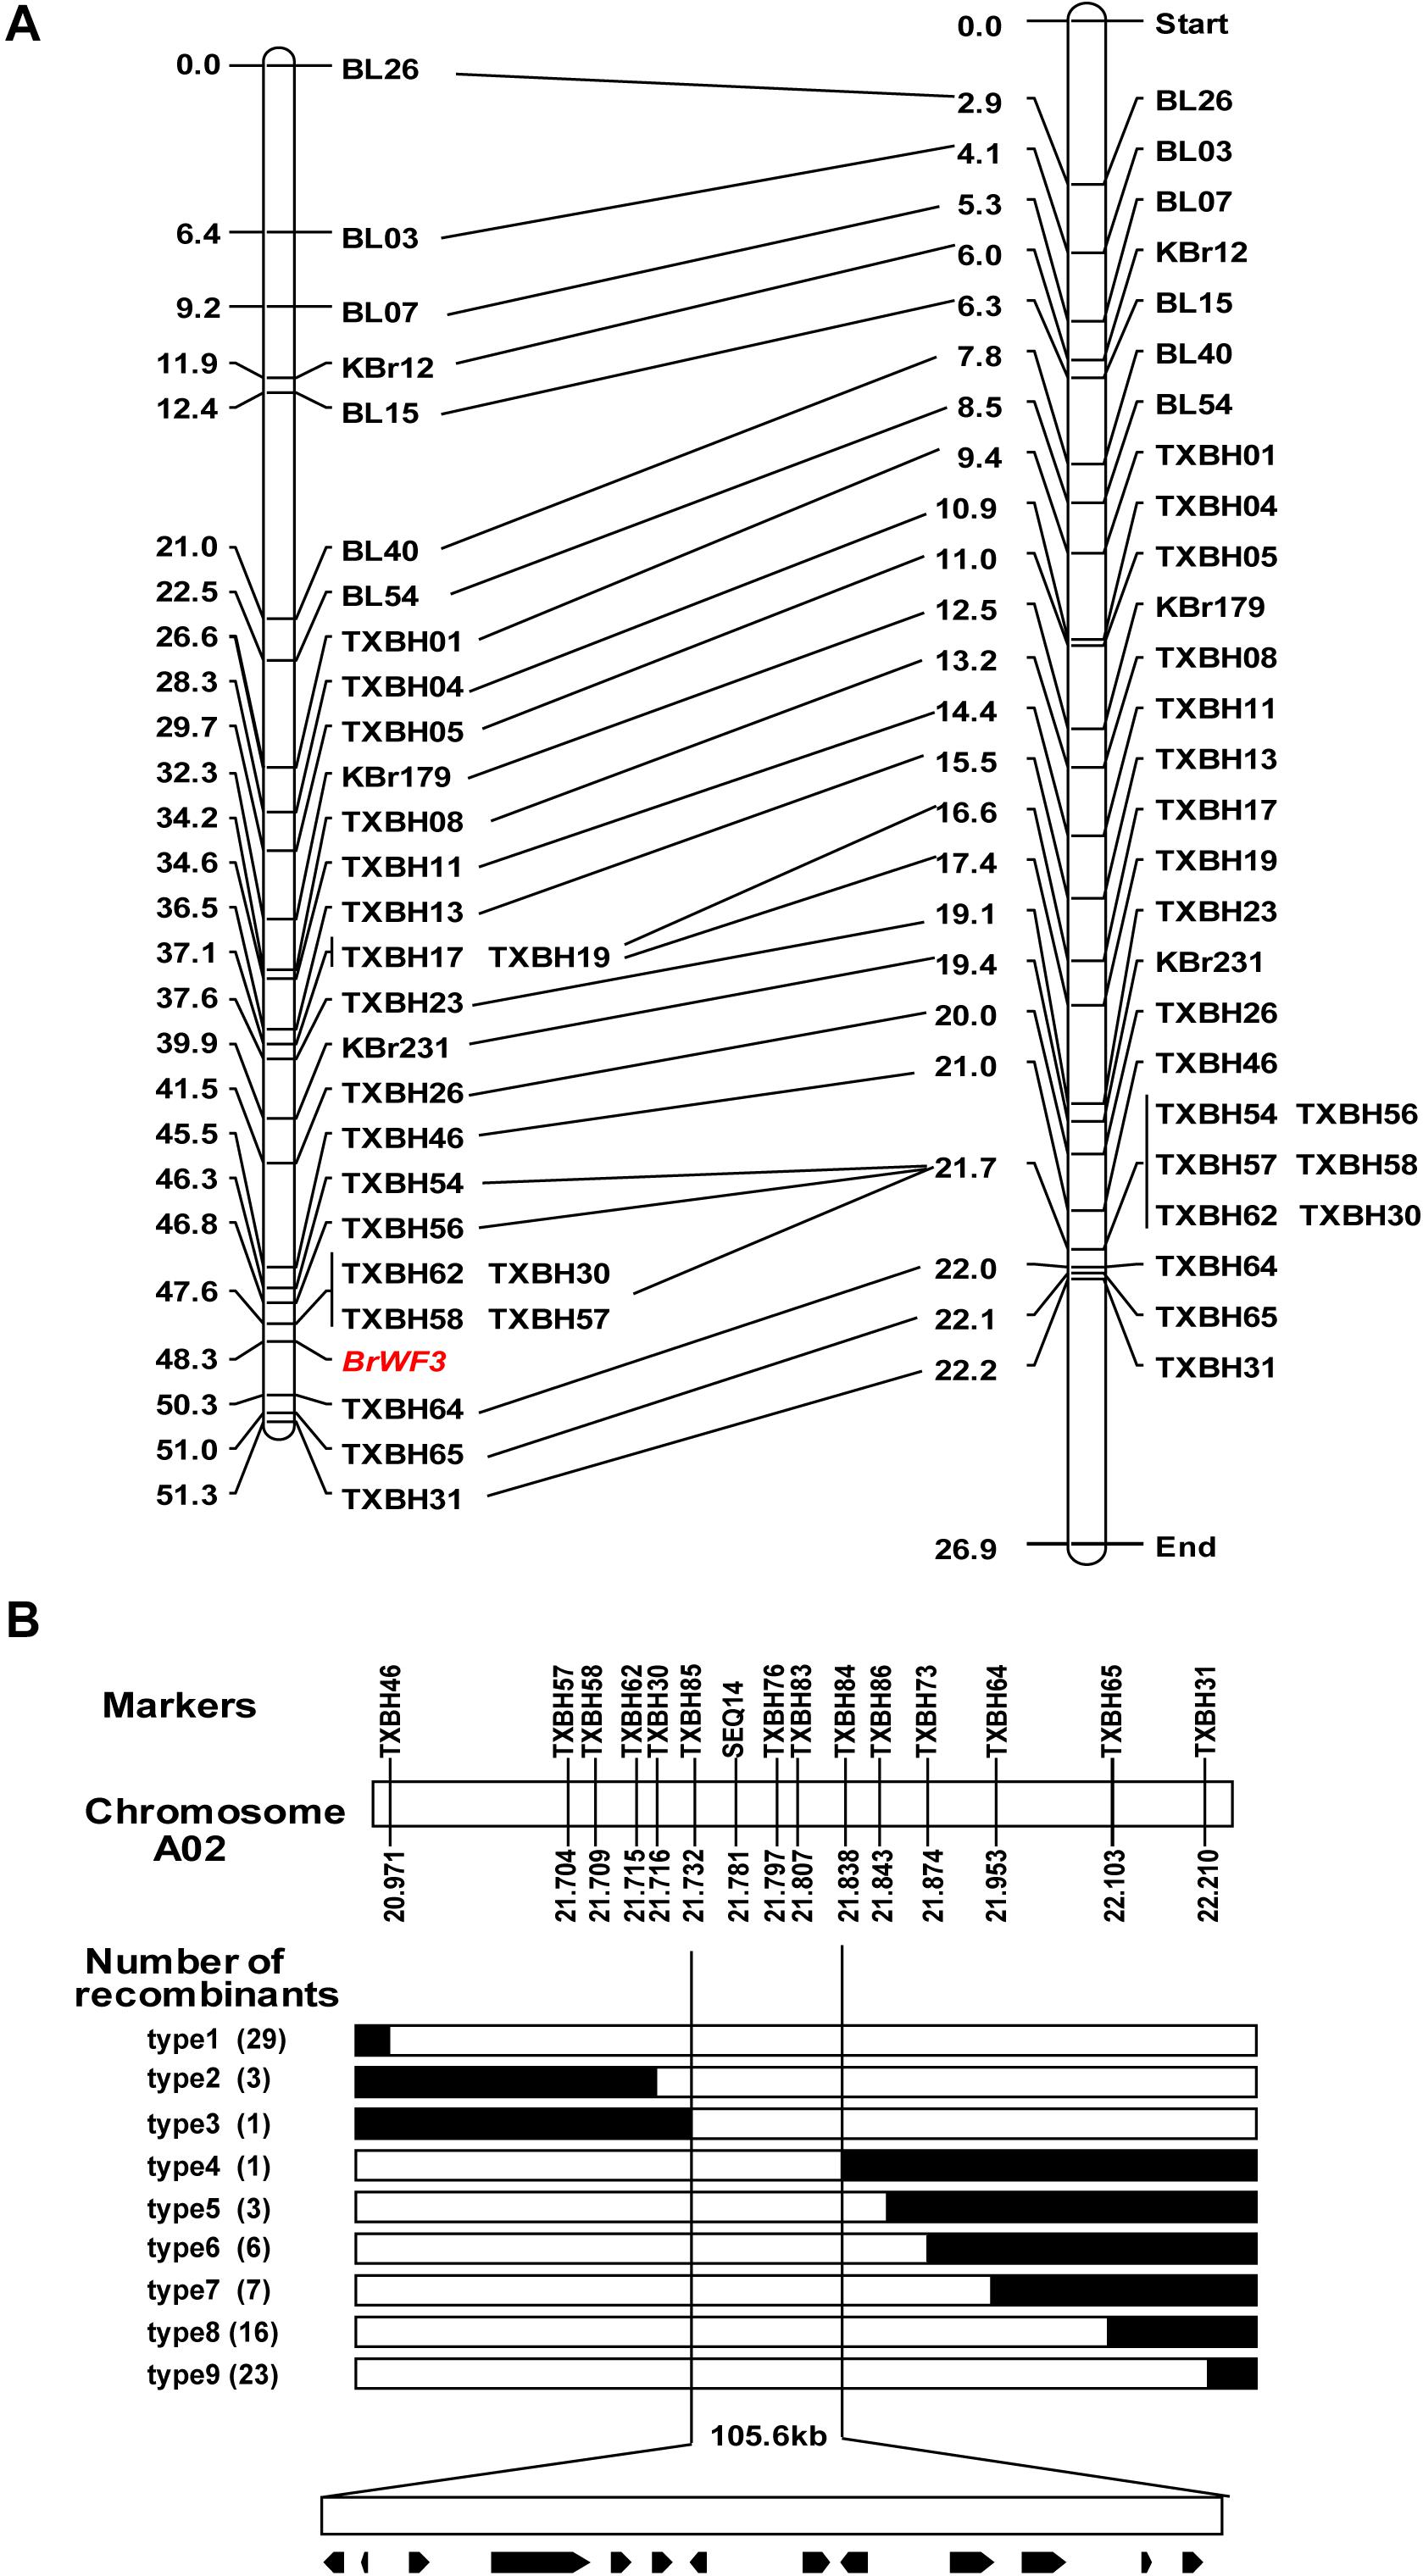
Figure 3. Initial and fine mapping of the BrWF3 gene in Chinese cabbage. (A) Initial mapping of BrWF3. Genetic map of BrWF3 is on the left, with cM as the unit. The corresponding physical map (right, unit: Mb) are also shown. (B) Fine mapping of BrWF3. The BrWF3 gene was delimited to an interval between TXBH85 and TXBH84, with an estimated length of 105.6 kb, and 13 genes were annotated in this region based on the reference genome sequence. The genetic structure of each recombinant type is depicted as white for homozygous white flower, black for heterozygous alleles, respectively. The number of each recombinant type is indicated in the brackets.
To fine-map the BrWF3 locus, we screened 596 white-flowered F2 individuals using flanking markers (TXBH46 and TXBH31) and identified 52 recombinants. All the 52 recombinants were further genotyped using TXBH57, TXBH58, TXBH62, TXBH 30, TXBH64 and TXBH65, based on which 10 recombinants (type 2 and type 7) were identified (Figure 3B). Then, 21 new markers were developed, and seven of which exhibited polymorphism in the two parents (Supplementary Table 4). These seven new polymorphic markers were further used to screen all the 10 recombinants using KASP assay. The results delimited the BrWF3 gene to a 105.6 kb interval between markers TXBH85 and TXBH84, each with one recombinant (type 3 and type 4) (Figure 3B). Three markers, SEQ14, TXBH76 and TXBH83, co-segregated with the BrWF3 gene (Figure 3B).
Candidate Gene Analysis
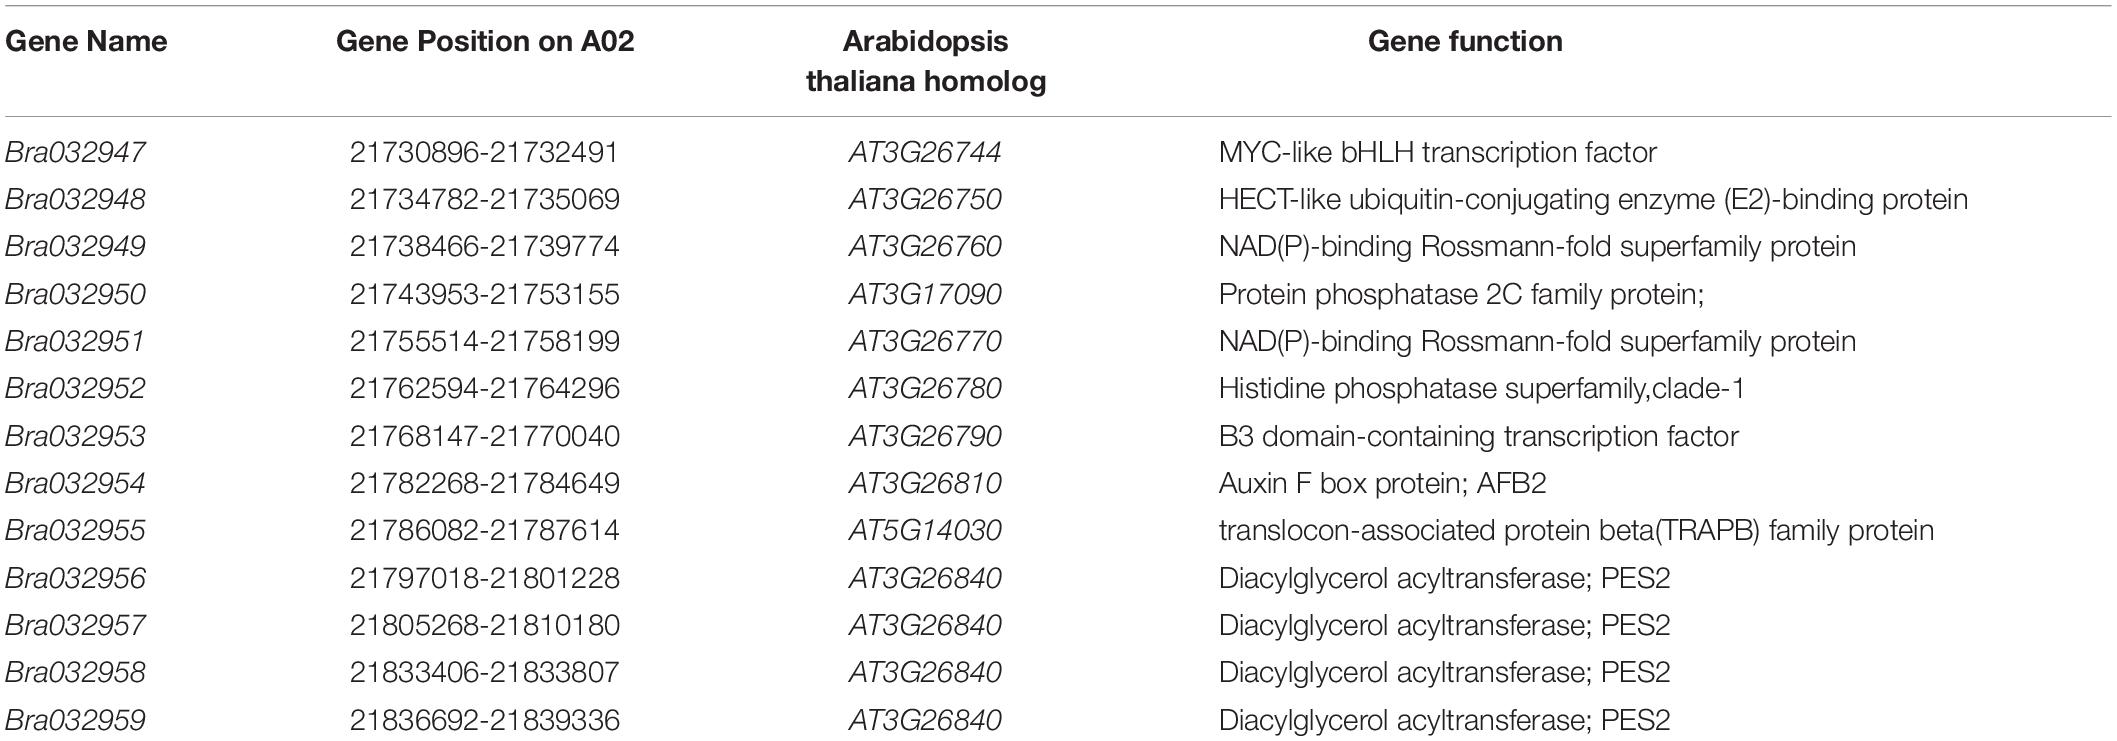
Based on the fine mapping results for BrWF3, DNA sequences in the 105.6 kb interval were analyzed in the Brassica database2 and comparative gene annotation in Arabidopsis thaliana was performed. As a result, 13 annotated or predicted genes were identified in the mapping region (Table 3). Four of these genes, Bra032956, Bra032957, Bra032958, and Bra032959, are homologs of AT3G26840 (PES2) in Arabidopsis thaliana, which encodes a protein with phytyl ester synthesis and diacylglycerol acyltransferase activities and was previously reported to regulate carotenoid esterification (Zhang et al., 2018a,b; Kishimoto et al., 2020). Next, we examined the expression of these four candidate genes via RNA-seq and qRT-PCR analysis. RNA-seq analysis revealed that only Bra032957 was differentially expressed among the four genes with the expression level decreasing approximately three fold in white petals compared with yellow petals (Supplementary Table 10). qRT-PCR analysis showed that the expression of Bra032957 in petals was much higher than that of Bra032956 and Bra032959 and was significantly upregulated in yellow petals compared to white petals (Figure 4A). The results of qRT-PCR analysis and RNA-seq analysis were consistent. Subsequently, expression analysis in different tissues (root, stem, leaf, petal, sepal, stamen, and pistil) showed that Bra032957 was predominantly expressed in petals (Figure 4B). Taken together, the results indicated that the Bra032957 gene was the most likely candidate gene for BrWF3.
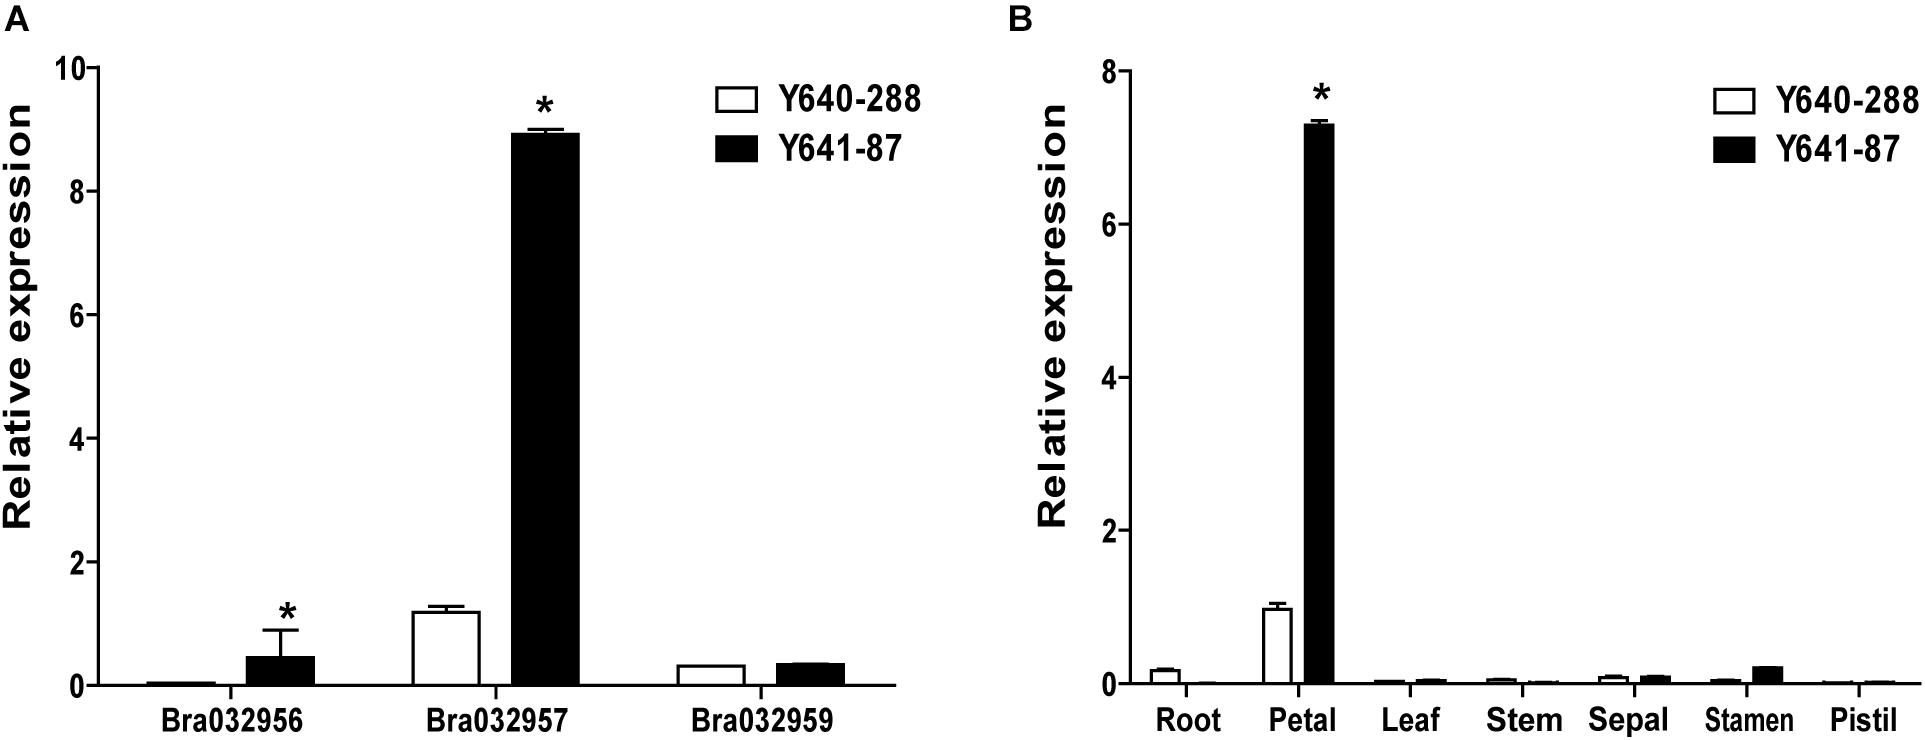
Figure 4. Gene expression data analyses. (A) Relative expression of Bra032956, Bra032957, and Bra032959 in petals of the two parents. (B) Relative expression of Bra032957 in different tissues of the two parents. Error bars represent the standard error of three biological replicates, and asterisks indicate significant differences (t-test, p < 0.05).
Sequence Analysis of Bra032957 as a Candidate Gene for BrWF3
To characterize the sequence of the candidate genes in the white-flowered parental line Y640-288 and the yellow-flowered parental line Y641-87, the genomic sequence (gDNA) and coding sequence (CDS) of Bra032957 were amplified and sequenced using specific primers (Supplementary Figure 2 and Supplementary Table 5). The results showed that the Bra032957 gene of Y641-87 was 5162 bp in length and contained 14 exons and 13 introns. The CDS of the Bra032957 gene in Y641-87 was 2106 bp in length. Sequence alignment revealed a base deletion (G) at 477 bp of the CDS in the third exon in Y640-288 (Supplementary Figure 3 and Figure 5A). The SNP deletion caused a frameshift mutation in the Bra032957 gene and a premature stop codon in 168 a.a. residues (Figure 5A). Conserved domain analysis in NCBI showed that the Bra032957 gene contained an α/β hydrolase-fold (amino acids 123-380) and a lysophospholipid acyltransferases (LPLAT) domain (amino acids 430-666), which can transfer acyl groups to acceptors, such as glycerol 3-phosphate (Figure 5B). The SNP deletion mutation caused a loss of the two conserved domains and ultimately caused the loss of function of the BrWF3 protein.
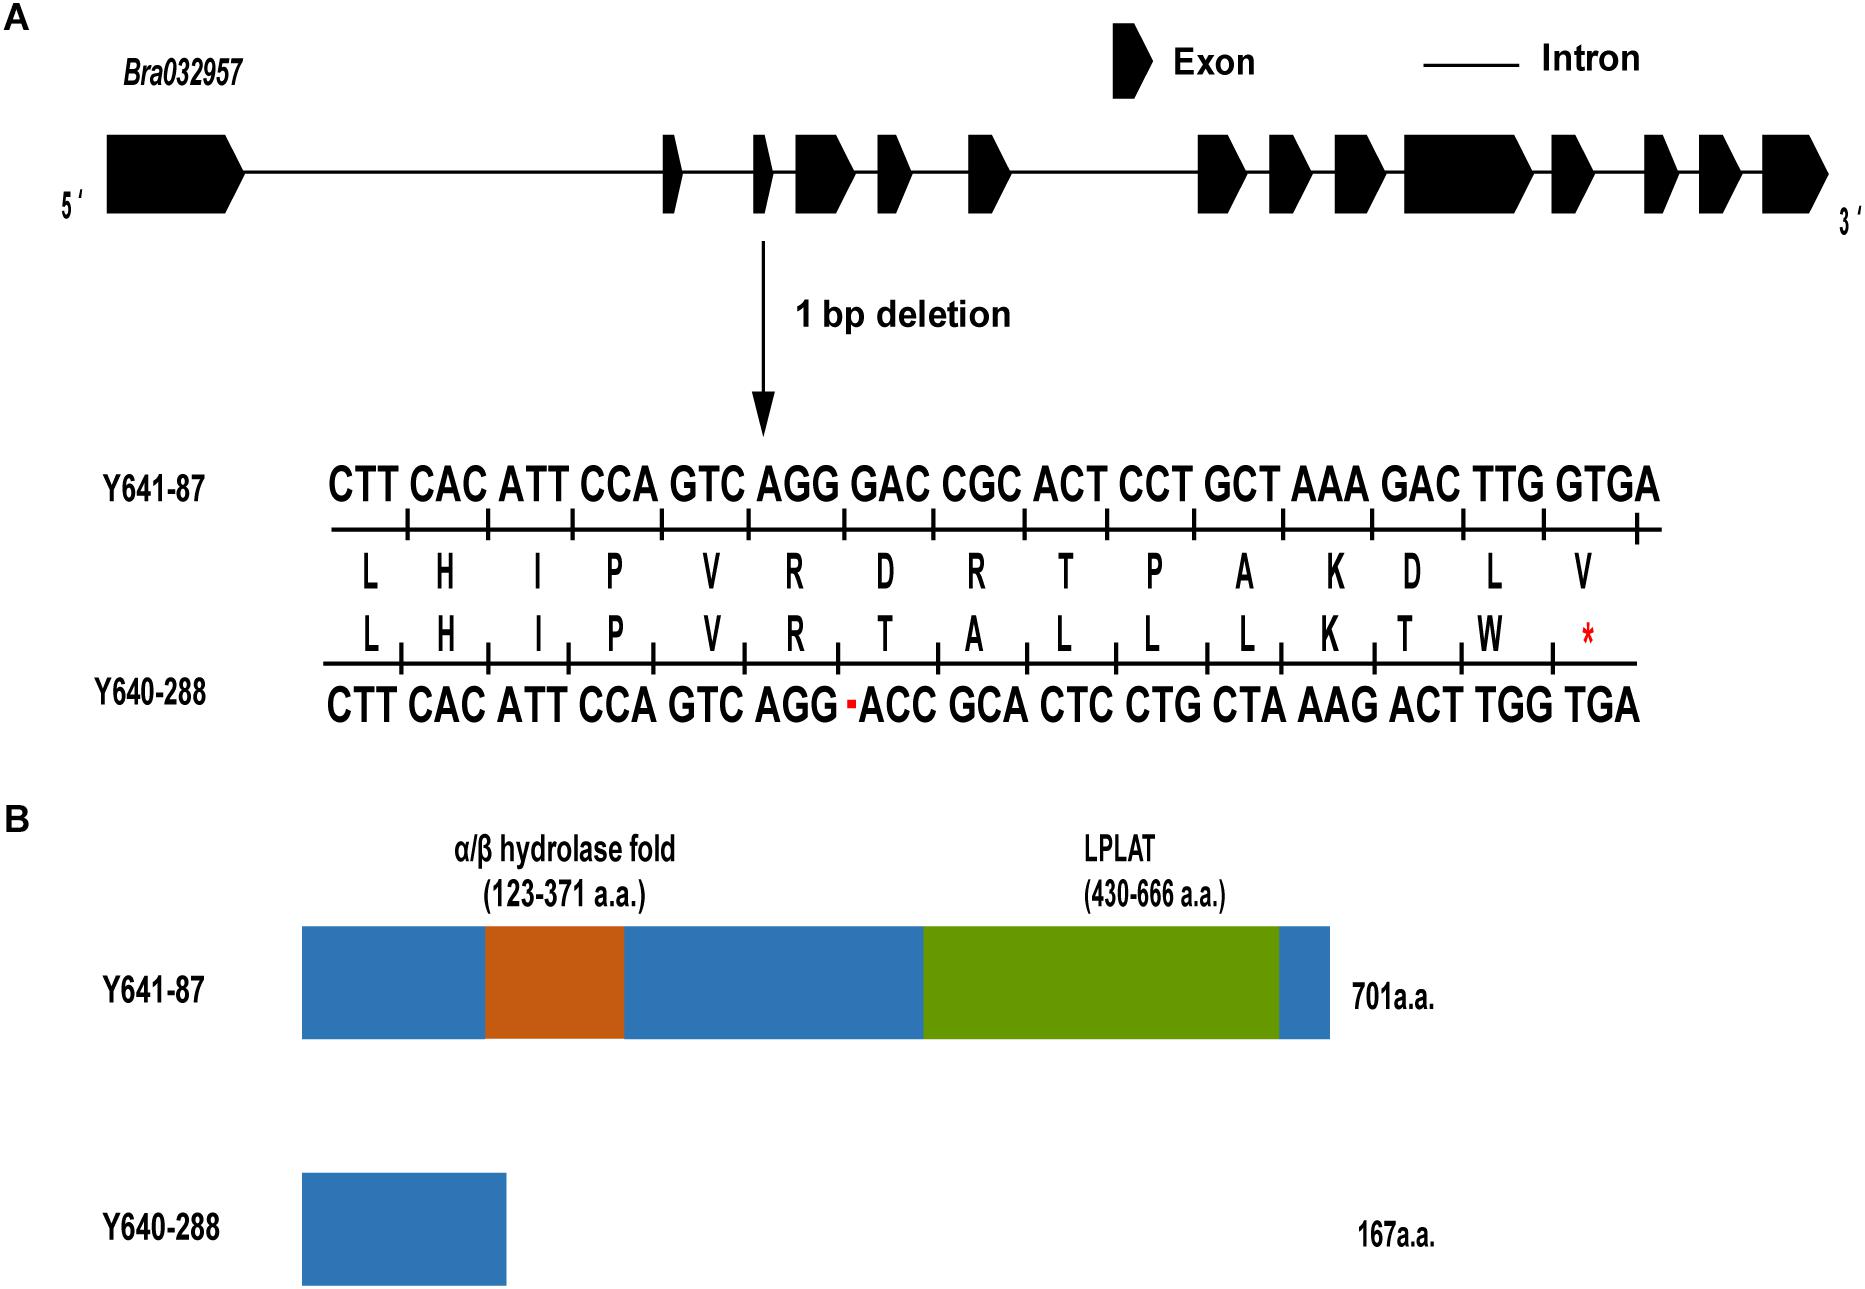
Figure 5. Gene structure, amino acid analysis and predicted protein structure of BrWF3. (A) BrWF3 includes 14 exons and 13 introns. A single nucleotide deletion (G) in the third exon of white flower plants results in a premature stop codon (indicated with red asterisks) due to a frameshift mutation. (B) Protein structures of BrWF3 in the two parents. The SNP deletion in Y640-288 causes the loss of two conserved protein domains of BrWF3.
Based on the identified SNP deletion, we designed a KASP marker TXBH83 to screen the other three F2 populations (Y640-288 × SD369-F2, Y640-288 × Chiifu-F2, Y66-83 × R16-11-F2), including a total of 282 individuals. The results showed that TXBH83 co-segregated with the flower color phenotype (Figures 6A-C and Supplementary Table 11). Furthermore, 10 white-flowered and 10 yellow-flowered DH lines were genotyped for TXBH83, which also showed a 100% consistency between the flower color phenotype and genotype (Figure 6D and Supplementary Table 11). Overall, these findings suggest that the Bra032957 gene is the most promising candidate gene for the white flower gene BrWF3 in Chinese cabbage.
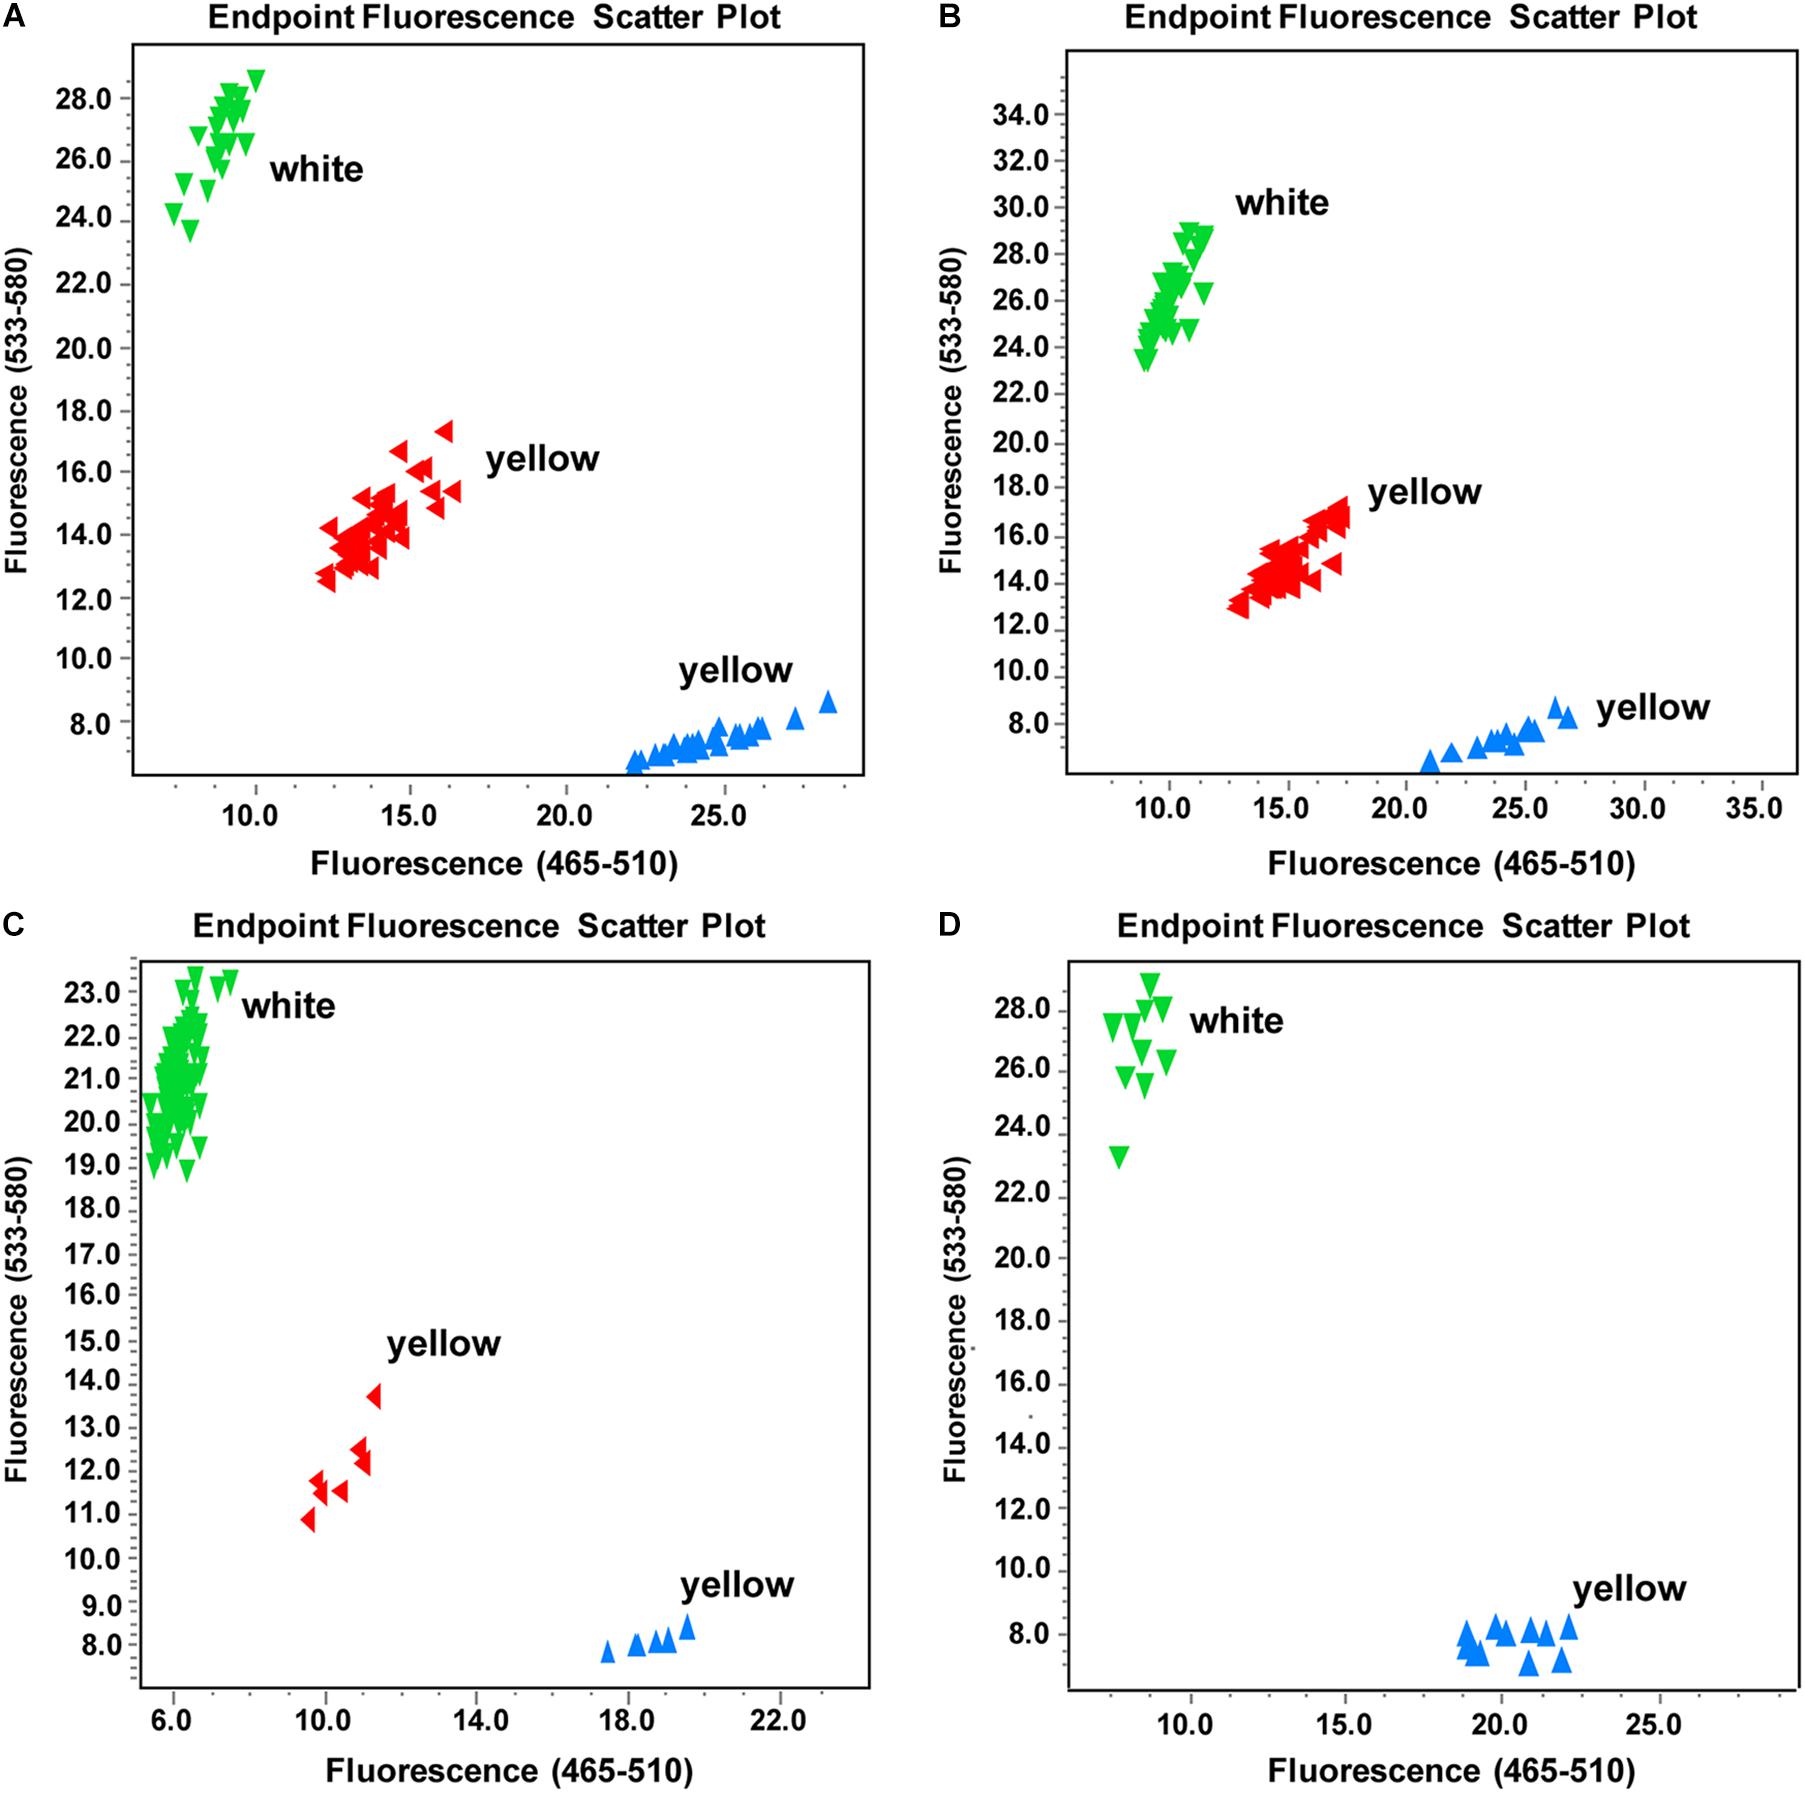
Figure 6. Genotyping results of marker TXBH83 in part individuals of different populations. (A–D) Genotyping results of TXBH83 in the (Y640-288 × Chiifu)-F2, (Y640-288 × SD369)-F2, and (Y66-83 × R16-11)-F2 populations and a natural population, respectively. More white-flowered plants were intentionally selected. The genotypes corresponding to those of Y640-288 are clustered to the Y axis, those matching Y641-87 genotypes are clustered to the X axis, and the heterozygous genotypes are clustered to the diagonal line. TXBH83 is totally co-segregated with the flower color phenotype.
Transcriptome Analysis in Yellow and White Petals
To identify the gene regulatory networks involved in petal coloration, we performed comparative transcriptome analysis between W-bulk and Y-bulk. Approximately 300.8 million raw reads were generated for the six cDNA libraries, ranging from 43.1 to 57.4 Gb reads per library (Supplementary Table 12). All the raw reads were deposited in the NCBI Short Read Archive (SRA) database under accession number PRJNA682761. Among the clean reads, 85.2-87.46% were uniquely mapped to the reference genome (Wang et al., 2011). The Pearson correlation coefficients among the three replicates of each petal pool ranged from 0.98 to 0.99, indicating a high consistency among the three replicates (Supplementary Figure 4). In total, we identified 6,009 differentially expressed genes (DEGs) between the W-bulk and Y-bulk, among which 2,913 genes were up-regulated and 3,816 were down-regulated in the Y-bulk compared with the W-bulk. Pathway enrichment analysis based on the KEGG database revealed that carotenoid biosynthesis was the most significantly enriched pathway (Figure 7A). In the Y-bulk, genes involved in carotenoid biosynthesis (Figure 7B), such as PSY (Bra006391 and Bra008569), PDS (Bra010751), BCH1 (Bra013912) and ZEP (Bra037130), were significantly up-regulated. Genes involved in carotenoid degradation (Figure 7B), such as NCED3 (Bra027336 and Bra001552) and NCED4 (Bra013378), were also upregulated. Pathways of linoleic acid metabolism, alpha-linolenic acid metabolism, glycerophospholipid metabolism and arachidonic acid metabolism were also enriched, and most of the genes in these pathways were downregulated (Figure 7A and Supplementary Table 12). For example, genes encoding glycerophosphodiester phosphodiesterase (Bra040704, Bra027481, Bra035967, Bra020395, Bra002676, and Bra006785), phospholipase A (Bra015531 and Bra010327), phosphatidate phosphatase (Bra029774) were downregulated (Supplementary Figure 5 and Supplementary Table 13). However, genes participating in fatty acid elongation, such as 3-ketoacyl-CoA synthase (Bra011936, Bra004513, Bra024749, and Bra004034) and very-long-chain enoyl-CoA reductase (Bra008657), were significantly upregulated (Supplementary Figure 5 and Supplementary Table 13). These results suggested that saturated but not unsaturated fatty acids might be the main acyl group donors for esterification of xanthophylls. FIBRILLIN (FBN) and ACTIVITY OF BC1 COMPLEX KINASE (ABC1K) are the most abundant proteins in PGs (van Wijk and Kessler, 2017). In this study, FBN1b (Bra013602) and ABC1K8 (Bra024339) were significantly upregulated in Y-bulk (Figure 7C). Furthermore, FBN1b is highly expressed. The average fragments per kilobase million (FPKM) value of FBN1b was as high as 8383 in Y-bulk, 3148 in the W-bulk. VITAMIN E DEFICIENT 1 (VTE1), which encodes a key enzyme in tocopherol biosynthesis, was upregulated in Y-bulk but with no significant difference (Figure 7C and Supplementary Table 13). Lipoxygenase (LOX) are proteins recruited to chloroplast PGs and participated in jasmonate biosynthesis (van Wijk and Kessler, 2017). Genes encoding LOXs were all downregulated in yellow petals (Figure 7C and Supplementary Table 13), indicating that LOX proteins were not indispensible for PG development and formation in chromoplasts.
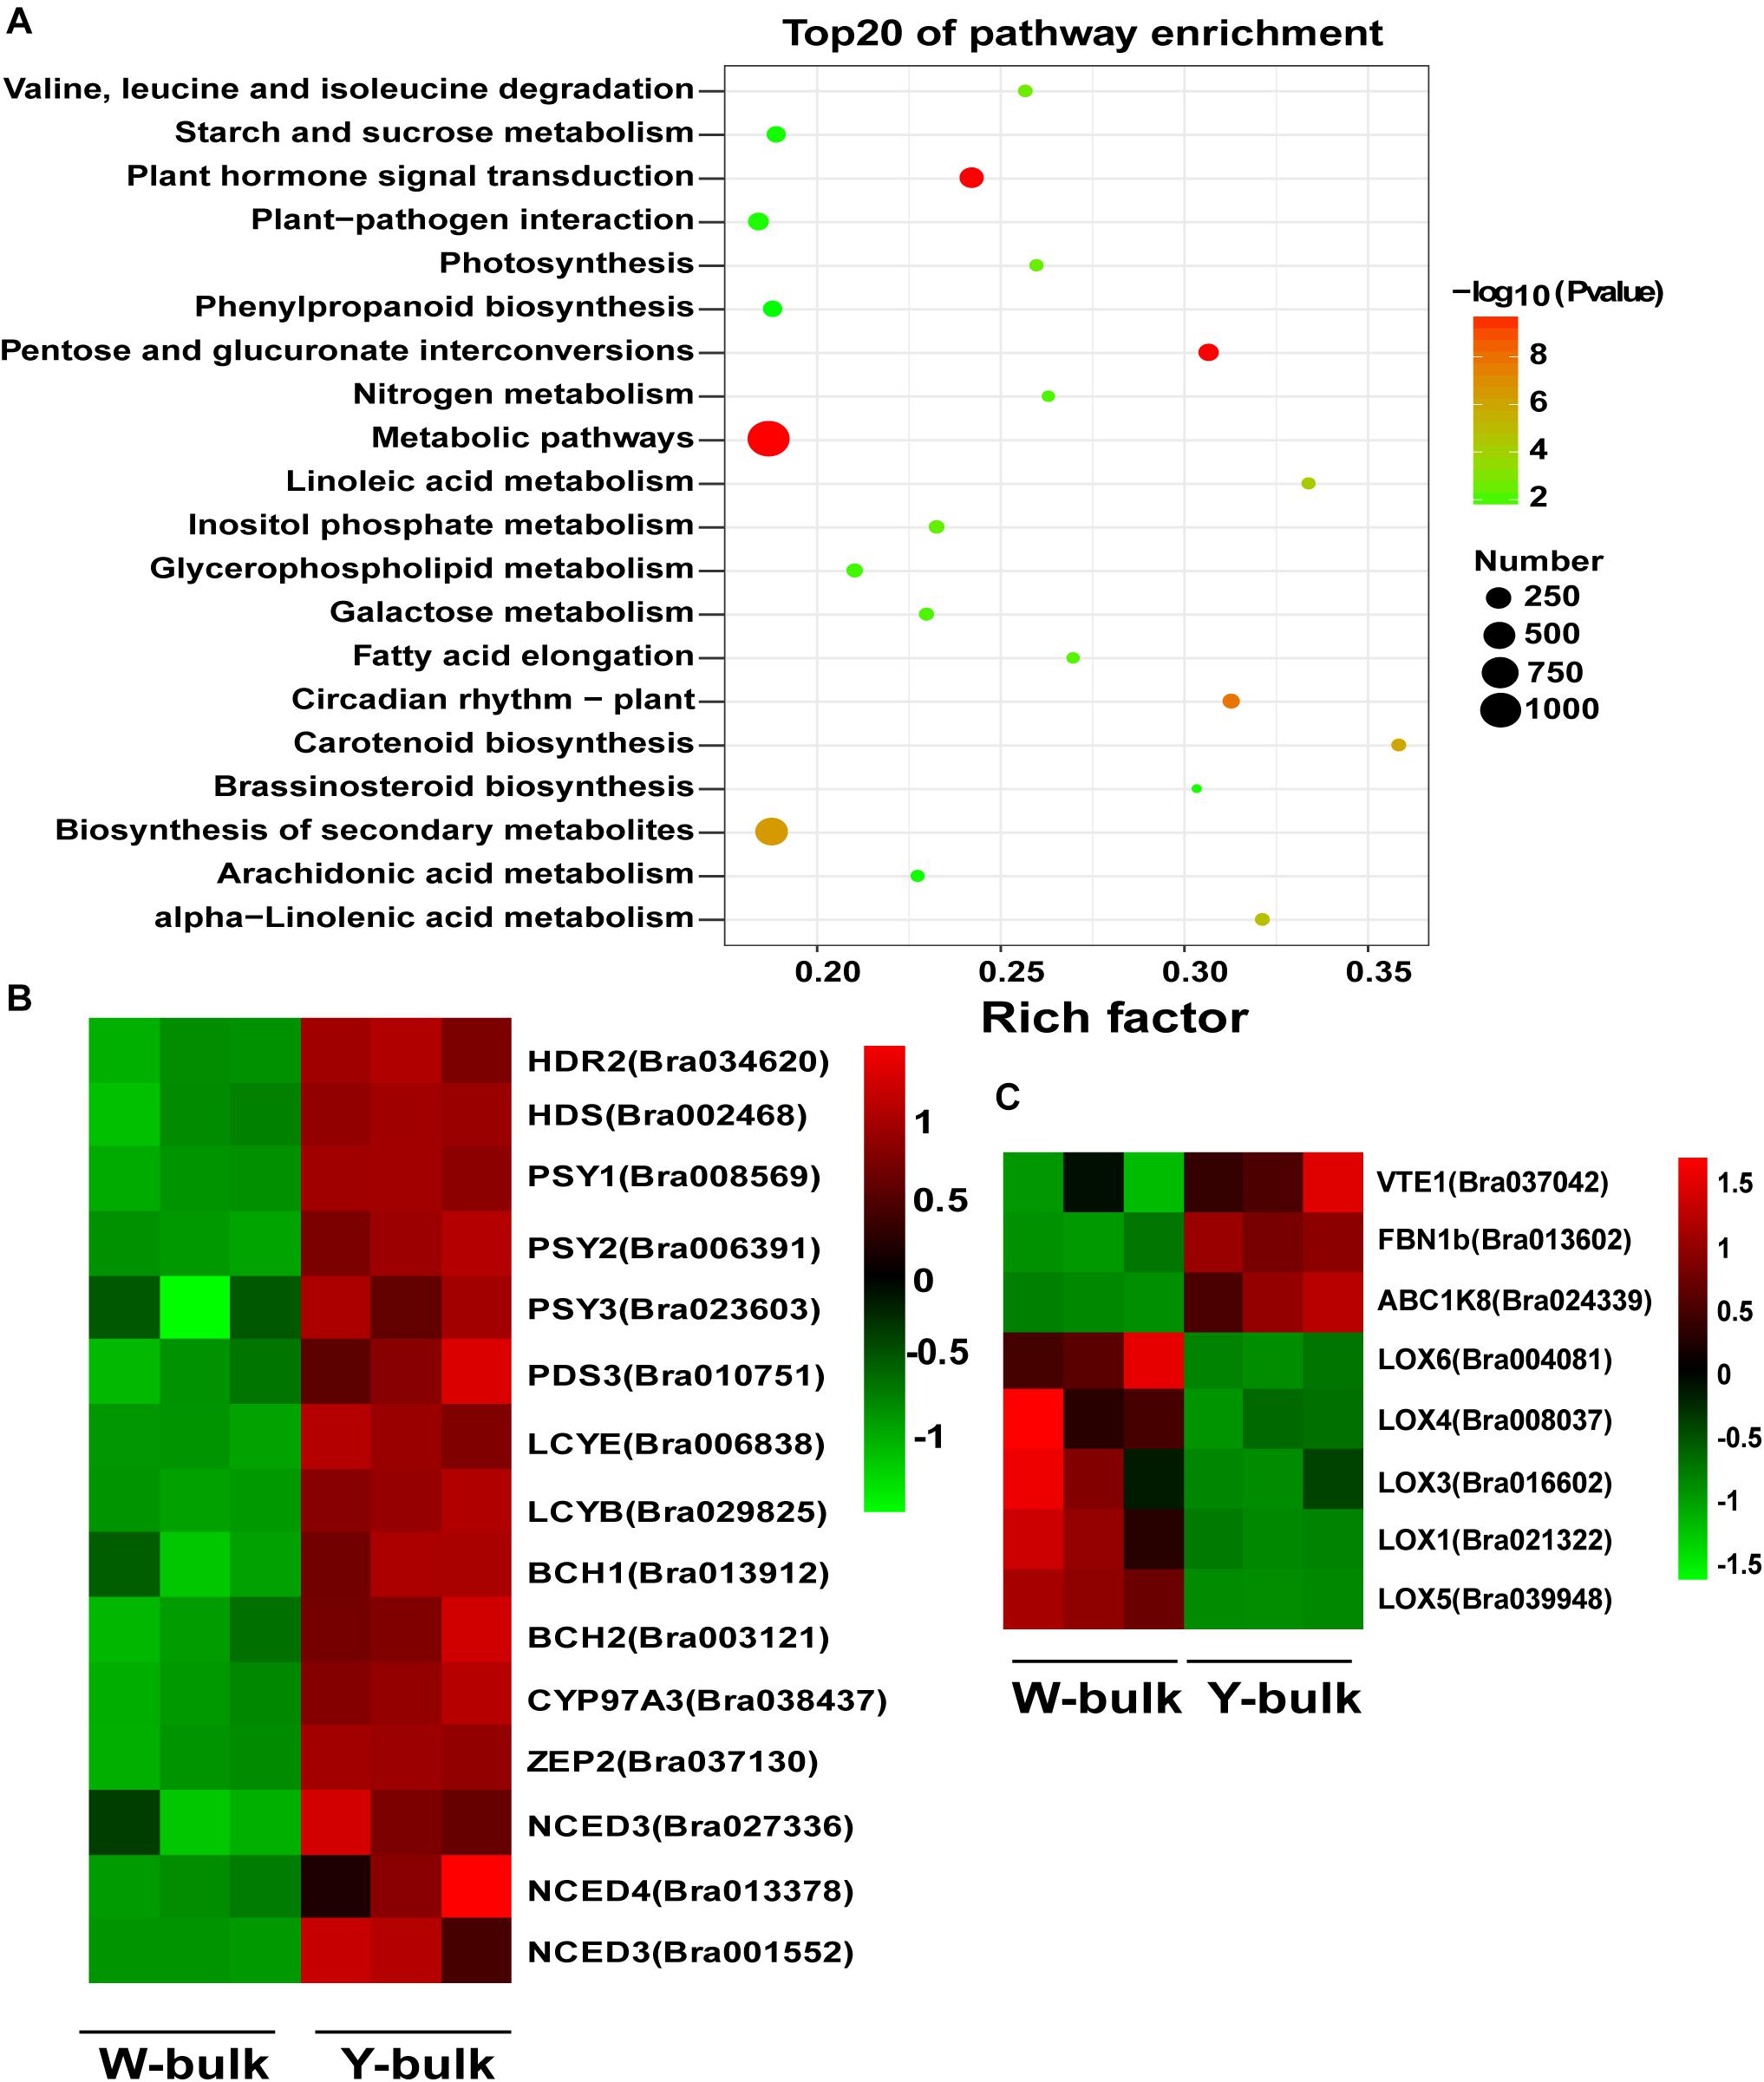
Figure 7. Transcriptome analysis in yellow and white petals. (A) Scatter plot of top 20 enriched KEGG pathways. Rich factor is the ratio of the DEG number to the background number in a certain pathway. The size of the dots represents the number of genes, and the color of the dots represents the range of the -log10(p-value). (B) Differentially expressed genes involved in carotenoid biosynthesis and degradation. (C) Differentially expressed genes associated with proteins in PGs. The heatmap colors are shown in log10(FPKM). Three biological replicates of the W-bulk and Y-bulk are shown.
Discussion
BSA-seq has been widely deployed for mapping agronomical traits in crops (Wang et al., 2017; Lee et al., 2020; Liang et al., 2020). In most cases, the genes controlling the target agronomic traits are located on the candidate regions detected by BSA-seq analysis. However, in one study, BSA-seq and traditional linkage analyses identified two different major loci for the purple leaf trait in Brassica rapa, one located on chromosome A07 and the other on A09 (Zhang X. et al., 2020). In our study, genetic analysis showed that the white flower trait in Y640-288 is controlled by a single recessive gene. However, our BSA-seq analysis identified five adjacent regions on A02, rather than only one sharp peak as noted in previous studies, and the results were not consistent with the genetic analysis. This phenomenon has also occurred in other studies from both our laboratory (unpublished data) and another laboratory (the Chinese cabbage research group at the Northwest A&F University). The two parental lines, Y640-288 and Y641-87, are both over-lapped head-type Chinese cabbage lines. While the reference material Chiifu-401-42 is a closed head-type Chinese cabbage line. Many significant structural variations were detected between the parental lines and the reference genome through single molecule real-time (SMRT) sequencing (Supplementary Figure 6). We suspected that the great structural variation between the parents and the reference genome might be responsible for the above discrepancy and reduce the efficiency of BSA-seq, which will be discussed in detail in a future study. Although the BSA-seq result was not perfect enough, the Δ(SNP-index) value for the other nine chromosomes were all close to 0, allowing the rapid mapping of the white flower gene on A02. The identified gene was named BrWF3 because it was quite different from the other two genes reported previously (Brwf1 on A01 and Brwf2 on A09) (Zhang N. et al., 2020).
The present study successfully fine mapped the BrWF3 gene to a physical interval of 105.6 kb. Functional annotation analysis of the 13 genes in the candidate region revealed that four genes, Bra032956, Bra032957, Bra032958, and Bra032959, which are homologous to PES2 in Arabidopsis, might be candidate genes for BrWF3. In Arabidopsis, the PES1 and PES2 genes encode proteins that use medium-chain fatty acid-derived acyls to esterify phytyl released during chlorotic conditions. The resultant fatty acid phytyl esters accumulate in chloroplast PGs (Lippold et al., 2012). The PYP1 (Arabidopsis PES1 homolog) gene in tomato (Ariizumi et al., 2014) and the Bjpc1 and Bjpc2 (Arabidopsis PES2 homolog) genes in B.juncea are all responsible for flower color changes (Zhang et al., 2018a,b). Furthermore, RNA-seq and qRT-PCR analysis revealed that only Bra032957 was significantly and differentially expressed, showing considerably increased expression in yellow petals. We also examined the sequence variation between white and yellow petals. No sequence variation was found in the Bra032958 gene. However, Bra032956, Bra032957 and Bra032959 each possessed one SNP variation. The SNPs in Bra032956 (marker TXBH76) and Bra032959 (marker TXBH84) occurred in intron regions, and only the SNP of Bra032957 was located an exon. Additionally, we developed KASP markers for these three SNPs, namely, TXBH76 in Bra032956, TXBH83 in Bra032957 and TXBH84 in Bra032959. The TXBH84 marker showed one recombinant according to fine mapping. Thus, the Bra032959 gene could be excluded as a candidate. The TXBH76 and TXBH83 markers cosegregated with the phenotype during fine mapping. However, the TXBH76 marker could not be used to differentiate the yellow and white flower phenotypes in another F2 population (Y66-83 × R16-11) (Supplementary Figure 7). Accordingly, the possibility of Bra032956 being the candidate gene was also eliminated. Moreover, we cloned the gDNA and cDNA sequences of Bra032957 in Y641-87 and Y640-288. Sequence alignment revealed an SNP deletion in the third exon in the white flower parent Y640-288, which introduced a premature stop codon and caused enzymatic inactivity (Supplementary Figure 3). Taken together, the results indicated that the Bra032957 gene was most likely responsible for the white flower trait in Chinese cabbage.
The KASP genotyping assay is one of the most efficient and cost-effective systems for SNP and small InDel genotyping (Semagn et al., 2013; Yang et al., 2020). In B.juncea, the white flower trait is collectively controlled by two recessive genes (Bjpc1 and Bjpc2) (Zhang et al., 2018a,b). The Bjpc1 gene, which is located on A02, is homologous to Bra032956 in B.rapa (Zhang et al., 2018b). Bjpc2 lies on B04 and is homologous to Bra032957 in B.rapa. In our study, the Bra032957 gene, which is located on A02, was the most promising candidate gene for the white flower trait in Chinese cabbage, suggesting a similar mechanism of flower color pigmentation in these two species. However, none of the closely linked and cosegregated markers of Bjpc1 and Bjpc2 showed polymorphisms in our F2 population (Y640-288 × Y641-87) (Supplementary Figures 8, 9), suggesting divergence between B.juncea and B.rapa. For the SNP deletion in BrWF3, we developed the KASP marker TXBH83, which completely cosegregated with the flower color phenotype in three other F2 populations and a small natural population. This marker can be used as a functional marker for MAS breeding and the assessment of genetic resources for developing new ornamental varieties with visual appeal, which has profound significance.
Using LC-APCI-MS/MS analysis with saponification, we observed that violaxanthin and lutein were the two main carotenoids in petals, accounting for approximately 83 and 91% of the total carotenoids in the Y-bulk and the W-bulk, respectively. These results were consistent with another study conducted in Chinese cabbage (Zhang N. et al., 2020) but differed from those of studies in tomato and B.juncea (Ariizumi et al., 2014; Zhang et al., 2018a,b), which suggested that the quantities and composition of xanthophylls in yellow flowers display considerable diversity among different species (Ohmiya, 2011). Notably, in the saponified extracts, the violaxanthin content in the Y-bulk was approximately 2.76 times higher than that in the W-bulk, and the total carotenoids content in the Y-bulk was about 1.70 times higher than that in the W-bulk, but the lutein content between these two bulks was not significantly different (Table 2). Thus, we hypothesized that the lower pigmentation in white flowers was due to the decreased carotenoid content, which is particularly related to the reduced violaxanthin content (but not lutein content). Furthermore, comparison of the carotenoid profile in direct and saponified extracts revealed increased proportion xanthophyll esters in yellow petals. Taken together, we proposed that the BrWF3 gene played an important role in the production of xanthophyll esters (particularly violaxanthin esters) for yellow color pigmentation in Chinese cabbage and the lower pigmentation in white flowers was due to lower xanthophyll esters. Interestingly, among the direct extracts, in addition to the carotenoid esters detected in the Y-bulk, we also detected a few carotenoid esters in the W-bulk. While in tomato, carotenoid esters cannot be detected in pale yellow flowers (Ariizumi et al., 2014). The potential reasons for this difference might be associated with the whole-genome triplication of B.rapa (Wang et al., 2011). Although BrWF3 encodes inactive proteins in white petals, other paralogs might express several active proteins participating in carotenoid esterification, which was confirmed by the expression data in our study (Figure 4).
In colored organs, such as petals and fruit, carotenoids accumulate mainly in chromoplasts, particularly in carotenoid-lipoprotein sequestering structures (i.e., PGs and fibrils) (Li and Yuan, 2013; Li et al., 2016; Yuan et al., 2015). These carotenoid-lipoprotein sequestering structures enhance the sink strength of chromoplasts (Yuan et al., 2015; Li et al., 2016). Deruere et al. (1994) proposed an architectural model for fibrils or PGs in which carotenoids were located in the inner core protected by polar lipids and carotenoid-associated proteins, the carotenoid core interacted with the acyl residues of the polar lipids, and the polar lipids then interacted with carotenoid-associated proteins via polar head groups. Carotenoids, polar lipids and carotenoid-associated proteins are three indispensable components of carotenoid-lipoprotein-sequestering structures. Many studies have revealed that genes encoding carotenoid-associated proteins are positively associated with carotenoid accumulation and that the mutations in these genes hamper PG formation (Vishnevetsky et al., 1996; Pozueta-Romero et al., 1997). In our study, TEM analysis showed that numerous fully developed PGs could be observed in yellow petals, whereas only a few irregular and small PGs could be observed in white petals, which was consistent with results obtained in B.juncea (Zhang et al., 2018a,b) and tomato (Ariizumi et al., 2014). We suspect that the BrWF3 gene from our study, PYP1 in tomato (Ariizumi et al., 2014), and Bjpc2 in B.juncea (Zhang et al., 2018a), encoding proteins with phytyl ester biosynthesis and diacylglycerol acyltransferase activities, construct the interaction between carotenoids and the polar lipids by transferring the acyl group from polar lipids to the hydroxy (-OH) group of xanthophylls. An SNP deletion in BrWF3 causes loss of protein function, thereby disturbing the connection between carotenoids and the polar lipids and further hampering the assembly and formation of PGs. As expected, comparative transcriptome analysis between the Y-bulk and W-bulk showed that the genes involved in three indispensable components of PGs, carotenoids, polar lipids and carotenoid-associated proteins, were downregulated in white petals, in which the development and formation of PGs were hampered.
Conclusion
In the present study, we delimited the BrWF3 gene responsible for the white flower trait in Chinese cabbage. BSA-seq and linkage analysis via KASP assays were employed to fine-map the BrWF3 gene to an interval of 105.6 kb. Functional annotation analysis, expression analysis and sequence variation analysis revealed that Bra032957, which encodes a protein with phytyl ester synthesis and diacylglycerol acyltransferase activities, was the most likely candidate gene for BrWF3. BrWF3 participated in the production of xanthophyll esters (particularly violaxanthin esters) and the formation of PGs. An SNP deletion in the third exon of BrWF3 caused the loss of protein function and interfered with the formation of PGs, which subsequently reduced the activity of carotenoid metabolism and the content of carotenoids. Furthermore, we developed and validated the functional marker TXBH83 for BrWF3. These results not only provide valuable information for MAS breeding but also provide a significant contribution to research on the molecular mechanism underlying flower color pigmentation.
Data Availability Statement
The datasets presented in this study can be found in online repositories. The names of the repository/repositories and accession number(s) can be found in the article/Supplementary Material.
Author Contributions
SY conceptualized and designed the experiments and drafted the manuscript. XT and ZW performed the experiments and analyzed the data. BT, YY and X-WZ directed the whole study and provided the funding resource. XW, YZ, HS, and XZ participated in drafting the article and revising it critically. All authors contributed to the article and approved the submitted version.
Funding
This work was financially supported by Zhongyuan Scholar Program (202101510003), the Modern Agro-Industry Technology Research System (CARS-23-G-16), the National Science Foundation of China (31872945), and Sci-Tech Innovation Team of Henan Academy of Agricultural Sciences (2021TD06).
Conflict of Interest
The authors declare that the research was conducted in the absence of any commercial or financial relationships that could be construed as a potential conflict of interest.
Supplementary Material
The Supplementary Material for this article can be found online at: https://www.frontiersin.org/articles/10.3389/fpls.2021.646222/full#supplementary-material
Abbreviations
BSA-seq, bulked segregant analysis coupled with whole-genome sequencing; CDS, coding sequence; DEGs, differentially expressed genes; DH, doubled haploid; FKPM, the fragments per kilobase of transcript per million; InDel, insertion-deletion; KASP, Kompetitive allele-specific PCR; KEGG, Kyoto encyclopedia of genes and genomes; MAS, molecular assisted selection; PGs, plastoglobules; qRT-PCR, Quantitative real time PCR; SNP, single nucleotide polymorphism; TEM, transmission electron microscopy; LC-MS/MS, liquid chromatography-tandem mass spectrometry.
Footnotes
References
Abe, A., Kosugi, S., Yoshida, K., Natsume, S., Takagi, H., Kanzaki, H., et al. (2012). Genome sequencing reveals agronomically important loci in rice using MutMap. Nat. Biotechnol. 30, 174–178. doi: 10.1038/nbt.2095
Ariizumi, T., Hatakeyama, K., Hinata, K., Inatsugi, R., Nishida, I., Sato, S., et al. (2004). Disruption of the novel plant protein NEF1 affects lipid accumulation in the plastids of the tapetum and exine formation of pollen, resulting in male sterility in Arabidopsis thaliana. Plant J. 39, 170–181. doi: 10.1111/j.1365-313x.2004.02118.x
Ariizumi, T., Kishimoto, S., Kakami, R., Maoka, T., Hirakawa, H., Suzuki, Y., et al. (2014). Identification of the carotenoid modifying gene PALE YELLOW PETAL 1 as an essential factor in xanthophyll esterification and yellow flower pigmentation in tomato (Solanum lycopersicum). Plant J. 79, 453–465. doi: 10.1111/tpj.12570
Benjamini, Y., and Hochberg, Y. (2000). On the adaptive control of the false discovery rate in multiple testing with independent statistics. J. Educ. Behav. Stat. 25, 60–83. doi: 10.2307/1165312
DellaPenna, D., and Pogson, B. J. (2006). Vitamin synthesis in plants: tocopherols and carotenoids. Annu. Rev. Plant Biol. 57, 711–738. doi: 10.1146/annurev.arplant.56.032604.144301
Deruere, J., Romer, S., D’Harlingue, A., Backhaus, R. A., Kuntz, M., and Camara, B. (1994). Fibril assembly and carotenoid overaccumulation in chromoplasts: a model for supramolecular lipoprotein structures. Plant Cell 6, 119–133. doi: 10.2307/3869680
Ding, B. Y., Niu, J., Shang, F., Yang, L., Chang, T. Y., and Wang, J. J. (2019). Characterization of the geranylgeranyl diphosphate synthase gene in Acyrthosiphon pisum (Hemiptera: Aphididae) and its association with carotenoid biosynthesis. Front. Physiol. 10:1398.
Fujimoto, R., Sasaki, T., and Nishio, T. (2006). Characterization of DNA methyltransferase genes in Brassica rapa. Genes Genet. Syst. 81, 235–242. doi: 10.1266/ggs.81.235
Grotewold, E. (2006). The genetics and biochemistry of floral pigments. Annu. Rev. Plant Biol. 57, 761–780. doi: 10.1146/annurev.arplant.57.032905.105248
Han, F. Q., Cui, H., Zhang, B., Liu, X., Yang, L., Zhuang, M., et al. (2019). Map-based cloning and characterization of BoCCD4, a gene responsible for white/yellow petal color in B. oleracea. BMC Genomics 20:242. doi: 10.1186/s12864-019-5596-2
Inbaraj, B. S., Lu, H., Hung, C. F., Wu, W. B., Lin, C. L., and Chen, B. H. (2008). Determination of carotenoids and their esters in fruits of Lycium barbarum Linnaeus by HPLC-DAD-APCI-MS. J. Pharm. Biomed. Anal. 47, 812–818. doi: 10.1016/j.jpba.2008.04.001
Islam, M. S., Zeng, L., Thyssen, G. N., Delhom, C. D., Kim, H. J., Li, P., et al. (2016). Mapping by sequencing in cotton (Gossypium hirsutum) line MD52ne identified candidate genes for fiber strength and its related quality attributes. Theor. Appl. Genet. 129, 1071–1086. doi: 10.1007/s00122-016-2684-4
Kevan, P. G., and Baker, H. G. (1983). Insects as flower visitors and pollinators. Annu. Rev. Entomol. 28, 407–453. doi: 10.1146/annurev.en.28.010183.002203
Kim, D., Langmead, B., and Salzberg, S. L. (2015). HISAT: a fast spliced aligner with low memory requirements. Nat. Methods 12, 357–360. doi: 10.1038/nmeth.3317
Kishimoto, S., Oda-Yamamizo, C., and Ohmiya, A. (2019). Comparison of petunia and calibrachoa in carotenoid pigmentation of corollas. Breed. Sci. 69, 117–126. doi: 10.1270/jsbbs.18130
Kishimoto, S., Oda-Yamamizo, C., and Ohmiya, A. (2020). Heterologous expression of xanthophyll esterase genes affects carotenoid accumulation in petunia corollas. Sci. Rep. 10:1299.
Koes, R. E., Quattrocchio, F., and Mol, J. N. M. (1994). The flavonoid biosynthetic pathway in plants: function and evolution. BioEssays 16, 123–132. doi: 10.1002/bies.950160209
Kosambi, D. D. (1944). The estimation of map distances from recombination values. Ann. Eugen. 12, 172–175. doi: 10.1111/j.1469-1809.1943.tb02321.x
Lee, S. B., Kim, J. E., Kim, H. T., Lee, G. M., Kim, B. S., and Lee, J. M. (2020). Genetic mapping of the c1 locus by GBS-based BSA-seq revealed Pseudo-Response Regulator 2 as a candidate gene controlling pepper fruit color. Theor. Appl. Genet. 133, 1897–1910. doi: 10.1007/s00122-020-03565-5
Li, H., and Durbin, R. (2010). Fast and accurate long-read alignment with Burrows-Wheeler transform. Bioinformatics 26, 589–595. doi: 10.1093/bioinformatics/btp698
Li, H., Handsaker, B., Wysoker, A., Fennell, T., Ruan, J., Homer, N., et al. (2009). The sequence alignment/map format and SAMtools. Bioinformatics 25, 2078–2079. doi: 10.1093/bioinformatics/btp352
Li, L., and Yuan, H. (2013). Chromoplast biogenesis and carotenoid accumulation. Arch. Biochem. Biophys. 539, 102–109. doi: 10.1016/j.abb.2013.07.002
Li, L., Yuan, H., Zeng, Y., and Xu, Q. (2016). Plastids and carotenoid accumulation. Subcell. Biochem. 79, 273–293. doi: 10.1007/978-3-319-39126-7_10
Liang, T. M., Chi, W. C., Huang, L. K., Qu, M. Y., Zhang, S. B., Chen, Z. Q., et al. (2020). Bulked segregant analysis coupled with whole-genome sequencing (BSA-Seq) mapping identifies a novel i21 haplotype conferring basal resistance to rice blast disease. Int. J. Mol. Sci. 21:2162. doi: 10.3390/ijms21062162
Lippold, F., vom Dorp, K., Abraham, M., Holzl, G., Wewer, V., Yilmaz, J. L., et al. (2012). Fatty acid phytyl ester synthesis in chloroplasts of Arabidopsis. Plant Cell 24, 2001–2014. doi: 10.1105/tpc.112.095588
Liu, L., Guo, W., Zhu, X., and Zhang, T. (2003). Inheritance and fine mapping of fertility restoration for cytoplasmic male sterility in Gossypium hirsutum L. Theor. Appl. Genet. 106, 461–469. doi: 10.1007/s00122-002-1084-0
Liu, Y., Lv, J., Liu, Z., Wang, J., Yang, B., Chen, W., et al. (2020). Integrative analysis of metabolome and transcriptome reveals the mechanism of color formation in pepper fruit (Capsicum annuum L.). Food Chem. 306:125629. doi: 10.1016/j.foodchem.2019.125629
Livak, K. J., and Schmittgen, T. D. (2001). Analysis of relative gene expression data using real-time quantitative PCR and the 2–Δ Δ CT method. Methods 25, 402–408. doi: 10.1006/meth.2001.1262
Lopez, A. B., Van Eck, J., Conlin, B. J., Paolillo, D. J., O’Neill, J., and Li, L. (2008). Effect of the cauliflower Or transgene on carotenoid accumulation and chromoplast formation in transgenic potato tubers. J. Exp. Bot. 59, 213–223. doi: 10.1093/jxb/erm299
Love, M. I., Huber, W., and Anders, S. (2014). Moderated estimation of fold change and dispersion for RNA-seq data with DESeq2. Genome Biol. 15:550.
Lu, S., Van Eck, J., Zhou, X. J., Lopez, A. B., O’Halloran, D. M., Cosman, K. M., et al. (2006). The cauliflower Or gene encodes a DnaJ Cysteine-rich domain-containing protein that mediates high levels of β-carotene accumulation. Plant Cell 18, 3594–3605. doi: 10.1105/tpc.106.046417
Nisar, N., Li, L., Lu, S., Khin, N. C., and Pogson, B. J. (2015). Carotenoid metabolism in plants. Mol. Plant 8, 68–82. doi: 10.1016/j.molp.2014.12.007
Ohmiya, A. (2011). Diversity of carotenoid composition in flower petals. Jpn. Agric. Res. Q. 45, 163–171. doi: 10.6090/jarq.45.163
Pozueta-Romero, J., Rafia, F., Houlne, G., Cheniclet, C., Carde, J. P., Schantz, M. L., et al. (1997). A ubiquitous plant housekeeping gene, PAP, encodes a major protein component of bell pepper chromoplasts. Plant Physiol. 115, 1185–1194. doi: 10.1104/pp.115.3.1185
Rahman, M. H. (2001). Inheritance of petal colour and its independent segregation from seed colour in Brassica rapa. Plant Breed. 120, 197–200. doi: 10.1046/j.1439-0523.2001.00607.x
Semagn, K., Babu, R., Hearne, S., and Olsen, M. (2013). Single nucleotide polymorphism genotyping using Kompetitive Allele Specific PCR (KASP): overview of the technology and its application in crop improvement. Mol. Breed. 33, 1–14. doi: 10.1007/s11032-013-9917-x
Simkin, A. J., Gaffe, J., Alcaraz, J. P., Carde, J. P., Bramley, P. M., Fraser, P. D., et al. (2007). Fibrillin influence on plastid ultrastructure and pigment content in tomato fruit. Phytochemistry 68, 1545–1556. doi: 10.1016/j.phytochem.2007.03.014
Singh, V. K., Mangalam, A. K., Dwivedi, S., and Naik, S. (1998). Primer premier: program for design of degenerate primers from a protein sequence. Biotechniques 24, 318–319. doi: 10.2144/98242pf02
Su, T. B., Yu, S. C., Zhang, J., Lan, W. F., Yu, Y. J., Zhang, D. S., et al. (2014). Loss of function of the carotenoid isomerase gene BrCRTISO confers orange color to the inner leaves of Chinese cabbage (Brassica rapa L. ssp. pekinensis). Plant Mol. Biol. Rep. 33, 648–659. doi: 10.1007/s11105-014-0779-0
Takada, S., Akter, A., Itabashi, E., Nishida, N., Shea, D. J., Miyaji, N., et al. (2019). The role of FRIGIDA and FLOWERING LOCUS C genes in flowering time of Brassica rapa leafy vegetables. Sci. Rep. 9:13843.
Takagi, H., Abe, A., Yoshida, K., Kosugi, S., Natsume, S., Mitsuoka, C., et al. (2013). QTL-seq: rapid mapping of quantitative trait loci in rice by whole genome resequencing of DNA from two bulked populations. Plant J. 74, 174–183. doi: 10.1111/tpj.12105
van Wijk, K. J., and Kessler, F. (2017). Plastoglobuli: plastid microcompartments with integrated functions in metabolism, plastid developmental transitions, and environmental adaptation. Annu. Rev. Plant Biol. 68, 253–289. doi: 10.1146/annurev-arplant-043015-111737
Vishnevetsky, M., Ovadis, M., and Vainstein, A. (1999). Carotenoid sequestration in plants: the role of carotenoid-associated proteins. Trends Plant Sci. 4, 232–235. doi: 10.1016/s1360-1385(99)01414-4
Vishnevetsky, M., Ovadis, M., Itzhaki, H., Levy, M., Libal-Weksler, Y., Adam, Z., et al. (1996). Molecular cloning of a carotenoid-associated protein from Cucumis sativus corollas: homologous genes invol-ved in carotenoid sequestration in chromoplasts. Plant J. 10, 1111–1118. doi: 10.1046/j.1365-313x.1996.10061111.x
Wang, H., Huang, Y., Xiao, Q., Huang, X., Li, C., Gao, X., et al. (2020). Carotenoids modulate kernel texture in maize by influencing amyloplast envelope integrity. Nat. Commun. 11:5346.
Wang, N., Liu, Z. Y., Zhang, Y., Li, C. Y., and Feng, H. (2017). Identification and fine mapping of a stay-green gene (Brnye1) in pakchoi (Brassica campestris L. ssp. chinensis). Theor. Appl. Genet. 131, 673–684. doi: 10.1007/s00122-017-3028-8
Wang, X. W., Wang, H. Z., Wang, J., Sun, R. F., Wu, J., Liu, S. Y., et al. (2011). The genome of the mesopolyploid crop species Brassica rapa. Nat. Genet. 43, 1035–1039.
Wu, J., Mao, X., Cai, T., Luo, J., and Wei, L. (2006). KOBAS server: a web-based platform for automated annotation and pathway identification. Nucleic Acids Res. 34, W720–W724.
Yang, S. J., Yu, W. T., Wei, X. C., Wang, Z. Y., Zhao, Y. Y., Zhao, X. B., et al. (2020). An extended KASP-SNP resource for molecular breeding in Chinese cabbage (Brassica rapa L. ssp. pekinensis). PLoS One 15:e0240042. doi: 10.1371/journal.pone.0240042
Yuan, H., Zhang, J., Nageswaran, D., and Li, L. (2015). Carotenoid metabolism and regulation in horticultural crops. Hortic. Res. 2:15036.
Zhang, B., Liu, C., Wang, Y., Yao, X., Wang, F., Wu, J., et al. (2015). Disruption of a CAROTENOID CLEAVAGE DIOXYGENASE 4 gene converts flower colour from white to yellow in Brassica species. New Phytol. 206, 1513–1526. doi: 10.1111/nph.13335
Zhang, J. X., Yuan, H., Fei, Z. J., Pogson, B. J., Zhang, L. G., and Li, L. (2015). Molecular characterization and transcriptome analysis of orange head Chinese cabbage (Brassica rapa L. ssp. pekinensis). Planta 241, 1381–1394. doi: 10.1007/s00425-015-2262-z
Zhang, N., Chen, L., Ma, S., Wang, R. F., He, Q., Tian, M., et al. (2020). Fine mapping and candidate gene analysis of the white flower gene Brwf in Chinese cabbage (Brassica rapa L.). Sci. Rep. 10:6080.
Zhang, X. X., Li, R. H., Chen, L., Niu, S. L., Chen, L., Gao, J., et al. (2018a). Fine-mapping and candidate gene analysis of the Brassica juncea white-flowered mutant Bjpc2 using the whole-genome resequencing. Mol. Genet. Genomics 293, 359–370. doi: 10.1007/s00438-017-1390-5
Zhang, X. X., Li, R. H., Chen, L., Niu, S. L., Li, Q., Xu, K., et al. (2018b). Inheritance and gene mapping of the white flower trait in Brassica juncea. Mol. Breed. 38:20.
Zhang, X., Liu, Z. Y., Wang, P., Wang, Q., Yang, S., and Feng, H. (2013). Fine mapping of BrWax1, a gene controlling cuticular wax biosynthesis in Chinese cabbage (Brassica rapa L. ssp. pekinensis). Mol. Breed. 32, 867–874. doi: 10.1007/s11032-013-9914-0
Zhang, X., Zhang, K., Wu, J., Guo, N., Liang, J. L., Wang, X. W., et al. (2020). QTL-Seq and sequence assembly rapidly mapped the gene BrMYBL2.1 for the purple trait in Brassica rapa. Sci. Rep. 10:2328.
Keywords: Brassica rapa, white flower, gene cloning, carotenoid, plastoglobule
Citation: Yang S, Tian X, Wang Z, Wei X, Zhao Y, Su H, Zhao X, Tian B, Yuan Y and Zhang X-W (2021) Fine Mapping and Candidate Gene Identification of a White Flower Gene BrWF3 in Chinese Cabbage (Brassica rapa L. ssp. pekinensis). Front. Plant Sci. 12:646222. doi: 10.3389/fpls.2021.646222
Received: 14 January 2021; Accepted: 13 April 2021;
Published: 07 May 2021.
Edited by:
Lourdes Gómez-Gómez, University of Castilla-La Mancha, SpainReviewed by:
Maria Jesus Rodrigo, Institute of Agrochemistry and Food Technology (IATA), SpainDámaso Hornero-Mendez, Consejo Superior de Investigaciones Científicas (CSIC), Spain
Melaku Gedil, International Institute of Tropical Agriculture (IITA), Nigeria
Copyright © 2021 Yang, Tian, Wang, Wei, Zhao, Su, Zhao, Tian, Yuan and Zhang. This is an open-access article distributed under the terms of the Creative Commons Attribution License (CC BY). The use, distribution or reproduction in other forums is permitted, provided the original author(s) and the copyright owner(s) are credited and that the original publication in this journal is cited, in accordance with accepted academic practice. No use, distribution or reproduction is permitted which does not comply with these terms.
*Correspondence: Shuangjuan Yang, c2p5YW5nXzA2MTRAMTYzLmNvbQ==; Baoming Tian, dGlhbmJtQHp6dS5lZHUuY24=; Yuxiang Yuan, eXV4aWFuZ3l1YW4xMjZAMTI2LmNvbQ==; Xiao-Wei Zhang, eGlhb3dlaTU3MzdAMTYzLmNvbQ==
†These authors have contributed equally to this work and share first authorship
 Shuangjuan Yang
 Xinxin Tian
 Zhiyong Wang1†
 Xiaochun Wei
 Henan Su
 Yuxiang Yuan
 Xiao-Wei Zhang