
94% of researchers rate our articles as excellent or good
Learn more about the work of our research integrity team to safeguard the quality of each article we publish.
Find out more
METHODS article
Front. Plant Sci., 25 March 2021
Sec. Technical Advances in Plant Science
Volume 12 - 2021 | https://doi.org/10.3389/fpls.2021.642917
This article is part of the Research TopicHyperspectral Imaging Technology: A Novel Method for Agricultural and Biosecurity Diagnostics View all 10 articles
Chlorophyll content is an important indicator of winter wheat health status. It is valuable to investigate whether the relationship between spectral reflectance and the chlorophyll content differs under elevated CO2 condition. In this open-top chamber experiment, the CO2 treatments were categorized into ambient (aCO2; about 400 μmol⋅mol–1) or elevated (eCO2; ambient + 200 μmol⋅mol–1) levels. The correlation between the spectral reflectance and the chlorophyll content of the winter wheat were analyzed by constructing the estimation model based on red edge position, sensitive band and spectral index methods, respectively. The results showed that there was a close relationship between chlorophyll content and the canopy spectral curve characteristics of winter wheat. Chlorophyll content was better estimated based on sensitive spectral bands and difference vegetation index (DVI) under both aCO2 and eCO2 conditions, though the accuracy of the models varied under different CO2 conditions. The results suggested that the hyperspectral measurement can be effectively used to estimate the chlorophyll content under both aCO2 and eCO2 conditionsand could provide a useful tool for monitoring plants physiology and growth.
It is expected that the atmospheric CO2 concentration will rise to 550 μmol⋅mol–1 in 2050 and reach or exceed 700 μmol⋅mol–1 at the end of the 21st century due to the increase of human population, energy production and utilization, deforestation and other intensive human activities (IPCC, 2013). Wheat is one of the world’s most productive and important crops in the 21st century, and also the main source of food for human (Curtis and Halford, 2014). Under elevated CO2, the physiology, growth and yield of wheat and other species are affected (Long et al., 2006; Wang et al., 2012).
Chlorophyll content was closely related to crop health, photosynthetic capacity and crop yield (Lukas et al., 2014). C3 plants are more sensitive to elevated CO2 than C4 plants (Leakey et al., 2009). The chlorophyll content and photosynthetic rate of varieties of C3 species, including crops and trees, was increased by elevated CO2 (Zhang et al., 2013; Madhana et al., 2014; Fathurrahman et al., 2016; Choi et al., 2017). For wheat, previous studies had shown a positive (Dubey et al., 2015) or negative (Wang et al., 2013) CO2 effects on the chlorophyll content and the difference might be resulted from the different experimental settings or CO2 increasing levels used in different studies. Given that systematic measurement of chlorophyll contents in elevated CO2 condition is scarce, a detailed measurement of chlorophyll content of winter wheat throughout the growing season will be useful to understand the effect of elevated CO2 on the physiology and growth of winter wheat.
Remote sensing methods could be used to accurately and rapidly relate variations in leaf optical properties with important plant characteristics, such as chlorophyll content and photosynthetic properties at the leaf and canopy scales (Ainsworth et al., 2014). Inversion of chlorophyll content by hyperspectral remote sensing was of great significance for crop growth status monitoring, yield estimation and agricultural planning (Liang et al., 2012; Flores-De-Santiago et al., 2013). Hyperspectral remote sensing had been used to monitor winter wheat chlorophyll content (He et al., 2018; Kasim et al., 2018). However, the application had been limited to specific test conditions (Serbin et al., 2012; Zhou et al., 2016) and there were few studies investigating hyperspectral remote sensing applications on winter wheat under elevated CO2 conditions.
The hyperspectral estimation models could be determined through different techniques to extract hyperspectral characteristics, including reflectance spectrum and first derivative spectrum, absorption and reflection location and vegetation index (Li et al., 2014). Previous research studied the relationship between visible and near-infrared spectra and leaf chemical components and found out that the original spectral reflectance and the first and second derivatives of the spectra could be used to estimate crop agronomic parameters (Card et al., 1988). Red edge and sensitive bands based spectral models had been used to simulate chlorophyll and nitrogen content of many species (Hansen and Schjoerring, 2003; Chen et al., 2013; Clevers and Gitelson, 2013; Stratoulias et al., 2015). Identifying optimal hyperspectral estimation models of winter wheat under different CO2 conditions is critical in crop growth monitoring and forecasting and requires further investigation.
In order to find an optimal estimation model for chlorophyll content and promote spectral analysis in the application of agriculture management under future global change conditions, an open top chamber (OTC) based CO2 manipulation experiment was conducted for 2 years in this study. The objectives of this study were: (1) to establish statistical models to study the relationship between hyperspectral characteristics and chlorophyll content of winter wheat throughout the growing stages; (2) to investigate whether the relationship between hyperspectral characteristics and chlorophyll content varies under elevated CO2 conditions.
The study site was located in the agrometeorological experimental station of Nanjing University of Information Science and Technology, in Nanjing city, Jiangsu province of China (32°16’N, 118°86’E). The climate in this region characterizes subtropical monsoon season, with annual average precipitation of 1,100 mm, the average temperature in recent years of 15.6°C and the average annual frost-free period of 237 days. The soil texture in the tillage layer of winter wheat was loamy clay, and the clayey content was 26.1%. The bulk density of 0–20 cm soil was 1.57 g⋅cm–3, the pH (H2O) value was 6.3, and the organic carbon and total nitrogen content were 11.95 and 1.19 g⋅kg–1, respectively.
Open top chambers (OTC) were used in the experiment to manipulate CO2 concentration. There were eight OTC chambers, all of which were octagonal prisms (opposite side diameter 3.75 m, height 3 m, bottom area 10 m2) and equipped with aluminum alloy frames and toughened glass with high transmittance. There were two CO2 treatments, ambient CO2 (aCO2) and elevated CO2 (eCO2, aCO2 + 200 μmol⋅mol–1), each with four replicates. The treatment of elevated CO2 started from regreening stage and lasted to the end of growing stage.
In order to avoid the rapid loss of CO2 gas and reduce the experiment cost, the top opening of OTC was designed to tilt inward for 45°. The CO2 concentration in the chambers was controlled with an automatic control platform, composed of CO2 sensors, gas-supplying devices and automatic control system. Three wind-blowing fans were placed in each chamber to make the CO2 gas in the chamber evenly distributed. The CO2 sensor feeds back the CO2 concentration information in the chamber to the automatic control system every two seconds. The CO2 concentration averaged was 650 ± 58 μmol⋅mol–1 in elevated CO2 chambers and 455 ± 42 μmol⋅mol–1 in ambient chambers across two growing seasons.
The local winter wheat variety of Ningmai 13 was selected in the study. The field measurement of spectrum and chlorophyll was conducted in 2018–2019 and 2019–2020 growing seasons. During the whole growing stages, fertilizer and water management were carried out in the local conventional way.
The spectral reflectance of winter wheat was measured by Field Spec4 of American analytical spectral device (ASD). The wavelength range was set at 350–2,500 nm. The sampling interval and resolution was set at 1.4 and 3 nm in the range of 350–1,000 nm; and 2 and 10 nm in 1,001–2,500 nm, respectively. The reflectance of winter wheat at five growth stages (jointing, booting, heading, filling and maturity stage) was measured on sunny days at 10:00 a.m.–2:00 p.m. Field Spec4 needed to be preheated 30 min before measurement. During the measurement, the sensor probe was placed vertically downward, the field of view angle was 10° and the probe was about 20 cm away from the top of the canopy. The measurement was carried out 10 times in different areas of an OTC. The reference white board was corrected immediately before and after the measurements in each chamber.
At the same time as the spectral measurement, the chlorophyll content was measured by the portable chlorophyll meter SPAD-502. Relevant studies have shown that soil and plant analyzer developrnent (SPAD) value was positively correlated with the total chlorophyll content, with the correlation coefficient up to 0.99, and the SPAD value could be used to represent the chlorophyll content of plants (Costa et al., 2001; Uddling et al., 2007). When measuring the chlorophyll content, five wheat plants were selected at the corresponding position of canopy spectrum measurement, then SPAD values were measured for five times uniformly on the upper, middle and lower leaves of each plant, and the average value was taken as the chlorophyll content of this sample point. A total of 200 chlorophyll samples were measured in 2018–2019 and 120 samples in 2019–2020. Two years of data were combined together, among which 240 samples were selected to establish the models, and the remaining 80 samples were used to verify the models.
View Specpro_6.0, Matlab_2017 and Origin_2018 were used to process and analyze the data. The spectral band range was set at 350–1,350 nm, and the wavelength corresponding to the largest first-order differential value in the red edge range (680–760 nm) was selected as the red edge position λr. The correlation analysis between canopy spectral reflectance and SPAD values of winter wheat was conducted, and the correlation coefficient was calculated to find out the sensitive bands. According to the original reflectance of winter wheat canopy, five common vegetation indexes were calculated. Each vegetation index had different characteristics. The normalized difference vegetation index (NDVI) was a common vegetation index and very sensitive to green vegetation. Ratio vegetation index (RVI) was sensitive to vegetation with high coverage. Difference vegetation index (DVI) and perpendicular vegetation index (PVI) were sensitive to the change of soil background. Optimizing soil and adjusting vegetation index (OSAVI) explained the changes in the optical characteristics of the background and corrected the sensitivity of NDVI to the soil background (Bannari et al., 2007; Yan et al., 2013). The calculation of each vegetation index was listed in Table 1.
Using the canopy spectral data of winter wheat, a regression estimation model with hyperspectral variables as independent variables and the chlorophyll content as dependent variables was established. Linear regression model was selected for all models:
In this study, the coefficient of determination (R2) and the root mean square error (RMSE) were used to verify the linear regression model. The higher coefficient of determination R2 and the smaller RMSE indicated a more accurate estimation model.
Where and yi were the predicted values and measured values of the sample respectively, and i was the average value of the measured values of the sample, and n was the number of samples.
The chlorophyll content in winter wheat under aCO2 and eCO2 in five growth stages was listed in Table 2. The chlorophyll content was lowest in the maturing stage and highest in the heading stage and varied under different CO2 treatments. At different growth stages, the effects of eCO2 on chlorophyll content of winter wheat were different. In booting and heading stage, eCO2 increased the chlorophyll content by 4.70–6.90%; in jointing, filling and maturity stage, eCO2 decreased the chlorophyll content by 2.80–18.20%. During the whole growth stage, the chlorophyll content under aCO2 was lower than that under eCO2 (Table 2).
The original spectral band range was set at 350–1,350 nm and the canopy spectral reflectance under aCO2 and eCO2 at different growth stages was shown in Figure 1. In each growth stage, the reflectance showed similar trend under aCO2 and eCO2, with an absorption band around 500 nm, an obvious “green peak” around 550 nm, the minimum value around 680 nm, and a “red edge” within the band range of 680–760 nm.
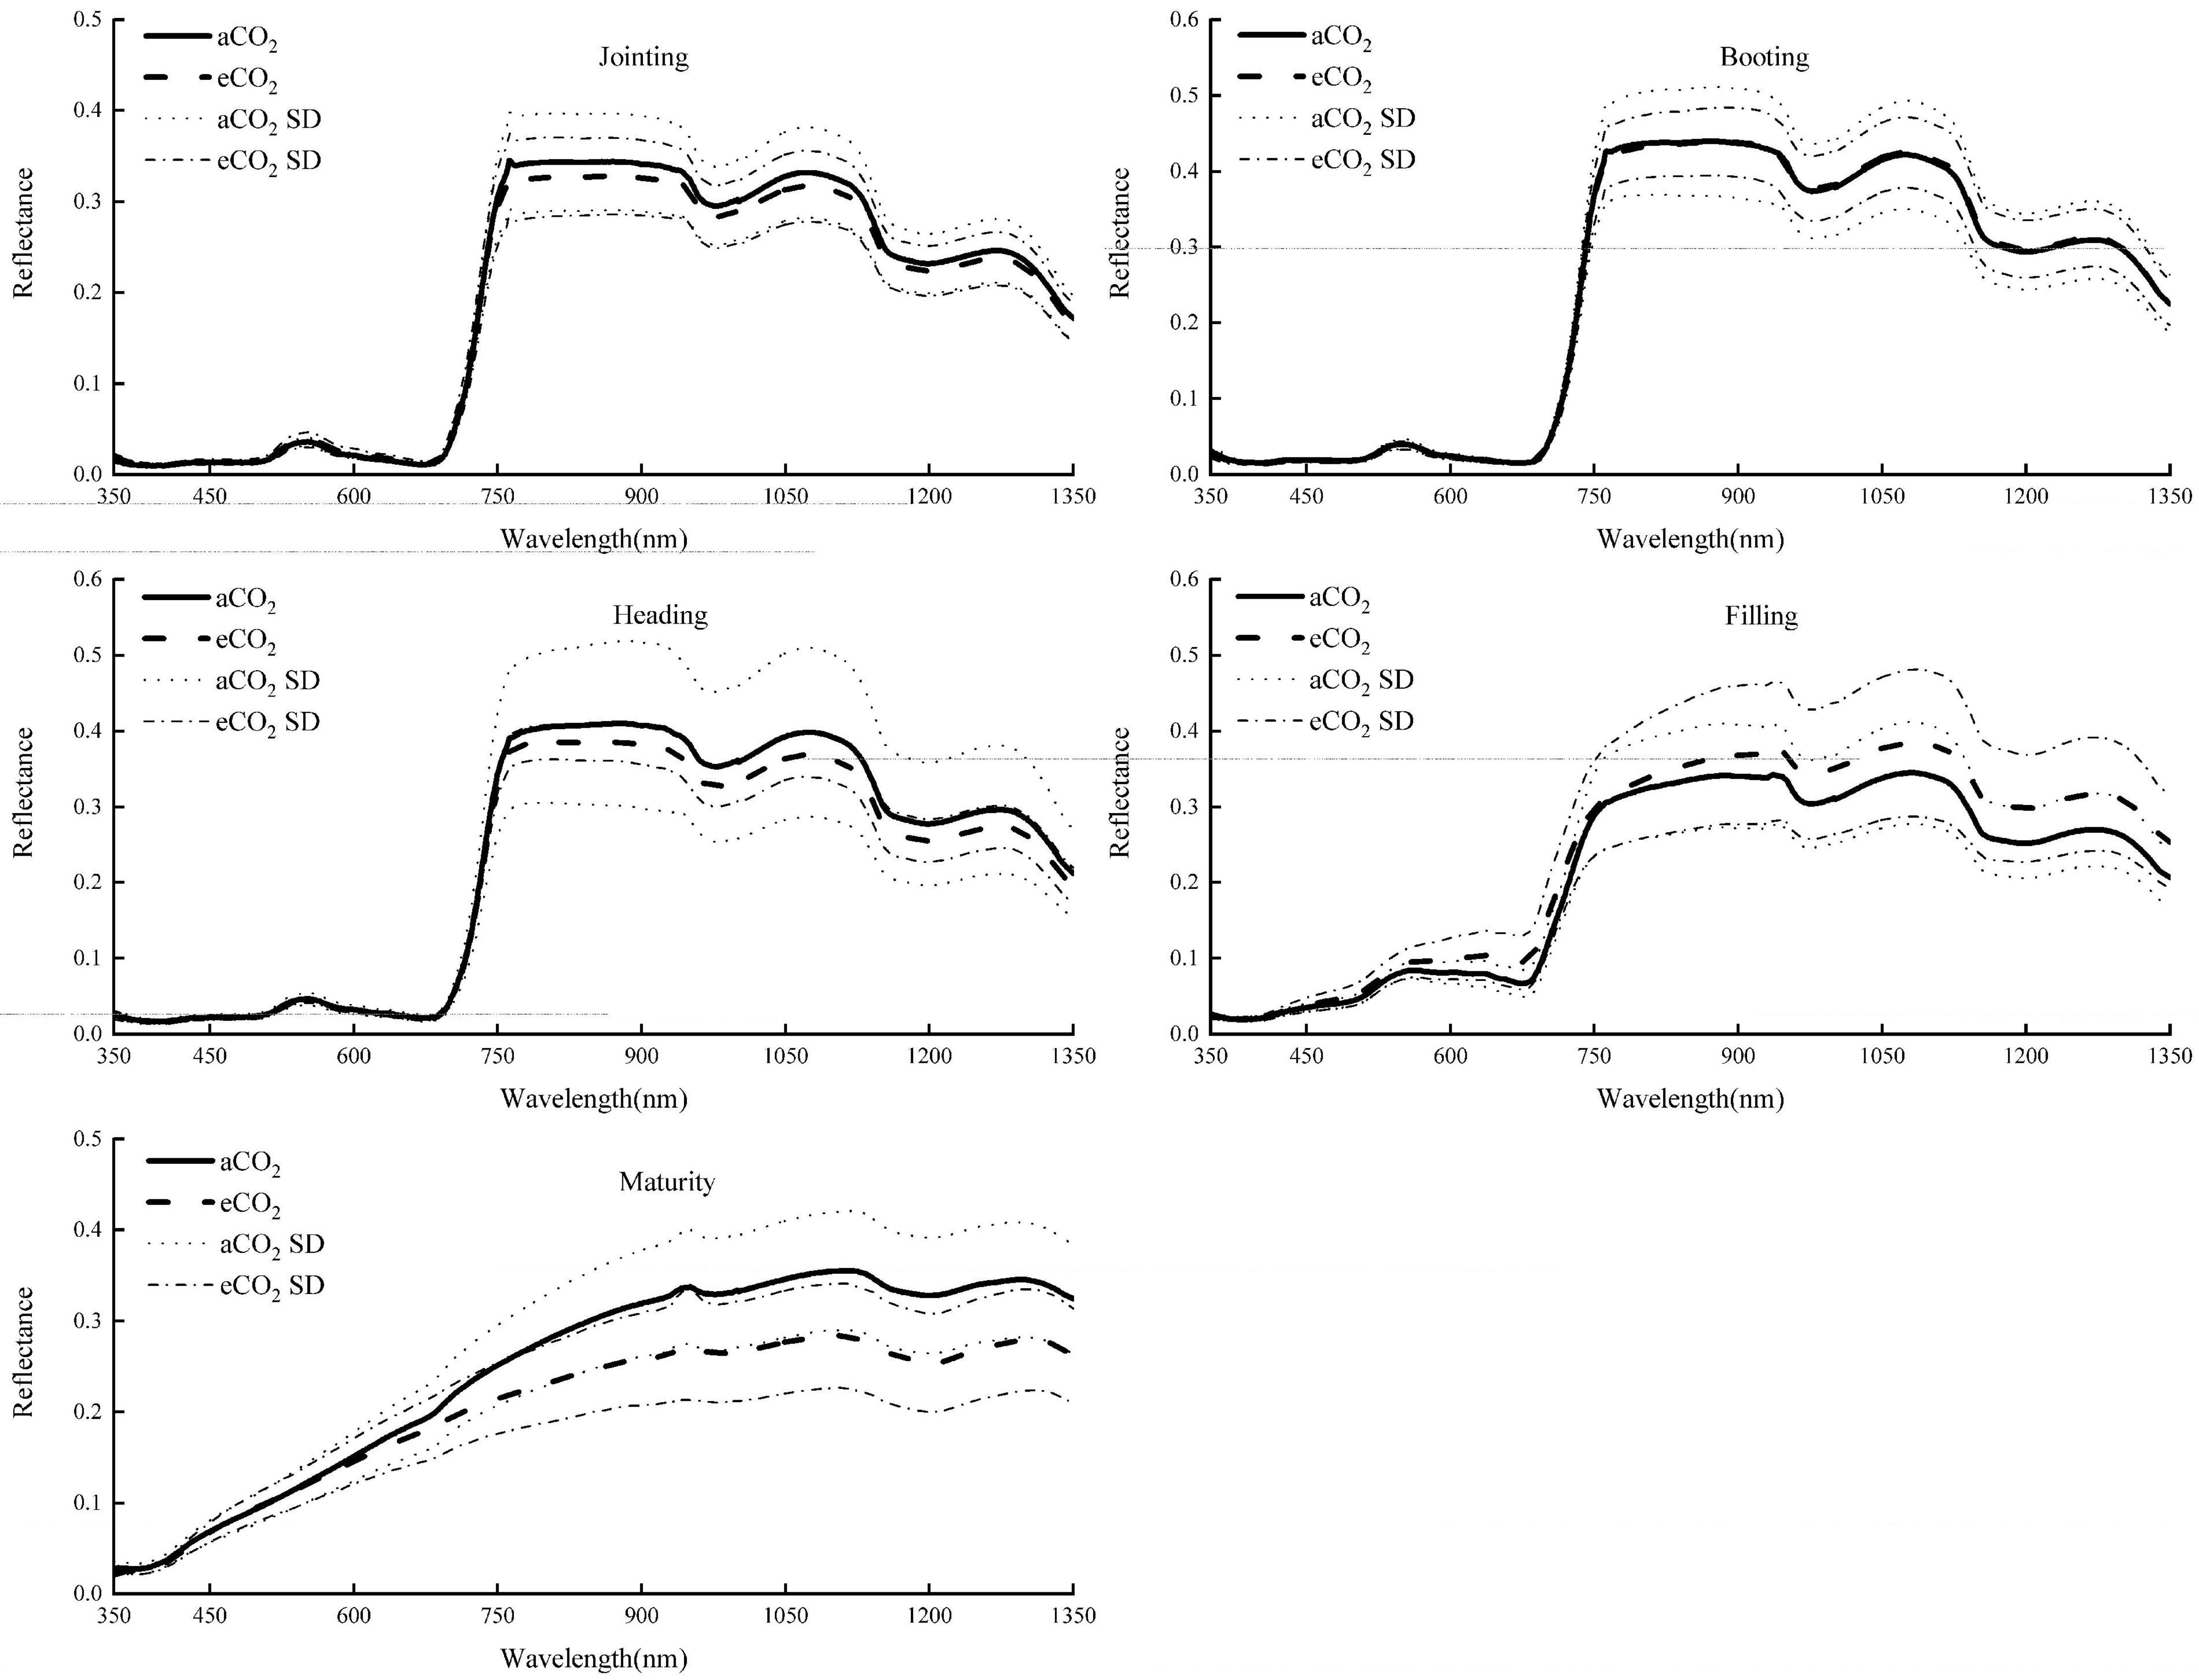
Figure 1. Spectral reflectance of winter wheat canopy at different growing stages under aCO2 and eCO2.
The spectral reflectance of winter wheat canopy under eCO2 was slightly lower at jointing, heading and maturity stages, and was higher at filling stage than that at aCO2, especially in the wavelength range of 760–1,350 nm. In the booting stage, the spectral reflectance of the two treatments was similar. Among the five growth stages, the spectral reflectance at the booting stage was the highest, reaching about 0.45.
Spectral reflectance rose rapidly at about 680 nm and slowly at about 760 nm. The band ranging between 680 and 760 nm was selected as the “red edge” spectrum. The linear regression model between the red edge position and the chlorophyll content was established to estimate chlorophyll content (Figure 2). The rest of the spectra and the chlorophyll content data were used to verify the model (Figure 3). The R2 of the model was 0.36 and 0.41 under aCO2 and eCO2, respectively (Figure 2). The estimation model based on the red edge location estimated chlorophyll content slightly better under eCO2 than under aCO2 (Figure 3).
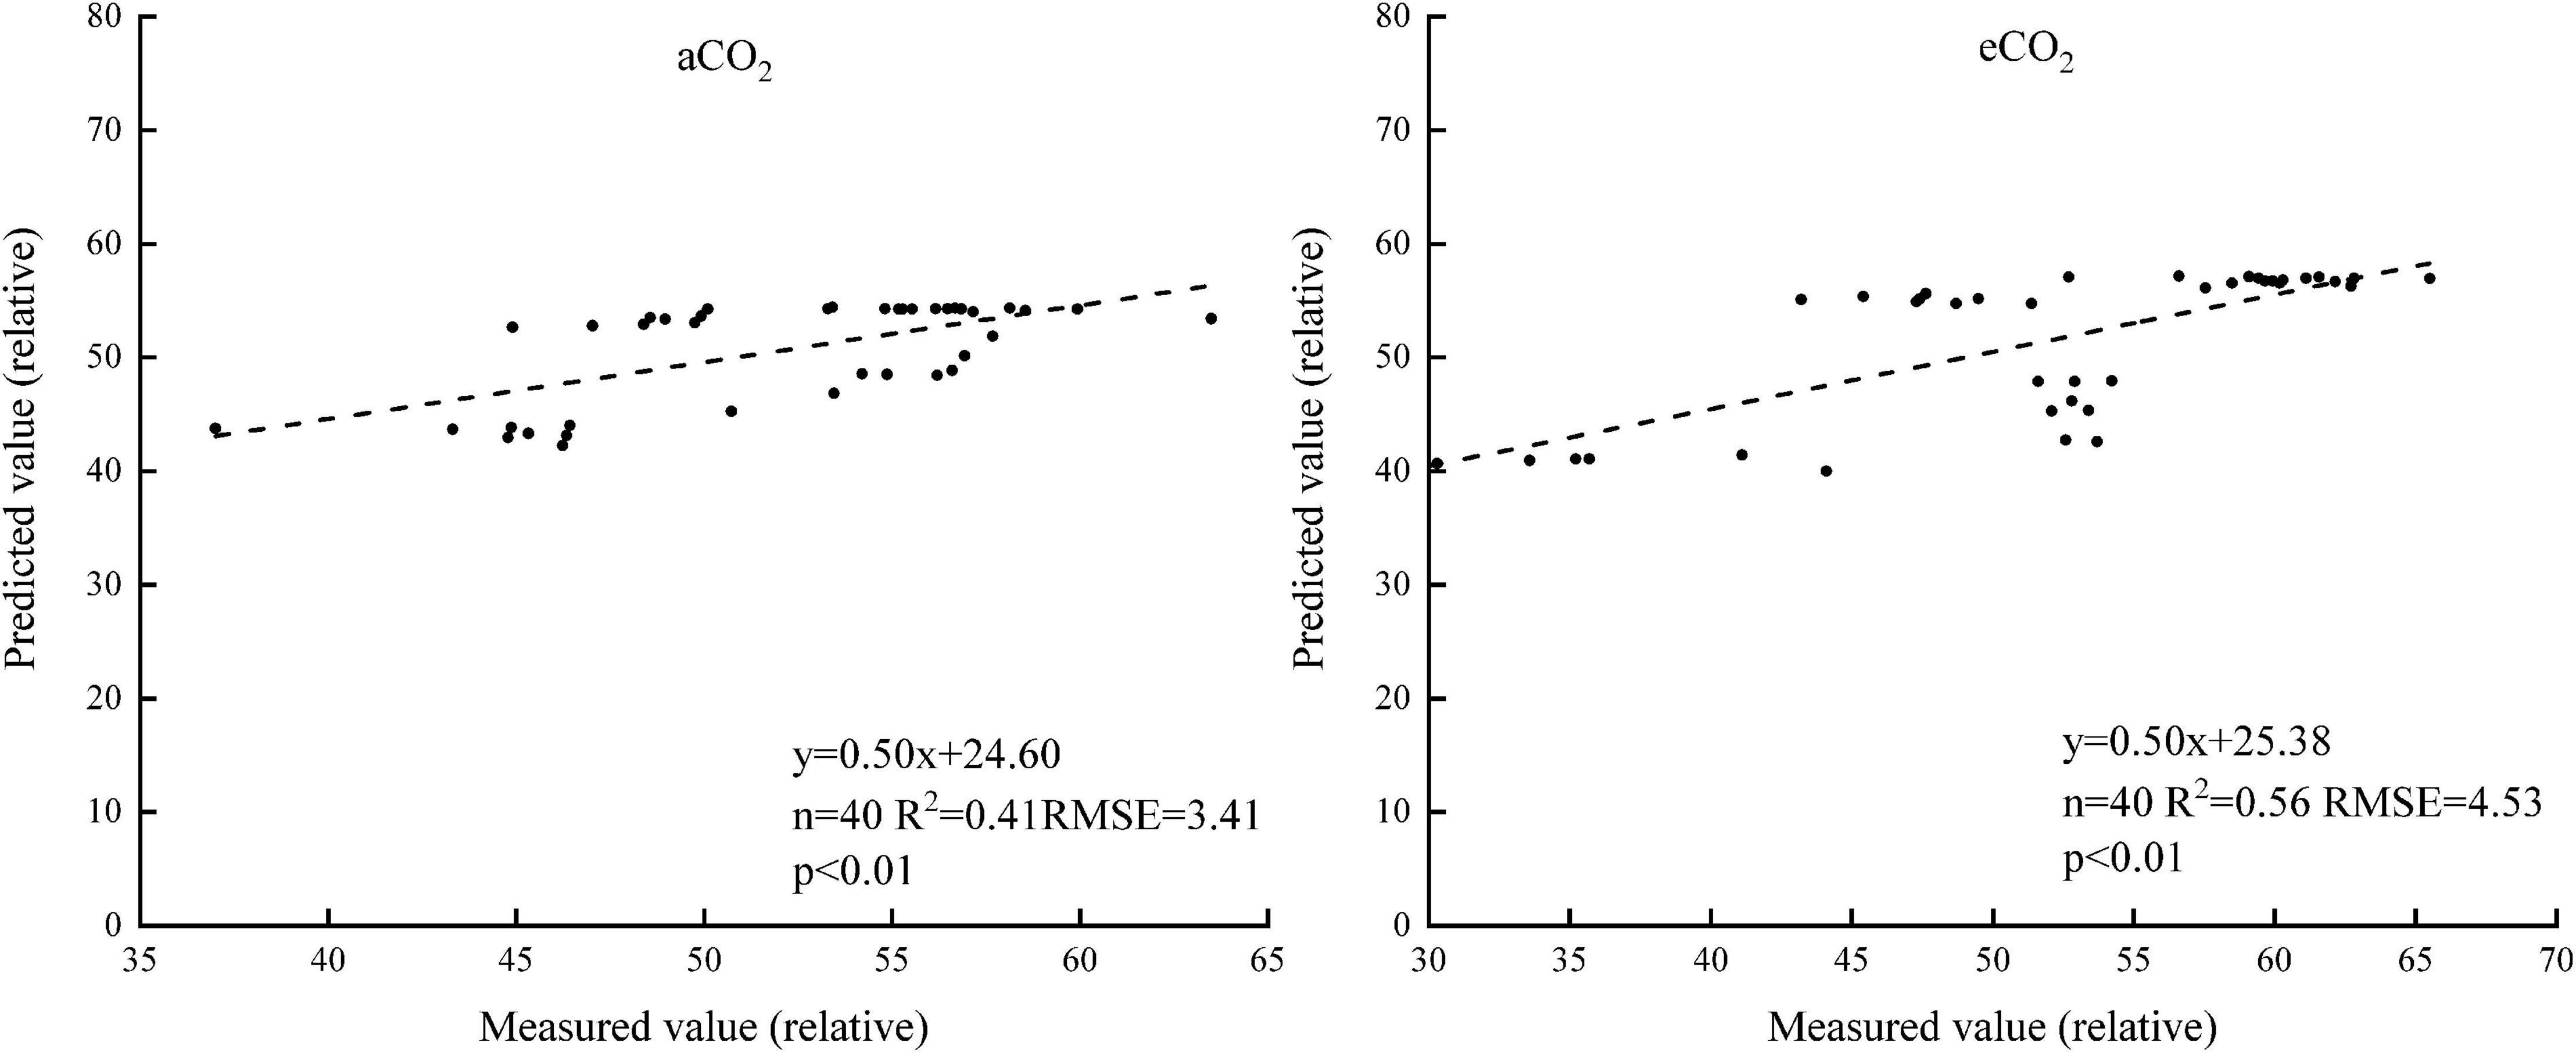
Figure 3. The measured and estimated values of the chlorophyll content based on the red-edge position model under aCO2 and eCO2.
The correlation coefficient of the spectral reflectance and chlorophyll content of winter wheat during the whole growth stage was analyzed (Figure 4). The correlation coefficient under aCO2 was higher than that under eCO2 between 350 and 1,350 nm. The canopy reflectance had the greatest correlation with the chlorophyll content at 740 and 749 nm under aCO2 and eCO2, respectively.
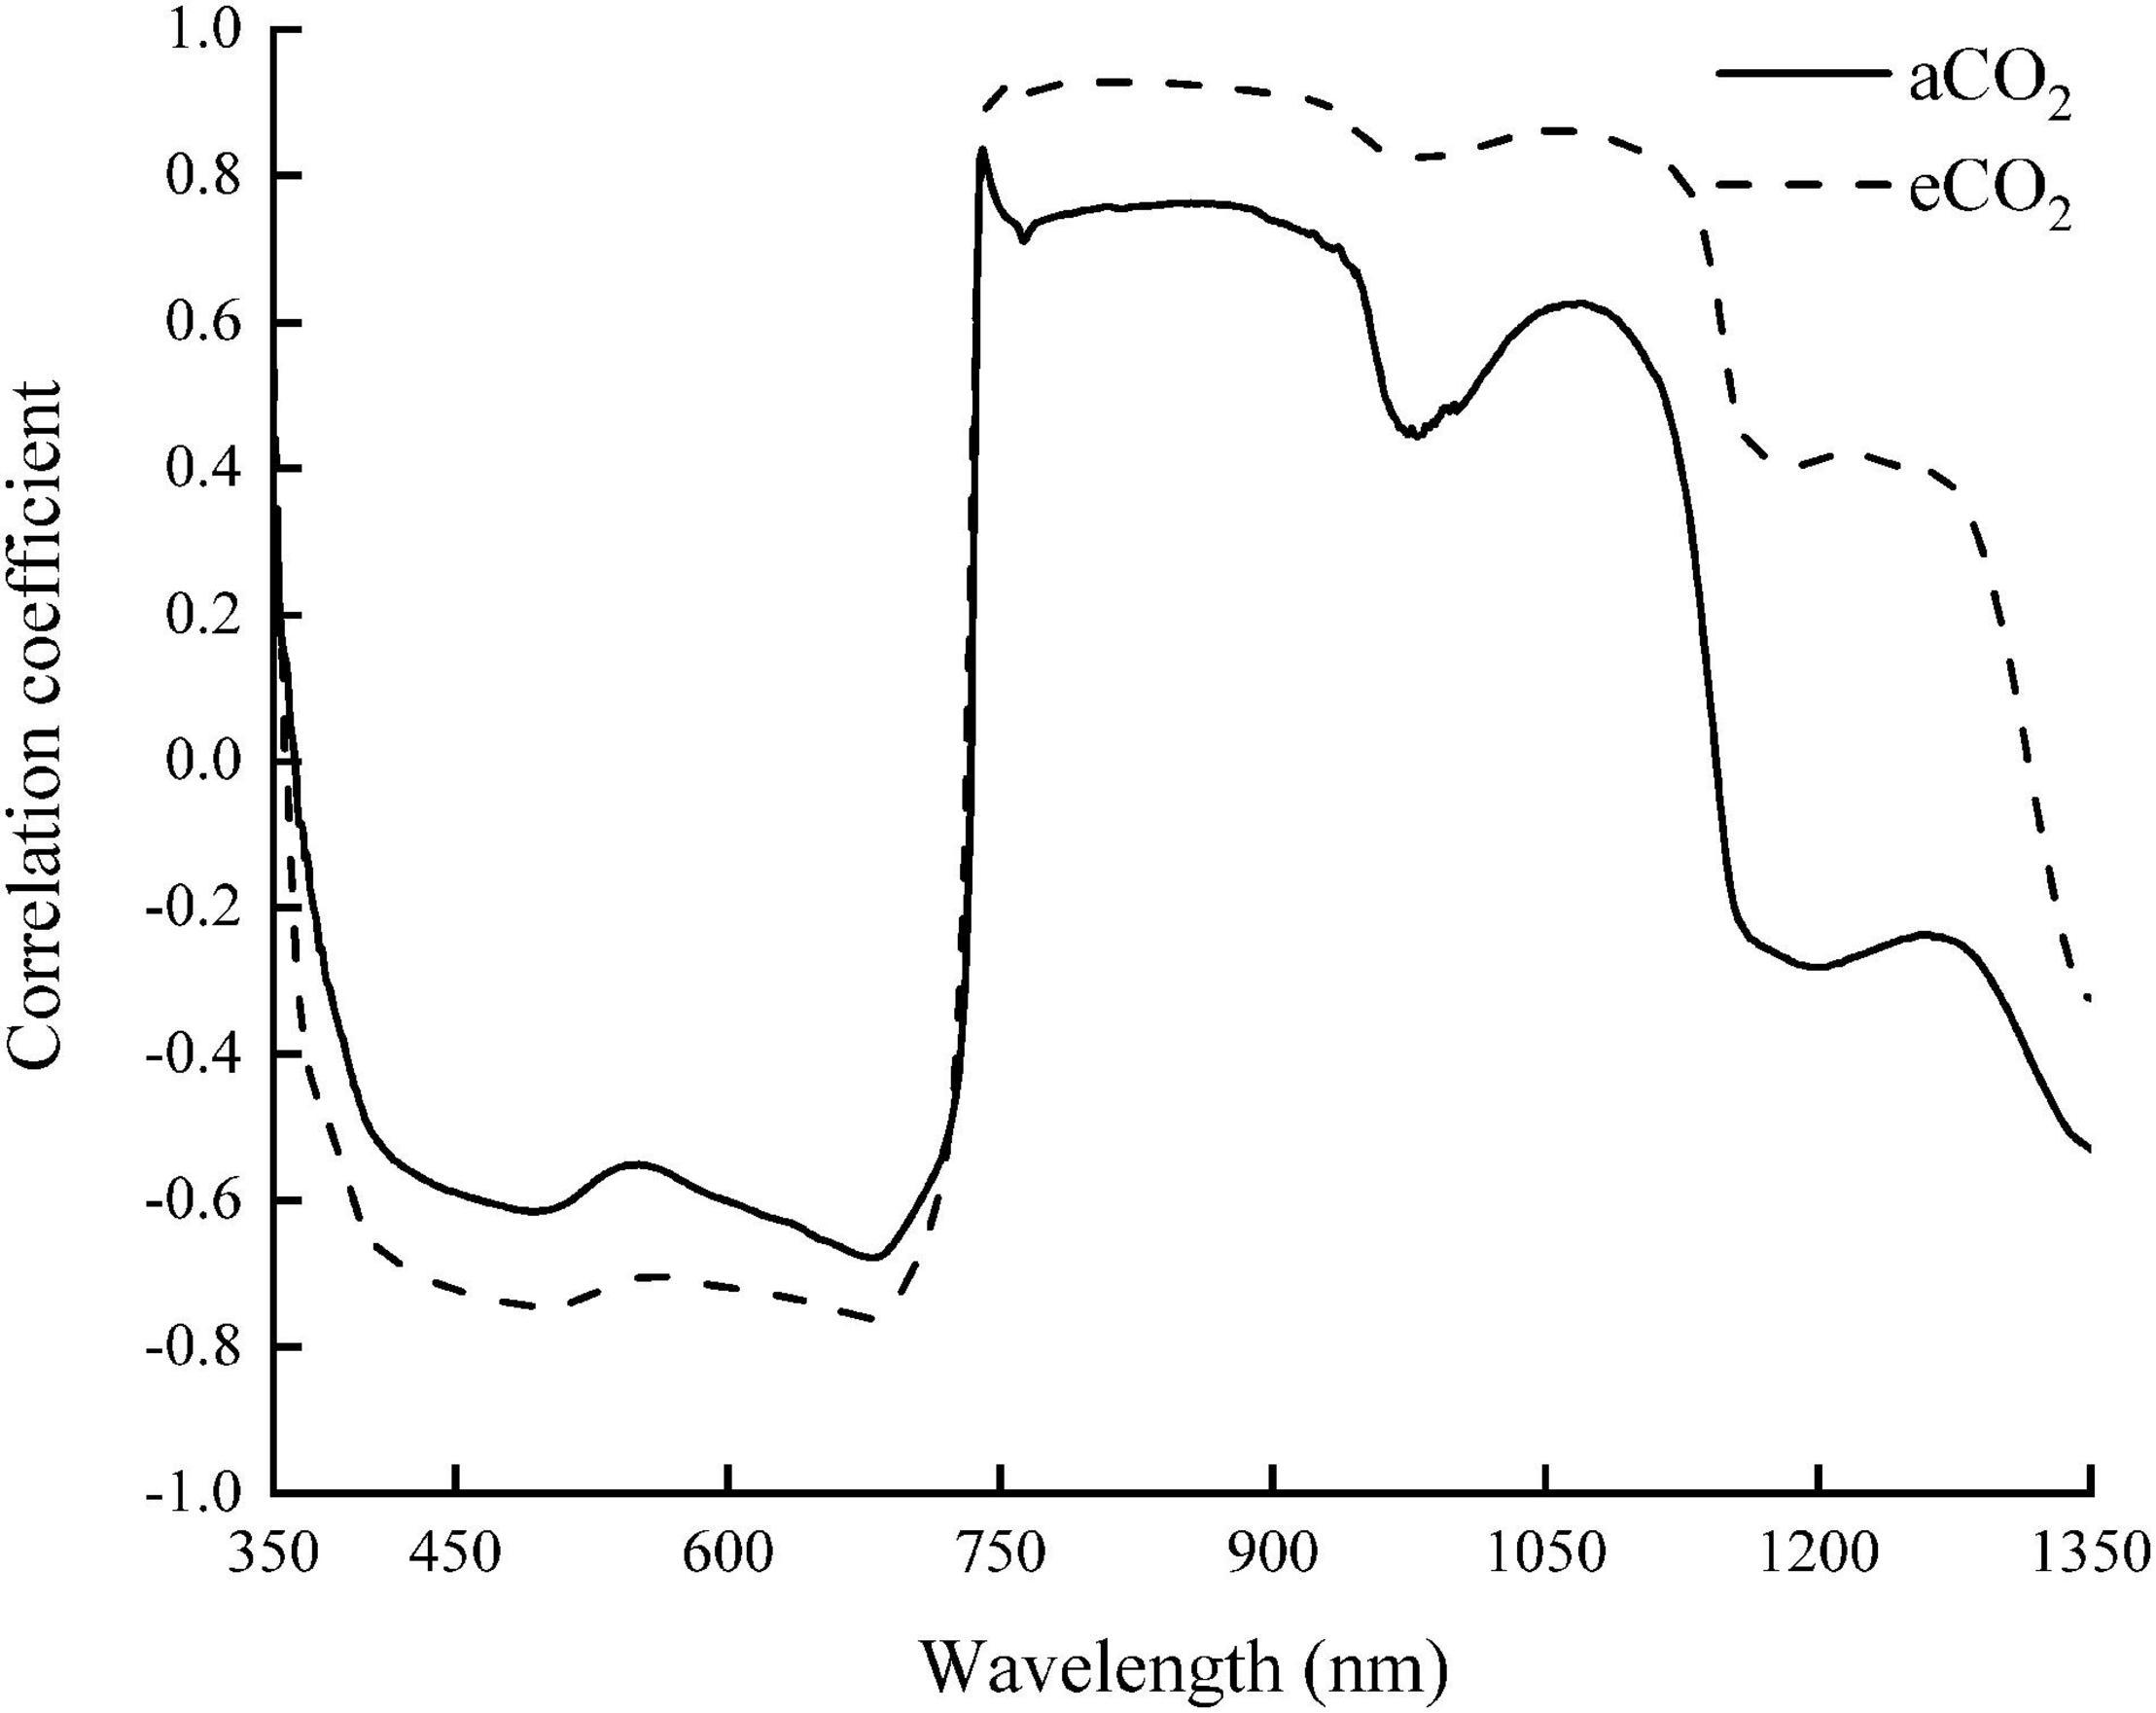
Figure 4. The correlations between the chlorophyll content and the spectral reflectance of winter wheat during the whole growing season.
The sensitive bands of 740 and 749 nm were then selected under aCO2 and eCO2 respectively, and the linear model between the spectral reflectance and chlorophyll content of the sensitive bands was established to estimate the chlorophyll content of winter wheat (Figure 5). The model was validated using the rest of the sampling data (Figure 6). The R2 of the linear model was 0.72 and 0.52 under aCO2 and eCO2, respectively (Figure 5) and the estimated values correlated well with the measured values of chlorophyll content under aCO2 and eCO2 (Figure 6).

Figure 5. The relationship between the chlorophyll content and the sensitive bands position of the spectral reflectance.
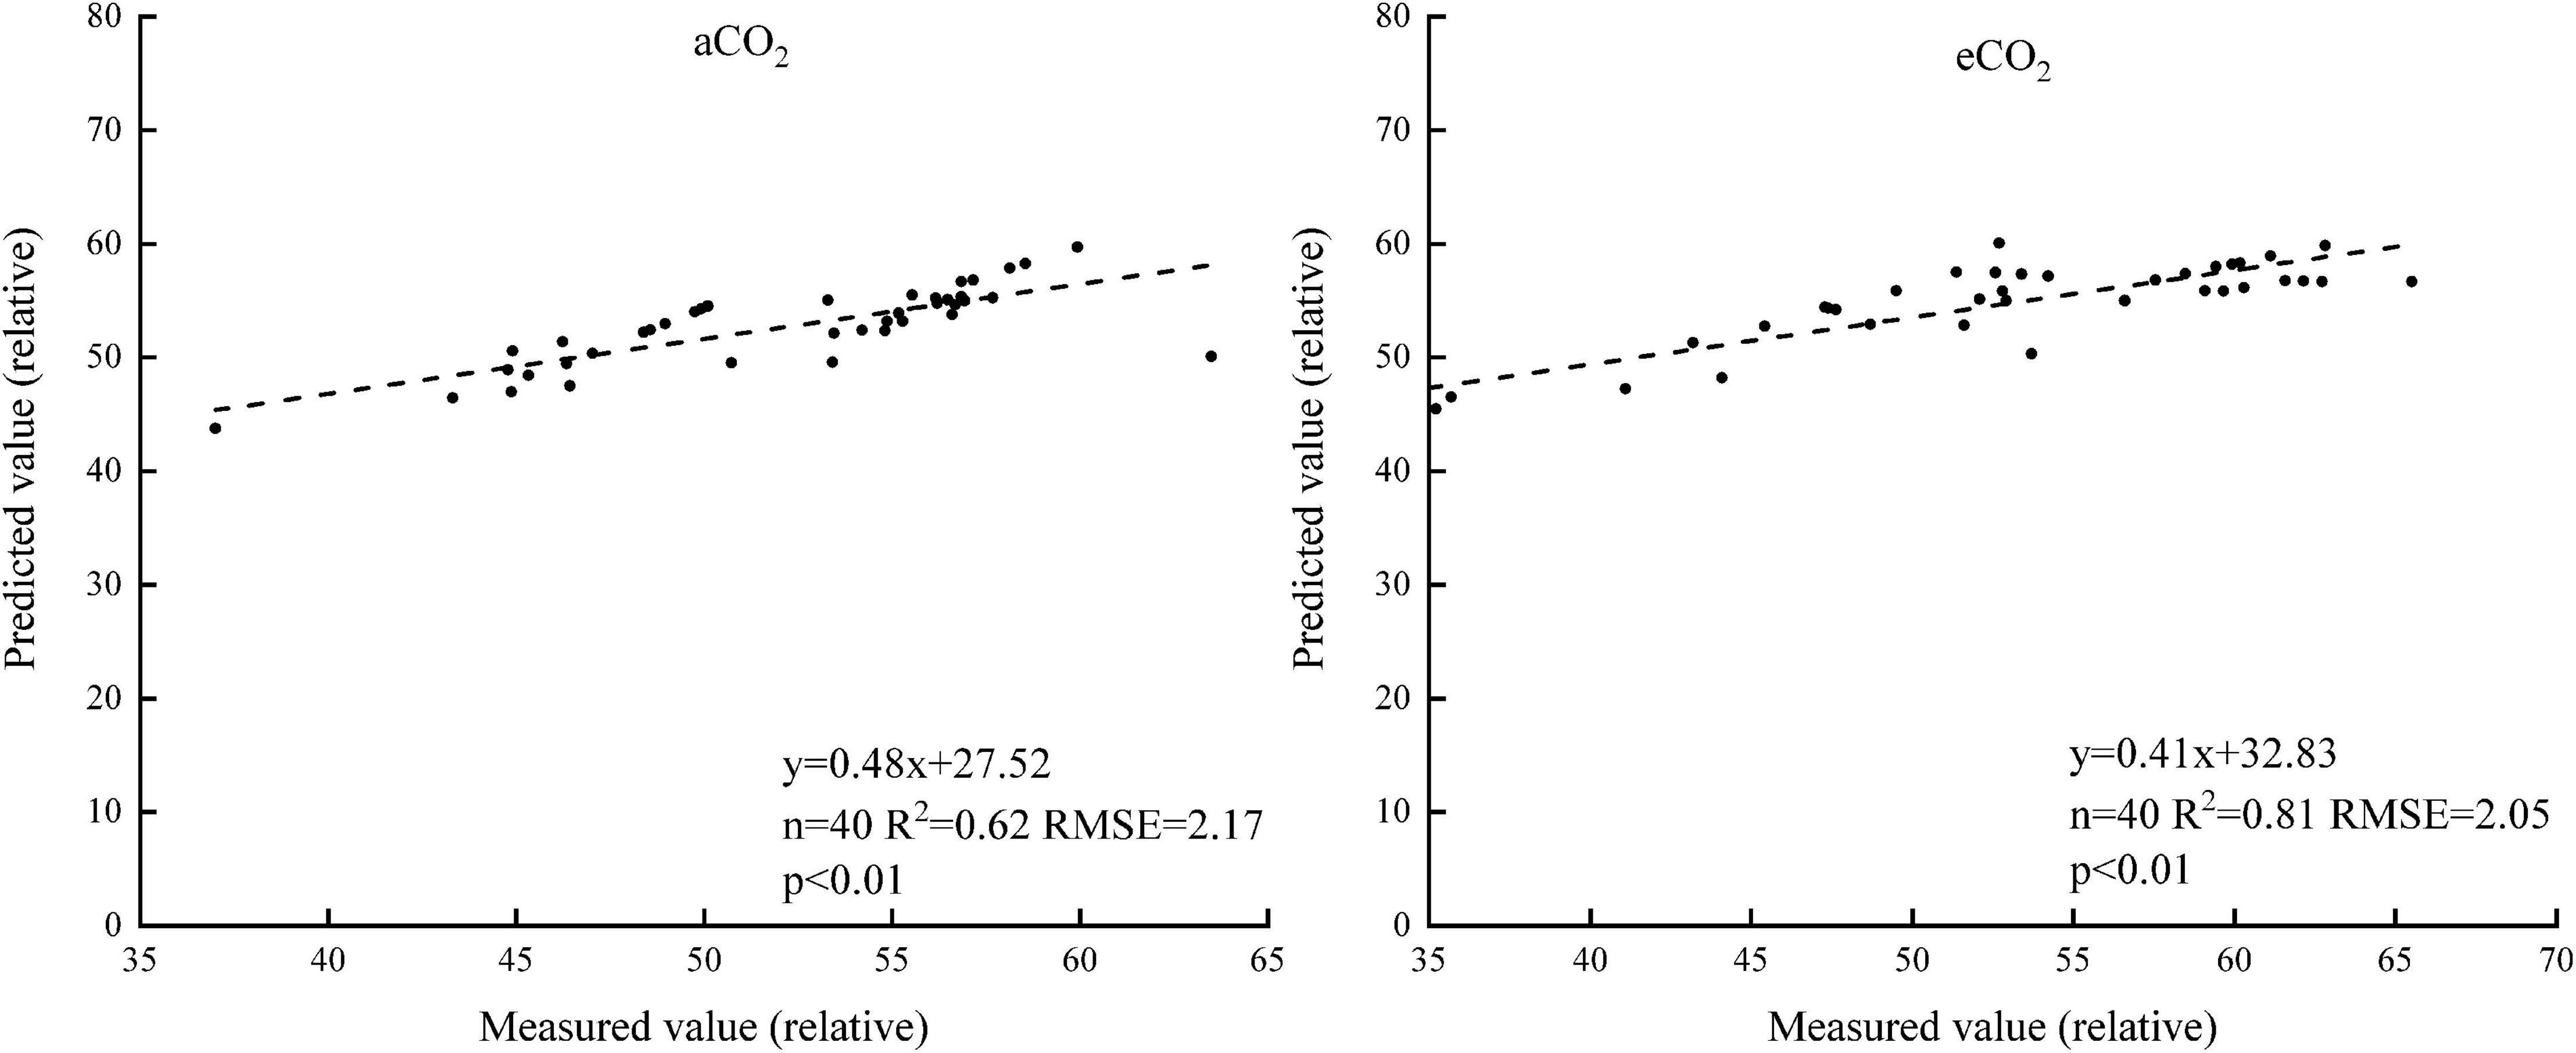
Figure 6. The measured and estimated values of chlorophyll content based on the sensitive band position model under aCO2 and eCO2.
Five different spectral indexes were extracted from the spectral reflectance curves (Table 2). Linear regression models of the five spectral indexes and chlorophyll contents of winter wheat were established. Under aCO2, the rank of R2 of the linear models was DVI > PVI > OSAVI > NDVI > RVI. Under eCO2, the rank of the R2 was DVI > OSAVI > NDVI > PVI > RVI (Table 3). The DVI based estimation models was established using half of the measured data (Figure 7) and validated using the rest of the sampling data (Figure 8). The R2 of the linear model established was 0.67 under aCO2 and 0.60 at eCO2 (Figure 7) and the estimated correlated well with the measured values of chlorophyll content under aCO2 and eCO2 (Figure 8).
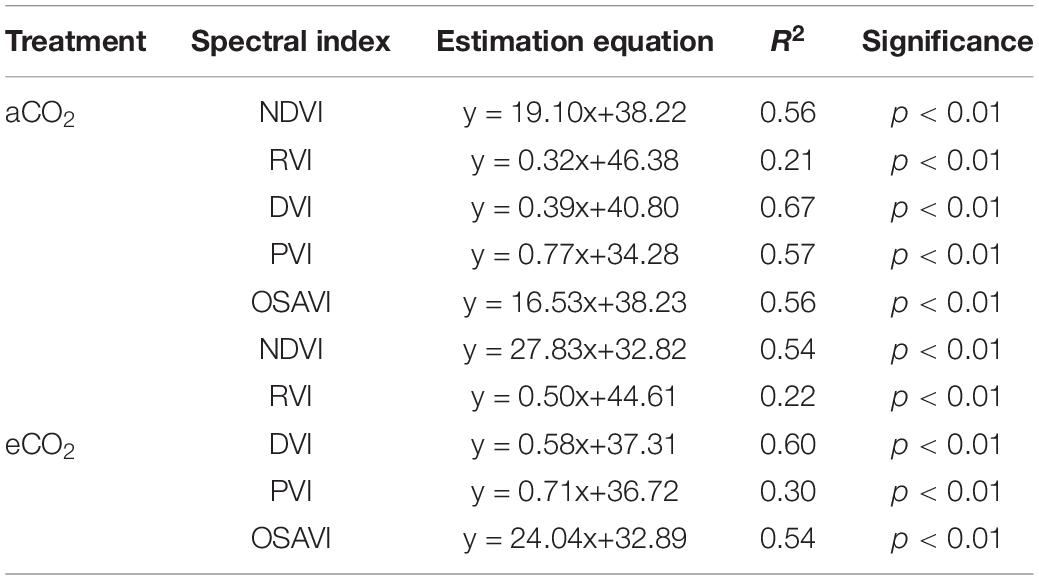
Table 3. Estimation models of the chlorophyll content in wheat canopy based on different spectral indexes.
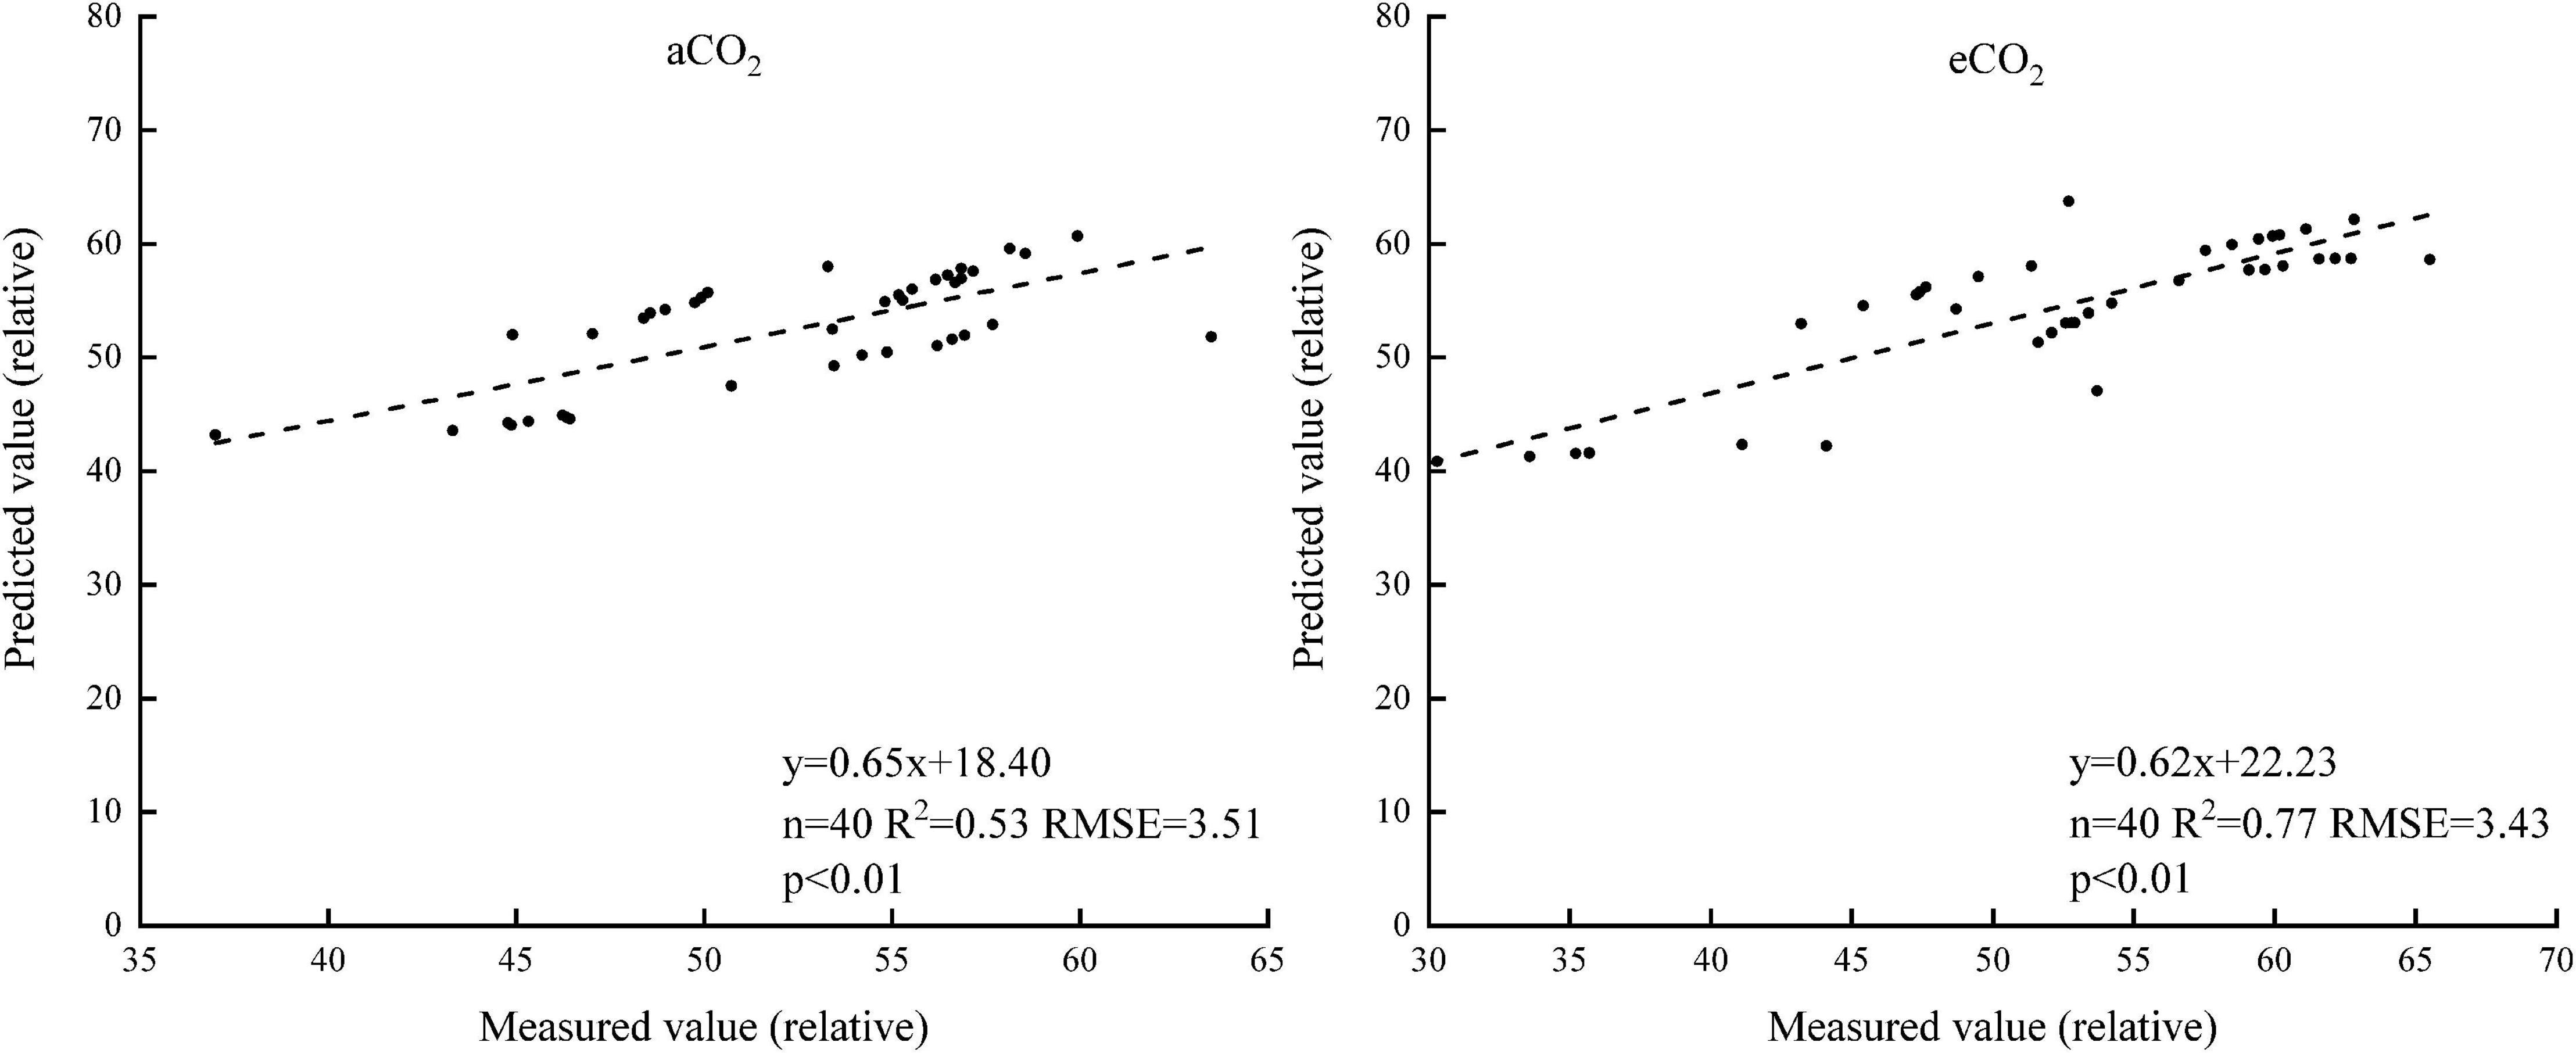
Figure 8. The measured and estimated values of the chlorophyll content based on the DVI model under aCO2 and eCO2.
In order to establish statistical models to study the relationship between the optical properties and chlorophyll content of winter wheat under elevated CO2 conditions, we measured the chlorophyll content and spectral reflectance in winter wheat canopy under aCO2 and eCO2 conditions throughout the growing season for 2 years. The effects of elevated CO2 on the chlorophyll content and spectral reflectance depended upon growing stages. The statistical models established in this study was effective under both ambient and elevated CO2 conditions.
Elevated CO2 increased the chlorophyll content of winter wheat at booting and heading stage, but decreased it at filling and maturity stage in this study. Elevated CO2 usually had a positive effect on the chlorophyll content, but the specific effect depended on treatment duration and different species (Long et al., 2004). The increase of CO2 concentration in the late growing stage might lead to the faster decline of chlorophyll concentration of wheat (Ommen et al., 1999). In this study, the senescence of winter wheat under eCO2 was faster than that under aCO2 and the chlorophyll content was decreased under eCO2 at the later growing stages. The overall shapes of spectral curves did not change throughout the growing season, except in the maturity stage, the curves flattened due to the senescence of the leaves. The effect of elevated CO2 on the spectral curves varied at different growing stages, with no impact in the earlier jointing and boosting stages, positive impact in the filling and negative impact in the heading and maturity stages. Though elevated CO2 changed the maximum reflectance, it did not change the overall shape of the spectral curves of winter wheat at all the growing stages. The results were consistent with previous studies where the shapes of soybean canopy spectral curve did not change under different CO2 treatments (Gray et al., 2010) and O3 concentrations (Campbell et al., 2007).
Red edge position, sensitive band and vegetation index were effective means to retrieve crop chlorophyll content from the spectral curves (Dou et al., 2018; Kasim et al., 2018; Wang et al., 2019). Previous studies had shown that the position and reflectance of red edge were highly correlated with chlorophyll content of plant leaves and could be used as an indicator of chlorophyll content (Filella and Penuelas, 1994; Gitelson et al., 1996). The current study showed that the reflectance at the 680–740 nm wavelengths had a positive relationship with the content of chlorophyll under both ambient and elevated CO2.
Sensitive bands could be used to calculate spectral indexes, which were sensitive to the difference of chlorophyll concentration in plant canopy (Hunt et al., 2011). The current results showed that the sensitive bands at 740 and 749 nm wavelength correlated with the chlorophyll content most, under aCO2 and eCO2, respectively (Figures 4–6), even though the established model fit slightly better under aCO2 than at eCO2 conditions. Vegetation indexes calculated from hyperspectral remote sensing technology had long been used to monitor the chlorophyll content of vegetation leaves (Meng et al., 2012; Guo et al., 2020). Among the five tested vegetation indexes, the DVI based model simulated the chlorophyll content best under both aCO2 and eCO2 conditions and the model using overall data from both the CO2 treatments gave similar results (results not shown). Though the methods tested in the study proved effective to simulate winter wheat chlorophyll content under different CO2 conditions, further investigations on how the spectral reflectance correlates with other biochemical contents and biophysical processes are still urgently needed for the purpose of guiding crop management and monitoring crop growth status in the future climate change situations.
In conclusion, the hyperspectral estimation models based on the red edge position, sensitive band and DVI vegetation index could all simulate the chlorophyll content of winter wheat. The accuracy of vegetation index and sensitive bands based models was higher than that of the red edge position model. The results suggested that the hyperspectral measurement can be effectively used to estimate the chlorophyll content under both aCO2 and eCO2 conditions and different equations should be established at specific CO2 growing conditions based on the methods chosen. The findings in the study were useful in providing hyperspectral methods to monitor the growth status of winter wheat in the future global change situations.
The raw data supporting the conclusions of this article will be made available by the authors, without undue reservation.
DW designed and came up with the idea of the experiment. YC conducted the experiment, analyzed data, and wrote the manuscript. YM and HW helped in the field experiment and provided critical feedbacks on the manuscript. All authors contributed to the article and approved the submitted version.
This research was supported by the Nanjing University of Information Science and Technology (2013r115), Jiangsu Distinguished Professor Scholarship, Jiangsu six talent peaks (R2016L15), the Jiangsu Natural Science Foundation (BK20150894) and the National Natural Science Foundation of China (31500503 and 31770485) through DW.
The authors declare that the research was conducted in the absence of any commercial or financial relationships that could be construed as a potential conflict of interest.
Wenhui Tao and Rui Kong help setting up and manage the experiment site.
Ainsworth, E. A., Serbin, S. P., Skoneczka, J. A., and Townsend, P. A. (2014). Using leaf optical properties to detect ozone effects on foliar biochemistry. Photosynth. Res. 119, 65–76. doi: 10.1007/s11120-013-9837-y
Bannari, A., Khurshid, K. S., Staenz, K., and Schwarz, J. W. (2007). A comparison of hyperspectral chlorophyll indices for wheat crop chlorophyll content estimation using laboratory reflectance measurements. IEEE Trans. Geosci. Remote Sens. 45, 3063–3074. doi: 10.1109/TGRS.2007.897429
Campbell, P. K. E., Middleton, E. M., Mcmurtrey, J. E., Crop, L. A., and Chappelle, E. W. (2007). Assessment of vegetation stress using reflectance or fluorescence measurements. J. Environ. Qual. 36, 832–845. doi: 10.2134/jeq2005.0396
Card, D. H., Peterson, D. L., Matson, P. A., and Aber, J. D. (1988). Prediction of leaf chemistry by the use of visible and near infrared reflectance spectroscopy. Remote Sens. Environ. 26, 123–147. doi: 10.1016/0034-4257(88)90092-2
Chen, B., Han, H. Y., Wang, F. Y., Liu, Z., and Xiao, C. H. (2013). Monitoring chlorophyll and nitrogen contents in cotton leaf infected by verticillium wilt with spectra red edge parameters. Acta Agron. Sin. 39:319. doi: 10.3724/SP.J.1006.2013.00319
Choi, D., Watanabe, Y., Guy, R. D., Sugai, T., Toda, H., and Koike, T. (2017). Photosynthetic characteristics and nitrogen allocation in the black locust (Robinia pseudoacacia L.) grown in a FACE system. Acta Physiol. Plant. 39:71. doi: 10.1007/s11738-017-2366-0
Clevers, J. G. P. W., and Gitelson, A. A. (2013). Remote estimation of crop and grass chlorophyll and nitrogen content using red-edge bands on sentinel-2 and -3. Int. J. Appl. Earth Observ. Geoinform. 23, 344–351. doi: 10.1016/j.jag.2012.10.008
Costa, C., Dwyer, L. M., Dutilleul, P., Stewart, D. W., Ma, B. L., and Smith, D. L. (2001). Inter-relationships of applied nitrogen, spad, and yield of leafy and non-leafy maize genotypes. J. Plant Nutr. 24, 1173–1194. doi: 10.1081/PLN-100106974
Curtis, T., and Halford, N. G. (2014). Food security: the challenge of increasing wheat yield and the importance of not compromising food safety. Ann. Appl. Biol. 164, 354–372. doi: 10.1111/aab.12108
Dou, Z. G., Cui, L. J., Li, J., Zhu, Y. N., Gao, C. J., and Pan, X. (2018). Hyperspectral estimation of the chlorophyll content in short-term and long-term restorations of mangrove in Quanzhou bay estuary, China. Sustainability 10:1127. doi: 10.3390/su10041127
Dubey, S. K., Tripathi, S. K., and Pranuthi, G. (2015). Effect of elevated CO2 on wheat crop: mechanism and impact. Crit. Rev. Environ. Sci. Technol. 45, 2283–2304. doi: 10.1080/10643389.2014.1000749
Fathurrahman, F., Nizam, M. S., Juliana, W. A. W., Doni, F., and Radziah, C. M. Z. C. (2016). Growth improvement of rain tree (Albizia saman Jacq. Merr) seedlings under elevated concentration of carbon dioxide (CO2). J. Pure Appl. Microbiol. 10, 1911–1917.
Filella, I., and Penuelas, J. (1994). The red edge position and shape as indicators of plant chlorophyll content, biomass and hydric status. Int. J. Remote Sens. 15, 1459–1470. doi: 10.1080/01431169408954177
Flores-De-Santiago, F., Kovacs, J. M., and Flores-Verdugo, F. (2013). The influence of seasonality in estimating mangrove leaf chlorophyll-a content from hyperspectral data. Wetl. Ecol. Manag. 21, 193–207. doi: 10.1007/s11273-013-9290-x
Gitelson, A. A., Merzlyak, M. N., and Lichtenthaler, H. K. (1996). Detection of red edge position and chlorophyll content by reflectance measurements near 700 nm. J. Plant Physiol. 148, 501–508. doi: 10.1016/S0176-1617(96)80285-9
Gray, S. B., Dermody, O., and Delucia, E. H. (2010). Spectral reflectance from a soybean canopy exposed to elevated CO2 and O3. J. Exp. Bot. 61, 4413–4422. doi: 10.1093/jxb/erq244
Guo, Y. H., Wang, H. X., Wu, Z. F., Wang, S. X., Sun, H. Y., and Senthilnath, J. (2020). Modified red blue vegetation index for chlorophyll estimation and yield prediction of maize from visible images captured by UAV. Sensors 20:5055. doi: 10.3390/s20185055
Hansen, P. M., and Schjoerring, J. K. (2003). Reflectance measurement of canopy biomass and nitrogen status in wheat crops using normalized difference vegetation indices and partial least squares regression. Remote Sens. Environ. 86, 542–553. doi: 10.1016/S0034-4257(03)00131-7
He, R. Y., Li, H., Qiao, X. J., and Jiang, J. B. (2018). Using wavelet analysis of hyperspectral remote-sensing data to estimate canopy chlorophyll content of winter wheat under stripe rust stress. Int. J. Remote Sens. 39, 4059–4076. doi: 10.1080/01431161.2018.1454620
Huete, A. R., Jackson, R. D., and Post, D. F. (1985). Spectral response of a plant canopy with different soil backgrounds. Remote Sens. Environ. 17, 37–53. doi: 10.1016/0034-4257(85)90111-7
Hunt, E. R., Daughtry, C., Eitel, J., and Long, D. (2011). Remote sensing leaf chlorophyll content using a visible band index. Agron. J. 103:1090. doi: 10.2134/agronj2010.0395
IPCC (2013). Climate Change 2013: The Physical Science Basis. Contribution of Working Group I to the Fifth Assessment Report of the Intergovernmental Panel on Climate Change. Cambridge: Cambridge University Press.
Jordan, C. F. (1969). Derivation of leaf area index from quality of light on the forest floor. Ecology 50, 663–666. doi: 10.2307/1936256
Kasim, N., Sawut, R., Abliz, A., Shi, Q. D., Maihmuti, B., and Yalkun, A. (2018). Estimation of the relative chlorophyll content in spring wheat Based on an optimized spectral index. Photogramm. Eng. Remote Sens. 84, 801–811. doi: 10.14358/PERS.84.12.801
Leakey, A. D. B., Ainsworth, E. A., Bernacchi, C. J., Rogers, A., and Ort, D. R. (2009). Elevated CO2 effects on plant carbon, nitrogen, and water relations: six important lessons from FACE. J. Exp. Bot. 60, 2859–2876. doi: 10.1093/jxb/erp096
Li, X. C., Zhang, Y. J., Bao, Y. S., Luo, J. H., Jin, X. L., and Xu, X. G. (2014). Exploring the best hyperspectral features for LAI estimation using partial least squares regression. Remote Sens. 6, 6221–6241. doi: 10.3390/rs6076221
Liang, S., Zhao, G. X., and Zhu, X. C. (2012). Hyperspectral estimation models of chlorophyll content in apple leaves. Spectrosc. Spectr. Anal. 32, 1367–1370. doi: 10.3964/j.issn.1000-0593201205-1367-04
Long, S. P., Ainsworth, E. A., Leakey, A. D. B., Nösberger, J., and Ort, D. R. (2006). Food for thought: lower-than-expected crop yield stimulation with rising CO2 concentrations. Science 312, 1918–1921. doi: 10.1126/science.1114722
Long, S. P., Ainsworth, E. A., Rogers, A., and Ort, D. R. (2004). Rising atmospheric carbon dioxide: plants FACE the future. Annu. Rev. Plant Biol. 55, 591–628. doi: 10.1146/annurev.arplant.55.031903.141610
Lukas, V., Rodriguez-Moreno, F., Dryslova, T., and Neudert, L. (2014). Effectiveness of chlorophyll meter measurement in winter wheat at field scale level. Agriculture 60, 41–49. doi: 10.2478/agri-2014-0005
Madhana, S. K., Rachapudi, V. S., Mudalkar, S., and Reddy, A. R. (2014). Persistent stimulation of photosynthesis in short rotation coppice mulberry under elevated CO2 atmosphere. J. Photochem. Photobiol. B Biol. 137, 21–30. doi: 10.1016/j.jphotobiol.2014.05.001
Meng, Q. Y., Dong, H., Qin, Q. M., Wang, J. L., and Zhao, J. H. (2012). MTCARI: a kind of vegetation index monitoring vegetation leaf chlorophyll content based on hyperspectral remote sensing. Spectrosc. Spectr. Anal. 32, 2218–2222. doi: 10.3964/j.issn.1000-0593201208-2218-05
Ommen, O. E., Donnelly, A., Vanhoutvin, S., Vanoijen, M., and Manderscheid, R. (1999). Chlorophyll content of spring wheat flag leaves grown under elevated CO2 concentration and other environmental stresses within the ESPACE-wheat project. Eur. J. Agron. 10, 197–203. doi: 10.1016/s1161-0301(99)00011-8
Richardson, A. J., and Wiegand, C. L. (1977). Distinguishing vegetation from soil background information. Photogramm. Eng. Remote Sens. 43, 1541–1552. doi: 10.1109/TGE.1977.294499
Rondeaux, G., Steven, M., and Baret, F. (1996). Optimization of soil-adjusted vegetation indices. Remote Sens. Environ. 55, 95–107. doi: 10.1016/0034-4257(95)00186-7
Rouse, J. W., Haas, R. H., Schell, J. A., and Deering, D. W. (1973). “Monitoring vegetation systems in the great plains with ERTS,” in Proceedings of the 3rd ERTS Symposium, NASA SP-351 (Washington, D.C: NASA Special Publication), 309–317.
Serbin, S. P., Dillaway, D. N., Kruger, E. L., and Townsend, P. A. (2012). Leaf optical properties reflect variation in photosynthetic metabolism and its sensitivity to temperature. J. Exp. Bot. 63, 489–502. doi: 10.1093/jxb/err294
Stratoulias, D., Balzter, H., Zlinszky, A., and Tóth, V. (2015). Assessment ofecophysiology of lake shore reed vegetation based on chlorophyll fluorescence, field spectroscopy and hyperspectral airborne imagery. Remote Sens. Environ. 157, 72–84. doi: 10.1016/j.rse.2014.05.021
Uddling, J., Gelang-Alfredsson, J., Piikki, K., and Pleijel, H. (2007). Evaluating the relationship between leaf chlorophyll concentration and SPAD-502 chlorophyll meter readings. Photosynth. Res. 91, 37–46. doi: 10.1007/s11120-006-9077-5
Wang, D., Heckathorn, S. A., Wang, X. Z., and Philpott, S. M. (2012). A meta-analysis of plant physiological and growth responses to temperature and elevated CO2. Oecologia 169, 1–13. doi: 10.1007/s00442-011-2172-0
Wang, L., Feng, Z. Z., and Schjoerring, J. K. (2013). Effects of elevated atmospheric CO2 on physiology and yield of wheat (Triticum aestivum L.): A meta-analytic test of current hypotheses. Agric. Ecosyst. Environ. 178, 57–63. doi: 10.1016/j.agee.2013.06.013
Wang, Y. M., Zhao, S. H., Cai, W. T., Heo, J., and Peng, F. C. (2019). A sensitive band to optimize winter wheat crop residue cover estimation by eliminating moisture effect. Sustainability 11, 1–18. doi: 10.3390/su11113032
Yan, F., Wu, B., and Wang, Y. J. (2013). Estimating aboveground biomass in Mu Us Sandy Land using Landsat spectral derived vegetation indices over the past 30 years. J. Arid Land 5, 521–530. doi: 10.1007/s40333-013-0180-0
Zhang, X. C., Yu, X. F., and Ma, Y. F. (2013). Effect of nitrogen application and elevated CO2 on photosynthetic gas exchange and electron transport in wheat leaves. Photosynthetica 51, 593–602. doi: 10.1007/s11099-013-0059-5
Keywords: elevated CO2, hyperspectral estimation model, chlorophyll content, red edge position, sensitive band, spectral index, winter wheat
Citation: Cai Y, Miao Y, Wu H and Wang D (2021) Hyperspectral Estimation Models of Winter Wheat Chlorophyll Content Under Elevated CO2. Front. Plant Sci. 12:642917. doi: 10.3389/fpls.2021.642917
Received: 22 December 2020; Accepted: 04 March 2021;
Published: 25 March 2021.
Edited by:
Penghao Wang, Murdoch University, AustraliaReviewed by:
Lingyan Zhou, East China Normal University, ChinaCopyright © 2021 Cai, Miao, Wu and Wang. This is an open-access article distributed under the terms of the Creative Commons Attribution License (CC BY). The use, distribution or reproduction in other forums is permitted, provided the original author(s) and the copyright owner(s) are credited and that the original publication in this journal is cited, in accordance with accepted academic practice. No use, distribution or reproduction is permitted which does not comply with these terms.
*Correspondence: Dan Wang, d2FuZ2RhbkBudWlzdC5lZHUuY24=
Disclaimer: All claims expressed in this article are solely those of the authors and do not necessarily represent those of their affiliated organizations, or those of the publisher, the editors and the reviewers. Any product that may be evaluated in this article or claim that may be made by its manufacturer is not guaranteed or endorsed by the publisher.
Research integrity at Frontiers

Learn more about the work of our research integrity team to safeguard the quality of each article we publish.