 Elizabeth A. Chapman
 Simon Orford1
 Simon Griffiths
94% of researchers rate our articles as excellent or good
Learn more about the work of our research integrity team to safeguard the quality of each article we publish.
Find out more
METHODS article
Front. Plant Sci. , 16 April 2021
Sec. Plant Breeding
Volume 12 - 2021 | https://doi.org/10.3389/fpls.2021.638738
Senescence is a highly quantitative trait, but in wheat the genetics underpinning senescence regulation remain relatively unknown. To select senescence variation and ultimately identify novel genetic regulators, accurate characterization of senescence phenotypes is essential. When investigating senescence, phenotyping efforts often focus on, or are limited to, the visual assessment of flag leaves. However, senescence is a whole-plant process, involving remobilization and translocation of resources into the developing grain. Furthermore, the temporal progression of senescence poses challenges regarding trait quantification and description, whereupon the different models and approaches applied result in varying definitions of apparently similar metrics. To gain a holistic understanding of senescence, we phenotyped flag leaf and peduncle senescence progression, alongside grain maturation. Reviewing the literature, we identified techniques commonly applied in quantification of senescence variation and developed simple methods to calculate descriptive and discriminatory metrics. To capture senescence dynamism, we developed the idea of calculating thermal time to different flag leaf senescence scores, for which between-year Spearman’s rank correlations of r ≥ 0.59, P < 4.7 × 10⁻⁵ (TT70), identify as an accurate phenotyping method. Following our experience of senescence trait genetic mapping, we recognized the need for singular metrics capable of discriminating senescence variation, identifying thermal time to flag leaf senescence score of 70 (TT70) and mean peduncle senescence (MeanPed) scores as most informative. Moreover, grain maturity assessments confirmed a previous association between our staygreen traits and grain fill extension, illustrating trait functionality. Here we review different senescence phenotyping approaches and share our experiences of phenotyping two independent recombinant inbred line (RIL) populations segregating for staygreen traits. Together, we direct readers toward senescence phenotyping methods we found most effective, encouraging their use when investigating and discriminating senescence variation of differing genetic bases, and aid trait selection and weighting in breeding and research programs alike.
Monocarpic senescence is the final stage in wheat development, during which 80% of leaf nitrogen and phosphorus are re-assimilated into the developing grain (Buchanan-Wollaston, 2007). Senescence is subject to strong environmental and genetic regulation, and prior to visual yellowing and chlorosis up to 50% of leaf chlorophyll may be lost (Buchanan-Wollaston et al., 2005; Borrill et al., 2019). Despite this, senescence progression is typically monitored through recording changes in leaf greenness or chlorophyll content over time, either at the individual flag leaf or canopy level (Figure 1 and Table 1; Pask et al., 2012; Shrestha et al., 2012). With reference to Wheat Initiative and CIMMYT crop ontology (Shrestha et al., 2012), “Flag Leaf Senescence” (CO_321:0000194) is commonly assessed using a scale from 0 (0% senescence) to 10 (100% senescence) (CO_321:0000382; Pask et al., 2012). Alternatively, Normalized Differential Vegetation Index (NDVI; CO_321:0000301) or Green NDVI (GNVDI; CO_321:0000961) can be measured using spectral reflectance, where the change in canopy greenness or photosynthetic size provides a more objective measure of senescence (Table 1).
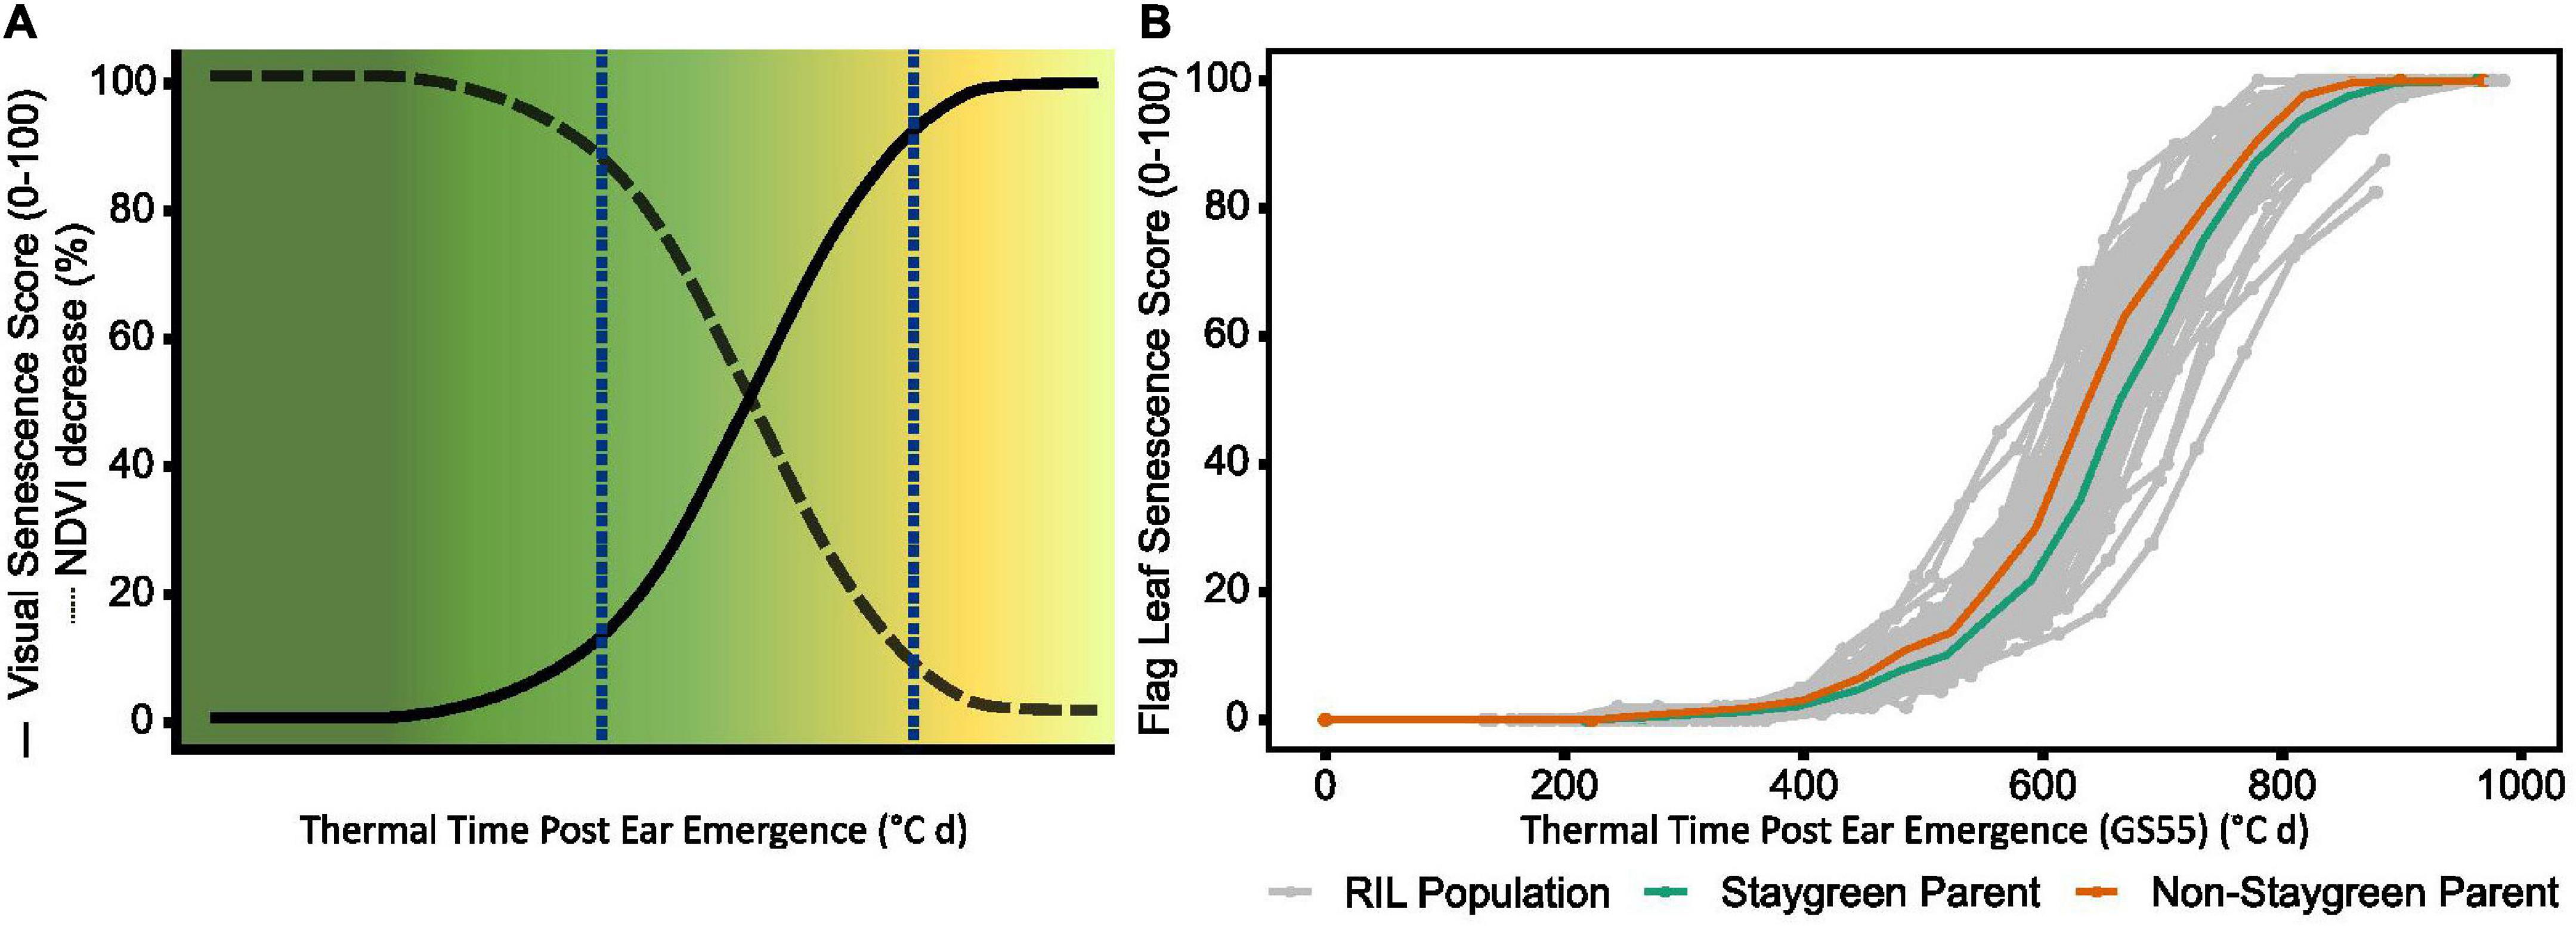
Figure 1. During the rapid senescence phase flag leaves transition from green to yellow (A), with inter-line variation sometimes difficult to distinguish (B). Senescence is scored on a 0–100 scale based in progression of leaf yellowing (visual) or greenness reduction (NDVI-based). Scores are plotted against thermal time post-anthesis (°C day) to standardize for heading date variation. (B) Senescence variation recorded for a segregating RIL population (gray, n = 75), staygreen parent (green), non-staygreen parent (orange) (B); mean visual senescence score (n ≥ 2), Church Farm, Bawburgh, Norwich, 2018.
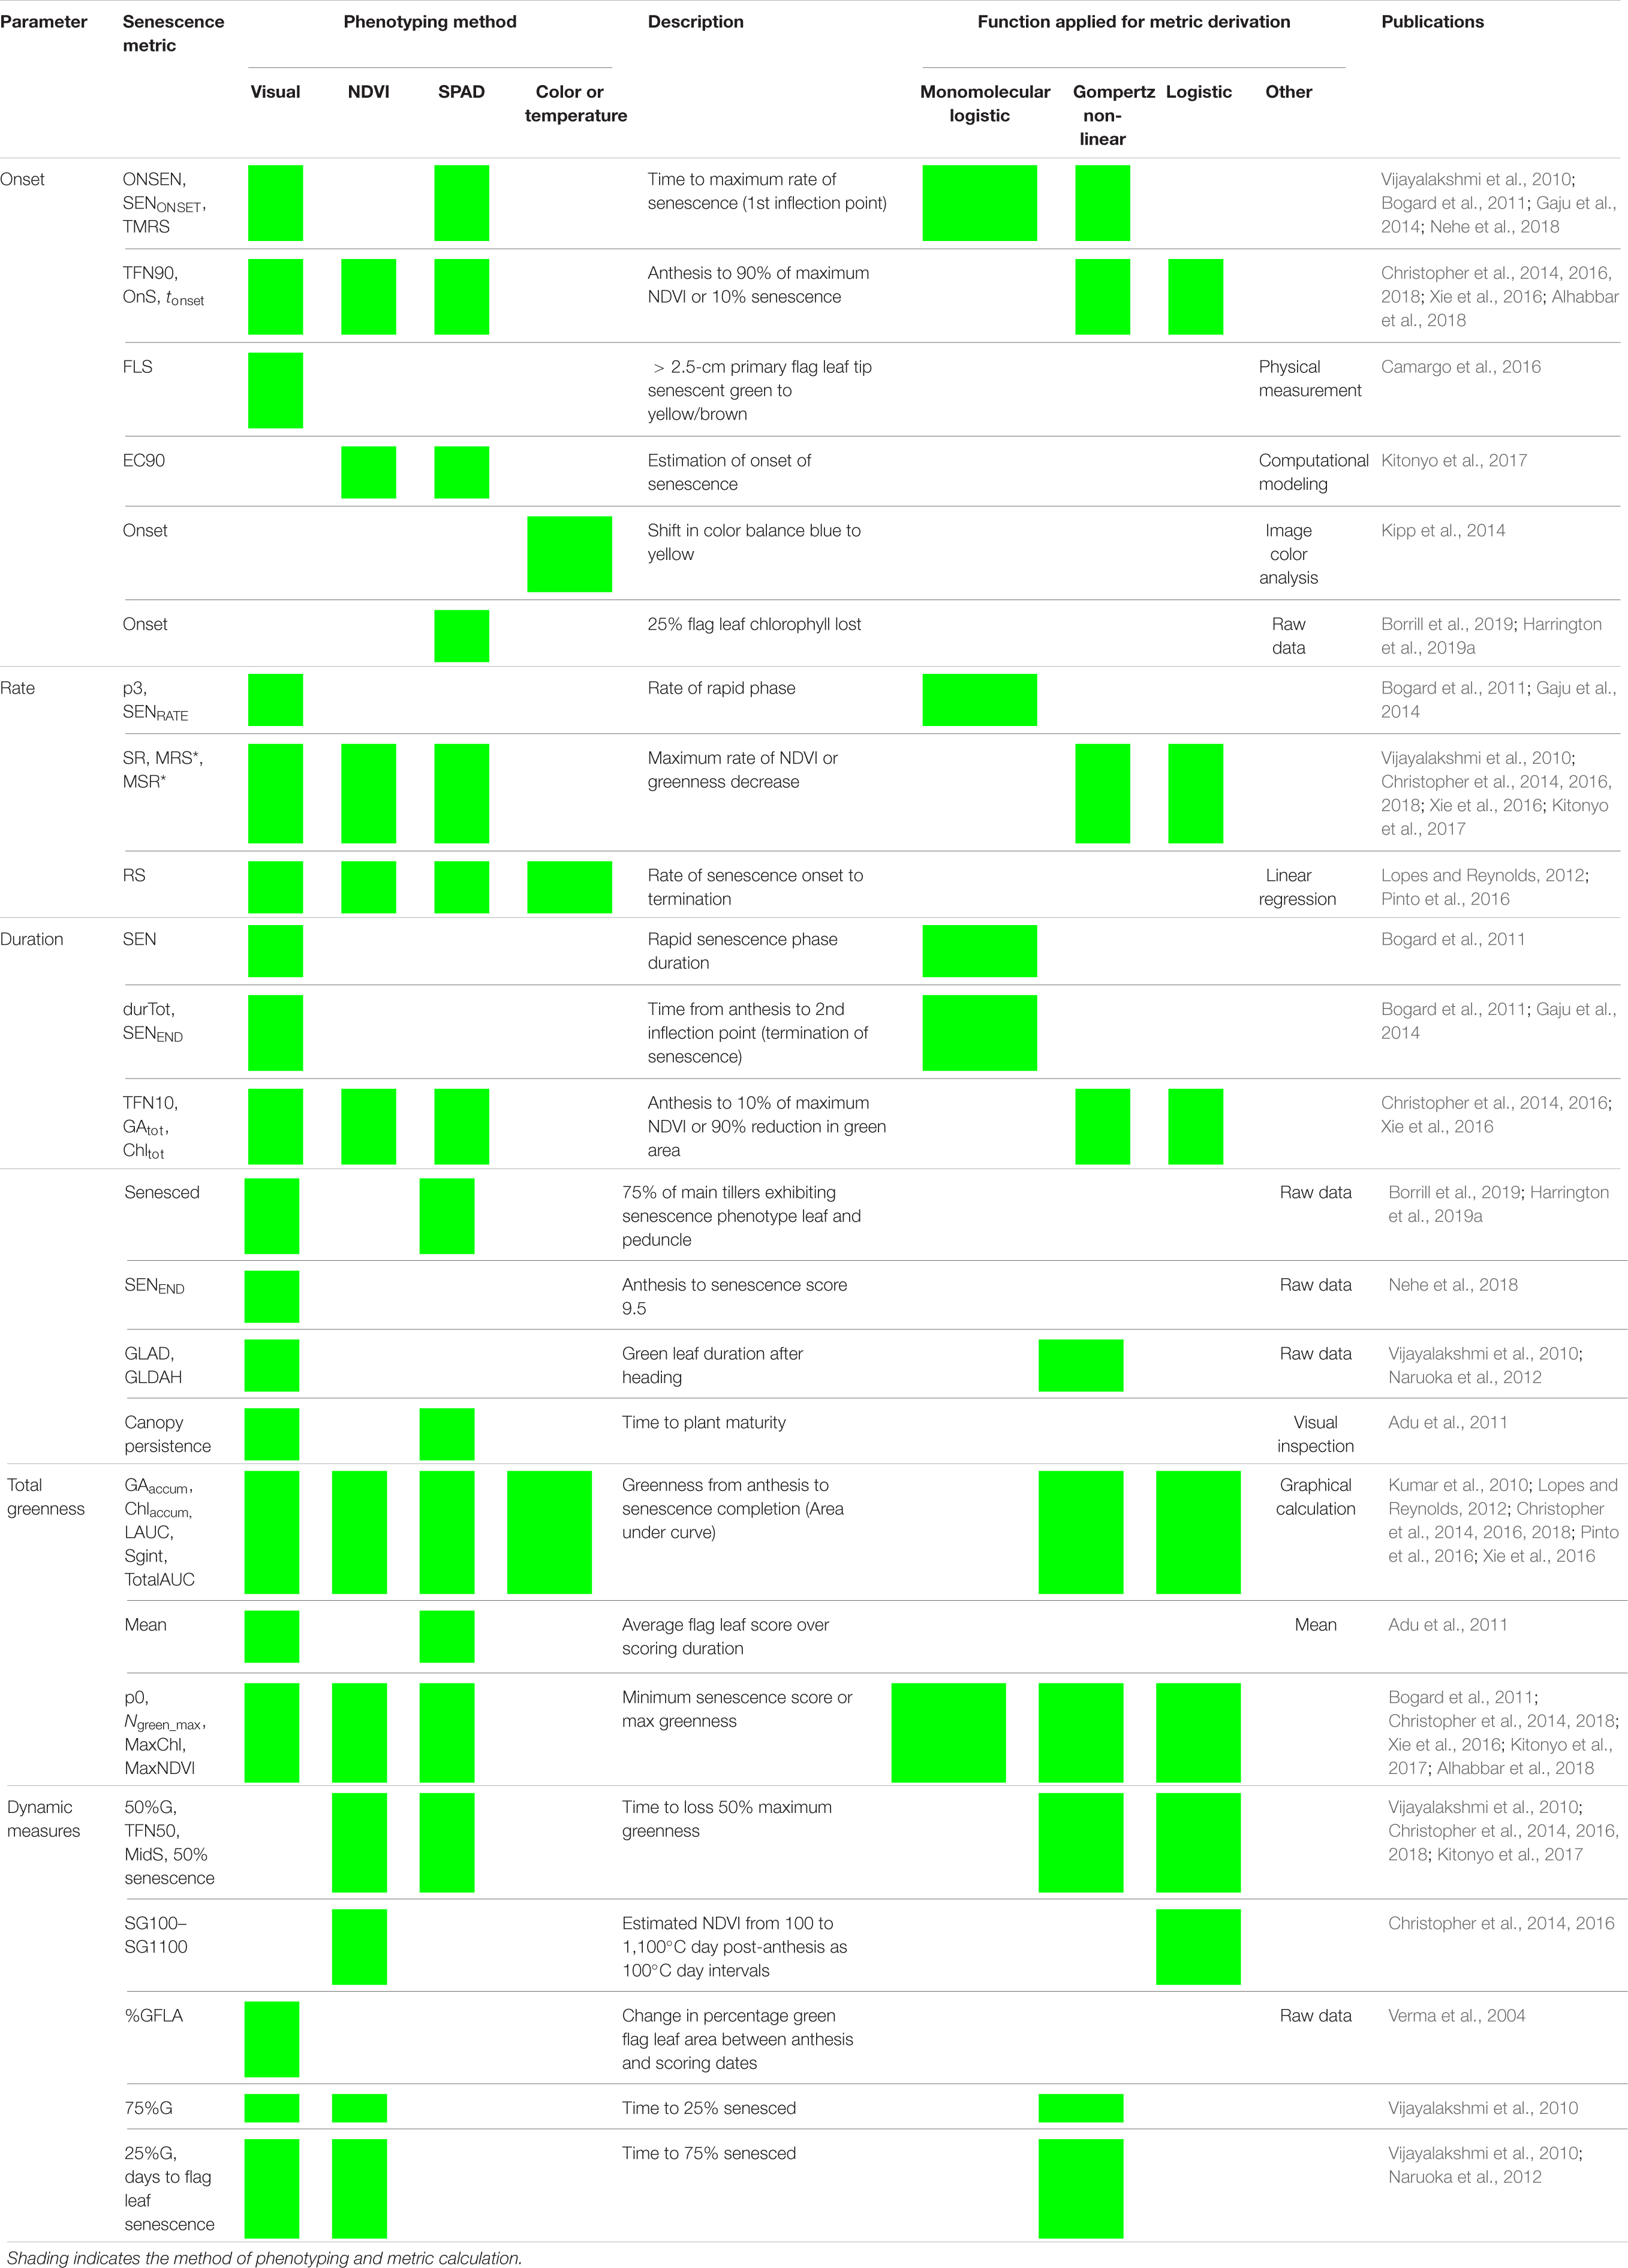
Table 1. Reviewing methods used to score, quantify, and describe leaf senescence progression. Senescence phenotyping concerns monitoring changes in greenness over time for which multiple methods can be used. To characterize, compare, and quantify senescence phenotypes, time course senescence data can be transformed into a series of parameters (Figure 2) using a variety of approaches.
Crop ontology defines the “staygreen” trait (CO_321:0000059) as the “ability of the plant to remain/maintain green leaves, stems, and spikes at the time of senescing” (Shrestha et al., 2012). However, only functional staygreen phenotypes are considered useful due to their association with prolonged or enhanced photosynthetic activity, compared to cosmetic types in which chlorophyll catabolism is impaired (Gregersen et al., 2013; Thomas and Ougham, 2014). Unfortunately, senescence phenotyping efforts often concentrate on recording changes in leaf, or canopy, color and not the accompanying developmental and physiological changes, potentially favoring identification of cosmetic staygreens as opposed to useful types.
A direct correlation between green canopy and grain fill duration is frequently assumed, which experiments by Wiegand and Cuellar (1981) and Gelang et al. (2000) confirm. However, when studying senescence this relationship is rarely explicitly tested, although Pinto et al. (2016) report significant correlations between residual greenness at maturity, determined using NDVI, with grain fill duration, r = −0.35 to 0.58, P < 0.0001. Loss of glume color and peduncle ripening are also associated with changes in grain development, coinciding with GS87, the timepoint at which dry grain weight is maximal (Pask et al., 2012). Ear photosynthesis contributes to between 40 and 80% of grain carbohydrate (Zhou et al., 2016), with ears supplying 1.87 times more nitrogen compared to flag leaves (Barraclough et al., 2014). Additionally, peduncle senescence has important implications regarding the delivery of flag leaf-derived photosynthates. Peduncles act as conduits and stores for transient starch and sugars, facilitating their remobilization into the grain, while carbohydrates within peduncle tissue help maintain hydraulic conductance (Raven and Griffiths, 2015). If peduncles senesce in advance of leaves then the photosynthates associated are unable to reach the grain. Together, this illustrates the need for spike and peduncle phenotyping, alongside recording of grain filling dynamics when studying senescence, for which Table 2 lists the methods adopted.
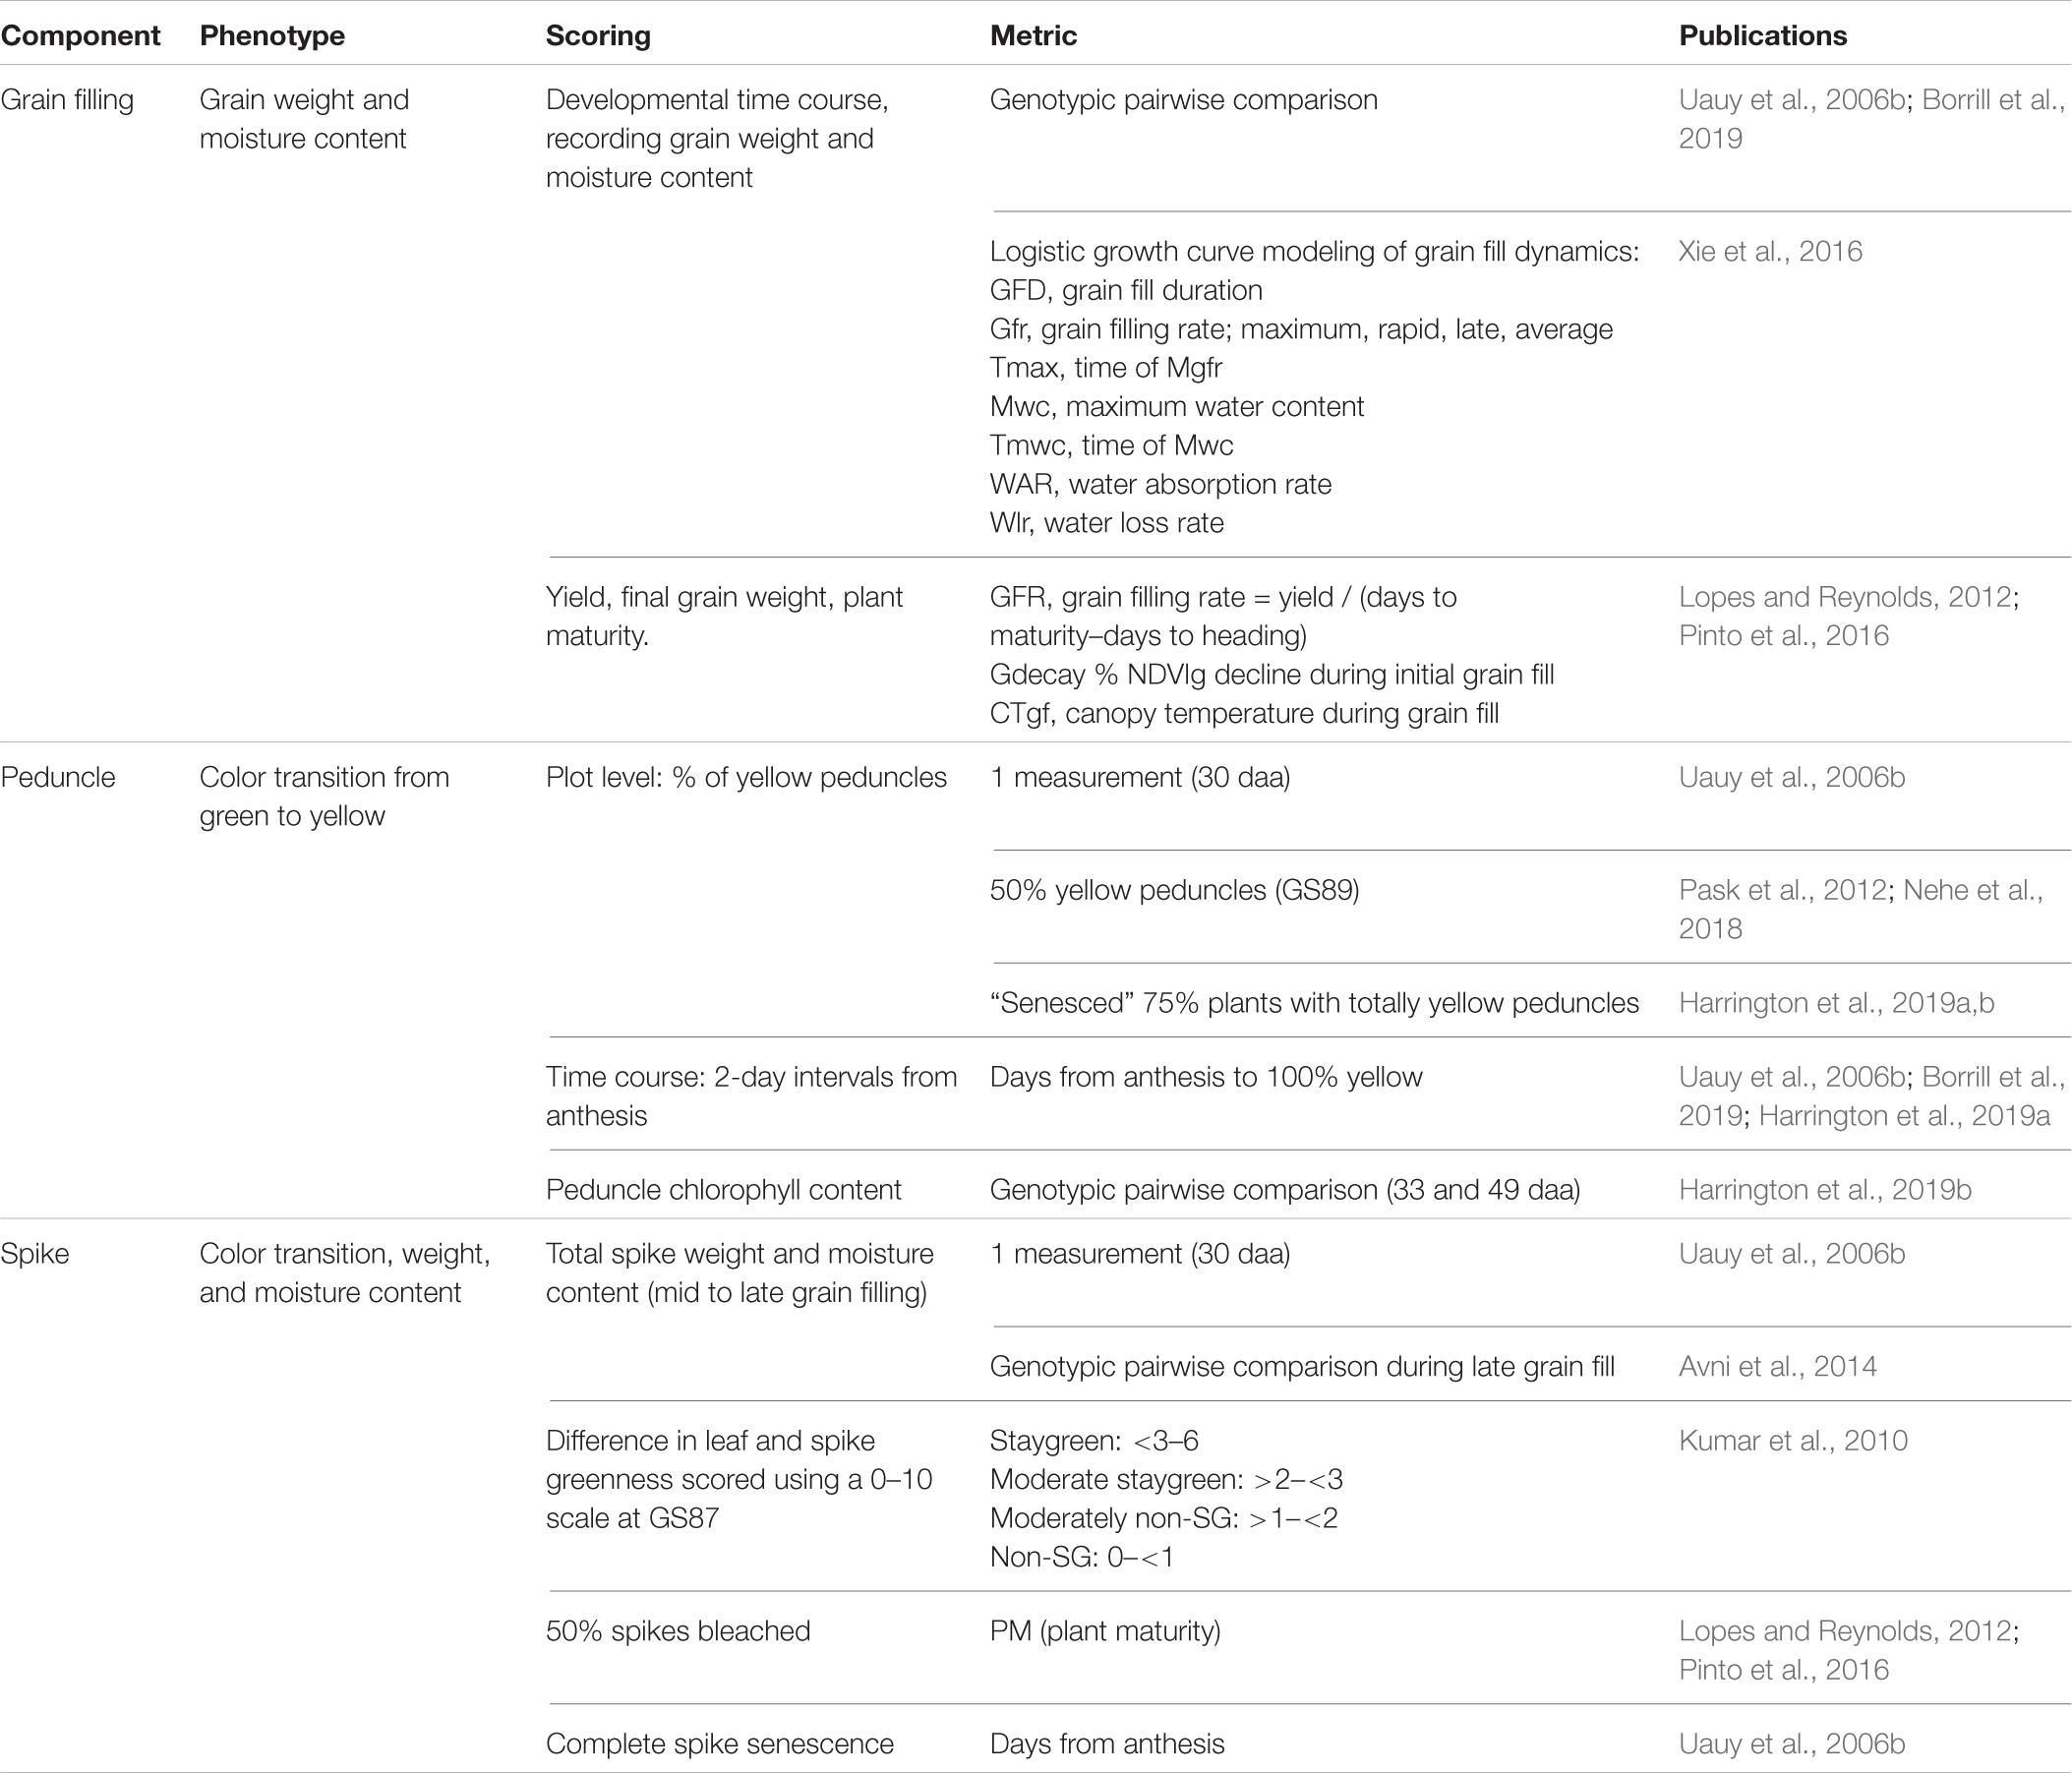
Table 2. Senescence scoring efforts should not be limited to leaves. Senescence is a whole-plant process involving remobilization of resources into grain, for which studying multiple organs has been used to aid our understanding.
Recently, staygreen traits have received renewed interest due to their potential ability to increase yield and stress tolerance (Gregersen et al., 2013; Jagadish et al., 2015). For example, multiple studies report the indirect selection of staygreen traits over the previous 50 years as helping sustain grain number improvement (Adu et al., 2011; Kitonyo et al., 2017; Voss-Fels et al., 2019). Modeling of wheat ideotypes using 2050 climate change predictions weights staygreen traits highly, estimating associated yield benefits of 28–37% and 10–23% for Spanish, and Central and Eastern European growing regions, respectively (Senapati et al., 2019). Under stress, Chapman et al. (2020) reported a positive relationship between delayed senescence and grain weight improvement of NAM-1 ethyl methane sulphonate (EMS) mutants, which could relate to elevated ABA levels enhancing carbon remobilization (Distelfeld et al., 2014). However, not all staygreen phenotypes are the same, with senescence dynamics a product of the differences in onset, rate or duration, or initial chlorophyll content (Figure 2). Xie et al. (2016) hypothesize that a delay in onset, coupled with a rapid rate, of senescence maximizes remobilization efficiency, reporting rapid grain fill rate and TGW as correlated, r = 0.63–0.77, P < 0.01. Conversely, Gelang et al. (2000) report senescence duration as the greatest contributing factor to grain fill, with traits highly associated, R2 = 0.989. In combination, elucidating the optimal combination of senescence dynamics under differing conditions is required to identify their associated target breeding environments and stimulate staygreen trait adoption.
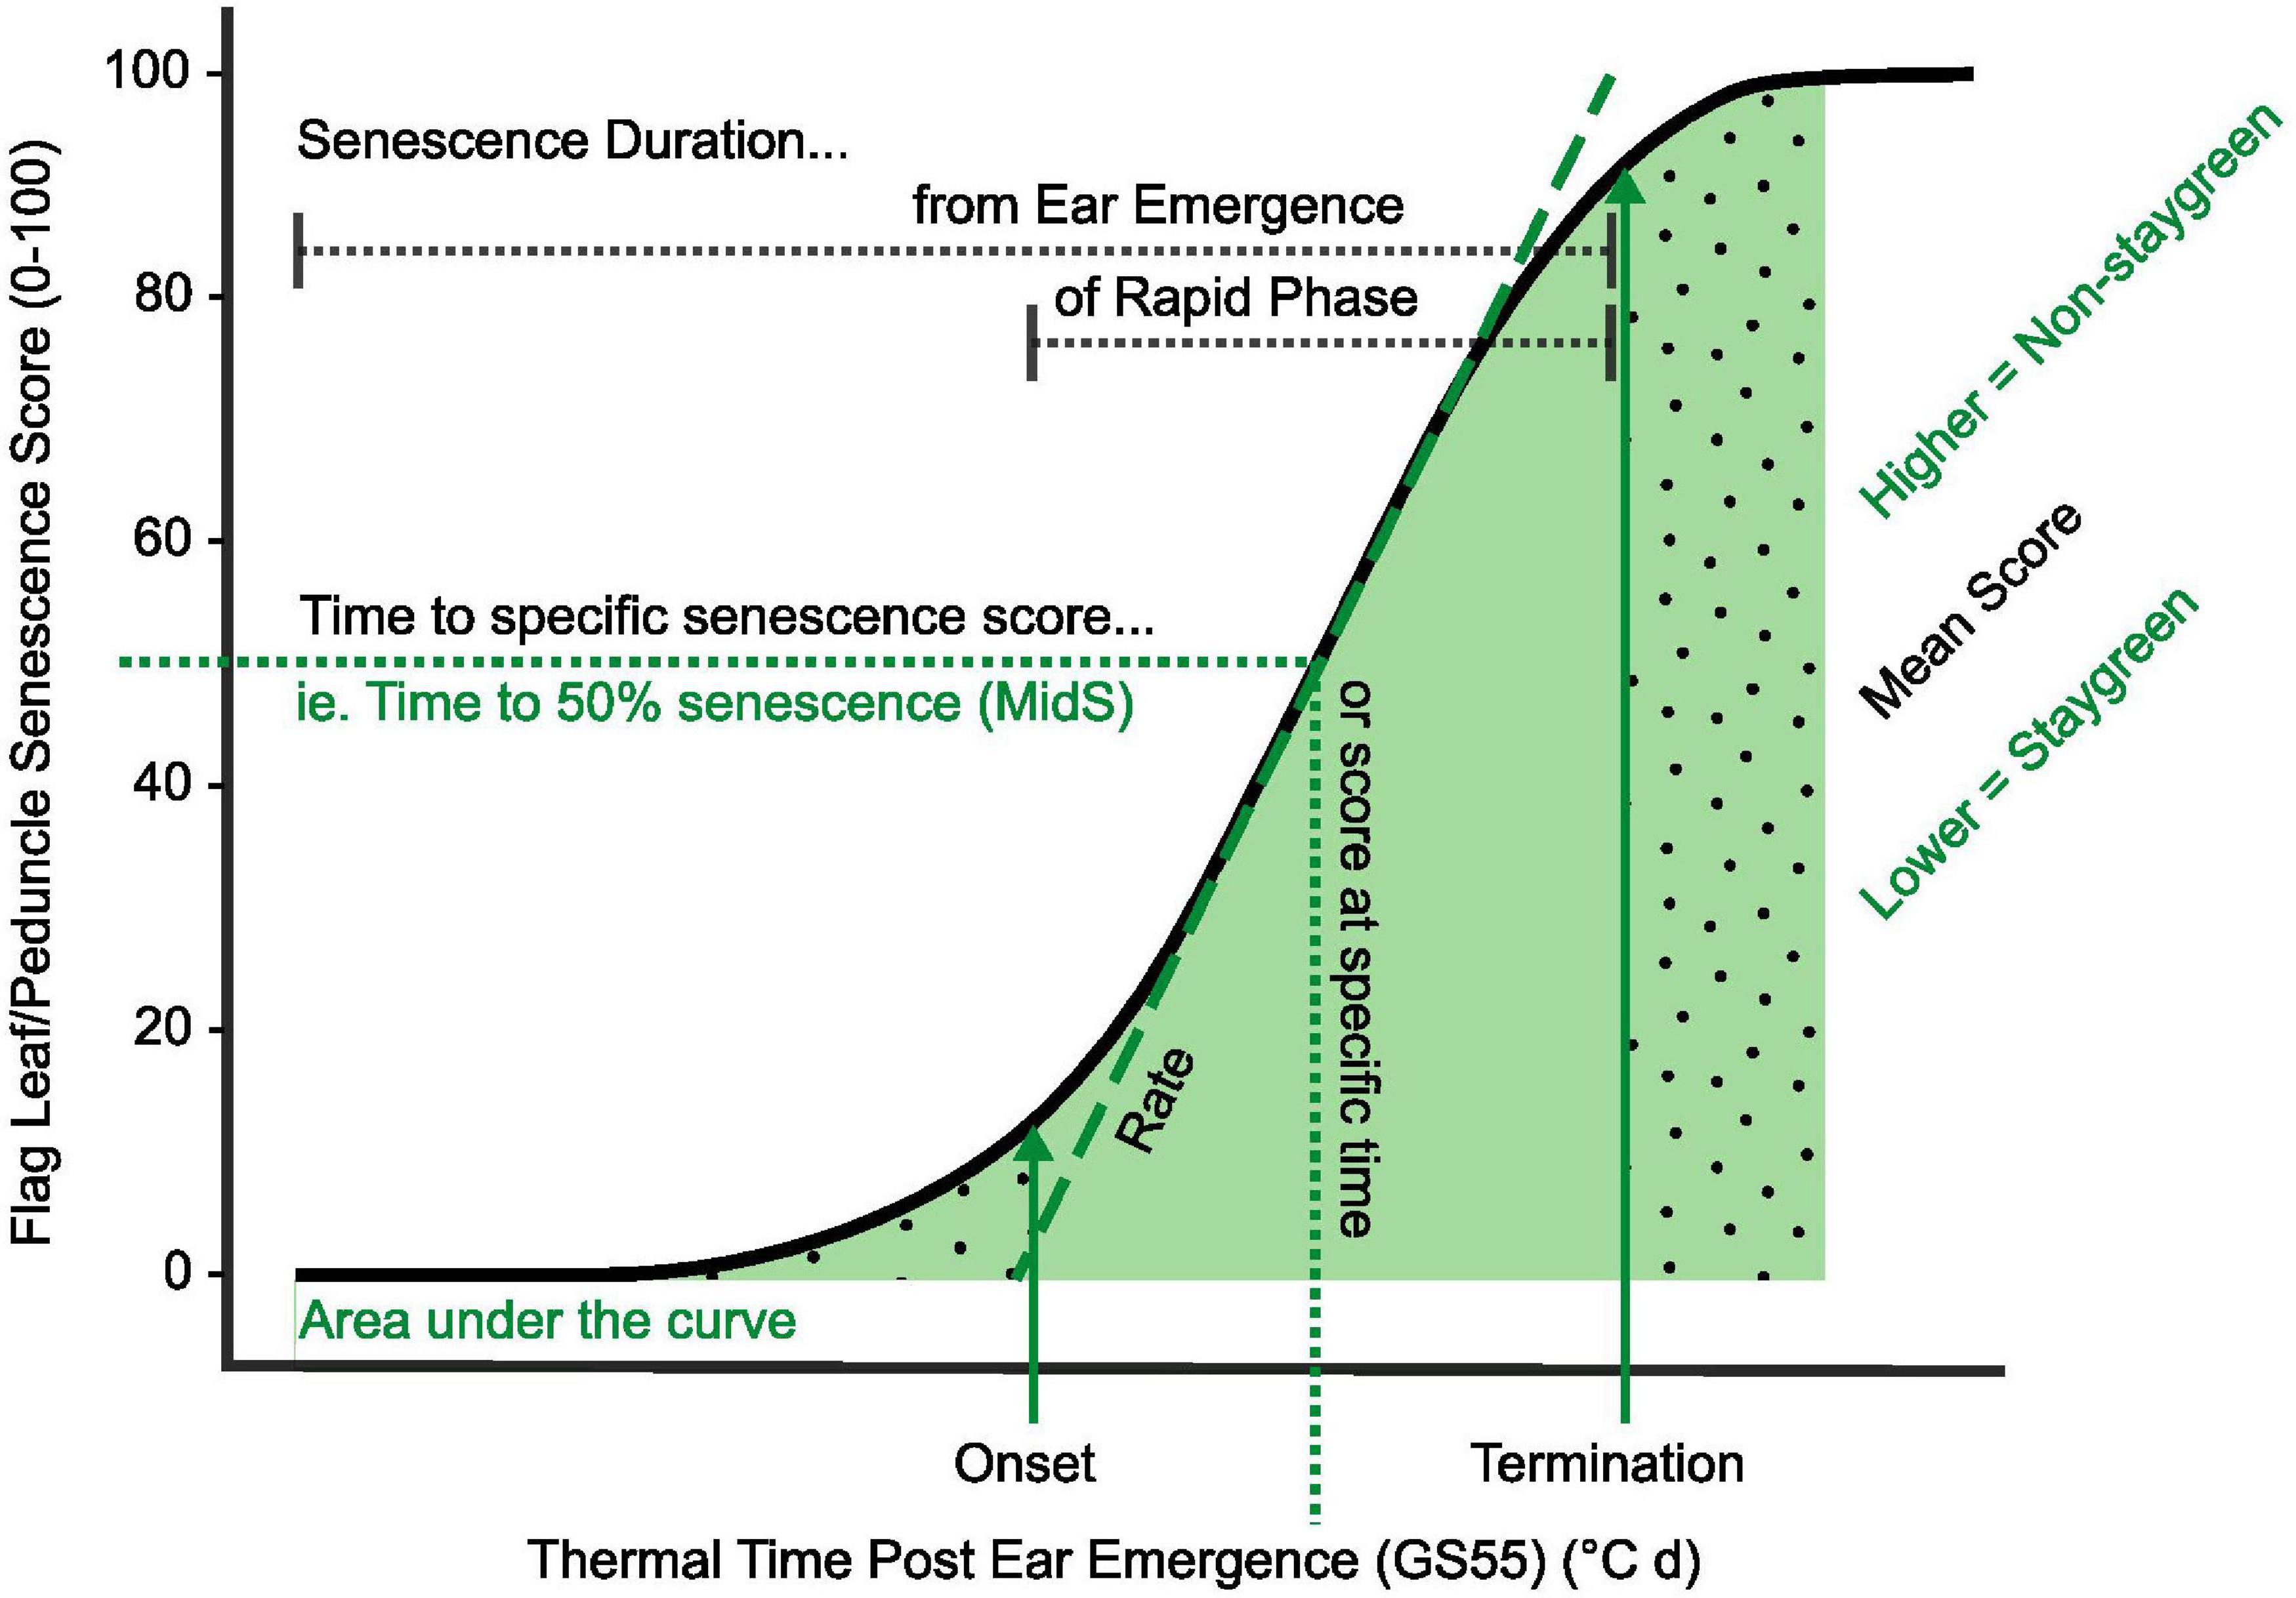
Figure 2. Key parameters used in quantification and characterization of senescence variation. Metrics relating to onset, rate, and duration of senescence, alongside total greenness (area under the curve) and dynamic measures (including MidS), can be calculated from time course data (Table 2). Onset of senescence marks the transition between the initial lag phase (dotted fill, right) and rapid phase of senescence (solid fill, center). As senescence nears completion, the senescence rate decreases, resulting in a final lag phase (dotted fill, left). To compare senescence progression of different lines, time to different senescence scores (MidS), an overall mean, or total greenness can be calculated.
For studies investigating a limited number of lines, plotting and visual comparison of senescence time course data may be sufficient to identify and characterize senescence variation. However, when assessing senescence of segregating recombinant inbred line (RIL) populations or a diversity set, visual discrimination of individual senescence profiles is challenging (Figure 1). Transformation of senescence curves into a series of well-defined metrics aids in the characterization of individual lines, allows senescence dynamics to be described, and permits the performance of quantitative analysis, including quantitative trait locus (QTL) mapping. Unfortunately, multiple studies apply their own methods to derive senescence metrics, leading to varying definitions of apparently similar terms (Table 1). In the absence of consistent senescence phenotyping approaches results from different studies cannot be directly compared, preventing the interpretation of significant genotypic and environmental variation (Verma et al., 2004; Pask et al., 2012; Christopher et al., 2014).
Recognizing the disparity in senescence phenotyping methods present in the literature, we reviewed, used, and developed a range of methods that successfully capture senescence variation observed among two segregating RIL populations. Although duration and onset of senescence are the metrics mostly used to describe senescence dynamics (Table 1), these can fail to capture process dynamism and source-to-sink relationships. Simultaneous scoring of flag leaf and peduncle senescence, alongside monitoring changes in grain development, improved our understanding of senescence processes at a whole-plant level. We also identified the need for singular metrics capable of discriminating between staygreen and non-staygreen types, preferably in the absence of time course phenotyping, to increase efficiency of in-field phenotyping and selection. Here we compile resources we referred to when scoring senescence under field conditions, and provide our own insights following successful mapping of NAM-1 homeologs, which are known senescence regulators (Chapman et al., 2020). Here we aim to equip researchers and breeders alike with appropriate knowledge to guide future phenotyping strategies, support trait genetic mapping and selection, and help inform weighting of senescence traits in breeding, genomic selection, or other applications.
Phenotypic data relates to two Triticum aestivum cv. Paragon EMS staygreen mutants and associated RIL populations. “Staygreen A” and “Staygreen B” refers to mutant lines 1189a and 2316b, identified as encoding missense mutations in known senescence regulators NAM-A1 (T159I) and NAM-D1 (G151), respectively (Chapman et al., 2020). “Non-staygreen” refers to the parental T. aestivum cv. Paragon, and Staygreen A and B were selected based on their differential staygreen phenotypes, agronomic potential, and similarity in heading date. To develop segregating RIL populations, mutants were crossed to cv. Paragon and F4 populations developed through SSD, n ≥ 85.
Phenotyping of F4 RIL populations was conducted under field conditions between 2016 and 2018. Experiments were performed at Church Farm, Bawburgh, Norwich (52°38′ N, 1°10′ E), JIC, as described previously (Chapman et al., 2020). In brief, 36 to ≥ 75 RILs were sown per population per year as unreplicated 1 m2 plots (2016) or replicated 6 m2 plots (n = 3, 2017; n = 2, 2018). Seeds were sown on 26/10/2016, 26/10/2017, and 12/10/2018 at a rate of 250–300 seeds m–2. Replicated experiments followed a randomized complete block design, with control plots of cv. Paragon, Soissons, 1189a, and 2316b mutant lines randomly sown throughout. Seed used for experiments was produced during the multiplication of RIL populations in 2015 or resulted from the previous year. Soil at Church Farm is described as sandy loam overlying alluvial clay. Supplemental irrigation was applied in 2017; otherwise, trials were naturally rainfed. Fertilizer was applied over three occasions from late February to the end of April, totalling 214 kg N ha–1 and 62 kg SO3 ha–1 in 2017 and 228.5 kg N ha–1 and 62 kg SO3 ha1 in 2018. The plots received standard fungicide and herbicide treatment. Rainfall and temperature data corresponding to each field season are supplied in Supplementary Figure 1.
Ear emergence (GS55) was recorded as the point when 50% of ears emerged halfway from the flag leaf across the plot (Zadoks et al., 1974). Visual scoring of flag leaf and peduncle senescence was conducted at the same time using a 0–100 scale (intervals of 5) (Figure 3) every 2–3 days from ear emergence until maturity.
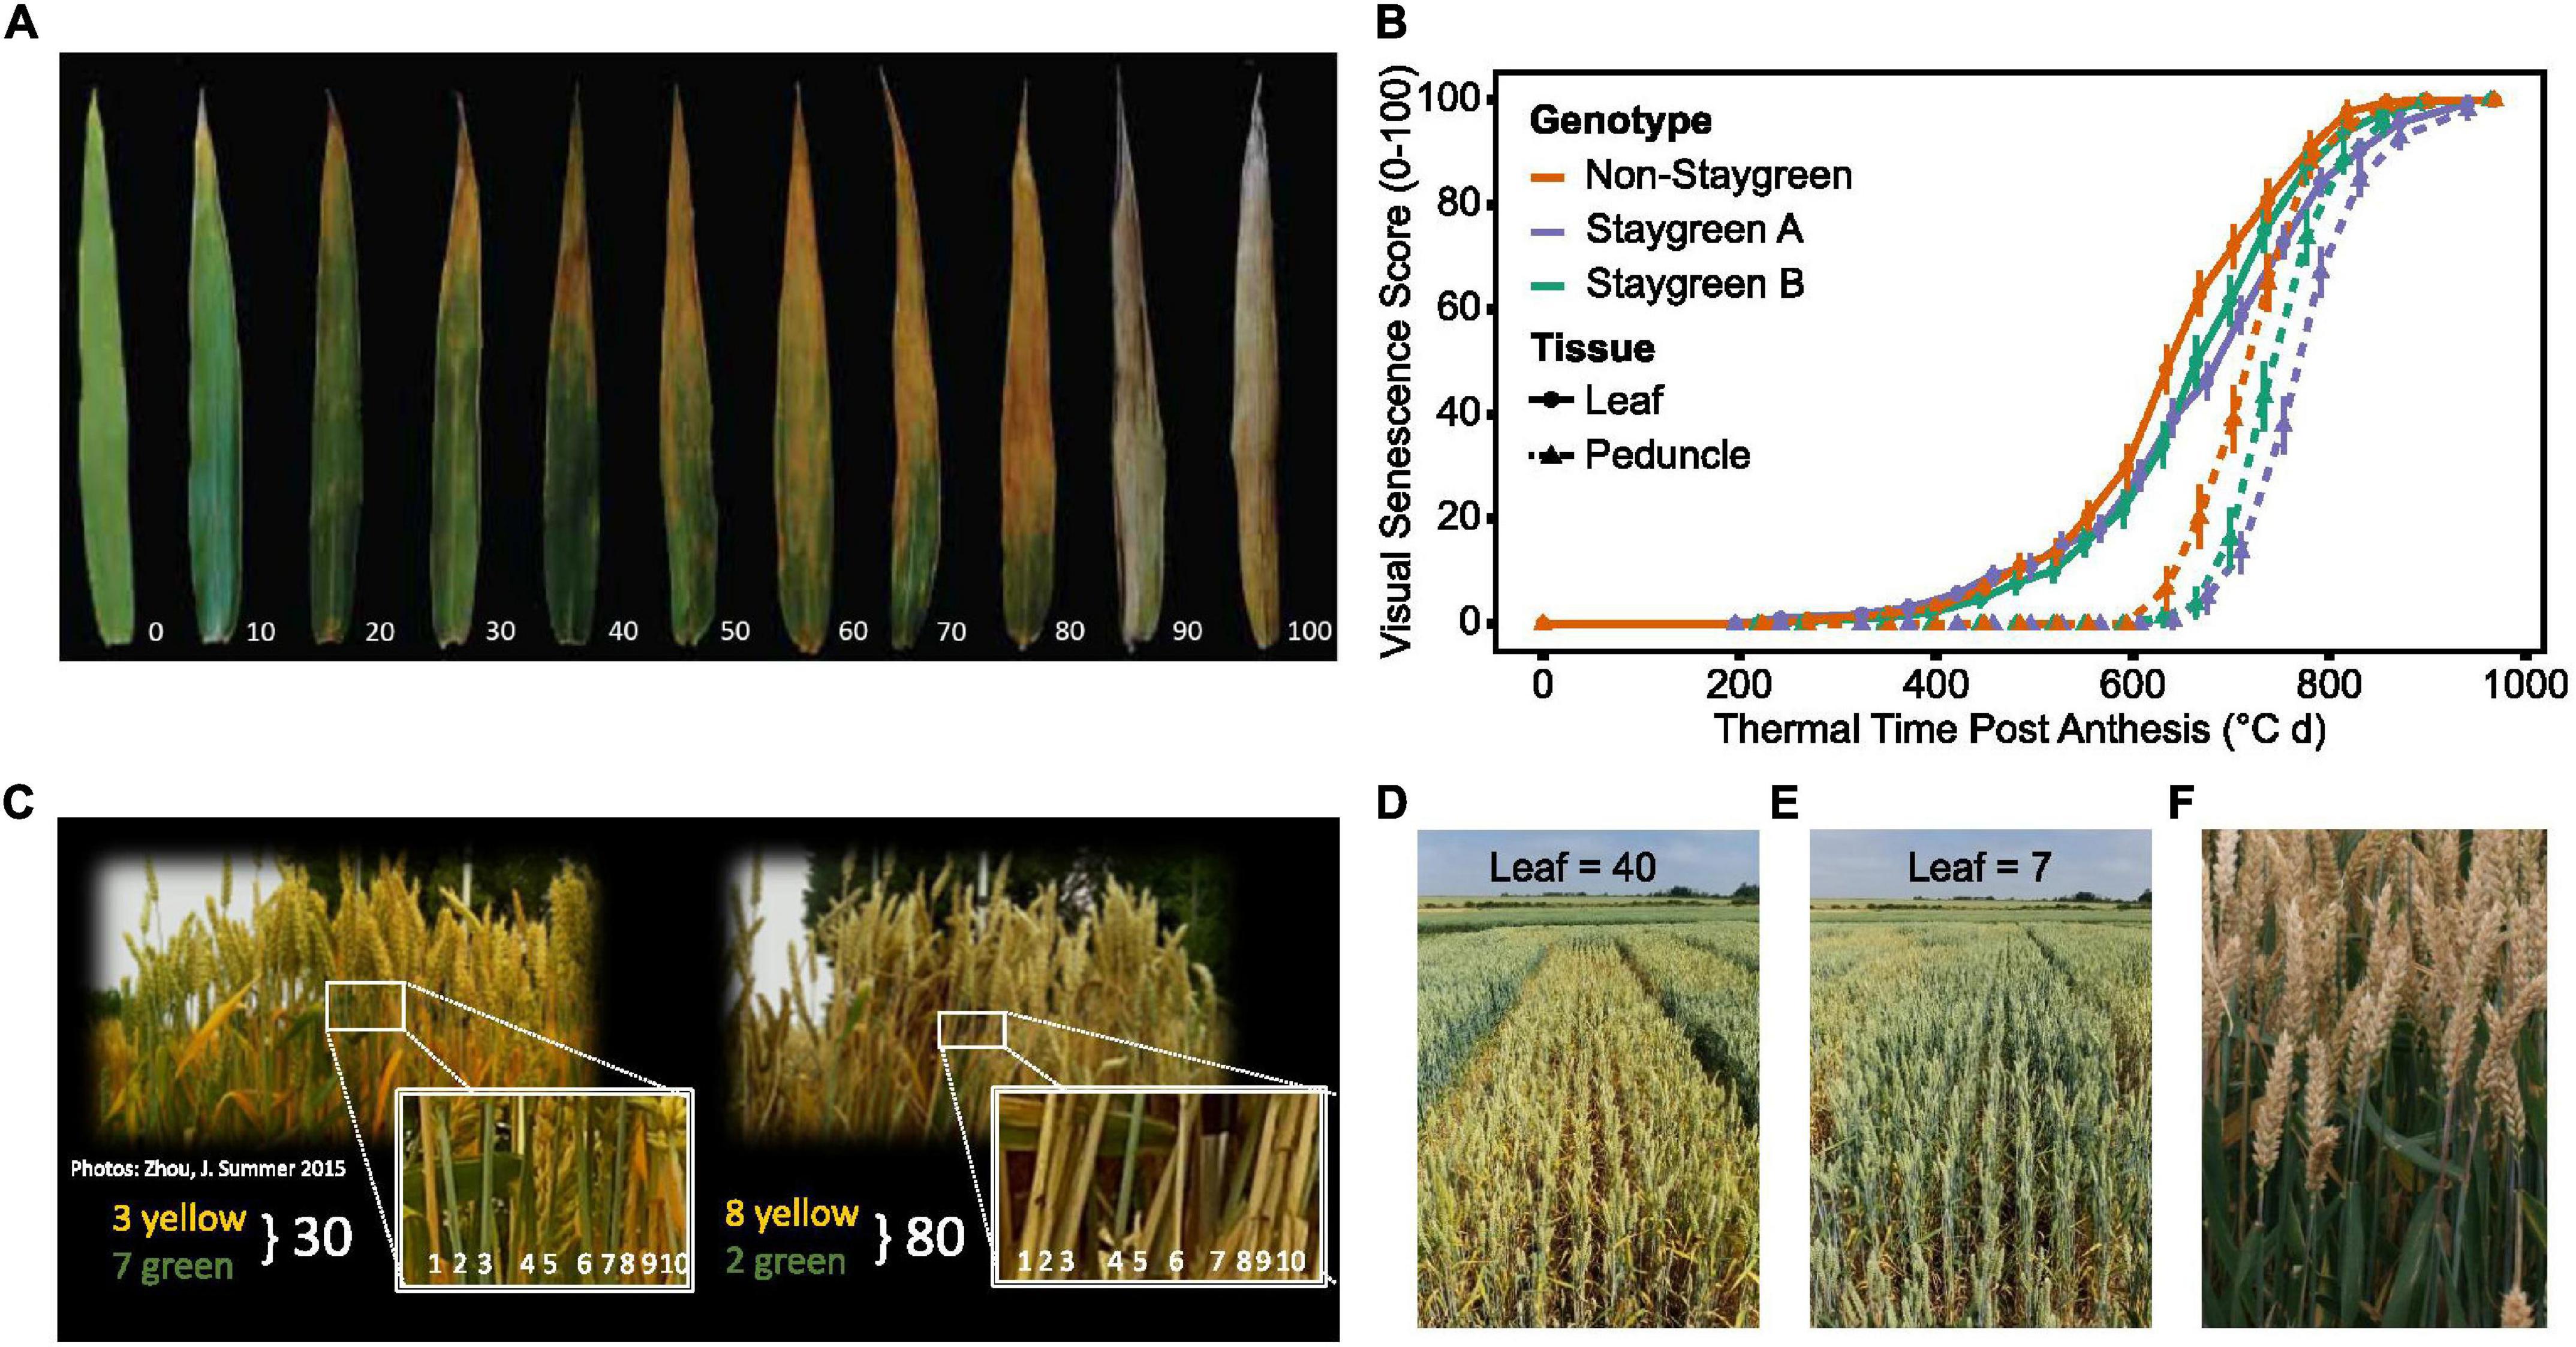
Figure 3. Simultaneous scoring of flag leaf, peduncle, and ear senescence allows the whole plant nature of senescence to be considered. Compared to flag leaf senescence (A), scoring of peduncle senescence (C) is less subjective, and respective senescence profiles were found to reinforce one another (B). Senescence of multiple plants was visually assessed and scored using a 0–100 scale (A,C) at the plot level (D,E), taking care to avoid edge effects or diseased plants. When observed, asynchronous senescence phenotypes (F) were recorded and may indicate impaired remobilization efficiency.
Flag leaf senescence was scored as the proportion of flag leaf yellowing with a score of 5 indicating leaf tip necrosis, and 100 complete senescence (Figure 3A). To avoid edge effects, flag leaves of multiple plants within plot centers were assessed together to derive an overall plot score (Figures 3D,E). Instances of plot heterogeneity resulting from disease, soil gradients, or damage were also recorded and subsequently referred to for the purpose of outlier detection. To reduce systematic error, plots were scored in the same orientation and direction on each visit, with scoring in direct sunlight avoided due to increased difficulty of identifying plot differences.
Peduncle senescence was scored as the percentage of plants for which the top 5 cm of peduncle tissue had transitioned from green to yellow. Compared to flag leaves, peduncles senesce evenly along their length, and the phase of rapid senescence is shorter (Figure 3B). This rapid color transition enables peduncles to be scored as either completely green or completely yellow, increasing objectivity of assessment. To accurately determine genuine differences between plots, 3–4 batches of 10 tillers were assessed and percentage yellow derived (Figure 3C).
To identify any potential association between grain filling and senescence phenotypes, grain maturity of RIL populations was scored according to the Zadoks scale with reference to the Wheat Growth Guide (Zadoks et al., 1974; AHDB, 2018). Two to three immature grains, from two plants per plot, were subject to thumbnail impressions or squashed between finger and thumb to determine the developmental stage, with observations recorded using a 1–4 scale (hard to soft) or Zadoks growth stages, GS79–GS93 (milky dough to ripe, grain loosening in the daytime) (AHDB, 2018). When observed, differences in flag leaf and ear senescence were recorded, which, in extreme cases, manifested themselves as “green leaf, ripe ear” phenotypes (Figure 3F). Through recording changes in flag leaf and peduncle greenness, alongside grain and spike maturity, one can understand the whole-plant nature of senescence, providing insights into resource remobilization and source-to-sink relationships. Table 2 lists senescence phenotyping approaches applied by other studies.
To quantify and interpret senescence dynamics multiple senescence metrics can be derived (Figure 2). Flag leaf and peduncle senescence scores were plotted against thermal time post-ear emergence GS55 (°C day) to standardize for heading variation and associated differences in temperature exposed. Mean daily temperature was calculated using daily minimum and maximum temperatures and summated over time in days, with GS55 corresponding to 0°C days. The metrics used to describe senescence patterns fall into five categories corresponding to onset, rate, duration, total greenness, or a dynamic measurement of senescence; however definitions of these terms alongside their method of calculation vary (Table 1).
The sigmoidal progression of senescence facilitates curve modeling, whereupon senescence is divided into three phases: an initial lag phase, a rapidly senescing phase, and a final lag maturation phase (Table 1). To calculate the rate, onset, and duration of senescence, we initially applied the model described by Bogard et al. (2011) and Gaju et al. (2011) to our data. A comparison of raw and modeled curves found these calculated metrics were of limited use, identifying a tendency of the model to overfit the data, while infrequent scoring led to inaccurate calculation of inflection points.
Due to problems encountered when curve modeling, we reviewed the definitions of commonly calculated metrics (Table 1) to inform derivation of senescence metrics from raw data (Table 3). Concordant with Christopher et al. (2014, 2016, 2018), Xie et al. (2016), Kitonyo et al. (2017), and Alhabbar et al. (2018), we define the onset of senescence as the “start of rapid senescence phase (flag leaf senescence score of ∼10–15)” (Table 3). Similar to Christopher et al. (2014, 2016), Xie et al. (2016) and Nehe et al. (2018), we define termination of flag leaf or peduncle senescence as the “time at which maximum senescence score (>90) is first recorded” (Table 3). Senescence duration was calculated from both ear emergence and onset of senescence (Figure 2), with the latter providing an indirect measure of senescence rate (Table 3). To capture senescence dynamism, we derived times to different flag leaf senescence scores (Table 3), similar to metrics MidS (midpoint of senescence) and 75%G utilized by Vijayalakshmi et al. (2010) and others (Table 1). Assuming that senescence progresses linearly, time points corresponding to scores above and below the “target” senescence score, i.e., 70, are identified with time divided proportionately to estimate time elapsed (Figure 4). Calculating the mean senescence score over the scoring period provides an assessment of overall greenness (Nehe et al., 2018), and was calculated separately for both flag leaf senescence (MeanLeaf) and peduncle senescence (MeanPed) (Table 3).
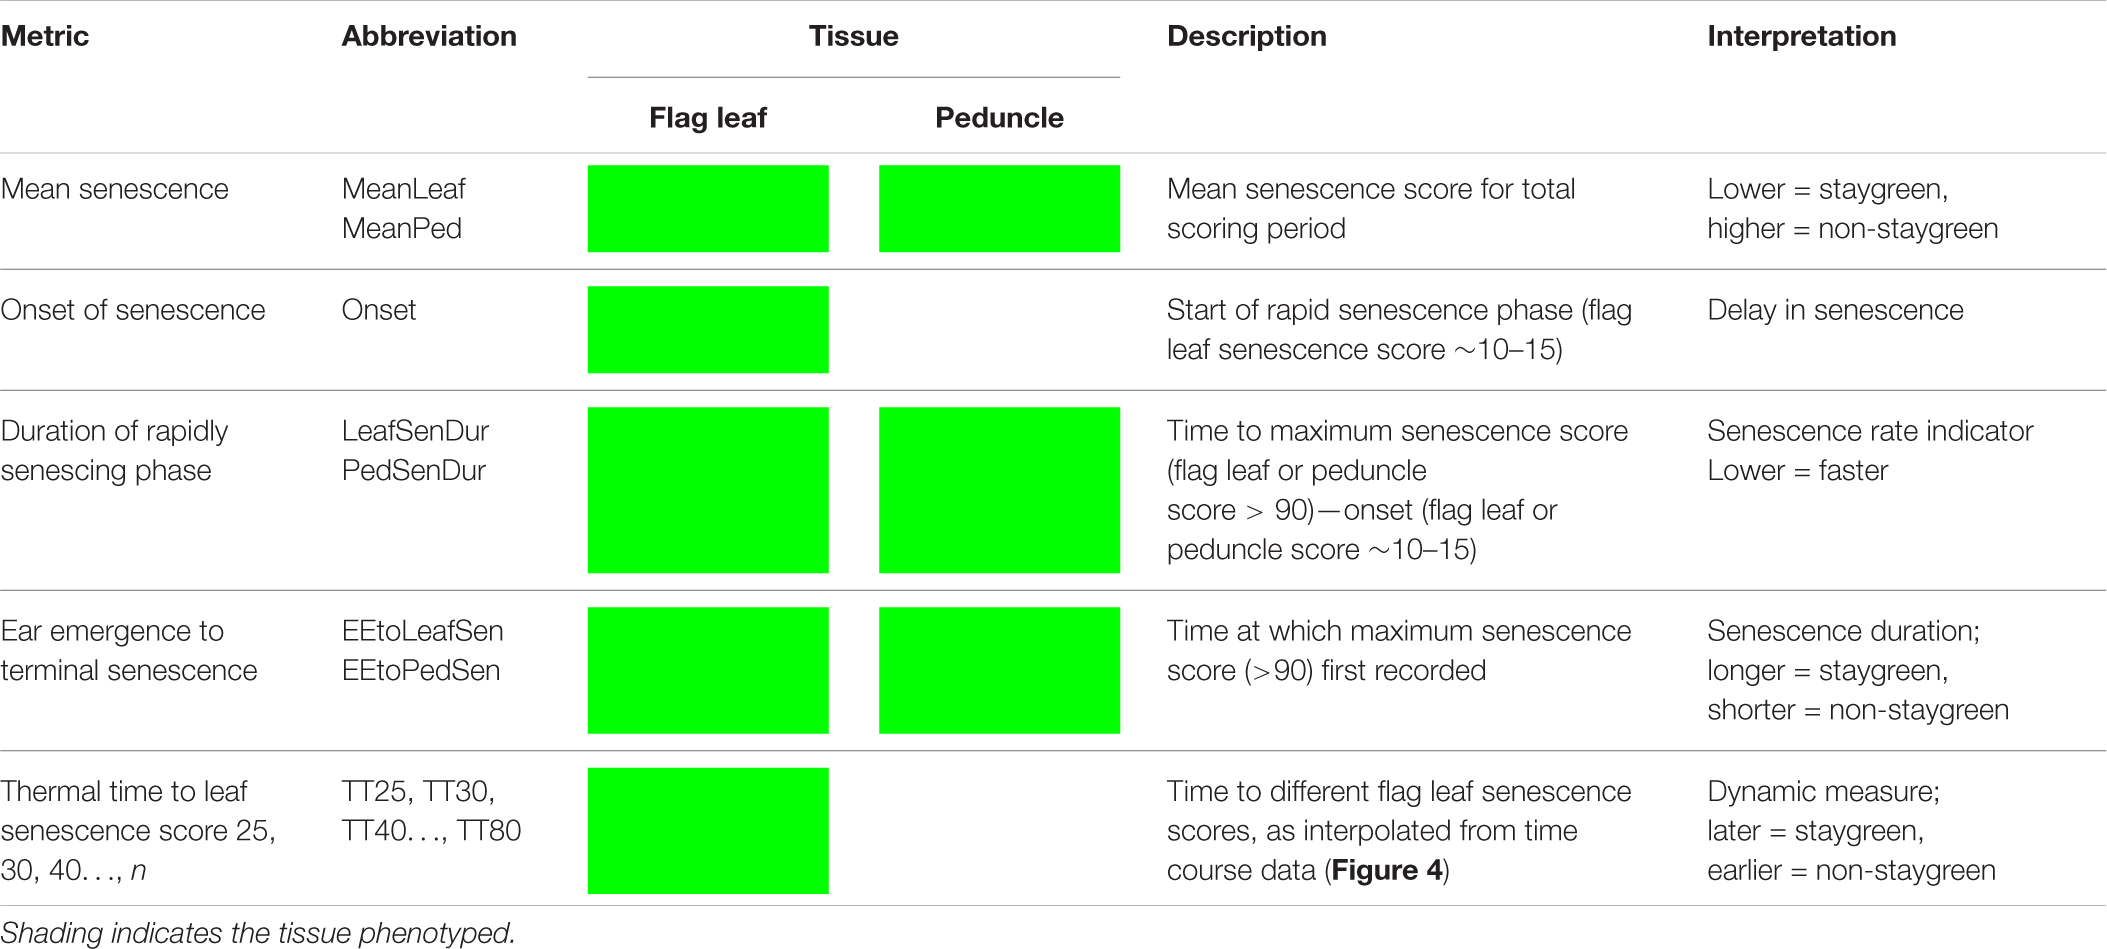
Table 3. Senescence metrics derived for quantification and qualification of time course senescence profiles.
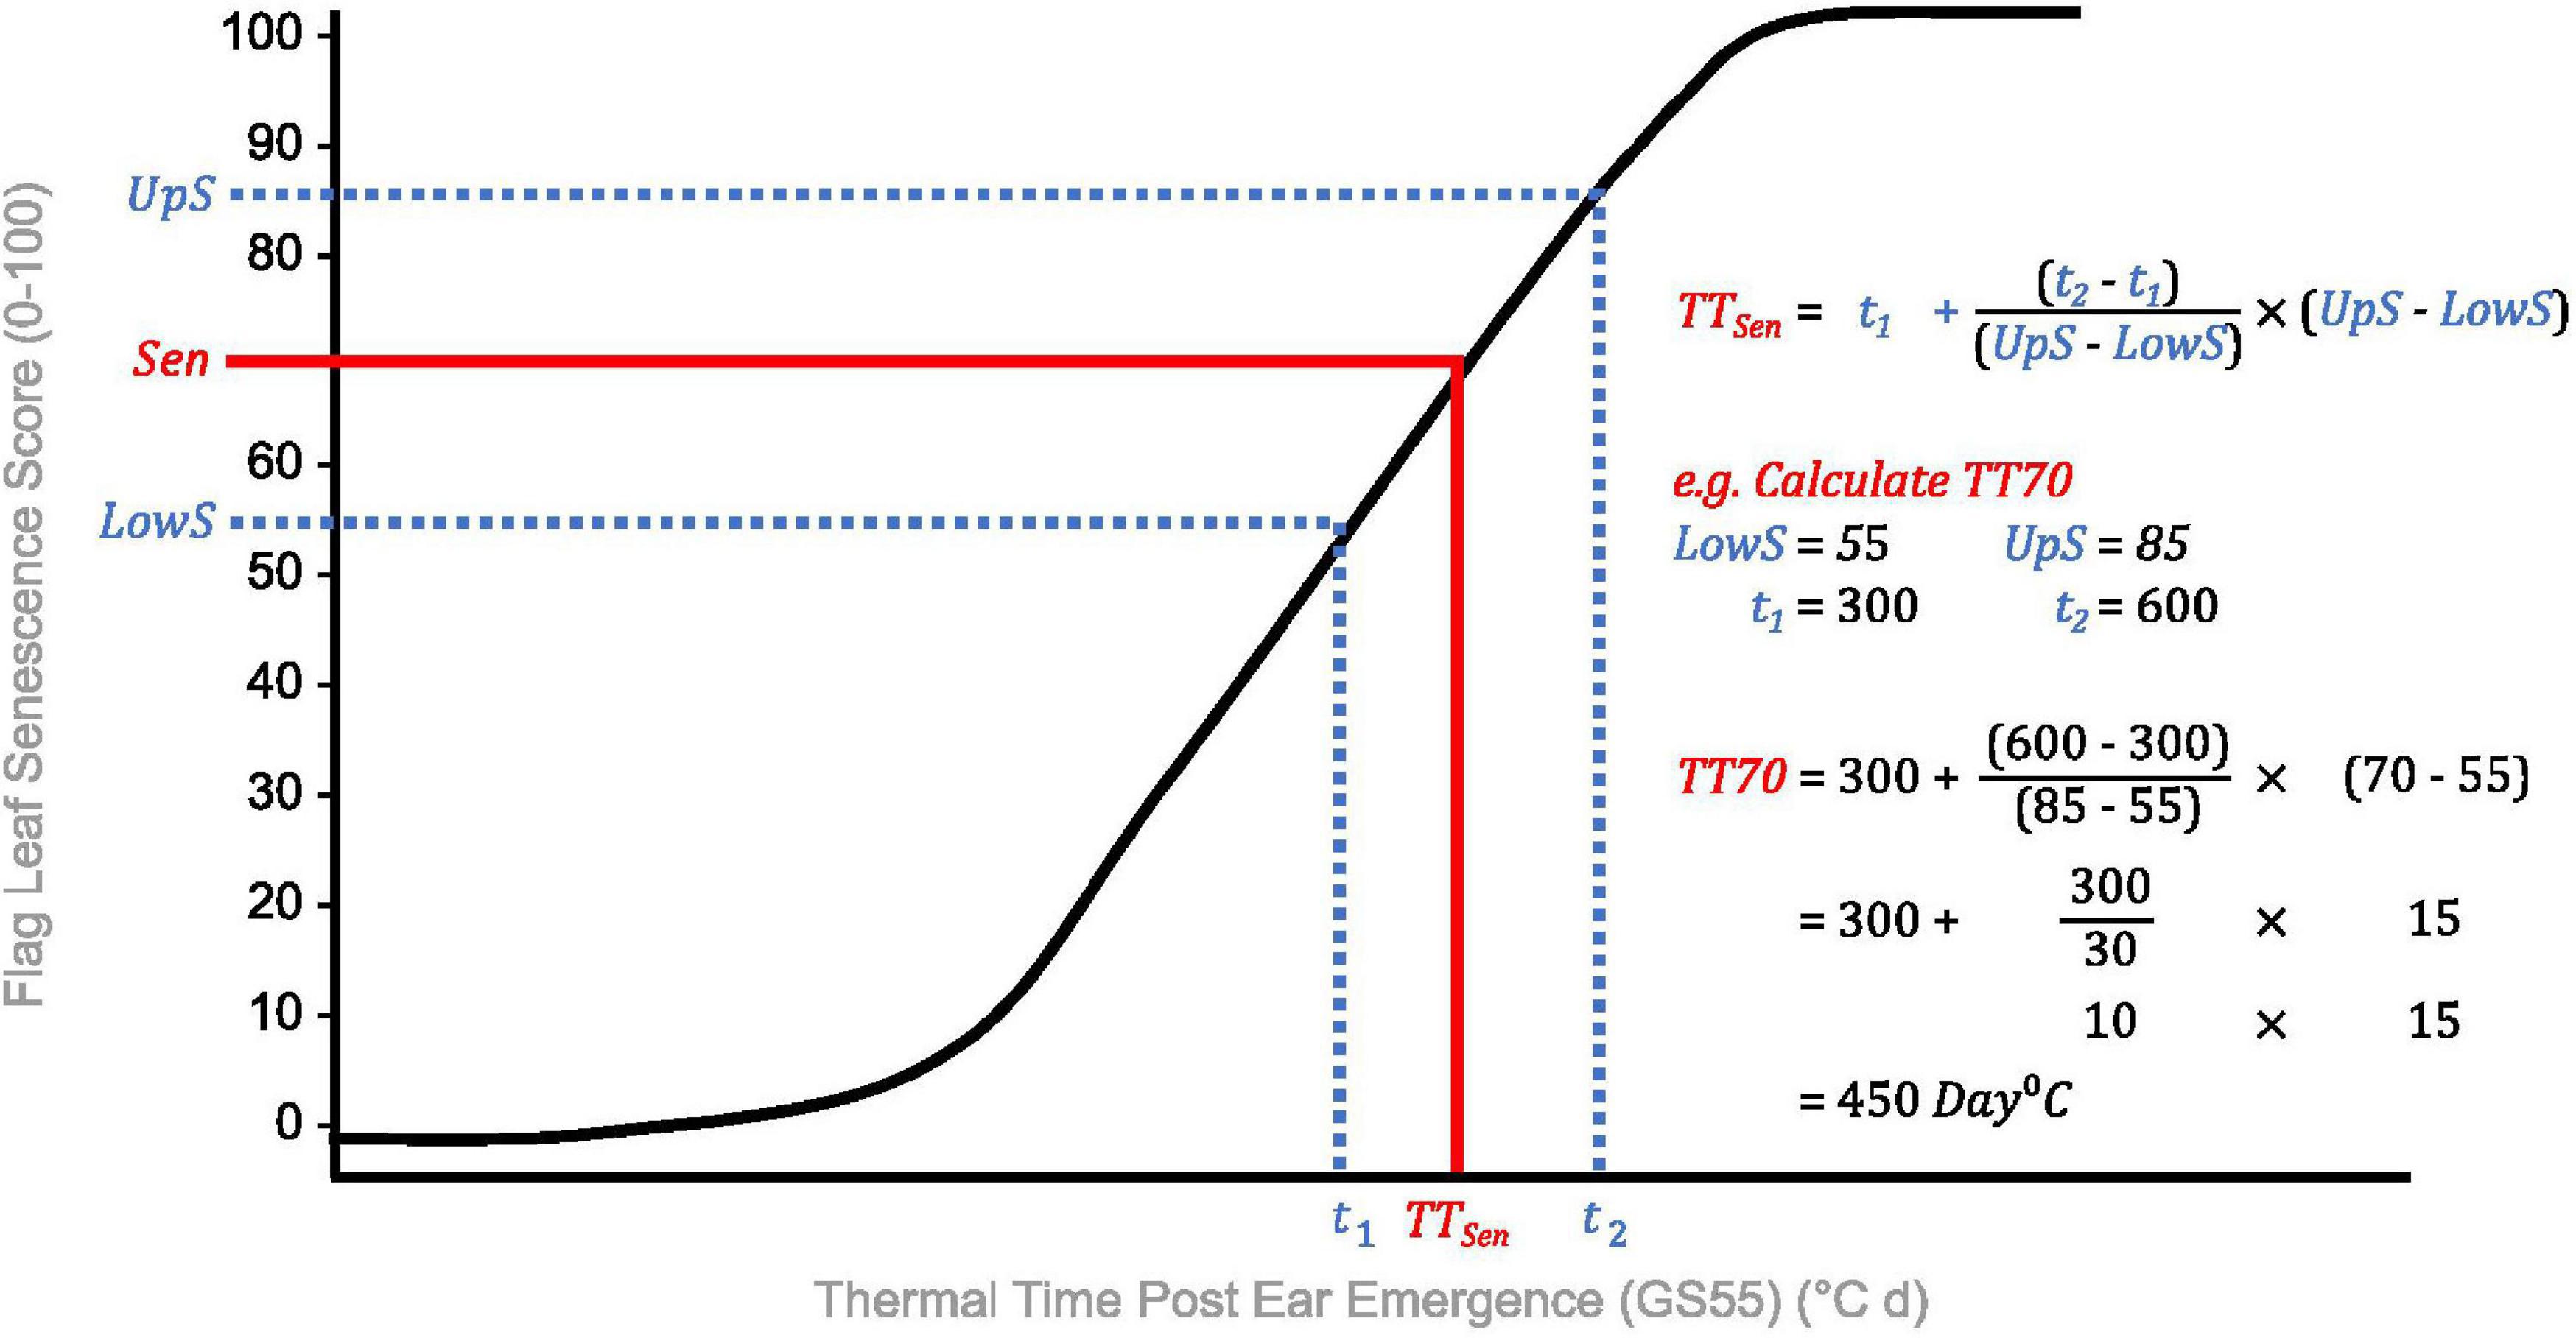
Figure 4. Calculation of thermal time to flag leaf senescence score of 70 (TT70), a dynamic senescence metric. Senescence scoring dates are converted into thermal time from ear emergence (°C d) to standardize for heading date variation. A “target” flag leaf senescence score is specified (Sen), and time points for scores below (t1, LowS) and above (t2, UpS) this are identified. Assuming senescence progresses linearly, time elapsed between flag leaf senescence scores is divided proportionately to estimate the time to the target score (TTSen).
Data analysis was performed using R (version 3.5.2) (R Core Team, 2018) within R Studio (R Studio team., 2015), and data manipulated using the packages “data.table” (Dowle et al., 2019), “dplyr” (Wickham et al., 2018b), “plyr” (Wickham, 2015), and “tidyr” (Wickham et al., 2019). Senescence metrics were derived from raw senescence data in absence of spatial correction with means calculated per line when replicated. To assess heritability and accuracy of senescence scoring Spearman’s rank correlations were calculated and results visualized using “ggpubr” (Kassambara, 2018). To illustrate the discriminatory power of senescence metrics, phenotype × genotype plots were constructed using the package “r/qtl” (Arends et al., 2010), with other graphs produced using the package “ggplot2” (Wickham et al., 2018a). To determine the significance of phenotypic differences linear mixed modeling was performed using the packages “lme4” (Bates et al., 2019) and “lmerTest” (Kuznetsova et al., 2017), with replicate, row, column, and NAM-1 genotype treated as fixed effects, and RILs per population as random. Tukey post hoc tests were performed using the package “lsmeans” (Lenth, 2018).
Few publications report the use of peduncle senescence phenotyping when studying senescence regulation (Table 2). In 2017 and 2018 we conducted time course senescence scoring of flag leaf and peduncle tissue (Figure 3). We identified that peduncle senescence is initiated after flag leaf senescence, with senescence profiles found to reinforce one another, aiding differentiation of lines (Figure 3B; Chapman et al., 2020). Compared to flag leaf senescence, peduncle senescence occurs over a shorter time period, and individual scores demonstrate less variation as indicated by their comparatively smaller error bars (Figure 3B).
Between 2016 and 2018, RILs segregating for two independent senescence traits were phenotyped under field conditions. Plotting senescence data against thermal time enabled calculation of senescence metrics, illustrating the effect of environment on senescence regulation. For example, between 2016 and 2018, ear emergence to terminal flag leaf senescence (EEtoLeafSen) scores ranged from 825 (95% CI 792, 858) to 1,156 (95% CI 1,090, 1,220) °C d for the “non-staygreen” parent; a difference of 331°C d. Differences in senescence duration reflect variation in mean daily temperature, with senescence progressing most rapidly and terminating earliest in 2018 due to elevated mean daily temperatures and reduced rainfall (Supplementary Figure 1).
To determine the stability of senescence phenotypes, and accuracy of phenotyping methods, year-pairwise Spearman’s rank correlations were calculated for a range of senescence metrics. We found that the magnitude and significance of between-year phenotypic correlations relates to the penetrance and stability of parental senescence phenotypes. For example, Staygreen A RILs segregate for a relatively extreme staygreen phenotype (Figure 3B), and year-pairwise phenotypic correlations ranged from r = 0.39 to 0.91, P ≤ 0.02 (Supplementary Table 1). Conversely, Staygreen B RILs segregate for a milder staygreen phenotype, and year-pairwise phenotypic correlations were lower, ranging from r = 0.3 to 0.68, P ≤ 0.03 (Supplementary Table 1). Correlations were significant for all 3 year-pairs for between two and nine metrics, P ≤ 0.03, indicating trait heritability, environmental stability, and accurate phenotyping of RILs (Supplementary Table 1). Insights from such analysis can direct in-field phenotyping approaches, informing which senescence metrics to prioritize when conducting phenotypic selection and forward genetic screens.
As time course phenotyping is time consuming and laborious, we identified the need for a single senescence metric capable of discriminating senescence types. Magnitude and significance of year-pairwise correlations calculated for the same metric enable environmental stability and metric performance to be assessed. Inspection of year-pairwise correlations identified metric TT70 as a potential candidate, with correlations of r = 0.78–0.84 and r = 0.37–0.59, P ≤ 0.02, reported for Staygreen A and Staygreen B RILs, respectively (Figure 5D and Supplementary Table 1). Alternatively, peduncle senescence-derived metrics may better discriminate senescence phenotypes. Compared to metric TT70, year-pairwise correlations for MeanPed (mean peduncle senescence) scores were greater, ranging from r = 0.62 (Staygreen B) to 0.91 (Staygreen A), P ≤ 1.8 × 10⁻⁵ (Figure 5C), indicating greater environmental stability.
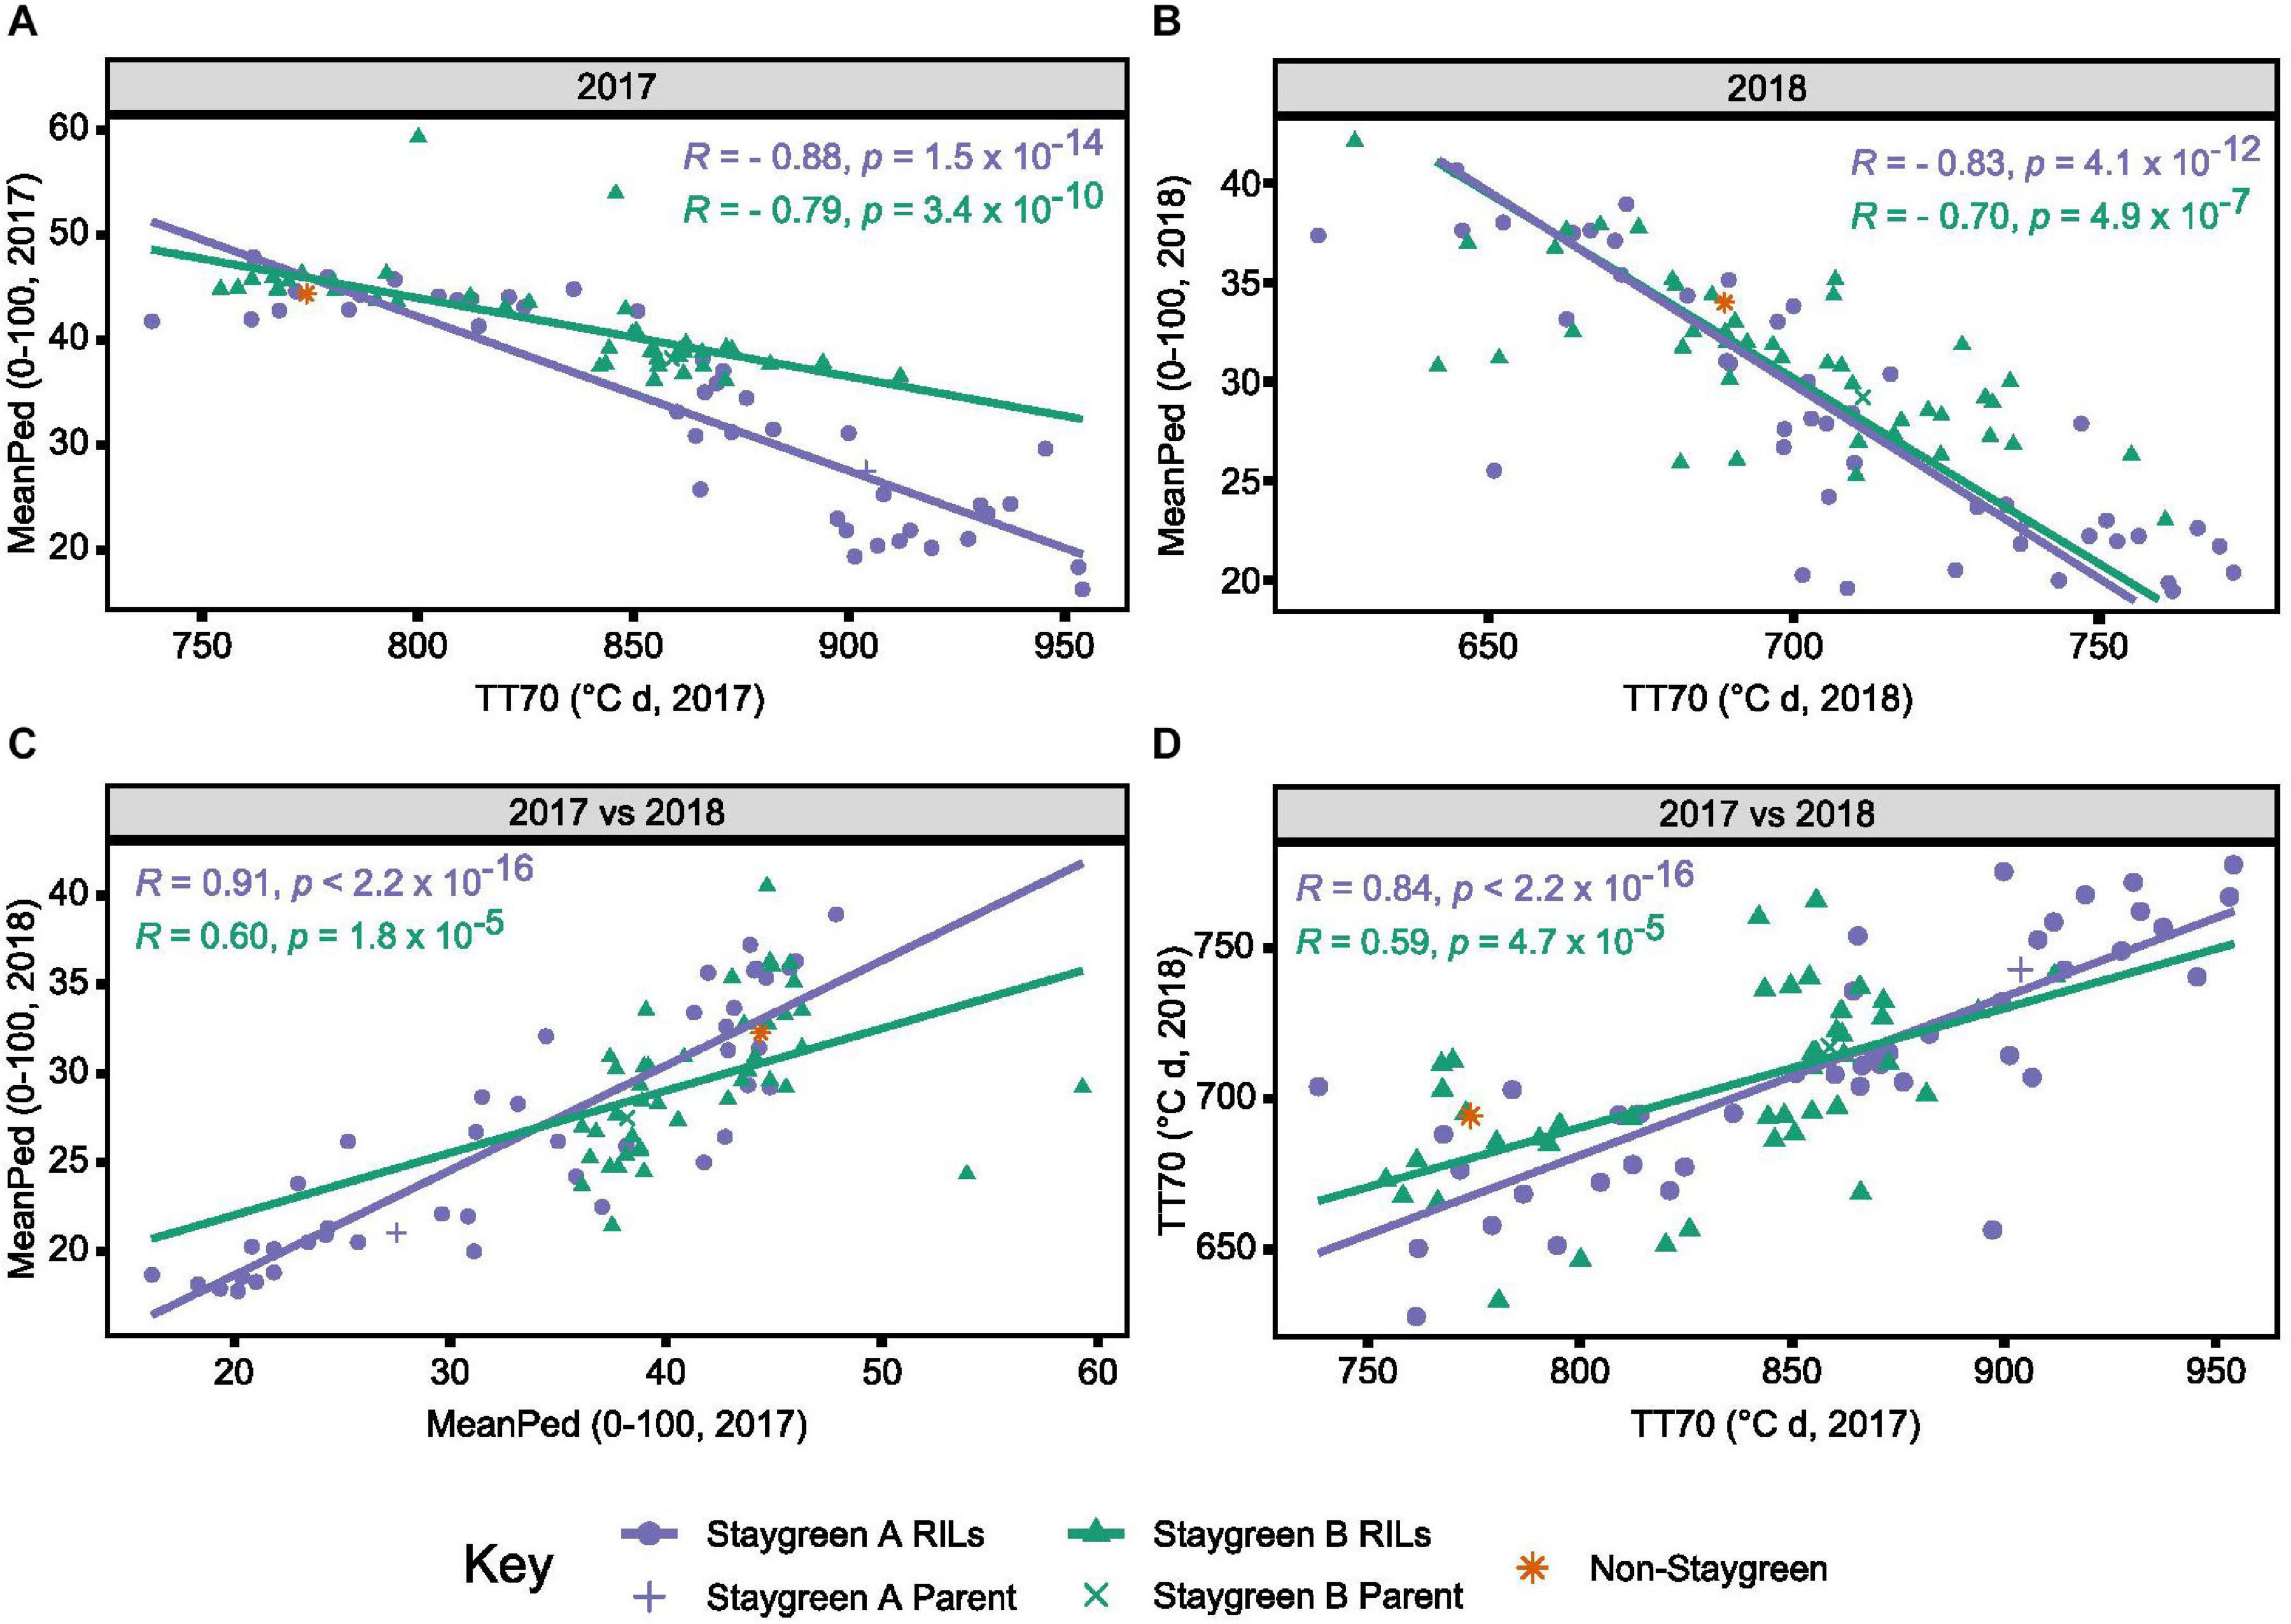
Figure 5. Environmental stability and concordance of metrics TT70 and MeanPed aids in the discrimination of staygreen and non-staygreen types. Through comparing TT70 and MeanPed values recorded in 2017 (A) and 2018 (B), one can distinguish senescence variation, whereby “staygreen” and “non-staygreen” lines cluster in the bottom-right and top-left corners, respectively. Between-year Spearman’s rank correlations for metrics MeanPed (C) and TT70 (D) range from R = 0.59 to 0.91, P < 0.0001, with the metrics themselves negatively correlated, R = 0.7 to 0.88, P < 0.0001 (A,B). Spearman’s rank correlations calculated for the 36–42 RILs per population grown at Church Farm, Bawburgh, Norwich (JIC) between 2017 and 2018, plotting mean value per line, n ≥ 2. Staygreen A parent and RILs (purple), staygreen B parent and RILs (green), and recurrent parent (orange).
Calculation of year-pairwise phenotypic correlations illustrates that our approach to senescence scoring and quantification is robust, but does it aid in the discrimination of senescence variation among lines? Correlation plots displaying mean TT70 or MeanPed scores recorded for individual RILs reveals their tendency to cluster into senescence types. For metric TT70, RILs clustered toward the bottom-left corner are considered “non-staygreen,” with those clustered toward the top-right “staygreen” due to taking longer to senesce (Figure 5D). Conversely, lower MeanPed scores indicate greater retention of green peduncle tissue, with RILs clustered toward the bottom-left considered “staygreen” (Figure 5C).
The degree of separation between “non-staygreen” and “staygreen” clusters relates to the extremity of senescence phenotype. For example, the mean difference in TT70 scores between lines Staygreen A and B compared to the parental non-staygreen line are 85.3 ± 34.4 and 63.0 ± 27.8°C d, respectively, with contrasting Staygreen A RILs clustering further apart (Figure 5D). Greater robusticity of peduncle-derived senescence scores contributes to tighter clustering of RILs contrasting for senescence phenotypes (Figure 5C), although metric TT70 can distinguish smaller variations between RILs, due to a greater range of recorded values (Figure 5D). In combination, metrics TT70 and MeanPed can be used to accurately discriminate senescence types, particularly in the absence of multi-year phenotyping data as we found the metrics to be highly correlated, r = −0.7 to −0.88, P ≤ 4.9 × 10⁻⁷ (Figures 5A,B).
Proof of the utility of TT70 and MeanPed scores in discriminating senescence variation are the results of mapping by bulk segregant analysis conducted for Staygreen A and Staygreen B (Chapman et al., 2020). While different senescence metrics may better capture the range of senescence variation in different years, assessment of TT70 and MeanPed scores consistently identified the same RILs for which senescence was delayed, facilitating the selection of phenotypically contrasting bulks. Compared to metric MeanLeaf, the distribution of MeanPed scores recorded for Staygreen A and B RILs was flatter, indicating that peduncle-derived senescence scores could better discern senescence variation (Figure 6).
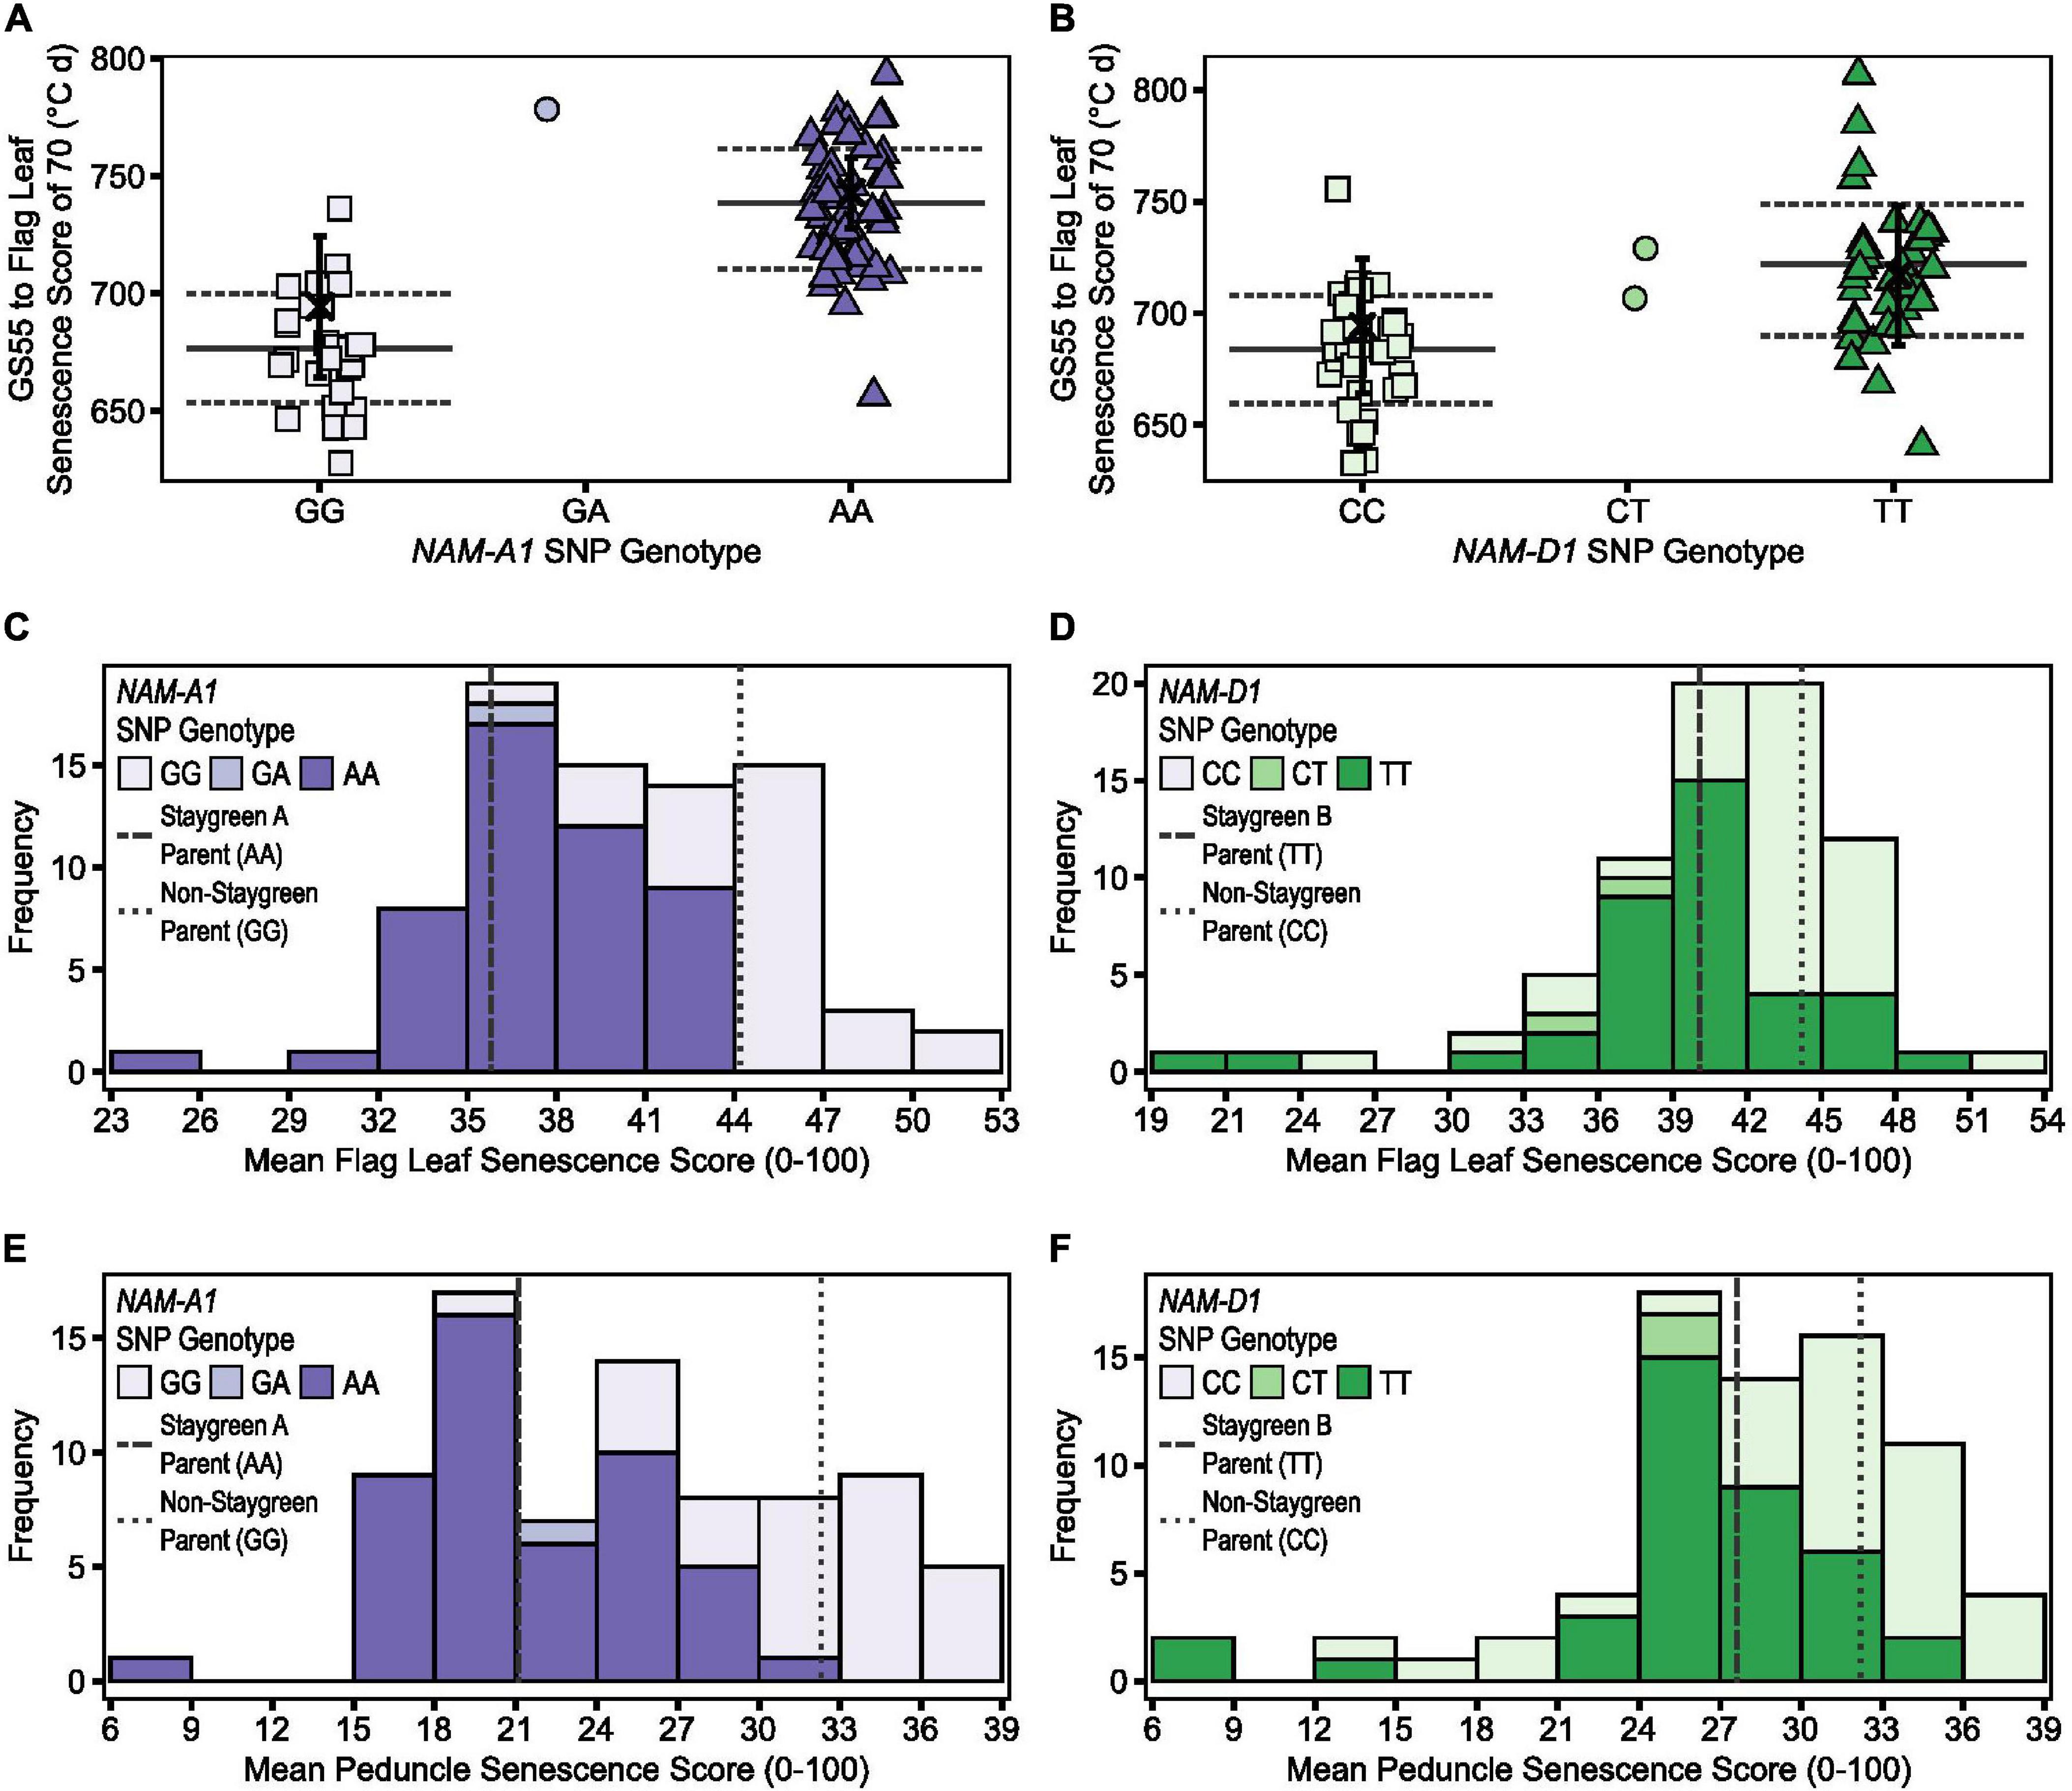
Figure 6. Illustrating the differential power of metrics TT70, MeanLeaf, and MeanPed in discriminating senescence variation. Phenotypic differences were significant between homozygous RILs contrasting for mutations in NAM-A1 (Staygreen A) (A,C,E) and NAM-D1 (staygreen B) (B,D,F) according to TT70 (A,B), MeanLeaf (C,D), and MeanPed (E,F) scores, P ≤ 0.003. Metric MeanPed proved more informative when classifying senescence types compared to MeanLeaf due to the greater range and spread of scores. Phenotypic differences between parents were not significant, P > 0.05. (A,B) Scatterplot of TT70 scores against NAM-1 genotype; genotypic group mean (solid line) ± SD (dotted line), parental mean (black cross) ± SD. (C–F) Bars display mean MeanLeaf and MeanPed score recorded for two RIL populations, n ≥ 75 (two replicates) segregating for mutations in NAM-A1 (C,E) or NAM-D1 (D,F); allelic combinations, GG/CC = homozygous non-staygreen, AA/TT = homozygous Staygreen A/Staygreen B, GA/CT = heterozygous. Lines represent parental means (n > 5); staygreen parents (dashed), non-staygreen parent (dotted). Trial grown at Church Farm, Bawburgh, Norwich (JIC), 2018.
However, although differences in flag leaf and peduncle senescence profiles of Staygreen A and B were typically significant relative to the non-staygreen line, P < 0.0001 to P = 0.11 (Chapman et al., 2020), differences in TT70 and MeanLeaf scores were not significant in 2018, P > 0.05, but were significant in 2016 and 2017, P < 0.05. Similarly, differences in MeanPed scores recorded for Staygreen A and the non-staygreen parent were significant only in 2017, P < 0.01, whilst differences observed for Staygreen B were not, P > 0.05. Therefore, when differences in a senescence metric are not significant between lines under investigation, one recommends their comparative assessment, just as we performed when classifying senescence variation among RILs during mapping of Staygreen A and B (Chapman et al., 2020). This approach worked successfully as, following trait mapping, differences in TT70 and MeanPed scores recorded for homozygous RILs contrasting for mutations in NAM-A1 or NAM-D1 (Staygreen A and B, respectively) were significant in all 3 years, P < 0.05 (Figure 6).
Previously, grain filling experiments conducted for Staygreen A and Staygreen B found grain moisture content remained elevated during the final 10–15 days of grain filling relative to their non-staygreen parent, P < 0.05 (pairwise Tukey post hoc test; Chapman et al., 2020). The number of time points for which grain moisture content of Staygreen A and Staygreen B were significantly greater compared to their common non-staygreen parent corresponded to the observed differences in onset of senescence, indicating a positive trait association (Chapman et al., 2020). Variation in grain development was detected amongst RIL subsets segregating for senescence traits grown in 2016 and 2017 (data not shown). However, because Staygreen A and B were produced through EMS mutagenesis, involvement of background mutations could not be discounted. Differences in grain moisture content were not attributable to phenological differences, with heading date variation limited to 1–2 days for each population.
To conduct grain filling experiments for entire RIL populations would have been unfeasible; however, thumbnail impressions are routinely performed to assess grain development and maturity (Zadoks et al., 1974; AHDB, 2018). On July 20, 2018, grain filling experiments found grain moisture content of Staygreen A and B to be significantly elevated compared to the non-staygreen parent, P < 0.001 (pairwise Tukey post hoc test; Chapman et al., 2020). Thumbnail-based maturity scores ranged from GS87-91 for the Staygreen A parent (n = 4) and Staygreen B parent (n = 3) and GS92 for the non-staygreen parent (n = 7) (Figure 7). Grain maturity of some plots was recorded as being between two growth stages, GS87-91 and GS91-92, attributable to variation between main and secondary tillers.
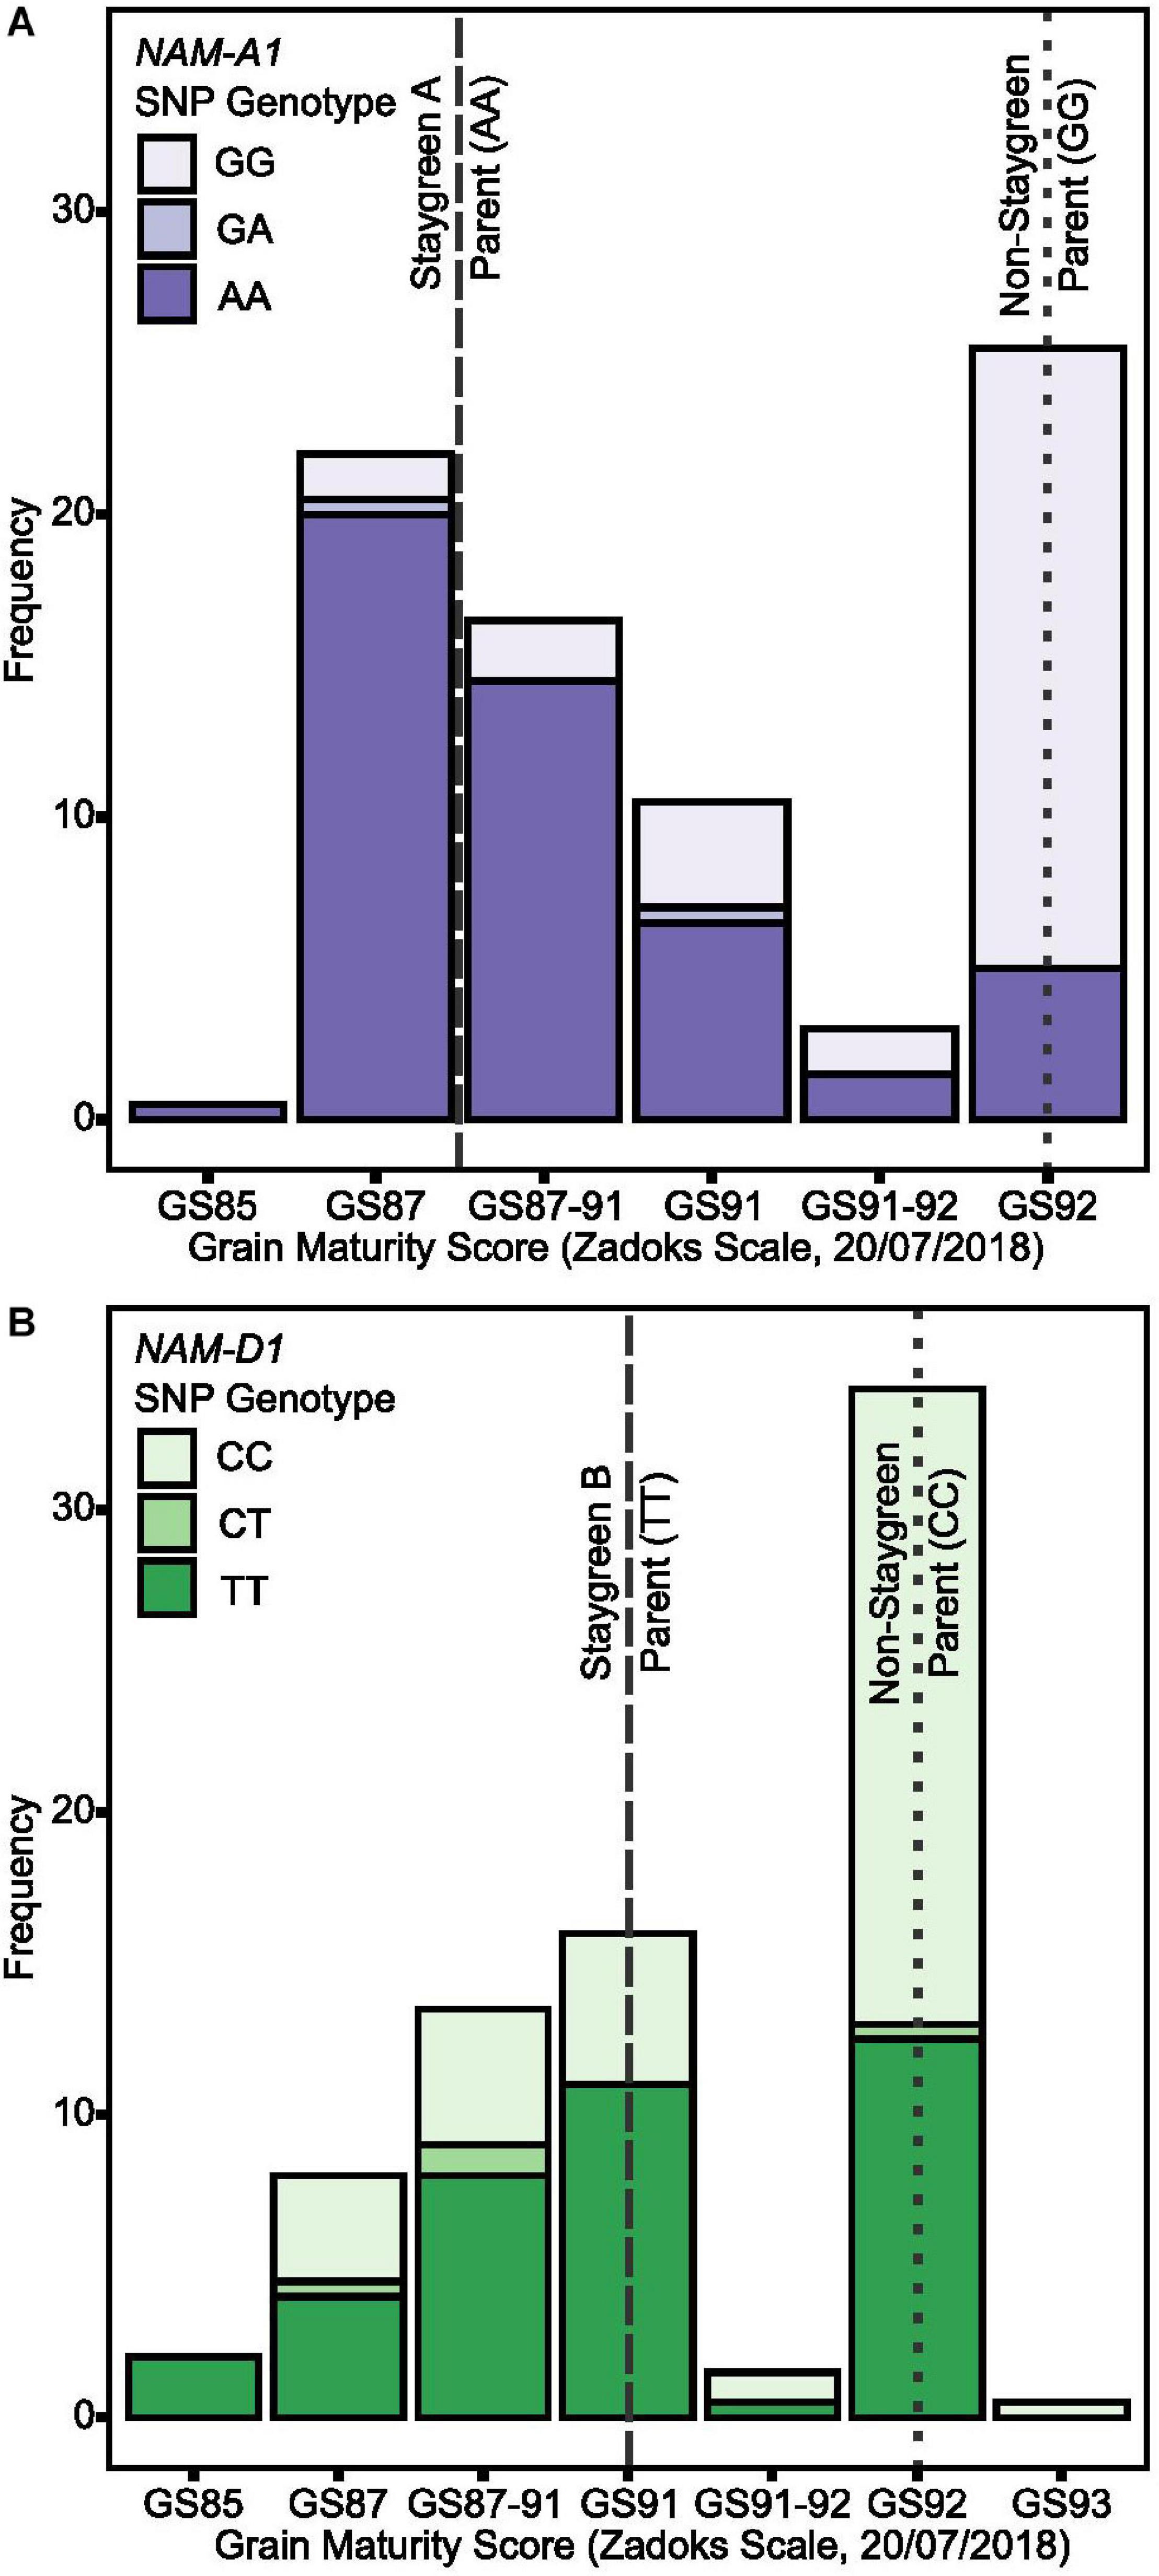
Figure 7. Staygreen phenotypes are positively associated with delayed grain maturation. Grain maturation of RIL populations segregating for senescence traits was assessed when significant differences in grain moisture content between parental lines (Staygreen A vs. non-staygreen parent and Staygreen B vs. non-staygreen parent) were previously observed. Grain maturation of RILs homozygous for mutations in NAM-A1 (Staygreen A) (A) and NAM-D1 (Staygreen B) (B) was delayed, with scores starting from GS85 onwards, compared to the predominant score of GS92 for RILs homozygous for the non-staygreen allele. Grain scored according to the Zadoks scale (Zadoks et al., 1974), assisted by “The Wheat Growth Guide” (AHDB, 2018). Bar charts represent RIL populations, n ≥ 75 (two replicates) segregating for a mutation NAM-A1 (Staygreen A) (A) or NAM-D1 (Staygreen B) (B); allelic combinations, GG/CC = homozygous non-staygreen, AA/TT = homozygous Staygreen A/Staygreen B, GA/CT = heterozygous. Lines represent parental means (n ≥ 3 per replicate); staygreen parents (dashed), non-staygreen parent (dotted).
Grain maturity scores recorded for RIL populations (n ≥ 75) ranged from GS85 (soft dough) to GS93 (grain loosening in daytime) (AHDB, 2018) which, when plotted against NAM-1 SNP composition, confirm that senescence and grain filling traits are associated (Figure 7). On July 20, 2018, a grain maturity score of GS92 was recorded for 71 and 59% of RILs homozygous for the “non-staygreen” NAM-A1 (GG) or NAM-D1 (CC) allele, respectively (Figure 7). In contrast, 73% of RILs homozygous for the Staygreen A NAM-A1 allele (AA) recorded a grain maturity score of GS87-91 or below (Figure 7A). Differences in grain maturity were subtler for Staygreen B, and scores of GS85 to GS87-91 and GS91 were recorded for 37 and 29% of RILs homozygous for the NAM-D1 allele (TT), respectively (Figure 7B). Previous grain filling experiments identified the relative timing of differences in grain development for Staygreen A and B (Chapman et al., 2020), for which thumbnail impression-based scoring can quickly and accurately capture such differences based on these results. Assessing visual leaf and peduncle senescence together with grain maturation could provide a method to separate cosmetic and functional staygreen phenotypes. Furthermore, through recording visual flag leaf and peduncle senescence scores when grain maturity is reached, one can identify if resources are being efficiently remobilized into the grain (Figure 3F).
When mapping the GPC-B1 locus, Uauy et al. (2006a) reported changes in peduncle color as being linked. This resulted in the identification of the NAC transcription factor and senescence regulator NAM-B1 (Uauy et al., 2006b). Subsequent reverse genetic studies investigating the role of NAM-1 homeologs and paralogs in senescence regulation independently confirm the utility of peduncle phenotyping, with these accurately capturing senescence variation (Cantu et al., 2011; Avni et al., 2014; Pearce et al., 2014; Borrill et al., 2019; Harrington et al., 2019a). Compared to flag leaf senescence, peduncle senescence is initiated later and progresses rapidly, with visual yellowing of peduncles first observed when flag leaf senescence scores approach ∼50 (Figure 3B). Unlike flag leaves, peduncles senesce evenly along their length making plot-level assessment objective (Figure 3), with scores typically only confounded by barley yellow dwarf virus-associated anthocyanin production (Livingston et al., 1998).
In agreement with Borrill et al. (2019) and Harrington et al. (2019a, b), we report greater environmental stability of peduncle, as opposed to flag leaf, senescence phenotypes (Figures 5C,D). For example, when characterizing Triticum turgidum cv. Kronos NAM-A1 mutants, Harrington et al. (2019a) reported peduncle senescence as consistently delayed under both field and glasshouse conditions, P < 0.05, whereas flag leaf senescence was not, P > 0.05 (glasshouse), P < 0.001 to P > 0.05 (field). Regarding our own lines, we found that peduncle and flag leaf senescence-derived metrics were highly correlated, R > 0.7, P < 0.001 (Figures 5A,B), illustrating that both phenotyping approaches accurately capture senescence variation. Together, increasing our reliance on peduncle senescence phenotyping may reduce the need for prolonged time course assessment, but to prevent this short window from being missed, flag leaf senescence requires monitoring.
To quantify senescence, we initially calculated the mean flag leaf senescence score for the total scoring period (MeanLeaf). Comparing MeanLeaf scores of individual lines against their flag leaf senescence profiles revealed that the metric poorly captured senescence dynamism. Similarly, when evaluating 14 Australian wheat cultivars Kitonyo et al. (2017) reported cv. Heron as early but slow to senesce, and cv. Justica CL Plus as greener overall and rapidly senescing, but mean senescence scores may be similar (Figure 8). Using an alternative approach, Kitonyo et al. (2017) applied a logistic regression to time course NDVI measurements to quantify senescence, finding that maximum NDVI scores (near flowering) increased with year of cultivar release. In wheat, the use of the metric “mean senescence” is rare (Table 1), suggesting its limited utility, whereas in maize, Ziyomo et al. (2013) and Parajuli et al. (2018) successfully used mean scores to characterize stress responses of lines grown under different agronomic and cropping systems. Therefore, when quantifying senescence thought should be given to the specific pattern, or phase of senescence depicted, which may vary between systems.
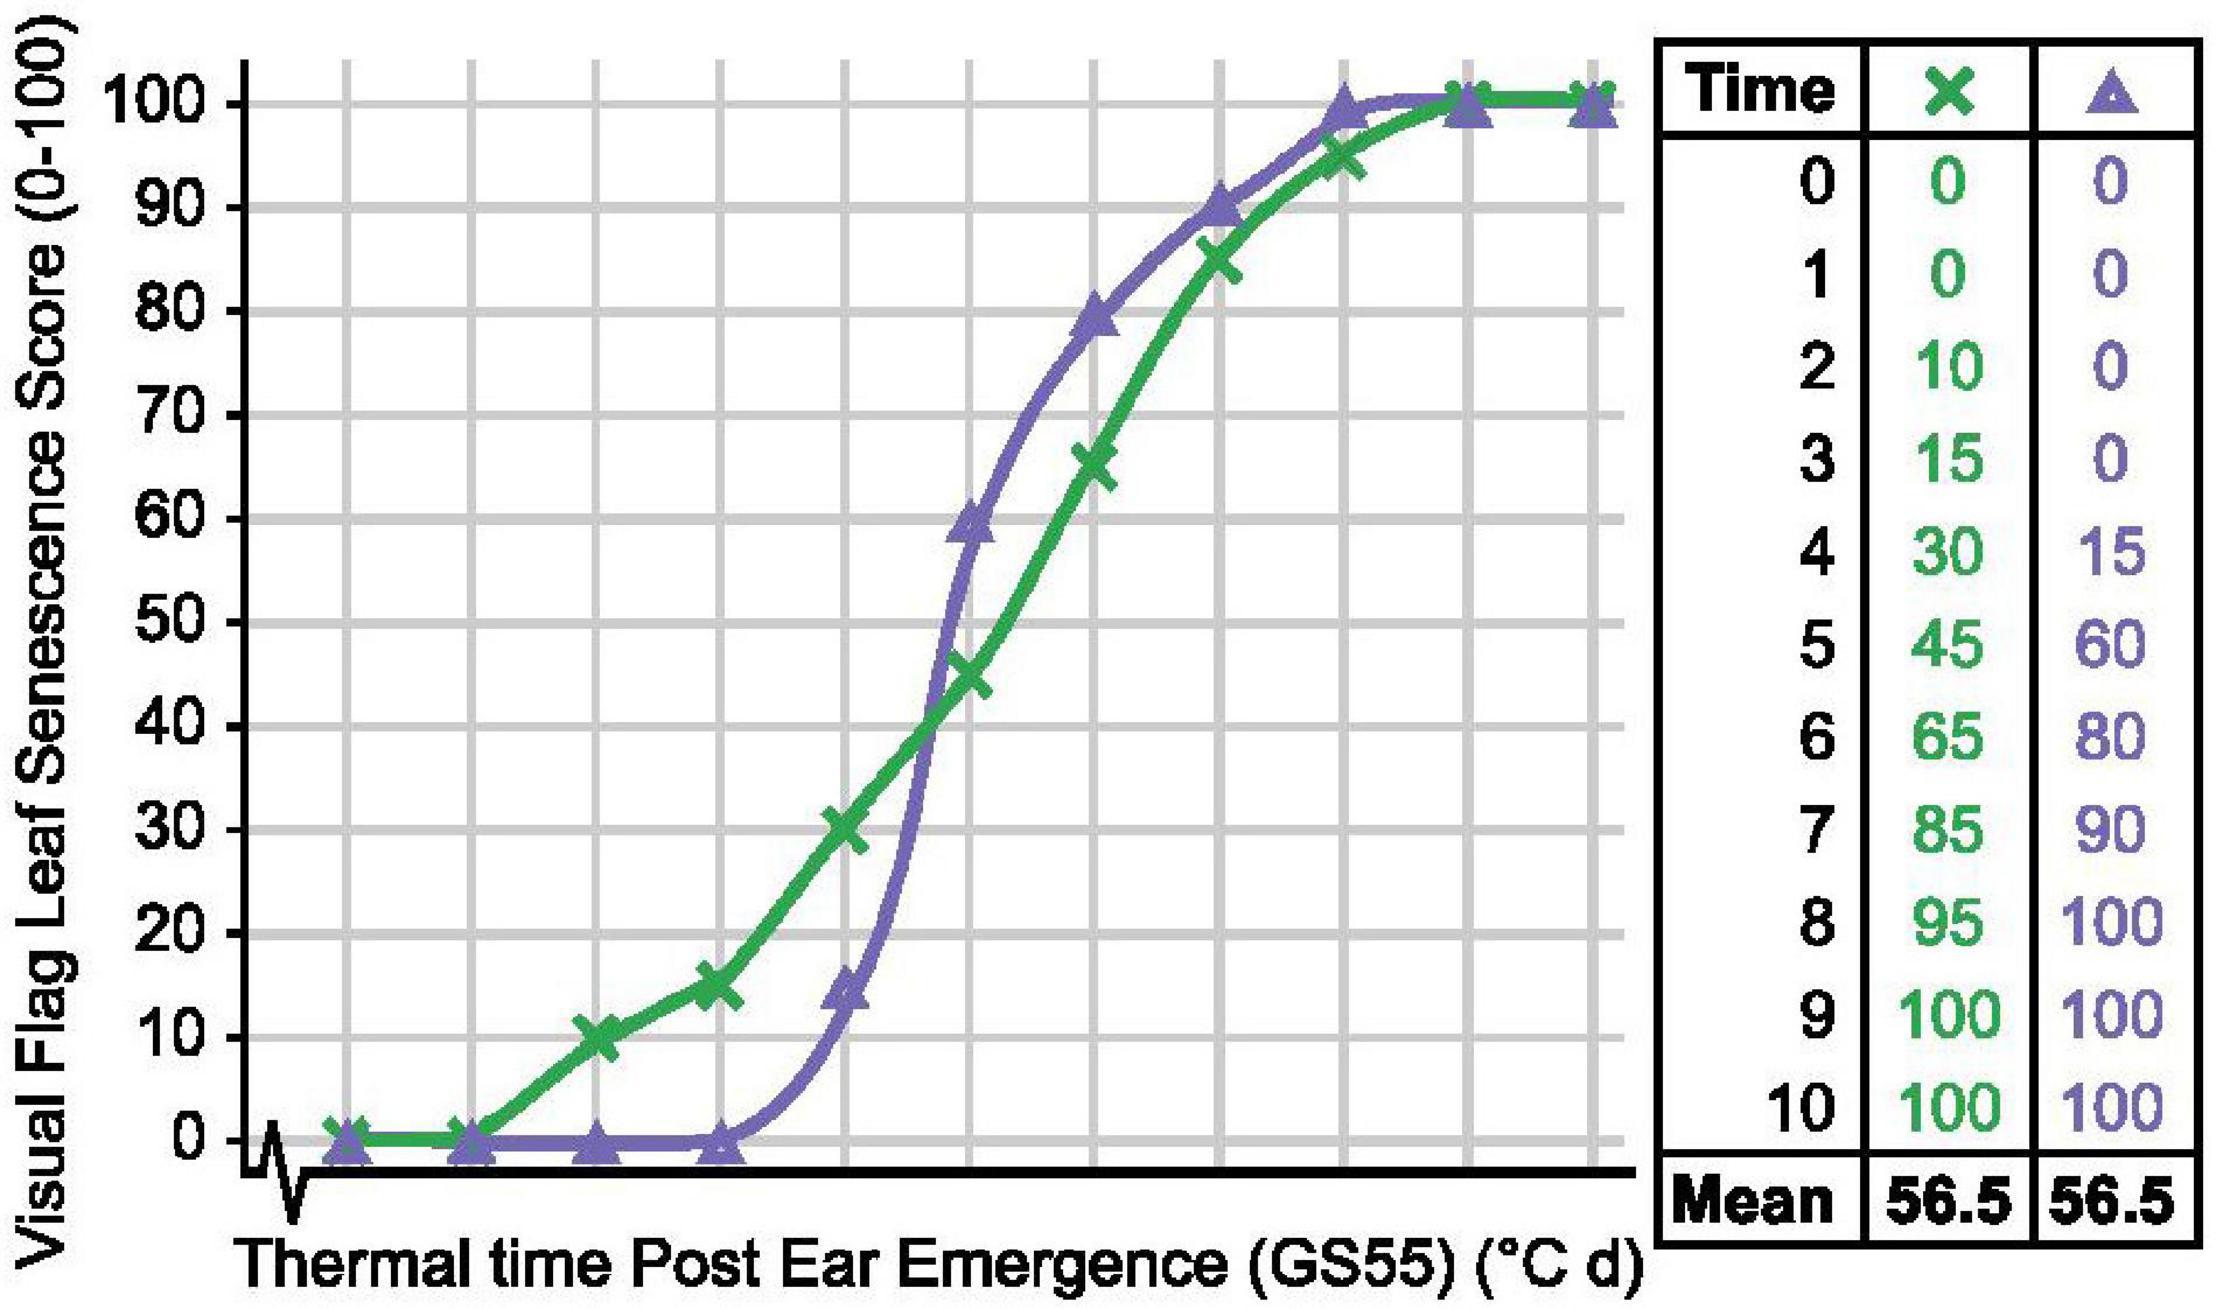
Figure 8. Mean senescence scores cannot always distinguish senescence variation. Senescence duration of line × (green) is prolonged, while onset of senescence is delayed and senescence rate is rapid for line Δ (purple), but their mean senescence scores are the same.
In our study, the metric thermal time to flag leaf senescence score of 70 (TT70) proved most informative when discriminating senescence types. Unlike calculation of mean flag leaf senescence scores (LeafMean), estimation of the thermal time taken to reach different flag leaf senescence scores (TT25, TT30…) was less affected by pre-existing leaf damage resulting from nitrogen splash, leaf tip necrosis, or other damage. Pre-existing damage to flag leaves appears as “noise” during the early stages of senescence, however, following the onset of senescence, clear differences between lines emerge when flag leaf senescence scores range from 40 to 70 (Figure 1B). Depending on the extremity of the senescence phenotypes investigated, metric TT70 may be more informative than the duration of flag leaf senescence (EEtoLeafSen), which is more frequently used when recording senescence variation (Table 1). For example, in mild years plants may not reach terminal senescence, as we observed in 2016, preventing the calculation of EEtoLeafSen. In contrast, TT70 scores can be calculated prior to harvest, increasing the efficiency of phenotypic selection. On a cautionary note, while we identified metrics TT70 and MeanPed as most informative under our conditions, this may be germplasm dependent and not universally true. For example, Shi et al. (2016) observed that T. aestivum cv. Wenmai and cv. Lankaoaizao senesce non-sequentially, whereby flag leaves senesced prior to 2nd leaves, while the peduncles of GPC-1 RNAi lines remained green (Cantu et al., 2011).
A positive relationship between senescence and grain fill duration is often assumed, with grain fill duration and grain weight highly correlated, r = 0.77, P < 0.026 (Dias and Lidon, 2009). A study involving NDVI assessment of the T. aestivum Seri × Babax RIL population identified four QTLs commonly associated with senescence traits, grain fill duration, TGW, and yield located on chromosomes 1B, 2B, 2D, and 4B (Pinto et al., 2016). Meanwhile, QTL analysis of the T. aestivum cv. Spark × Rialto double-haploid population by Simmonds et al. (2014) identified a single QTL on chromosome 6A associated with green canopy duration, TGW, and yield. Using NILs contrasting for Rialto and Spark 6A alleles, yield and senescence traits co-segregated. The reported grain filling extension was associated with earlier flowering and delayed grain maturation, which occur 1 day earlier and ∼2 days later, for Rialto and Spark alleles respectively, not green canopy duration per se (Simmonds et al., 2014).
Differences in grain filling may be environmentally dependent. For example, under glasshouse conditions, no differences in grain maturation were recorded for gpc-1 (NAM-1) mutants despite a delay in flag leaf senescence of 25 days (Simmonds et al., 2014; Borrill et al., 2015), whereas differences were observed among wheat lines carrying NAM-A1 variants in dryland environments (Alhabbar et al., 2018). Conversely, the extended grain fill duration reported for Staygreen A and B, which encode mutations in NAM-A1 and NAM-D1, respectively, was consistent over multiple years (Chapman et al., 2020), contributing to the observed heading-independent grain maturity differences (Figure 7).
The extended photosynthetic duration associated with functional staygreen phenotypes may provide additional resources for grain filling, supporting trait deployment in breeding. Xie et al. (2016) hypothesize that a delay in onset combined with a rapid rate of senescence maximizes grain weight and yield potential, especially as grain filling rate (growing °C days) and grain weight are correlated, r = 0.91, P = 0.002 (Dias and Lidon, 2009). Grain filling rate can be indirectly assessed through scoring senescence progression. For example, Xie et al. (2016) found rates of maximum chlorophyll loss and average grain fill to be correlated, r = 0.27–0.35, P < 0.01, however correlations between senescence metrics and grain fill duration were inconsistent, r = −0.4–0.4, P < 0.01 to P > 0.05. Combined, this emphasizes the need to score both time to terminal senescence and grain maturation, and would confirm the relationship assumed by Lopes and Reynolds (2012) and Pinto et al. (2016). We demonstrate that subjecting grain to thumbnail impressions can sufficiently characterize differences in grain maturation (Figure 7), providing a means of rapid assessment. If an objective assessment of grain maturation is required, we suggest recording the spike moisture content from ∼6 weeks after anthesis as conducted for NAM-1 mutants (Avni et al., 2014).
Time to maximum senescence rate can coincide with maximal grain dimensions (Xie et al., 2015). Therefore, maintaining the synchronicity of senescence and grain filling processes is of concern when identifying or selecting staygreen traits. As photosynthesis terminates halfway through the rapid grain filling phase any delay could reduce the remobilization efficiency, as this marks the point when translocation and remobilization of stored reserves, fructose and sucrose occurs (Takahashi et al., 2001). Phenotyping of flag leaf and peduncle senescence, alongside grain maturity, could deliver insights into the process, and lines displaying “green leaf and ripe ear” phenotypes should be selected against (Figure 3F). Conversely, the grain fill extension reported for Staygreen A and B (Chapman et al., 2020) delayed grain maturation (Figure 7), which could disrupt harvest or adversely affect wheat quality through altering the deposition of triticin, glutenin, and gliadin storage proteins (Takahashi et al., 2001), and requires further investigation.
Staygreen traits are associated with conveying tolerance to heat, drought, and low nitrogen conditions (Gregersen et al., 2013; Jagadish et al., 2015), with trait expression strongly influenced by the environment. For example, of the 19 senescence QTLs mapped for the T. aestivum cv. Ventor × Karl92 RIL population, segregating for temperature responses, only three were environmentally stable (Vijayalakshmi et al., 2010). Individually, these three QTLs explained between 10 and 51% of senescence variation. Conversely, variation explained by the seven and nine senescence QTLs identified exclusively under high or optimal temperature conditions was lower, averaging R2 = 0.18 ± 0.11 and R2 = 0.14 ± 0.07, respectively (Vijayalakshmi et al., 2010). Therefore, screening for senescence traits under different environments may help identify potentially advantageous, stress-adaptive QTLs for use in breeding alongside major stable genetic regulators.
Water limitation also influences senescence. Estimated heritability of senescence traits recorded for the T. aestivum cv. Reeder × cv. Canan RIL population reduced from H2 = 0.78 under irrigated conditions to H2 = 0.51–0.81 when rainfed (Naruoka et al., 2012). Between-year weather variation can help identify putative epistatic interactions as documented during QTL mapping of the T. aestivum cv. Chirya-3 × Sonalika RIL population (Kumar et al., 2010). Kumar et al. (2010) identified an environmentally stable senescence QTL located on chromosome 1AS which, in combination with year-dependent QTLs located on 3BS (2005) and 7DS (2006), accounted for up to 38.7% of staygreen trait variation. While we identified both our staygreen traits as highly environmentally stable (Figure 5), we also recognize the influence of environment, as senescence was accelerated in 2017 and 2018 compared to 2016 due to increased temperature and water limitation (Supplementary Figure 1).
Altogether, these examples illustrate the need for repeated, preferably multi-environment, trialing to assess stress adaptivity or stability of senescence phenotypes. However, within breeding programs, lines are typically selected under high-input conditions, preventing phenotypic expression and selection of potential stress-adaptive staygreen phenotypes. From our experience, multi-environment, multi-year trials allowed us to identify potential penalties associated with the adoption of staygreen traits alongside appropriate target breeding environments. For example, although loss of glume color and grain ripening occurred ahead of flag leaf senescence in 2016 (Figure 3F), supporting non-adoption of staygreen traits (Jenner et al., 1991; Barraclough et al., 2014), results of continental trials identified the trait as stress adaptive. While certain “extreme” staygreen phenotypes may be agronomically unsuitable, obtaining such knowledge helps identify environmental niches for which adoption of staygreen traits could provide maximum benefit.
Improving our understanding of senescence requires adoption of a whole-plant phenotyping approach. When mapping staygreen traits underpinned by NAM-1 mutations, we found TT70 and MeanPed to be the most stable and discriminative metrics. Thumbnail impressions can effectively detect variation in grain maturity associated with senescence traits, providing a rapid means of assessment. In combination, we hope that these insights can help qualify senescence traits, and aid identification and selection of senescence variation for both breeders and researchers alike.
Publicly available datasets were analyzed in this study. Phenotypic data reported in this publication relates to mapping of NAM-1 mutations corresponding to publication Chapman et al. (2020).
EAC, JL, and SG conceived the study. EAC designed and conducted the experiments with supervision from SG and JL. SO developed and maintained RIL populations. Contributions made by JL aided trait assessment and quantification performed by EAC. EAC analyzed the data and wrote the article in correspondence with SG and JL. All authors contributed to the article and approved the submitted version.
This work was funded by the UK Biotechnology and Biological Sciences Research Council (BBSRC) grants (BB/M011216/1). EAC received a BBSRC CASE—Doctoral Training Partnership studentship with additional funding provided by KWS-UK (BB/M011216/1-1654063). The germplasm utilized was developed at John Innes Centre as part of the Wheat Genetic Improvement Network, funded by the UK Department for Environment and Rural Affairs (Defra project code: AR0709).
JL was employed by company KWS UK Limited.
The remaining authors declare that the research was conducted in the absence of any commercial or financial relationships that could be construed as a potential conflict of interest.
We wish to thank JIC and KWS field experimentation teams who made our planned field trials a reality. Statistical analysis was performed following assistance from Luzie Wingen. We thank Sophie Harrington, Philippa Borrill, and Chris Burt for encouraging EAC to share experience of field phenotyping through writing this article, and Gemma Molero for engaging with our ideas. Additional thanks go to Sophie Harrington for providing much-appreciated editorial assistance. The Triticum aestivum cv. Paragon EMS mutant population used was developed by Robert Koebner and Leodie Alibert.
The Supplementary Material for this article can be found online at: https://www.frontiersin.org/articles/10.3389/fpls.2021.638738/full#supplementary-material
Supplementary Figure 1 | Mean daily rainfall and temperature data for field seasons 2016–2018.
Supplementary Table 1 | Year–pairwise senescence metric Spearman’s rank correlations for Staygreen A and Staygreen B RILs.
Adu, M. O., Sparkes, D. L., Parmar, A., and Yawson, D. O. (2011). “Stay green’ in wheat: comparative study of modern bread wheat and ancient wheat cultivars’. J. Agric. Biol. Sci. 6, 16–24.
AHDB (2018). Wheat Growth Guide. Warwickshire: Agriculture and Horticulture Development Board. Available online at: https://projectblue.blob.core.windows.net/media/Default/Imported%20Publication%20Docs/Wheat%20growth%20guide.pdf (accessed July 1, 2018).
Alhabbar, Z., Islam, S., Yang, R., Diepeveen, D., Anwar, M., Balotf, S., et al. (2018). Associations of NAM-A1 alleles with the onset of senescence and nitrogen use efficiency under Western Australian conditions’. Euphytica 214:180. doi: 10.1007/s10681-018-2266-4
Arends, D., Prins, P., Jansen, R. C., and Broman, K. W. (2010). ‘R/qtl: high-throughput multiple QTL mapping’. Bioinformatics 26, 2990–2992. doi: 10.1093/bioinformatics/btq565
Avni, R., Zhao, R., Pearce, S., Jun, Y., Uauy, C., Tabbita, F., et al. (2014). ‘Functional characterization of GPC-1 genes in hexaploid wheat’. Planta 239, 313–324. doi: 10.1007/s00425-013-1977-y
Barraclough, P. B., Lopez-Bellido, R., and Hawkesford, M. J. (2014). ‘Genotypic variation in the uptake, partitioning and remobilisation of nitrogen during grain-filling in wheat’. Field Crops Res. 156, 242–248. doi: 10.1016/j.fcr.2013.10.004
Bates, D., Maechler, M., Bolker, B., Walker, S., Christensen, R. H. B., Singmann, H., et al. (2019). lme4: Linear Mixed-Effects Models using ‘Eigen’ and S4. R package version 1.1-21.
Bogard, M., Jourdan, M., Allard, V., Martre, P., Perretant, M. R., Ravel, C., et al. (2011). ‘Anthesis date mainly explained correlations between post-anthesis leaf senescence, grain yield, and grain protein concentration in a winter wheat population segregating for flowering time QTLs’. J. Exp. Bot. 62, 3621–3636. doi: 10.1093/jxb/err061
Borrill, P., Fahy, B., Smith, A. M., and Uauy, C. (2015). ‘Wheat grain filling is limited by grain filling capacity rather than the duration of flag leaf photosynthesis: a case study using NAM RNAi plants’. PloS ONE 10:e0134947. doi: 10.1371/journal.pone.0134947
Borrill, P., Harrington, S. A., Simmonds, J., and Uauy, C. (2019). ‘Identification of transcription factors regulating senescence in wheat through gene regulatory network modelling’. Plant Physiol. 180, 1740–1755. doi: 10.1104/pp.19.00380
Buchanan-Wollaston, V. (2007). Senescence in Plants’, eLS. Chichester: John Wiley & Sons, Ltd, doi: 10.1002/9780470015902.a0020133
Buchanan-Wollaston, V., Page, T., Harrison, E., Breeze, E., Lim, P. O., Nam, H. G., et al. (2005). ‘Comparative transcriptome analysis reveals significant differences in gene expression and signalling pathways between developmental and dark/starvation-induced senescence in Arabidopsis’. Plant J. 42, 567–585. doi: 10.1111/j.1365-313X.2005.02399.x
Camargo, A. V., Mott, R., Gardner, K. A., Mackay, I. J., Corke, F., Doonan, J. H., et al. (2016). ‘Determining phenological patterns associated with the onset of senescence in a wheat magic mapping population’. Front. Plant Sci. 7:1540. doi: 10.3389/fpls.2016.01540
Cantu, D., Pearce, S. P., Distelfeld, A., Christiansen, M. W., Uauy, C., Akhunov, E., et al. (2011). ‘Effect of the down-regulation of the high Grain Protein Content (GPC) genes on the wheat transcriptome during monocarpic senescence’. BMC Genomics 12:492. doi: 10.1186/1471-2164-12-492
Chapman, E. A., Orford, S., Lage, J., and Griffiths, S. (2020). Delaying or Delivering: Identification of novel NAM-1 alleles which delay senescence to extend grain fill duration of wheat’. bioRxiv[preprint] doi: 10.1101/2020.09.23.307785 bioRxiv2020.09.23.307785,
Christopher, J. T., Christopher, M. J., Borrell, A. K., Fletcher, S., and Chenu, K. (2014). ‘Phenotyping novel stay-green traits to capture genetic variation in senescence dynamics’. Funct. Plant Biol. 41, 1035–1048. doi: 10.1071/FP14052
Christopher, J. T., Christopher, M. J., Borrell, A. K., Fletcher, S., and Chenu, K. (2016). ‘Stay-green traits to improve wheat adaptation in well-watered and water-limited environments’. J. Exp. Bot. 67, 5159–5172. doi: 10.1093/jxb/erw276
Christopher, M., Chenu, K., Jennings, R., Fletcher, S., Butler, D., Borrell, A., et al. (2018). ‘QTL for stay-green traits in wheat in well-watered and water-limited environments’. Field Crops Res. 217, 32–44. doi: 10.1016/J.FCR.2017.11.003
Dias, A. S., and Lidon, F. C. (2009). ‘Evaluation of grain filling rate and duration in bread and durum wheat, under heat stress after anthesis’. J. Agron. Crop Sci. 195, 137–147. doi: 10.1111/j.1439-037X.2008.00347.x
Distelfeld, A., Avni, R., and Fischer, A. M. (2014). ‘Senescence, nutrient remobilization, and yield in wheat and barley’. J. Exp. Bot. 65, 3783–3798. doi: 10.1093/jxb/ert477
Dowle, M., Srinivasan, A., Gorecki, J., Chirico, M., Stetsenko, P., Short, T., et al. (2019). data.table: Extension of ‘Data.Frame’. R Package Version 1.12.0.
Gaju, O., Allard, V., Martre, P., Le Gouis, J., Moreau, D., Bogard, M., et al. (2014). ‘Nitrogen partitioning and remobilization in relation to leaf senescence, grain yield and grain yield and grain nitrogen concentration in wheat cultivars’. Field Crops Res. 155, 213–223. doi: 10.1016/j.fcr.2013.09.003
Gaju, O., Allard, V., Martre, P., Snape, J. W., Heumez, E., LeGouis, J., et al. (2011). ‘Identification of traits to improve the nitrogen-use efficiency of wheat genotypes’. Field Crops Res. 123, 139–152. doi: 10.1016/j.fcr.2011.05.010
Gelang, J., Pleijel, H., Sild, E., Danielsson, H., Younis, S., and Selldén, G. (2000). ‘Rate and duration of grain filling in relation to flag leaf senescence and grain yield in spring wheat (Triticum aestivum) exposed to different concentrations of ozone’. Physiol. Plant. 110, 366–375. doi: 10.1111/j.1399-3054.2000.1100311.x
Gregersen, P. L., Culetic, A., Boschian, L., and Krupinska, K. (2013). ‘Plant senescence and crop productivity’. Plant Mol. Biol. 82, 603–622. doi: 10.1007/s11103-013-0013-8
Harrington, S. A., Cobo, N., Karafiátová, M., Doležel, J., Borrill, P., and Uauy, C. (2019a). ‘Identification of a dominant chlorosis phenotype through a forward screen of the triticum turgidum cv. kronos TILLING Population. Front. Plant Sci. 10:963. doi: 10.3389/fpls.2019.00963
Harrington, S. A., Overend, L. E., Cobo, N., Borrill, P., and Uauy, C. (2019b). ‘Conserved residues in the wheat (Triticum aestivum) NAM-A1 NAC domain are required for protein binding and when mutated lead to delayed peduncle and flag leaf senescence’. BMC Plant Biol. 19:407. doi: 10.1186/s12870-019-2022-5
Jagadish, K. S. V., Kavi Kishor, P. B., Bahuguna, R. N., von Wirén, N., and Sreenivasulu, N. (2015). ‘Staying alive or going to die during terminal senescence-an enigma surrounding yield stability.’. Front. Plant Sci. 6:1070. doi: 10.3389/fpls.2015.01070
Jenner, C., Ugalde, T., and Aspinall, D. (1991). ‘The physiology of starch and protein deposition in the endosperm of wheat’. Funct. Plant Biol. 18:211. doi: 10.1071/pp9910211
Kipp, S., Mistele, B., and Schmidhalter, U. (2014). ‘Identification of stay-green and early senescence phenotypes in high-yielding winter wheat, and their relationship to grain yield and grain protein concentration using high-throughput phenotyping techniques’. Funct. Plant Biol. 41, 227–235. doi: 10.1071/FP13221
Kitonyo, O. M., Sadras, V., Zhou, Y., and Denton, M. (2017). ‘Evaluation of historic Australian wheat varieties reveals increased grain yield and changes in senescence patterns but limited adaptation to tillage systems’. Field Crops Res. 206, 65–73. doi: 10.1016/j.fcr.2017.02.017
Kumar, U., Joshi, A. K., Kumari, M., Paliwal, R., Kumar, S., and Röder, M. S. (2010). ‘Identification of QTLs for stay green trait in wheat (Triticum aestivum L.) in the “Chirya 3” × “Sonalika” population’. Euphytica 174, 437–445. doi: 10.1007/s10681-010-0155-6
Kuznetsova, A., Brockhoff, P. B., and Christensen, R. H. B. (2017). ‘lmertest package: tests in linear mixed effects models’. J. Stat. Softw. 82, 1–26. doi: 10.18637/jss.v082.i13
Livingston, D. P., Gildow, F. E., and Liu, S. Y. (1998). ‘Barley yellow dwarf virus: Effects on carbohydrate metabolism in oat (Avena sativa) during cold hardening’. New Phytol. 140, 699–707. doi: 10.1046/j.1469-8137.1998.00308.x
Lopes, M. S., and Reynolds, M. P. (2012). ‘Stay-green in spring wheat can be determined by spectral reflectance measurements (normalized difference vegetation index) independently from phenology’. J. Exp. Bot. 63, 3789–3798. doi: 10.1093/jxb/ers071
Naruoka, Y., Sherman, J., Lanning, S. P., Blake, N. K., Martin, J. M., and Talbert, L. E. (2012). ‘Genetic analysis of green leaf duration in spring wheat’. Crop Sci. 52, 99–109. doi: 10.2135/cropsci2011.05.0269
Nehe, A. S., Misra, S., Murchie, E. H., Chinnathambi, H., and Foulkes, M. J. (2018). ‘Genetic variation in N-use efficiency and associated traits in Indian wheat cultivars’. Field Crops Res. 225, 152–162. doi: 10.1016/j.fcr.2018.06.002
Parajuli, S., Br, O., and Go, F. (2018). ‘Quantification of secondary traits for drought and low nitrogen stress tolerance in inbreds and hybrids of maize (Zea mays L.)’. J. Plant Genet. Breed. 2, 106.
Pask, A. J. D., Pietragalla, J., Mullan, D., and Reynolds, M. P. (2012). Physiological Breeding II: a Field Guide to Wheat Phenotyping’. CIMMYT. Available online at: http://repository.cimmyt.org/xmlui/handle/10883/1288 (accessed: 30 March 2016).
Pearce, S., Tabbita, F., Cantu, D., Buffalo, V., Avni, R., Vazquez-Gross, H., et al. (2014). ‘Regulation of Zn and Fe transporters by the GPC1 gene during early wheat monocarpic senescence.’. BMC Plant Biol. 14:368. doi: 10.1186/s12870-014-0368-2
Pinto, R. S., Lopes, M. S., Collins, N. C., and Reynolds, M. P. (2016). ‘Modelling and genetic dissection of staygreen under heat stress’. Theor. Appl. Genet. 129, 2055–2074. doi: 10.1007/s00122-016-2757-4
R Core Team. (2018). R: The R Project for Statistical Computing. Vienna: R Foundation for Statistical Computing.
Raven, J. A., and Griffiths, H. (2015). ‘Photosynthesis in reproductive structures: Costs and benefits’. J. Exp. Bot. 66, 1699–1705. doi: 10.1093/jxb/erv009
R Studio team. (2015). RStudio: Integrated Development Environment for RStudio. Boston, MA: RStudio, Inc. Available at: http://www.rstudio.com (accessed October 15, 2015).
Senapati, N., Stratonovitch, P., Paul, M. J., and Semenov, M. A. (2019). ‘Drought tolerance during reproductive development is important for increasing wheat yield potential under climate change in Europe’. J. Exp. Bot. 70, 2549–2560. doi: 10.1093/jxb/ery226
Shi, H., Wang, B., Yang, P., Li, Y., and Miao, F. (2016). ‘Differences in sugar accumulation and mobilization between sequential and non-sequential senescence wheat cultivars under natural and drought conditions’. PloS One 11:e0166155. doi: 10.1371/journal.pone.0166155
Shrestha, R., Matteis, L., Skofic, M., Portugal, A., McLaren, G., Hyman, G., et al. (2012). ‘Bridging the phenotypic and genetic data useful for integrated breeding through a data annotation using the Crop Ontology developed by the crop communities of practice’. Front. Physiol. 3:326. doi: 10.3389/fphys.2012.00326
Simmonds, J., Scott, P., Leverington-Waite, M., Turner, A. S., Brinton, J., Korzun, V., et al. (2014). ‘Identification and independent validation of a stable yield and thousand grain weight QTL on chromosome 6A of hexaploid wheat (Triticum aestivum L.).’. BMC Plant Biol. 14:191. doi: 10.1186/s12870-014-0191-9
Takahashi, T., Chevalier, P., and Rupp, R. (2001). ‘Plant production science storage and remobilization of soluble carbohydrates after heading in different plant parts of a winter wheat cultivar’. Plant Prod. Sci. 4, 160–165. doi: 10.1626/pps.4.160
Thomas, H., and Ougham, H. (2014). ‘The stay-green trait.’. J. Exp. Bot. 65, 3889–3900. doi: 10.1093/jxb/eru037
Uauy, C., Brevis, J. C., and Dubcovsky, J. (2006b). ‘The high grain protein content gene Gpc-B1 accelerates senescence and has pleiotropic effects on protein content in wheat’. J. Exp. Bot. 57, 2785–2794. doi: 10.1093/jxb/erl047
Uauy, C., Distelfeld, A., Fahima, T., Blechl, A., and Dubcovsky, J. (2006a). A NAC Gene regulating senescence improves grain protein, zinc, and iron content in wheat. Science 314, 1298–1301. doi: 10.1126/science.1133649
Verma, V., Foulkes, M. J., Worland, A. J., Sylvester-Bradley, R., Caligari, P. D. S., and Snape, J. (2004). Mapping quantitative trait loci for flag leaf senescence as a yield determinant in winter wheat under optimal and drought-stressed environments. Euphytica 135, 255–263. doi: 10.1023/B:EUPH.0000013255.31618.14
Vijayalakshmi, K., Fritz, A. K., Paulsen, G. M., Bai, G., Pandravada, S., and Gill, B. (2010). ‘Modeling and mapping QTL for senescence-related traits in winter wheat under high temperature’. Mol. Breed. 26, 163–175. doi: 10.1007/s11032-009-9366-8
Voss-Fels, K. P., Stahl, A., Wittkop, B., Lichthardt, C., Nagler, S., Rose, T., et al. (2019). ‘Breeding improves wheat productivity under contrasting agrochemical input levels’. Nat. Plants 5, 706–714. doi: 10.1038/s41477-019-0445-5
Wickham, H. (2015). plyr: Tools for Splitting, Applying and Combining Data. R package version 1.8.3.
Wickham, H., Chang, W., Henry, L., Pedersen, T. L., Takahash, K., Wilke, C., et al. (2018a). ggplot2: Create Elegant Data Visualisations Using the Grammar of Graphics Description. R Package Version 3.1.0.
Wickham, H., François, R., Henry, L., and Müller, K. (2018b). Dplyr: a grammar of data manipulation. R package version 0.7.8.
Wickham, H., Henry, L., and RStudio. (2019). Tidyr: Easily Tidy Data with ‘spread()’ and ‘gather()’ Functions. R Package version 0.8.3.
Wiegand, C. L., and Cuellar, J. A. (1981). ‘Duration of grain filling and kernel weight of wheat as affected by temparature’. Crop Sci. 21:95. doi: 10.2135/cropsci1981.0011183X001100010027x
Xie, Q., Mayes, S., and Sparkes, D. L. (2015). ‘Carpel size, grain filling, and morphology determine individual grain weight in wheat’. J. Exp. Bot. 66, 6715–6730. doi: 10.1093/jxb/erv378
Xie, Q., Mayes, S., and Sparkes, D. L. (2016). ‘Early anthesis and delayed but fast leaf senescence contribute to individual grain dry matter and water accumulation in wheat’. Field Crops Res. 187, 24–34. doi: 10.1016/j.fcr.2015.12.009
Zadoks, J. C., Chang, T. T., and Konzak, C. F. (1974). ‘A decimal code for the growth stages of cereals’. Weed Res. 14, 415–421. doi: 10.1111/j.1365-3180.1974.tb01084.x
Zhou, B., Serret, M. D., Elazab, A., Bort Pie, J., Araus, J. L., Aranjuelo, I., et al. (2016). ‘Wheat ear carbon assimilation and nitrogen remobilization contribute significantly to grain yield’. J. Integr. Plant Biol. 58, 914–926. doi: 10.1111/jipb.12478
Keywords: senescence, phenotyping, selection, staygreen, grain development, peduncle, leaves, quantification
Citation: Chapman EA, Orford S, Lage J and Griffiths S (2021) Capturing and Selecting Senescence Variation in Wheat. Front. Plant Sci. 12:638738. doi: 10.3389/fpls.2021.638738
Received: 07 December 2020; Accepted: 12 March 2021;
Published: 16 April 2021.
Edited by:
Thomas Miedaner, University of Hohenheim, GermanyReviewed by:
R. Suzuky Pinto, Instituto Tecnológico de Sonora (ITSON), MexicoCopyright © 2021 Chapman, Orford, Lage and Griffiths. This is an open-access article distributed under the terms of the Creative Commons Attribution License (CC BY). The use, distribution or reproduction in other forums is permitted, provided the original author(s) and the copyright owner(s) are credited and that the original publication in this journal is cited, in accordance with accepted academic practice. No use, distribution or reproduction is permitted which does not comply with these terms.
*Correspondence: Elizabeth A. Chapman, RWxpemFiZXRoLmNoYXBtYW5AamljLmFjLnVr; Simon Griffiths, U2ltb24uZ3JpZmZpdGhzQGppYy5hYy51aw==
Disclaimer: All claims expressed in this article are solely those of the authors and do not necessarily represent those of their affiliated organizations, or those of the publisher, the editors and the reviewers. Any product that may be evaluated in this article or claim that may be made by its manufacturer is not guaranteed or endorsed by the publisher.
Research integrity at Frontiers
Learn more about the work of our research integrity team to safeguard the quality of each article we publish.