
94% of researchers rate our articles as excellent or good
Learn more about the work of our research integrity team to safeguard the quality of each article we publish.
Find out more
ORIGINAL RESEARCH article
Front. Plant Sci. , 23 February 2021
Sec. Plant Breeding
Volume 12 - 2021 | https://doi.org/10.3389/fpls.2021.626811
This article is part of the Research Topic Breeding Innovations in Underutilized Temperate Fruit Trees View all 11 articles
 Marianella Quezada1
 Rodrigo Rampazo Amadeu2
 Beatriz Vignale3
 Danilo Cabrera4
 Clara Pritsch1
 Antonio Augusto Franco Garcia2*
Acca sellowiana, known as feijoa or pineapple guava, is a diploid, (2n = 2x = 22) outcrossing fruit tree species native to Uruguay and Brazil. The species stands out for its highly aromatic fruits, with nutraceutical and therapeutic value. Despite its promising agronomical value, genetic studies on this species are limited. Linkage genetic maps are valuable tools for genetic and genomic studies, and constitute essential tools in breeding programs to support the development of molecular breeding strategies. A high-density composite genetic linkage map of A. sellowiana was constructed using two genetically connected populations: H5 (TCO × BR, N = 160) and H6 (TCO × DP, N = 184). Genotyping by sequencing (GBS) approach was successfully applied for developing single nucleotide polymorphism (SNP) markers. A total of 4,921 SNP markers were identified using the reference genome of the closely related species Eucalyptus grandis, whereas other 4,656 SNPs were discovered using a de novo pipeline. The individual H5 and H6 maps comprised 1,236 and 1,302 markers distributed over the expected 11 linkage groups, respectively. These two maps spanned a map length of 1,593 and 1,572 cM, with an average inter-marker distance of 1.29 and 1.21 cM, respectively. A large proportion of markers were common to both maps and showed a high degree of collinearity. The composite map consisted of 1,897 SNPs markers with a total map length of 1,314 cM and an average inter-marker distance of 0.69. A novel approach for the construction of composite maps where the meiosis information of individuals of two connected populations is captured in a single estimator is described. A high-density, accurate composite map based on a consensus ordering of markers provides a valuable contribution for future genetic research and breeding efforts in A. sellowiana. A novel mapping approach based on an estimation of multipopulation recombination fraction described here may be applied in the construction of dense composite genetic maps for any other outcrossing diploid species.
Acca sellowiana (Berg.) Burret, commonly known as feijoa or pineapple guava, is an agronomically promising fruit tree species, native to Uruguay and southern Brazil. This diploid (2n = 2x = 22) outcrossing species presents a small genome (245 Mb) (da Costa et al., 2008) and the basic haploid number of n = 11, largely conserved in the Myrtaceae family (Grattapaglia et al., 2012). The species stands out in the novel market of health-promoting and functional food due to the nutraceutical value of its fruits, rich in vitamin C (28 mg/100 g), hydrocarbons, minerals, iodine (3 mg/100 g), and bioflavonoids (Weston, 2010). However, feijoa can still be considered a minor crop due to its seasonal presence on the market and a small cultivation area worldwide. The development of new cultivars with superior fruit quality traits and adapted for new environments is needed to accelerate the commercial exploitation of the species. For fruit tree species, like feijoa, the breeding process is slow and costly because of the long juvenile period, extensive phenotyping cost, and limited field space (Byrne, 2012). For this reason, the development of genetic and genomic resources, such as genetic maps, represents a suitable strategy to overcome these limitations and speed up the breeding progress.
As a minor crop, genomic resources in A. sellowiana are limited and not yet useful in breeding programs. Few studies document the molecular diversity of the species using low-throughput molecular markers (Dettori and Palombi, 2000; dos Santos et al., 2007; Pasquariello et al., 2015; Donazzolo et al., 2020; Saifert et al., 2020) and a limited number of molecular markers have been specifically designed for A. sellowiana (dos Santos et al., 2008; Klabunde et al., 2014). Amplified fragment length polymorphisms (AFLP), intersimple sequence repeat (ISSR), and a small number of simple sequence repeats (SSR) markers were used in the construction on the first genetic map of the species (Quezada et al., 2014). This map along with those developed for the species Psidium guajava (Padmakar et al., 2015) represent the only ones developed for fruit species within the Myrtaceae family. With the advance of new sequencing technologies, single nucleotide polymorphisms (SNPs) have become the most useful type of marker for genetic analysis. The next-generation sequencing (NGS) technology coupled with enzyme-based complexity reduction and DNA barcoding have been used to simultaneously discover and genotype a large number of SNPs in a single experiment (Baird et al., 2008; Elshire et al., 2011). This low cost strategy, implemented in protocols such as genotyping by sequencing (GBS) (Elshire et al., 2011), provides a fast, efficient, and cost-effective strategy to obtain a significant number of markers. It represent an invaluable asset for minor or underutilized crops, such as A. sellowiana, with relatively few genomic and genetic resources. Using SNPs from GBS, high-density linkage maps for many commercial fruit tree species (Barba et al., 2014; Gardner et al., 2014; Bielenberg et al., 2015) as well as for minor crops have been developed (Ward et al., 2013; Covarrubias-Pazaran et al., 2016).
High-density genetic maps are extremely valuable tools to investigate the composition and organization of genomes for comparative genetic mapping analysis, chromosome-based genome assembly, physical and genetic map integration, and candidate gene/QTL cloning (Bartholomé et al., 2014; Mathew et al., 2014; Fierst, 2015; Guajardo et al., 2015; Li et al., 2017; Jaganathan et al., 2020). Genetic maps are also useful tools in breeding programs, fundamentally to establish associations between molecular markers and agronomical traits, providing the basis for future strategies of QTL identification and marker-assisted selection (MAS) (Troggio et al., 2012). For outcrossing species, genetic maps are typically based on single full-sib mapping populations derived from crosses of two highly heterozygous parents. The pseudo-test cross strategy was first developed to construct genetic maps in these populations. In this strategy, markers heterozygous only in one parent, therefore segregating in a 1:1 ratio, are used to generate two separate individual linkage maps (Grattapaglia and Sederoff, 1994). Later, methods using information from all markers simultaneously (considering dominant and codominant markers, heterozygous either in one or both parents, with segregation ratios 1:1:1:1, 3:1, 1:2:1, and 1:1) were developed to construct integrated genetic linkage maps (Maliepaard et al., 1997; Wu et al., 2002a,b). The ONEMAP R (Margarido et al., 2007) package implements the maximum likelihood approach to simultaneously estimate linkage and linkage phases between markers; in addition, it provides a multipoint estimation for the recombination fraction using a hidden Markov model (HMM) (Wu et al., 2002b), which is a reliable procedure (Mollinari et al., 2009). This approach was successfully applied in the construction of integrated genetic maps for several outcrossing species (Palhares et al., 2012; Pereira et al., 2013; Quezada et al., 2014; Balsalobre et al., 2017).
The construction of accurate genetic maps faces two main difficulties. First, it is necessary to have a high number of polymorphic markers to obtain a comprehensive coverage of the genome. Second, large mapping populations need to be developed to accurately estimate genetic distances. Presently, developing a large number of markers is not a limiting factor, even for species with few genetic and genomic resources (Davey et al., 2011). However, most of the mapping populations of fruit trees that have been developed in breeding programs have a small to medium progeny size because of the high cost of maintaining these populations and the limited orchard space (Peace and Norelli, 2009). Capitalizing on existing breeding-mapping populations provides an opportunity to develop genetic maps including information of multiple populations, and to overcome the limitations of a reduced number of recombination events captured in single mapping populations. The integration of single-population genetic maps into a composite map improves the accuracy and resolution of maps by correcting the order and position of markers, increasing genome coverage, and filling out genomic regions lacking polymorphic markers in specific crosses (Khan et al., 2012; Pootakham et al., 2015). Moreover, composite genetic maps enable a more precise estimation of QTL effects and positions (Di Pierro et al., 2016) as well as facilitates the transfer of marker information and genetic predictions between populations (Kuhn et al., 2017). Many strategies have been proposed to construct consensus composite maps applied to outcrossing species (Khan et al., 2012; Pootakham et al., 2015; Bodénès et al., 2016; Schlautman et al., 2017). In some cases, the recombination fraction is estimated combining all genotypic data sets from multiple populations (de Givry et al., 2005; Van Ooijen, 2006), whereas in others, map integration is achieved based on the marker order and distances from individual maps (Wu et al., 2011; Endelman and Plomion, 2014). The inability to solve inconsistencies or ordering conflicts between maps as well as inflated genetic distances can be considered the main limitations in both approaches (Khan et al., 2012).
The objective of this study was to develop a reference and composite linkage genetic map for A. sellowiana, integrating the genetic information from two connected F1 populations. For this purpose, two mapping populations segregating for fruit quality traits with the same female parent were used. For the first time in the species, a high-throughput GBS approach was successfully applied to identify SNP markers distributed throughout the genome. A new statistical model was implemented into ONEMAP (Margarido et al., 2007) and used to build a composite map using information from multiparental outcrossing populations. The two saturated individual genetic maps and the composite one provide a framework for future genetic and genomic studies, and they will be useful for future studies of marker-trait association and QTL mapping, which in turn will speed up the breeding process in A. sellowiana.
Two full-sib F1 populations genetically connected by a common parental genotype and segregating for relevant fruit quality traits were used to construct an integrated composite map. These populations were generated by the crossing of non-inbred clones TCO × BR (H5 population) and TCO × DP (H6 population), and consist of 160 and 184 genotypes, respectively. TCO was used as female parent in both crosses. The three parental genotypes were chosen on the basis of their agronomic features: TCO, collected from the wild, has small fruits with tasty and smooth pulp, as well as a thin light-green skin; BR, collected from a commercial orchard, has large fruits with tasteless pulp and a rough, thick, dark-green skin; DP, collected from a commercial orchard has a high yield of medium size fruits, and a rough, medium-thick, dark-green skin. The mapping populations were developed in 2008 by the Native Fruits Breeding Program (Universidad de la República (UdelaR) and Instituto Nacional de Investigación Agropecuaria (INIA), Uruguay). H5 population was planted in the Experimental Station Salto of Facultad de Agronomía-UdelaR, Uruguay (31°19′ S, 57°41′ W), whereas H6 population was planted in the Experimental Station Salto Grande of INIA, Uruguay (31°25′ S, 57°37′ W).
Leaf material was collected from a total of 344 individuals, and maintained in paper bags with silica gel at −20° until DNA extraction. Genomic DNA was extracted using DNeasy Plant Kit (Qiagen, Germantown, MD, USA) according to the manufacturer's protocol. DNA quality was checked by electrophoresis on 0.8% agarose gel and quantified by NanoDrop ND-1000 spectrophotometer (NanoDrop Technologies, Wilmington, DE, USA). GBS libraries were prepared according to the original GBS protocol (Elshire et al., 2011) in the Institute for Genomic Diversity (Cornell University, Ithaca, NY, USA). For optimization of the GBS protocol, three different restriction enzymes were compared. Test libraries were prepared separately with the five-cutter ApeKI, and six-cutter EcoT22I and PstI. The fragment size distribution for each test library was evaluated using an Experion system (Bio-Rad, Hercules, CA, USA). Both six-cutter enzymes produced the smallest fragment pool (adequate for higher SNP sequencing coverage), but the EcoT22I library contained a detectable amount of repetitive DNA. Thus, the library derived from PstI was selected as it comprised the largest number of fragments minor to 500 bp, and presented a smooth profile for fragment size distribution indicative of very low content of repetitive DNA. DNA samples and blank negative controls were prepared in two 192-plex libraries and were sequenced (single-end reads of 100 bp in length) twice in a HiSeq2000 sequencer (Illumina R Inc., San Diego, CA, USA). To guarantee a satisfactory coverage and confidence in calling heterozygous genotypes, the three parental genotypes had 12 samples each, and all the samples reached a coverage equivalent to 96-plex.
The quality of the raw sequence (per base sequence quality, average read quality score, per base N content) was evaluated using the FASTQC V0.11.5 (http://www.bioinformatics.babraham.ac.uk/projects/fastqc). For SNP calling, two strategies implemented in the TASSEL GBS software were employed comprising the Discovery pipeline using a reference genome (TASSEL V4.0) as well as the UNEAK network pipeline (TASSEL V3.0) (Lu et al., 2013; Glaubitz et al., 2014).
Raw sequences were filtered, discarding reads lacking the barcode, not having the expected PstI cut-site, or containing uncalled bases (i.e., Ns) within the first 64 bp subsequent to the barcode. The barcodes was removed in the raw sequences and the remainder of the sequences trimmed to 64 bases. Filtered reads were grouped in tags, and only those with a minimum coverage depth of 5 were retained (parameter -c 5 at the MERGETAXATAGCOUNTPLUGIN step). For the Discovery pipeline, tags were aligned to the E. grandis reference genome (E. grandis v1.0, JGI, http://www.phytozome.net) using BOWTIE V1.2.0 (Langmead and Salzberg, 2012) with default parameters. The E. grandis genome stands out as the reference genome for the Myrtaceae family (Grattapaglia et al., 2012).
In the UNEAK strategy, tags were aligned to each other and only a single base-pair mismatch was considered. Due to the presence of repeated or paralogous sequences in the genome, many tag networks are generated. These networks were filtered (error tolerance rate set at 0.03) and only reciprocal tags were maintained representing potential SNPs. Discovery and UNEAK data were exported as vcf files (information-rich variant call format) where the read depth of the reference and alternative allele is saved (Danecek et al., 2011). SNP markers identified by the Discovery strategy were denoted as “Eg” followed by the chromosome number and the position (bp) on the E. grandis reference genome. SNPs identified using the UNEAK pipeline were named as “Un1” plus a number referring to the tags network. Redundant markers found in both Discovery and UNEAK pipelines were removed from UNEAK data set, and assigned both Discovery and UNEAK identification (e.g., *Eg8_53239405:*Un1_5092215). Consequently, when total number of mapped markers is reported, redundant markers are counted once.
A quantitative genotype calling was performed for each population separately using SUPERMASSA software (Serang et al., 2012). For genotype calling, this software considers the expected allele distribution in an F1 population, as well as the relative site coverage (read counts) of each allele (Garcia et al., 2013). In a previous step, markers were filtered out for quality; only biallelic markers with less than 25% of missing data were retained. The F1 segregation model with diploid level was fitted in SUPERMASSA, where each of the 12 replicates of parental genotypes were analyzed separately, to provide additional constraints during estimation (Pereira et al., 2018). Following the recommendations of (Mollinari and Serang, 2015), SUPERMASSA naive posterior report threshold was set to zero and individual posterior probability values were estimated. The median of all individual posterior probabilities was used as a quality control, so only SNPs with posterior values higher than 0.8 were selected. The SUPERMASSA vcf file output was formatted for mapping purposes using VCFR (Knaus and Grünwald, 2017) and ONEMAP (Margarido et al., 2007) R packages (R Development Core Team, 2017), following the instructions given in the ONEMAP software tutorial (http://augustogarcia.me/onemap/vignettes_highres/Outcrossing_Populations.html#importing-data). Following the notation of (Wu et al., 2002a), markers were classified into four groups (“A-D”) according to their respective cross type. For GBS-SNP markers in an F1 population, only three marker cross types are informative for genetic map construction: “B3.7” (“ab” × “ab”), “D1.10” (“ab” × “aa”), and “D2.15” (“aa” × “ab”). The “D” group comprises markers segregating in a 1:1 ratio, i.e., heterozygous in only one parent, also called testcross markers. The “B3.7” markers are heterozygous and symmetric in both parents, with an expected 1:2:1 segregation ratio. In addition, for markers segregating on both populations, five new configuration types were defined, considering the simultaneous segregation pattern. If the common maternal genotype is heterozygous for a locus (“ab”), the paternal genotype could be heterozygous in both populations (“ab” × “ab”/“ab” × “ab”, “B3.7-B3.7”), only heterozygous in H5 population (“ab” × “ab”/“ab” × “aa,” “B3.7”-“D1.10”), only heterozygous in H6 population (“ab” × “aa”/“ab” × “ab,” “D1.10”-“B3.7”) or homozygous in both populations (“ab” × “aa”/“ab” × “aa,” “D1.10”-“D1.10”). For markers homozygous in the female parent, the only possible configuration is that the paternal genotypes were heterozygous in both populations (“aa” × “ab”/“aa” × “ab,” “D2.15”-“D2.15”), or otherwise there is no information to integrate the populations.
For each population, a data set including the SNPs identified by Discovery and UNEAK pipelines was generated. For H5 population, 493 previously identified markers (ISSR, AFLP, and SSR) were also included (Quezada et al., 2014). Integrated genetic maps for H5 and H6 populations were constructed using ONEMAP (Margarido et al., 2007) R package (current version available at https://github.com/augusto-garcia/onemap). This software implement the method proposed by Wu et al. (2002a,b) for simultaneous multipoint estimation of the recombination fraction and linkage phases between markers. Using a multipoint approach, that uses information from multiple markers to estimate the recombination fractions, the most adjacent informative markers fill the lack of information in markers with missing data. Considering that both populations have a comparable number of individuals and genotyped markers, the same procedure was applied to construct both maps.
First, the segregation of each marker was evaluated for goodness-of-fit to the expected Mendelian segregation ratio by a chi-square test, followed by a Bonferroni correction for multiple testing considering 0.05 the overall significance level. Two-point linkage analysis was carried out between all pairs of markers using the RF_2PTS command. Linkage groups (LGs) were established with a logarithm of the odds (LOD) score of 7.5 (estimated value based on the number of two-point tests and multiple test correction) and a maximum recombination fraction of 0.35. Recombination frequency was converted to genetic map distances (cM) using the Kosambi function (Kosambi, 1944). To order groups, the ORDER_SEQ function was used; this selects a subset of informative markers (6–7 markers), wherein the remaining markers were introduced. A framework map was evaluated, and markers exhibiting a suspect position (ordering problems), producing gaps at the ends of the groups or inflating LGs size were removed. Once the framework map presents a reliable initial order, the TRY_SEQ algorithm (Lander and Green, 1987) was used to integrate previously removed markers and also markers that remained unmapped. Incorrect allocation of markers was visually inspected using a heatmap plot (graphical representation of the recombination fraction and LOD score between markers). Considering that the GBS-SNP markers could have genotyping errors, a probability of 0.05 (default = 0.01) of error was considered to construct the genetic maps. The RIPPLE algorithm was used to verify alternative local orders (Lander and Green, 1987). LGs were numbered according to the chromosome number of E. grandis based on the location of markers identified using this genome as reference. Finally, the linkage maps were drawn using the MAPCHART V2.3 software (Voorrips, 2002).
A new approach to construct a composite genetic map using the information of the two connected populations was developed. The proposed model assumes a homogeneous recombination fraction between populations, which is estimated using the segregation data for both populations simultaneously. Therefore, this method will have a higher statistical power, resulting in more accurate estimates of markers distances and order.
To build a composite genetic map, H5 and H6 individual integrated genetic maps were compared to identify common markers. These markers were identified by name, considering that SNP calling was performed on the whole data set. For these markers, the location in the same LG as well as the marker order was registered in both H5 and H6 maps. A new data set for each LG was created, containing information only of the shared markers presented in homologous LGs.
The two-point recombination fraction between common markers in each LG was estimated using the segregation data of the two populations simultaneously. The maximum likelihood estimator of the recombination fractions and LOD score formulas were adapted from Maliepaard et al. (1997), only for the marker configurations present in the data. To estimate recombination fractions in F1 populations, estimates of linkage phase between markers is necessary. Considering two consecutive markers in a homologous chromosome, the alleles of a pair of loci can be present at coupling (C) or repulsion (R) phase configuration. Because in our populations the same female parental genotype is shared, the linkage phase of markers on this parent was equal in both crosses. Thus, considering simultaneously the crosses “TCO × BR” and “TCO × DP,” eight linkage phase assignments were evaluated (f and m indicated female and male parent, respectively): (i) CfCm-CfCm, (ii) CfCm-CfRm, (iii) CfRm-CfCm, (iv) CfRm-CfRm, (v) RfCm-RfCm, (vi) RfCm-RfRm, (vii) RfRm-RfCm, and (viii) RfRm-RfRm. An illustration of the recombination fraction estimation between markers with different configuration type is provided in Supplementary Data Sheet 1.
A multipoint approach was implemented using an HMM (Lander and Green, 1987) with the expectation maximization (EM) algorithm (Dempster et al., 1977). To estimate the recombination fraction, and due to the meiosis in one population is independent to the meiosis of the another population, the expectation step was computed on each population separately and the maximization step was performed considering segregation information for both populations simultaneously. The new R function RF_2POPS implement this (Supplementary Data Sheet 1).
To implement the multipoint approach, the marker order of the individual H5 and H6 maps was tested. The marker order with the highest likelihood was selected as initial order of the composite map. Then, all the markers with ordering conflict between the individual maps were evaluated in all possible positions on the composite map and the position with highest likelihood was selected. A final local order verification was performed with RIPPLE algorithm implemented in the RIPPLE_2POPS command. The final marker order of the composite map was used to individual H5 and H6 maps to facilitate comparisons.
Finally, the markers present only in H5 or H6 individual maps were incorporated to the composite map. For these markers, we only had recombination information from one population, so it was not possible to estimate a multipopulation recombination fraction. To include these unique markers, genetic distances in cM were re-estimated by multiplying by a specific scaling factor. In the case of unique markers between consecutive common markers, the scaling factor was calculated by dividing the genetic distance in the composite map by the distance in the individual map for the same interval. For markers at the end of LGs, the total map length of the composite map divided by the total map length of individual map for each LG was used.
To perform the analysis, new functions of the ONEMAP package were developed to handle information for multiple populations. The functions developed in this work (RF_2POPS and RIPPLE_2POPS) alongside with a user-friendly tutorial (Supplementary Data Sheet 2) are available at https://github.com/augusto-garcia/onemap2pop. They will be integrated into ONEMAP package in a near future.
A total of 859,454,459 reads of 100 bp length were obtained from the complete sequencing of the two libraries. Read number and sequence quality were shown to be comparable for the two libraries and the two sequencing processes using FastQC. Read quality was similarly good in both libraries, with an average base quality score higher than 30 (99.9% base call accuracy). The total number of reads per progeny ranged from 60 thousand to 6.2 M. The 12 fold-repeated samples of parental genotypes resulted in a deeper coverage, with a 3.2 M average number of reads for the parental genotypes and 2.2 M per progeny. Two samples (H5_095 and H6_156) that presented a relatively low numbers of reads (<150,000), representing less of the 10% of the mean reads per sample of the lane on which they were sequenced, were removed for subsequent analysis.
As a first step, 3,051,475 high-quality tags (unique sequence from one or more high-quality reads) were identified. These GBS tags were aligned to the E. grandis reference genome in the Discovery pipeline. Of these, 643,863 (21.10%) aligned exactly once in the reference genome and 280,937 (9.21%) aligned in multiple positions, resulting in an overall alignment rate of 30.31% (924,800 tags). As a result of the Discovery approach, 43,377 putative SNPs were identified. Figure 1 presents the SNP markers distribution across the E. grandis chromosomes. Using the UNEAK pipeline, 44,889 high-quality pairwise alignments were identified, of which 13,430 putative SNPs were obtained.
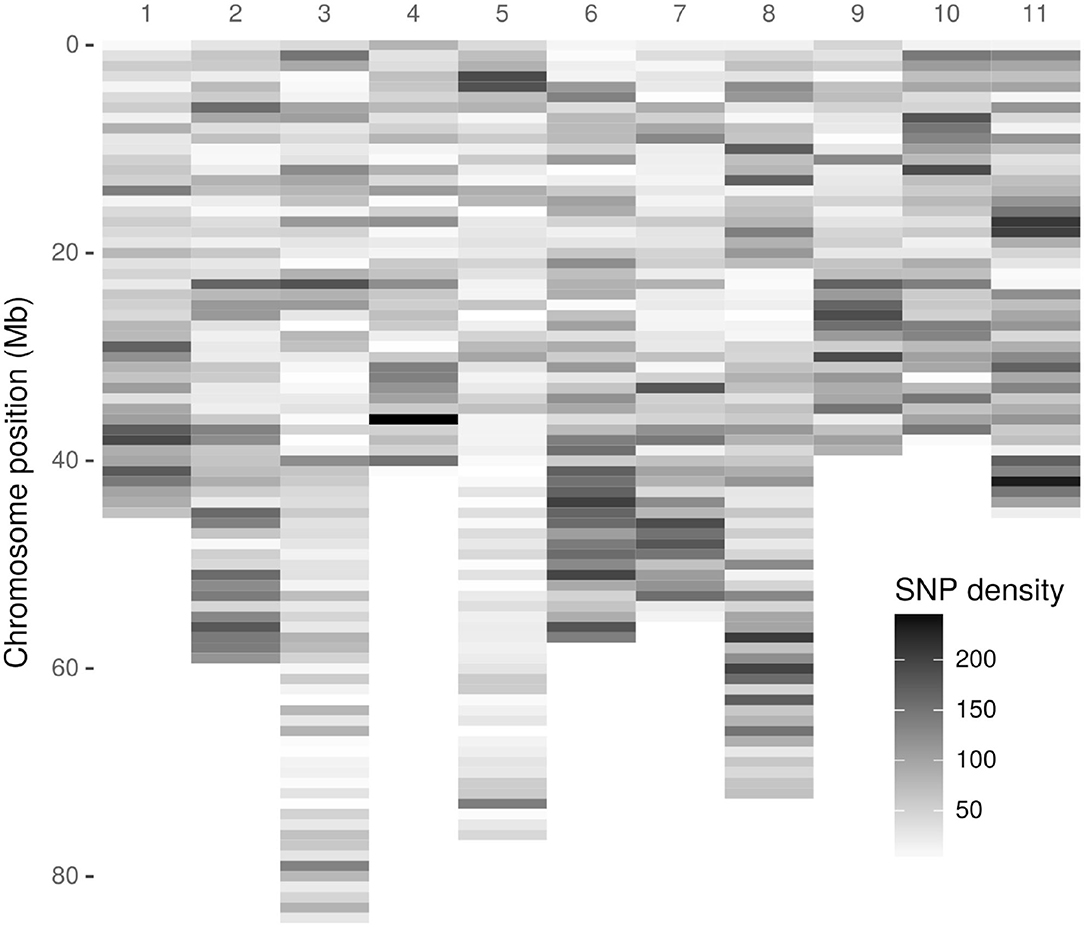
Figure 1. Density distribution of Discovery-identified Acca sellowiana single nucleotide polymorphisms (SNPs) across the Eucalyptus grandis chromosomes. The SNP density was estimated in a 1 Mb window. The y-axis indicates the physical position in Mb. Of the 43,377 Discovery-identified SNPs, 41,815 were distributed across the E. grandis chromosomes and showed in the graphic. The remaining 1525, identified in sequence scaffolds, are not displayed.
A total of 56,807 SNPs, comprising both Discovery and UNEAK SNP data sets, were available for genotype calling (Table 1). This number lowered to 53,051 (93.38%) after filtering out markers with no identified variation (missing alternative allele) or triallelic markers per genotype. After removing markers with more than 25% of missing data, a total of 27,595 (48.58%) and 25,670 (45.19%) SNPs were retained for H5 and H6 populations, respectively. For genotype calling, the filtered markers were subjected to quantitative genotyping following an F1 model implemented in SUPERMASSA. Markers with the median of all individual posterior probabilities greater than 0.8 were selected. This criterion was chosen to ensure a high quality of genotypes as described by Garcia et al. (2013) and Mollinari and Serang (2015). Finally, a low number of overlapping markers between both Discovery and UNEAK SNP data sets was found for both H5 (174 SNPs) and H6 (88 markers) populations, and removed for the UNEAK data set. As a result, a set of 5350 (9.42%) and 4227 (7.44%) of high-quality SNPs was used for genetic mapping for H5 and H6 populations, respectively. Of the H5 population SNP set, 2875 (53.74%) markers were identified by the Discovery pipeline, so the remaining 2475 (42.26%) markers by the UNEAK pipeline. For the H6 population, 2046 (48.40%) markers and 2181 (51.60%) were identified using the Discovery and UNEAK approaches, respectively.
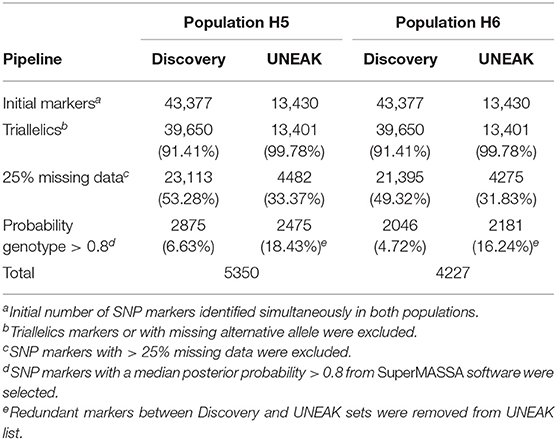
Table 1. Summary of single nucleotide polymorphism (SNP) marker number after filtering process for H5 and H6 populations.
Considering the marker segregation patterns, SNP markers were classified into one of the three configuration marker types informative for genetic map construction: “B3.7” (“ab” × “ab”); “D1.10” (“ab” × “aa”); and “D2.15” (“aa” × “ab”) (Wu et al., 2002a). Of the 5350 segregating markers identified in H5 population, 1520 (28.41%), 1752 (32.75%), and 2088 (39.03%) were classified as “B3.7,” “D1.10,” and “D2.15,” respectively. For H6 population, a set of 4227 markers were identified, and of those: 993 (23.49%), 1520 (35.96%), and 1714 (40.55%) were “B3.7,” “D1,” and “D2,” respectively. Segregation distortion from the Mendelian expected ratios (1:2:1 for “B3.7” markers and 1:1 for “D1.10” and “D2.10” markers) was observed in 1263 (23.61%) markers of the H5 data set and 1112 (26.31%) markers of H6 data set.
Comparing H5 and H6 SNP data sets, 2427 SNP were common. Of these shared markers, 1204 (49.61%) were identified by Discovery pipeline and 1223 (50.93%) by the UNEAK pipeline (Figure 2A). The segregation pattern of the common markers were inspected based on a joint marker configuration type. Markers with the same configuration type in both populations were the most frequent. For instance, the joint configuration D1.10-D1.10 accounted for the 36.88%, whereas the configuration B3.7-B3.7 and D2.15-D2.15 accounted for 25.34 and 21.59%, respectively. The B3.7-D1.10 and D1.10-B3.7 represented 8.94 and 7.25% of the configuration patterns for all the common markers, respectively (Figure 2B).
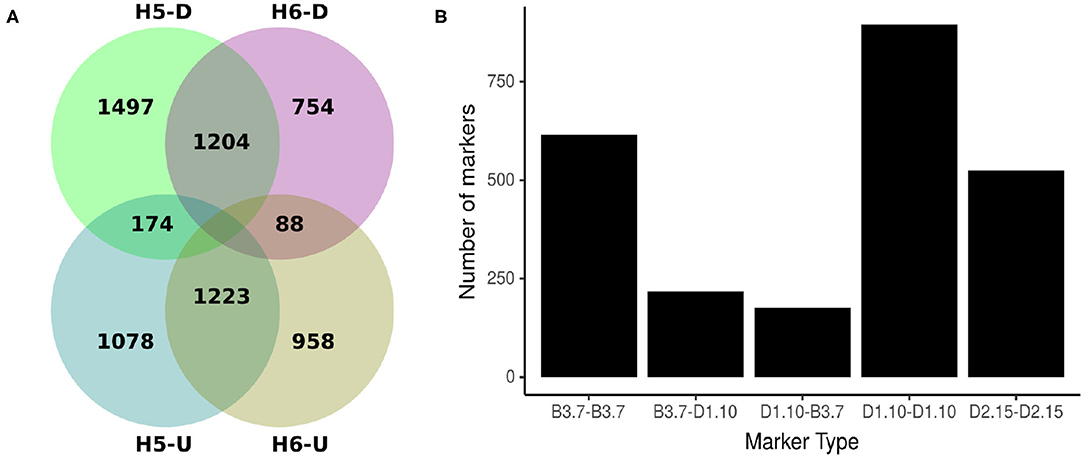
Figure 2. Origin and types of marker configuration for GBS-SNP markers identified for H5 and H6 populations. (A) Venn diagram showing common and unique single nucleotide polymorphisms (SNPs) between H5 and H6 populations identified by Discovery (D) and UNEAK (U) pipelines. (B) Distribution of five joint types of marker configurations for common markers between H5 and H6 populations. The joint marker configuration types considered the marker types in H5 and H6 populations simultaneously.
The 5,350 segregating GBS-SNPs of H5 population were combined with 493 (100 ISSR, 386 AFLP, and 7 SSR) makers previously reported by (Quezada et al., 2014) for the same population. Therefore, 5,843 markers were combined for linkage analysis. The resultant H5 genetic map, derived from the “TCO × BR” cross, comprised 1,236 markers encompassing 11 LGs, corresponding to the haploid chromosome number of A. sellowiana (Table 2, Figure 3). The total length of the map was 1593 cM, with LG4 being the smallest group (97.14 cM) and LG1 the largest (204.43 cM). The number of markers per group ranged from 68 (LG5) to 164 (LG10) with a mean of 112.36 markers per LG.
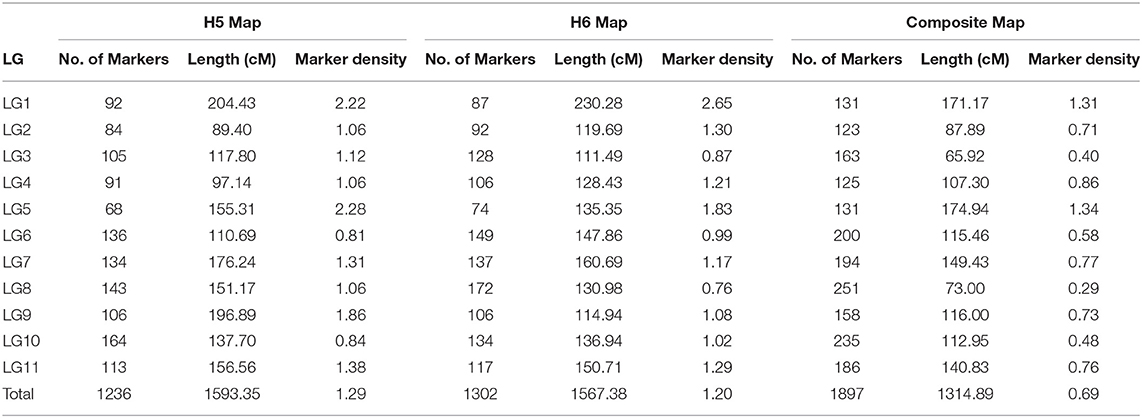
Table 2. Description of H5, H6, and composite linkage maps for A. sellowiana.
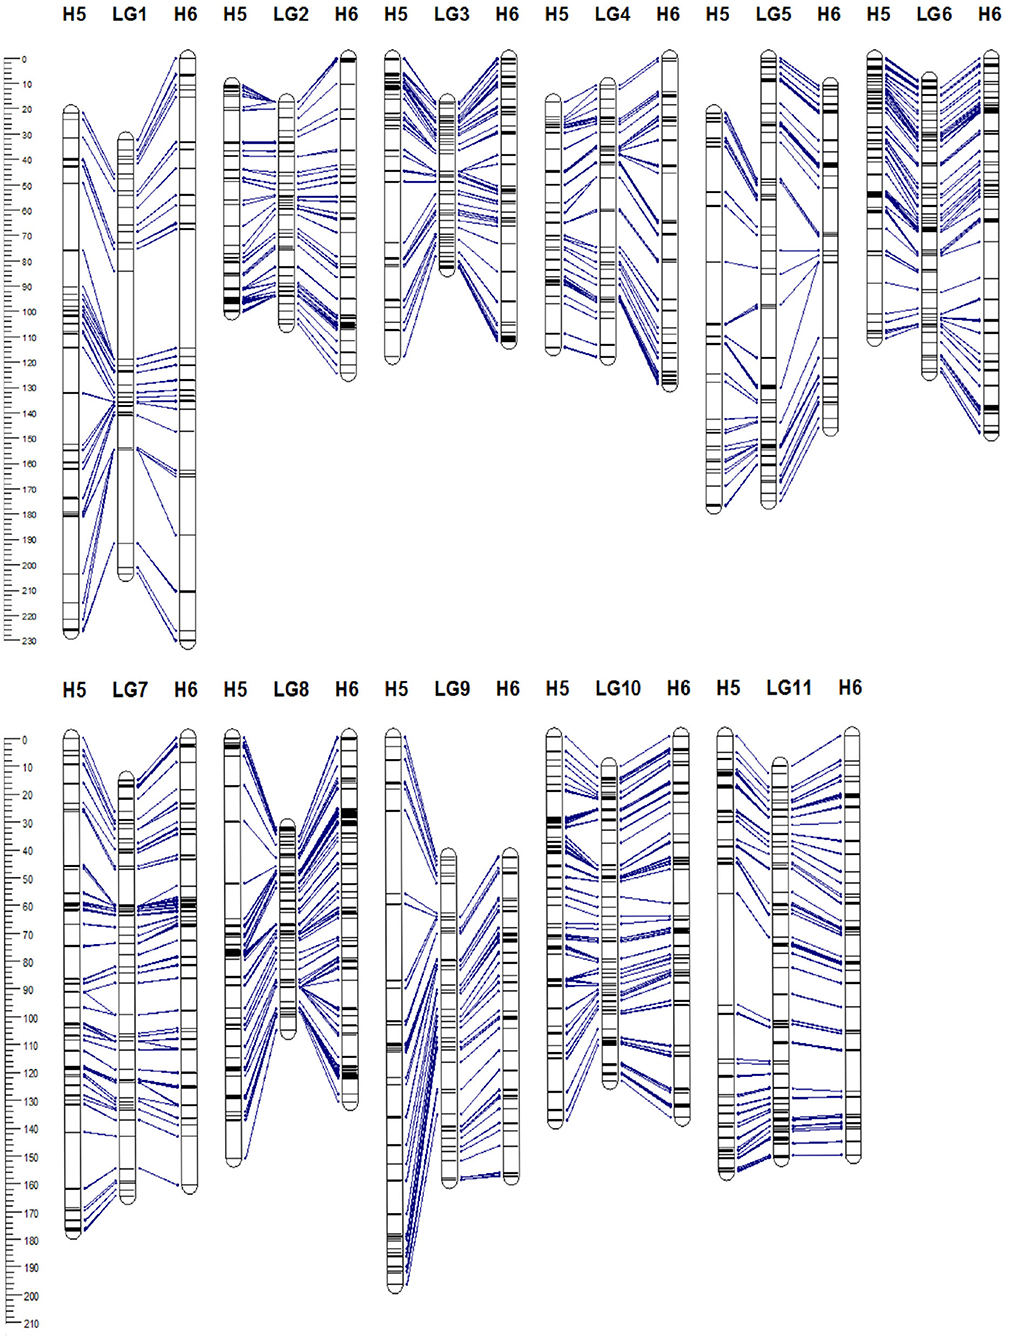
Figure 3. Genetic linkage map of Acca sellowiana. The composite linkage map (in the middle) integrated the information of the single population H5 (on the left) and H6 (on the right) maps. Map distances (cM) are indicated at the left side of the figure. Single nucleotide polymorphisms (SNP) markers common between linkage groups (LGs) of the three genetic maps are connected with lines.
For the construction of the H6 genetic map, corresponding to the “TCO × DP” cross, 4227 GBS-SNPs were analyzed. A total of 1,302 markers were mapped in the H6 map, spanning the expected 11 LGs for the species (Table 2, Figure 3). The map covered a total distance of 1,567 cM, with the size of LGs ranging from 111.49 cM (LG3) to 230.28 cM (LG1). The average number of markers per LG was 118.36, with a minimum number of 74 markers in LG5 and a maximum of 172 markers in LG8.
Similar average distances between markers was achieved in both H5 and H6 genetic maps. The average marker densities were 1.29 and 1.20 cM for H5 and H6 map, respectively. The H5 map presented 15 gaps larger than 15 cM, whereas 10 were found in the H6 map. We also observed similarly low proportions of markers with segregation distortion in both H5 and H6 genetic maps. Thus, 3.80% (47 out of 1,256) and 3.69% (48 out of 1,302) of the mapped markers were distorted with a random distribution over the H5 and H6 map, respectively. In addition, both maps presented a similar distribution of the segregation patterns of the mapped markers. The D1 marker configuration type was the mostly mapped in both populations, with 711 (57.52%) and 705 (54,14%) markers in H5 and H6 genetic maps, respectively. H5 and H6 maps presented 423 (34.22%) and 522 (40.09%) D2 markers, respectively. The B3-type markers were the less frequently mapped, with 101 (8.17%) mapped markers in H5 maps and 75 (5.76%) in H6 map. Only one AFLP marker with C.8 configuration (“ao” × “ao”) was mapped in H5 map.
Of the 1,236 mapped markers in H5 genetic map, only 23 markers (12 AFLP, 5 ISSR, and 1 SSR) were previously mapped in the former H5 map (Quezada et al., 2014). The LG9 and LG11 presented the largest number of markers previously mapped, with 8 and 7 markers mapped in H5 former map. The reaming markers were mapped in the LG5, LG1, and LG3 (Supplementary Data Sheet 3).
In order to construct a composite map, 641 common markers between H5 and H6 map were identified. All these shared SNPs were located within the same LG in both maps, with a largely consistent overall order between LGs. The recombination fractions between these markers was re-estimated using the information of both populations simultaneously and the best order was achieved based on the likelihood. After constructing the composite map, 595 and 661, H5 and H6 unique markers respectively, were incorporated. Consequently, the composite map included a total of 1,897 markers along 11 LGs with a total length of 1,314 cM (Table 2, Figure 3). The average group length was 119.53 cM, with LG2 the smallest (65.92 cM) and LG5 the largest ones (174.94 cM). The number of markers per group ranged from 123 (LG2) to 251 (LG8) with a mean of 172.45. The average distance between markers was 0.69 cM, with only three gaps larger than 15 cM.
The 641 common markers in the composite map presented all five possible joint marker configuration types defined considering the segregation pattern in both populations simultaneously. However, markers heterozygous in the maternal genotype and homozygous in both paternal genotypes (“ab” × “aa”/“ab” × “aa,” “D1.10”-“D1.10”) were largely the most frequent, with 449 (70.05%) of the 641 common mapped markers. The configuration type “D2.15”-“D2.15,” homozygous in the female parent and heterozygous for the male parent in both populations, was the second most frequent marker type, with 70 (10.92%) mapped markers. Finally, the configuration types with heterozygous parents in one of both populations were the less frequent, with 62 (9.67%) markers defined as “B3.7”-“D1.10,” 41 (6.39%) markers “D1.10”-“B3.7” and 19 (2.96%) described as “B3.7-B3.7.”
A high agreement was observed between LG assignment of the Discovery-identified SNPs, mapped in the composite map and the physical positions of these markers among the E. grandis chromosomes. This same result was observed in the single population maps. Out of 1,897 markers mapped in the composite map, 474 (24.98%) SNPs corresponded to markers identified by the Discovery pipeline, and of these, 437 (92.19%) showed correspondence between the assignment to a LGs in A. sellowiana and E. grandis chromosomes (Supplementary Data Sheet 4). Other 32 markers were mapped in discordant reference chromosomes and the remaining five were assigned to E. grandis genome scaffolds. Despite the high level of synteny observed, the marker order (colinearity) in the A. sellowiana composite map was not consistent with the physical positions in the E. grandis genome.
Applied for the first time in A. sellowiana, the GBS approach demonstrated the advantage of coupled NGS with methods for reducing genome complexity to discover and genotype SNP markers. In our study, the rare-cutting enzyme PstI was selected for targeting fewer sites with greater depth at each genomic site. As a result, although fewer SNPs were identified, a high site coverage was achieved, suitable for a full-sib mapping population of outcrossing species. It is relevant to note that this kind of populations present a high degree of linkage disequilibrium, so the number of markers required for covering the entire genome is relatively low. The total number of reads and average read per sample obtained in this study were comparable to the observed for other fruit tree species studies (Russell et al., 2014; Guajardo et al., 2015). However, these values are influenced not only by the restriction enzyme used but also by genome features of the species and the availability of a reference genome, among other factors (Gardner et al., 2014).
The original GBS protocol introduced the use of a sequenced reference genome to identify SNPs (Elshire et al., 2011). Considering that A. sellowiana lacks genome sequence information, the E. grandis genome was used as reference. As a result, an acceptable alignment value (30.1%) of A. sellowiana reads against the E. grandis genome was found. Using the same reference genome, the proportion of E. urophylla read alignment was twice larger (69.1%), as expected between more closely related species (Bartholomé et al., 2014). Differences in read alignment rates mainly depends on the quality of the genome assembly used as well as the phylogenetic relationship between the species. The occurrence of unaligned reads can be explained by poor-quality reads, poor-quality genome assembly, as well as the presence of divergent or species-specific sequences (Hyma et al., 2015). In this work, alignment distribution of A. sellowiana reads was homogeneous onto 11 E. grandis chromosomes (Figure 1). Chromosomes 8, 2, and 6 presented the highest number of identified SNPs, as was reported by Bartholomé et al. (2014), in the alignment of short reads obtained from the complete genome sequencing of E. grandis and E. urophylla. Although these chromosomes presented medium to large size, the number of identified markers had not a linear relationship with chromosome size. For instance, chromosome 5, which is one of the largest chromosome of E. grandis, presented a low A. sellowiana read alignment rates. This result can be explained by unique features of the E. grandis genome assembly (Bartholomé et al., 2014).
As a complementary strategy, the de novo based approach implemented in the UNEAK pipeline (Lu et al., 2013) was applied in this work. Using this approach, we identified ~3-fold fewer markers than the number of markers identified using the E. grandis as reference genome. This notable difference was also observed when comparing the mostly widespread applied reference-free with reference-based GBS pipelines (Torkamaneh et al., 2016). The low UNEAK-identified SNP number may result of a rather stringent network filter, which allowed only one mismatch for pair-read, may not only reduce the SNP number but also errors in genotype calling, caused by paralogous or repetitive sequences. The two strategies implemented in our study allowed to successfully identify a high number of SNP markers for A. sellowiana and represented a robust strategy for other non-reference species.
The correct genotype calling from the NGS data presents unique challenges for highly heterozygous species. The low read coverage of GBS data results in a large proportion of missing data as well as heterozygous undercalling. The latter may be due to unequal allele sampling or to a high sequencing base error rate of NGS reads (Swarts et al., 2014). Both, missing values and heterozygous undercalling, hinder linkage analysis, with a substantial impact in marker ordering and phasing, increasing the total map length. To overcome this limitation, new approaches have been developed to improve genotype calling in outcrossing species as well as to impute missing genotypes (Swarts et al., 2014; Covarrubias-Pazaran et al., 2016; Kim et al., 2016; Gerard et al., 2018). Here, we used a genotype calling method that takes advantages of the relative abundance of each allele (read counts) and the Mendelian properties of the mapping populations (Serang et al., 2012). To call genotypes with a high confidence, this methodology simultaneously considers all the genetic information available, as the parental information, the site coverage of each allele and the expected frequencies of individual genotype for each locus (Garcia et al., 2013). Despite the fact that it was initially designed for genotype calling in polyploid species, this quantitative genotyping analysis has proven to be an efficient approach to overcome the main constraints presented by genotyping in highly heterozygous species.
As a result of both SNP and genotyping calling approaches, a large number of high reliable SNP markers, useful for mapping purposes was obtained. However, the final number of useful SNPs retained represented a small proportion of those initially identified. Of the 55,000 SNP discovered, only 9.42% (5350) and 7.44% (4227) of them from H5 and H6 populations, respectively, were retained. This dramatic reduction has also been reported for other fruit tree species, where although many SNPs were identified, robust genotype calling were generated for only a small proportion of them (Gardner et al., 2014). Despite this reduction, our results are in concordance with the number of GBS-SNPs expected in full-sib mapping populations, and are superior to those found in apple and grape, where only 6.0 and 4.2% of the markers were retained for linkage mapping purposes (Gardner et al., 2014; Hyma et al., 2015). Both, Discovery and UNEAK approaches, equally contributed to the final SNP set. However, these approaches significantly differed at the initial number of markers as well as the proportion of retained markers across the filtering process. Thus, only 6.63 and 4.72% of the markers identified in the Discovery approach were selected for H5 and H6 populations, respectively. This proportion increased to 18.43% for H5 and 16.24% for H6 populations, for the UNEAK approach. This result shows that combining both SNP calling approaches with a quantitative genotyping method allowed to obtain high-quality markers covering the entire genome.
The first saturated genetic maps with 1,256 and 1,302 markers for H5 and H6 populations, respectively, were obtained for A. sellowiana. Both maps established 11 LGs, matching the expected haploid chromosome number of the species (n = 11). The total map length and average distance between markers was similar between maps, as was the number of mapped markers. In addition, the number of markers on both maps was comparable to the high-density maps published for other non-model tree fruit species (Ward et al., 2013; Russell et al., 2014; Guajardo et al., 2015). Nevertheless, the percentage of SNPs mapped from the initial data set was low (23.48% for H5 population and 30.80% for H6 population). This result could be explained by an uneven distribution of GBS-SNPs in the genome, resulting in large under-represented areas that could not be successfully covered in the genetic maps. Differences in the marker distribution could also explain the low number (23) of markers from the former H5 genetic map (Quezada et al., 2014) that could be mapped.
The comparison between single individual maps pointed out consistent pattern related to the total length and number of mapped markers among the LGs. For instance, both H5 and H6 LGs presented a slight variability in the number of mapped markers per LG, with the exception of the LG5 that presented a significantly lower number of markers. This result, also reported for other fruit tree species could be explained by a non-uniform distribution of SNP markers among chromosomes, occurrence of structural variations, as well by a local decrease of polymorphism in the same regions of the genome (Ward et al., 2013; Russell et al., 2014; Guajardo et al., 2015). Low proportion of markers with segregation distortion were observed in H5 (3.80%) and H6 (3.69%) maps, although distribution pattern for these markers was inconsistent between maps. Several reports have evaluated the impact of distorted segregation ratios in marker data on the construction of genetic linkage maps (Hackett and Broadfoot, 2003; Bodénès et al., 2016). However, the low number of distorted markers finally mapped is expected to have a minor impact in genetic distances, map length or marker order estimations, and therefore may not affect the construction of H5 or H6 genetic linkage maps.
The large number of common markers between H5 and H6 individual maps (51.86 and 49.23% of mapped markers in H5 and H6 map, respectively) was expected considering that both populations shared the same female parent. All the common markers had a complete correspondence with homologous LGs and showed a strong colinearity, confirming the robustness of the individual population maps. As commonly reported in mapping studies, some local inconsistencies in marker order were observed between these maps. The inconsistencies can be attributed to biological factors (such as chromosomal rearrangements, segregation distortion, and so on), sampling bias as well as to technical errors. Thus, structural variations have been reported in apple, where segmental duplications among different populations affect recombination frequencies, influencing marker order accuracy (Khan et al., 2012). In other study, local inconsistencies in marker order were attributed to a sampling bias for small mapping populations (N = 50) (Doligez et al., 2006). In our study, based on a comparative large mapping population (N = 160 and N = 184), the overall agreement between H5 and H6 marker order suggests that technical errors from genotyping methods and/or marker information content as the main causes of the local inconsistencies. The small inconsistencies observed can be a result of missing data, genotyping errors, or difference in content information among the markers and populations. Differences in recombination rates between the three parental genotypes were not considered, since they had little effect in incongruence of marker orders. Likewise, the effect of segregation distortion that can be considered another potential source of error in the ordering process was discarded because of the small proportion of distorted markers mapped.
Several mapping procedures for constructing composite genetic maps have been reported and applied to outcrossing species (Van Ooijen, 2006; Ronin et al., 2012; Endelman and Plomion, 2014). Despite differences in the statistical approaches, all of them are based on the combination of genetic distances estimation from single population maps. These approaches are negatively affected by differences in population sizes, marker information content, missing data, as well as the proportion of common markers. Consequently, marker order inconsistencies and map-distance inflation reduced the resolution and accuracy of the maps generated through these approaches (Doligez et al., 2006; De Keyser et al., 2010; Clark et al., 2014).
The innovative strategy to construct a composite map proposed in this work integrates the recombination information from the individuals of two genetically connected populations. The main advantage of our procedure is that the meiosis information of all individuals (N = 344) is captured in a single composite map, since the information data of common mapped markers was merged. Considering the complete correspondence between H5 and H6 LGs, the integration process was carried out for each LG independently. In a first step, only common markers were considered, with the objective of reducing missing information that hinders the marker ordering process (Hackett and Broadfoot, 2003). The resulting framework map provided the most accurate marker order that allowed the correction of the small order inconsistencies in the single population maps, resulting in robust high-density linkage maps. The improved estimation of marker positions can be explained by the larger number of recombination events evaluated in a composite approach, compared to single population approaches. Another possible explanation is that the multipoint maximum likelihood estimation was implemented using genetic information derived from two populations simultaneously, an efficient approach both for statistical and biological reasons. Although the two-point recombination fractions between common markers for H5 and H6 maps were estimated, the multipoint approach was preferred due to the higher accuracy of recombination fraction estimation (Mollinari et al., 2009). Finally, the incorporation of single population markers into the framework map enabled to saturate the composite map.
Using this strategy, a total of 1,897 markers were mapped in the high-density composite map, where 641 framework markers were common between H5 and H6 individual maps. This is by far the most saturated linkage map of A. sellowiana available to date. The composite genetic map resulted in a more comprehensive representation of the genome, including information of two mapping populations. This map included more markers than individuals ones, with a small total length (1,314 cM), reducing the average distance between markers from around 1.25 cM in the individual maps to 0.69 cM in the composite map. In addition, the composite map allowed the reduction of the number of gaps, to only three gaps larger than 15 cM. These results were in accordance with previous reports about the influence of population size in linkage maps, specifically in outcrossing species. For instance, lower marker densities were observed when small population size were analyzed (Bartholomé et al., 2014). Besides, high correlations were reported between population size and number of mapped markers (Hyma et al., 2015). The progeny size has a direct effect on the number of detected recombinants events, since smaller populations have fewer recombinants than larger populations. For H5 (N = 160) and H6 (N = 184) genetic maps, the mapping resolution achieved was in accordance with the mapping population sizes. The construction of the composite map is adequate to capture the genetic information of a larger population, generating a map with higher precision in the order and distance between markers. Besides, the segregation analysis using connected mapping populations might increase the coverage of the genome, filling the gaps and increasing the mapping resolution. Our results are consistent with previous reports that showed that the number of recombination events evaluated, thus the population size is the current limiting factor to construct high-density linkage maps in outcrossing species (Bartholomé et al., 2014; Hyma et al., 2015).
The level of synteny between A. sellowiana (n = 11) and E. grandis (n = 11) was examined through the distribution of Discovery-identified SNP markers, which were assigned to a chromosomal position in the E. grandis genome. A high degree of synteny was found between the two species, considering that more than 90% of the Discovery-identified markers were syntenic to E. grandis chromosomes. Although this result suggested the conserved localization of markers, colinearity (order of the markers) within each LG was not observed (Supplementary Data Sheet 4). It is important to highlight our results considering the phylogenetic divergence and the genome size difference between A. sellowiana (245 Mb) (da Costa et al., 2008) and E. grandis (641 Mb). However, these results are consistent with the high level of synteny observed within the Myrtaceae family (Grattapaglia et al., 2012). In addition, the recent comparison of chloroplast genomes of myrtle species, including A. sellowiana and E. grandis also revealed a highly conserved genome content, gene order and genomic structure between these species (de Machado et al., 2017). The high synteny observed in this preliminary study provides the basis for using the E. grandis reference genome in genomic studies of minor crops in the Myrtaceae family.
Here, the composite genetic map provided a reference for A. sellowiana, a valuable tool for future genetic and genomic applications. The composite map especially improved the accuracy of order marker and genetic distances, facilitating the comparison between genetic maps. This map will be also a useful tool to guide the assembly of the A. sellowiana genome sequence, as a reference to anchor and orient the sequence scaffolds. With the development of composite genetic maps, the occurrence of genome structural variation or conserved synteny can be evaluated across divergent species. To date, the comparative mapping studies in the Myrtaceae family had only included dry fruit species of the tribe Eucalypteae (Grattapaglia et al., 2012). Therefore, the composite map developed in this work can be useful to extend the studies including more divergent species of the family. In addition, this composite map may allow to align the position of QTLs detected across variable genetic backgrounds, facilitating the transfer of genetic information from molecular markers and gene positions, and accelerating molecular breeding strategies such as marker-assisted selection (Diaz et al., 2011).
In this study, we constructed the first high-density genetic map for A. sellowiana using a genotyping by sequencing approach. The GBS protocol was an effective strategy for simultaneous SNP discovery and genotyping, identifying thousands of genome-wide polymorphic markers, in a species with limited genetic resources. We also developed a novel strategy for constructing a composite genetic map using the genetic information from two full-sib connected mapping populations. This approach provided a better estimation of recombination fraction, resulted in higher accuracy for marker distance and order as well as increased genome coverage. The composite map along with the H5 and H6 single population maps are the most comprehensive representations of the A. sellowiana genome and constitute key genetic resources for this minor species. These maps could be useful for future genetic studies, such as the detection of QTL of important agronomic traits, comparative genome analysis in the Myrtaceae family, genome assembly, and the acceleration of the breeding process in A. sellowiana.
The original contributions presented in the study are publicly available. This data can be found here: https://www.ncbi.nlm.nih.gov/bioproject/PRJNA517479.
CP and AG conceived the study design. BV and DC provide the plant material. MQ performed the DNA extraction. MQ and AG designed the GBS experiments. MQ performed the GBS data analysis and the genetic map analysis. RA and MQ carried out the novel genetic map analysis, wrote computer code, and integrated the analysis of results. MQ wrote the manuscript draft. CP, RA, and AG edited and revised the manuscript. All authors read and approved the final manuscript.
This work was supported by grants from the ANII (Agencia Nacional de Investigacion e Innovacion, Uruguay; FMV_3_2013_1_100571) and from CSIC-UdelaR-Uruguay (CSIC_I+D_375). MQ received doctoral fellowships from CAPES-Brazil (Coordenação de Aperfeiçoamento de Pessoal de Nível Superior) and INIA-Uruguay (Instituto Nacional de Investigación Agropecuaria). RA received a master's fellowship from CNPq (Conselho Nacional de Desenvolvimento Científico e Tecnológico). AG received a research fellowships from CNPq (Grant 310139/2018-0). The funders had no role in study design, data collection, analysis and interpretation of data, or writing the manuscript.
The authors declare that the research was conducted in the absence of any commercial or financial relationships that could be construed as a potential conflict of interest.
The Supplementary Material for this article can be found online at: https://www.frontiersin.org/articles/10.3389/fpls.2021.626811/full#supplementary-material
Baird, N. A., Etter, P. D., Atwood, T. S., Currey, M. C., Shiver, A. L., Lewis, Z. A., et al. (2008). Rapid SNP discovery and genetic mapping using sequenced RAD markers. PLoS ONE 3:e0003376. doi: 10.1371/journal.pone.0003376
Balsalobre, T. W. A., Pereira, G. S., Margarido, G. R. A., Gazaffi, R., Barreto, F. Z., Anoni, C. O., et al. (2017). GBS-based single dosage markers for linkage and QTL mapping allow gene mining for yield-related traits in sugarcane. BMC Genomics 18:72. doi: 10.1186/s12864-016-3383-x
Barba, P., Cadle-Davidson, L., Harriman, J., Glaubitz, J. C., Brooks, S., Hyma, K., et al. (2014). Grapevine powdery mildew resistance and susceptibility loci identified on a high-resolution SNP map. Theor. Appl. Genet. 127, 73–84. doi: 10.1007/s00122-013-2202-x
Bartholomé, J., Mandrou, E., Mabiala, A., Jenkins, J., Nabihoudine, I., Klopp, C., et al. (2014). High-resolution genetic maps of Eucalyptus improve Eucalyptus grandis genome assembly. New Phytol. 206, 1283–1296. doi: 10.1111/nph.13150
Bielenberg, D. G., Rauh, B., Fan, S., Gasic, K., Abbott, A. G., Reighard, G. L., et al. (2015). Genotyping by sequencing for SNP-based linkage map construction and QTL analysis of chilling requirement and bloom date in peach [Prunus persica (L.) Batsch]. PLoS ONE 10:e0139406. doi: 10.1371/journal.pone.0139406
Bodénès, C., Chancerel, E., Ehrenmann, F., Kremer, A., and Plomion, C. (2016). High-density linkage mapping and distribution of segregation distortion regions in the oak genome. DNA Res. 23, 115–124. doi: 10.1093/dnares/dsw001
Byrne, D. H. (2012). “Trends in fruit breeding,” in Fruit Breeding, eds M. L. Badenes and D. H. Byrne (New York, NY: Springer-Verlag), 3–36.
Clark, M. D., Schmitz, C. A., Rosyara, U. R., Luby, J. J., and Bradeen, J. M. (2014). A consensus 'Honeycrisp' apple (Malus x domestica) genetic linkage map from three full-sib progeny populations. Tree Genet. Genomes 10, 627–639. doi: 10.1007/s11295-014-0709-1
Covarrubias-Pazaran, G., Diaz-Garcia, L., Schlautman, B., Deutsch, J., Salazar, W., Hernandez-Ochoa, M., et al. (2016). Exploiting genotyping by sequencing to characterize the genomic structure of the American cranberry through high-density linkage mapping. BMC Genomics 17:451. doi: 10.1186/s12864-016-2802-3
da Costa, I. R., Dornelas, M. C., and Forni-Martins, E. R. (2008). Nuclear genome size variation in fleshy-fruited Neotropical Myrtaceae. Plant Syst. Evol. 276, 209–217. doi: 10.1007/s00606-008-0088-x
Danecek, P., Auton, A., Abecasis, G., Albers, C. A., Banks, E., DePristo, M. A., et al. (2011). The variant call format and vcftools. Bioinformatics 27, 2156–2158. doi: 10.1093/bioinformatics/btr330
Davey, J. W., Hohenlohe, P. A., Etter, P. D., Boone, J. Q., Catchen, J. M., and Blaxter, M. L. (2011). Genome-wide genetic marker discovery and genotyping using next-generation sequencing. Nat. Publ. Gr. 12, 499–510. doi: 10.1038/nrg3012
de Givry, S., Bouchez, M., Chabrier, P., Milan, D., and Schiex, T. (2005). CARTHAGENE: multipopulation integrated genetic and radiation hybrid mapping. Bioinformatics 21, 1703–1704. doi: 10.1093/bioinformatics/bti222
De Keyser, E., Shu, Q. Y., Van Bockstaele, E., and De Riek, J. (2010). Multipoint-likelihood maximization mapping on 4 segregating populations to achieve an integrated framework map for QTL analysis in pot azalea (Rhododendron simsii hybrids). BMC Mol. Biol. 11:1. doi: 10.1186/1471-2199-11-1
de Machado, L. O., do Nascimento Vieira, L., Stefenon, V. M., de Oliveira Pedrosa, F., de Souza, E. M., Guerra, M. P., et al. (2017). Phylogenomic relationship of feijoa (Acca sellowiana (O.Berg) Burret) with other Myrtaceae based on complete chloroplast genome sequences. Genetica 145, 163–174. doi: 10.1007/s10709-017-9954-1
Dempster, A., Laird, N., and Rubin, D. B. (1977). Maximum likelihood from incomplete data via the EM algorithm. J. R. Stat. Soc, Ser. B Methodol. 39, 1–22. doi: 10.1111/j.2517-6161.1977.tb01600.x
Dettori, M. T., and Palombi, M. A. (2000). Identification of Feijoa sellowiana Berg accessions by RAPD markers. Sci. Hortic. 86, 279–290. doi: 10.1016/S0304-4238(00)00157-6
Di Pierro, E. A., Gianfranceschi, L., Di Guardo, M., Koehorst-van Putten, H. J., Kruisselbrink, J. W., Longhi, S., et al. (2016). A high-density, multi-parental SNP genetic map on apple validates a new mapping approach for outcrossing species. Hortic. Res. 3:16057. doi: 10.1038/hortres.2016.57
Diaz, A., Fergany, M., Formisano, G., Ziarsolo, P., Blanca, J., Fei, Z., et al. (2011). A consensus linkage map for molecular markers and Quantitative Trait Loci associated with economically important traits in melon (Cucumis melo L.). BMC Plant Biol. 11:111. doi: 10.1186/1471-2229-11-111
Doligez, A., Adam-Blondon, A., Cipriani, G., Di Gaspero, G., Laucou, V., Merdinoglu, D., et al. (2006). An integrated SSR map of grapevine based on five mapping populations. Theor. Appl. Genet. 113, 369–382. doi: 10.1007/s00122-006-0295-1
Donazzolo, J., Stefenon, V. M., Guerra, M. P., and Nodari, R. O. (2020). On farm management of Acca sellowiana (Myrtaceae) as a strategy for conservation of species genetic diversity. Sci. Hortic. 259:108826. doi: 10.1016/j.scienta.2019.108826
dos Santos, K. L., Santos, M. O., Laborda, P. R., Souza, A. P., Peroni, N., and Nodari, R. O. (2008). Isolation and characterization of microsatellite markers in Acca sellowiana (Berg) Burret. Mol. Ecol. Resour. 8, 998–1000. doi: 10.1111/j.1755-0998.2008.02134.x
dos Santos, K. L., Welter, L. J., Dantas, A. C. M., Guerra, M. P., Ducroquet, J. P. H. J., and Nodari, R. O. (2007). Transference of microsatellite markers from Eucalyptus spp to Acca sellowiana and the successful use of this technique in genetic characterization. Genet. Mol. Biol. 30, 73–79. doi: 10.1590/S1415-47572007000100014
Elshire, R. J., Glaubitz, J. C., Sun, Q., Poland, J. A., Kawamoto, K., Buckler, E. S., et al. (2011). A robust, simple Genotyping-by-Sequencing (GBS) approach for high diversity species. PLoS ONE 6:e0019379. doi: 10.1371/journal.pone.0019379
Endelman, J. B., and Plomion, C. (2014). LPmerge: an R package for merging genetic maps by linear programming. Bioinformatics 30, 1623–1624. doi: 10.1093/bioinformatics/btu091
Fierst, J. L. (2015). Using linkage maps to correct and scaffold de novo genome assemblies: methods, challenges, and computational tools. Front. Genet. 6:220. doi: 10.3389/fgene.2015.00220
Garcia, A. A. F., Mollinari, M., Marconi, T. G., Serang, O. R., Silva, R. R., Vieira, M. L. C., et al. (2013). SNP genotyping allows an in-depth characterisation of the genome of sugarcane and other complex autopolyploids. Sci. Rep. 3:3399. doi: 10.1038/srep03399
Gardner, K. M., Brown, P. J., Cooke, T. F., Cann, S., Costa, F., Bustamante, C. D., et al. (2014). Fast and cost-effective genetic mapping in apple using next-generation sequencing. G3 4, 1681–1687. doi: 10.1534/g3.114.011023
Gerard, D., Ferrão, L. F. V., Garcia, A. A. F., and Stephens, M. (2018). Genotyping polyploids from messy sequencing data. Genetics 210, 789–807. doi: 10.1534/genetics.118.301468
Glaubitz, J. C., Casstevens, T. M., Lu, F., Harriman, J., Elshire, R. J., Sun, Q., et al. (2014). TASSEL-GBS: a high capacity genotyping by sequencing analysis pipeline. PLoS ONE 9:e0090346. doi: 10.1371/journal.pone.0090346
Grattapaglia, D., and Sederoff, R. (1994). Genetic linkage maps of Eucalyptus grandis and Eucalyptus urophylla using a pseudo-testcross: mapping strategy and RAPD markers. Genetics 137, 1121–1137. doi: 10.1093/genetics/137.4.1121
Grattapaglia, D., Vaillancourt, R. E., Shepherd, M., Thumma, B. R., Foley, W., Külheim, C., et al. (2012). Progress in Myrtaceae genetics and genomics: Eucalyptus as the pivotal genus. Tree Genet. Genomes 8, 463–508. doi: 10.1007/s11295-012-0491-x
Guajardo, V., Solís, S., Sagredo, B., Gainza, F., Muñoz, C., Gasic, K., et al. (2015). Construction of high density sweet cherry (Prunus avium L.) linkage maps using microsatellite markers and SNPs detected by Genotyping-by-Sequencing (GBS). PLoS ONE 10:e0127750. doi: 10.1371/journal.pone.0127750
Hackett, C. A., and Broadfoot, L. B. (2003). Effects of genotyping errors, missing values and segregation distortion in molecular marker data on the construction of linkage maps. Heredity 90, 33–38. doi: 10.1038/sj.hdy.6800173
Hyma, K. E., Barba, P., Wang, M., Londo, J. P., Acharya, C. B., Mitchell, S. E., et al. (2015). Heterozygous mapping strategy (HetMappS) for high resolution genotyping-by-sequencing markers: a case study in grapevine. PLoS ONE 10:e0134880. doi: 10.1371/journal.pone.0134880
Jaganathan, D., Bohra, A., Thudi, M., and Varshney, R. K. (2020). Fine mapping and gene cloning in the post-NGS era: advances and prospects. Theor. Appl. Genet. 133, 1791–1810. doi: 10.1007/s00122-020-03560-w
Khan, M. A., Han, Y., Zhao, Y. F., Troggio, M., and Korban, S. S. (2012). A multi-population consensus genetic map reveals inconsistent marker order among maps likely attributed to structural variations in the Apple genome. PLoS ONE 7:e47864. doi: 10.1371/journal.pone.0047864
Kim, C., Guo, H., Kong, W., Chandnani, R., Shuang, L. S., and Paterson, A. H. (2016). Application of genotyping by sequencing technology to a variety of crop breeding programs. Plant Sci. 242, 14–22. doi: 10.1016/j.plantsci.2015.04.016
Klabunde, G. H. F., Olkoski, D., Vilperte, V., Zucchi, M. I., and Nodari, R. O. (2014). Characterization of 10 new nuclear microsatellite markers in Acca sellowiana (Myrtaceae). Appl. Plant Sci. 2:apps.1400020.doi: 10.3732/apps.1400020
Knaus, B. J., and Grünwald, N. J. (2017). VCFR: a package to manipulate and visualize variant call format data in R. Mol. Ecol. Resour. 17, 44–53. doi: 10.1111/1755-0998.12549
Kosambi, D. D. (1944). The estimation of map distances from recombination values. Ann. Eugen. 12, 172–175. doi: 10.1111/j.1469-1809.1943.tb02321.x
Kuhn, D. N., Bally, I. S. E., Dillon, N. L., Innes, D., Groh, A. M., Rahaman, J., et al. (2017). Genetic map of mango: a tool for mango breeding. Front. Plant Sci. 8:577. doi: 10.3389/fpls.2017.00577
Lander, E. S., and Green, P. (1987). Construction of multilocus genetic linkage maps in humans. Proc. Natl. Acad. Sci. U.S.A. 84, 2363–2367. doi: 10.1073/pnas.84.8.2363
Langmead, B., and Salzberg, S. L. (2012). Fast gapped-read alignment with Bowtie 2. Nat. Methods 9, 357–359. doi: 10.1038/nmeth.1923
Li, L., Deng, C. H., Knäbel, M., Chagné, D., Kumar, S., Sun, J., et al. (2017). Integrated high-density consensus genetic map of Pyrus and anchoring of the ‘Bartlett’ v1.0 (Pyrus communis) genome. DNA Res. 24, 289–301. doi: 10.1093/dnares/dsw063
Lu, F., Lipka, A. E., Glaubitz, J., Elshire, R., Cherney, J. H., Casler, M. D., et al. (2013). Switchgrass genomic diversity, ploidy, and evolution: novel insights from a network-based SNP discovery protocol. PLoS Genet. 9:e1003215. doi: 10.1371/journal.pgen.1003215
Maliepaard, C., Jansen, J., and Van Ooijen, J. W. (1997). Linkage analysis in a full-sib family of an outbreeding plant species: overview and consequences for applications. Genet. Res. 70, 237–250. doi: 10.1017/S0016672397003005
Margarido, G. R. A., de Souza, A. P., and Garcia, A. A. F. (2007). Onemap: software for genetic mapping in outcrossing species. Hereditas 144, 78–79. doi: 10.1111/j.2007.0018-0661.02000.x
Mathew, L. S., Spannagl, M., Al-Malki, A., George, B., Torres, M. F., Al-Dous, E. K., et al. (2014). A first genetic map of date palm (Phoenix dactylifera) reveals long-range genome structure conservation in the palms. BMC Genomics 15:285. doi: 10.1186/1471-2164-15-285
Mollinari, M., Margarido, G. R. A., Vencovsky, R., and Garcia, A. A. F. (2009). Evaluation of algorithms used to order markers on genetic maps. Heredity 103, 494–502. doi: 10.1038/hdy.2009.96
Mollinari, M., and Serang, O. (2015). “Quantitative SNP genotyping of polyploids with MassARRAY and other platforms,” in Plant Genotyping. Methods in Molecular Biology, ed J. Batley (New York, NY: Humana Press), 215–241.
Padmakar, B., Kanupriya, C., Latha, P. M., Prashant, K., Dinesh, M., Sailaja, D., et al. (2015). Development of SRAP and SSR marker-based genetic linkage maps of guava (Psidium guajava L.). Sci. Hortic. 192, 158–165. doi: 10.1016/j.scienta.2015.04.031
Palhares, A. C., Rodrigues-Morais, T. B., Van Sluys, M.-A., Domingues, D. S., Maccheroni, W., Jordão, H., et al. (2012). A novel linkage map of sugarcane with evidence for clustering of retrotransposon-based markers. BMC Genet. 13:51. doi: 10.1186/1471-2156-13-51
Pasquariello, M. S., Mastrobuoni, F., Di Patre, D., Zampella, L., Capuano, L. R., Scortichini, M., et al. (2015). Agronomic, nutraceutical and molecular variability of feijoa (Acca sellowiana (O. Berg) Burret) germplasm. Sci. Hortic. 191, 1–9. doi: 10.1016/j.scienta.2015.04.036
Peace, C., and Norelli, J. L. (2009). “Genomics approaches to crop improvement in the Rosaceae,” in Genet. Genomics Rosaceae, eds K. M. Folta and S. E. Gardiner (New York, NY: Springer), 19-53.
Pereira, G. S., Garcia, A. A. F., and Margarido, G. R. A. (2018). A fully automated pipeline for quantitative genotype calling from next generation sequencing data in autopolyploids. BMC Bioinformatics 19:398. doi: 10.1186/s12859-018-2433-6
Pereira, G. S., Nunes, E. S., Laperuta, L. D. C., Braga, M. F., Penha, H. A., Diniz, A. L., et al. (2013). Molecular polymorphism and linkage analysis in sweet passion fruit, an outcrossing species. Ann. Appl. Biol. 162, 347–361. doi: 10.1111/aab.12028
Pootakham, W., Ruang-Areerate, P., Jomchai, N., Sonthirod, C., Sangsrakru, D., Yoocha, T., et al. (2015). Construction of a high-density integrated genetic linkage map of rubber tree (Hevea brasiliensis) using genotyping-by-sequencing (GBS). Front. Plant Sci. 6:367. doi: 10.3389/fpls.2015.00367
Quezada, M., Pastina, M. M., Ravest, G., Silva, P., Vignale, B., Cabrera, D., et al. (2014). A first genetic map of Acca sellowiana based on ISSR, AFLP and SSR markers. Sci. Hortic. 169, 138–146. doi: 10.1016/j.scienta.2014.02.009
R Development Core Team (2017). R: A Language and Environment for Statistical Computing. Vienna: R Foundation for Statistical Computing.
Ronin, Y., Mester, D., Minkov, D., Belotserkovski, R., Jackson, B. N., Schnable, P. S., et al. (2012). Two-phase analysis in consensus genetic mapping. G3 2, 537–549. doi: 10.1534/g3.112.002428
Russell, J., Hackett, C., Hedley, P., Liu, H., Brennan, L. M., Bayer, M., et al. (2014). The use of genotyping by sequencing in blackcurrant (Ribes nigrum): developing high-resolution linkage maps in species without reference genome sequences. Mol. Breed. 33, 835–849. doi: 10.1007/s11032-013-9996-8
Saifert, L., Sánchez-Mora, F. D., Borsuk, L. J., Donazzolo, J., da Costa, N. C. F., Ribeiro, H. N., et al. (2020). Evaluation of the genetic diversity in the feijoa accessions maintained at Santa Catarina, Brazil. Crop Sci. 60, 345–356. doi: 10.1002/csc2.20088
Schlautman, B., Covarrubias-Pazaran, G., Diaz-Garcia, L., Iorizzo, M., Polashock, J., Grygleski, E., et al. (2017). Construction of a high-density American Cranberry (Vaccinium macrocarpon Ait.) composite map using genotyping-by-sequencing for multi-pedigree linkage mapping. G3 7, 1177–1189. doi: 10.1534/g3.116.037556
Serang, O., Mollinari, M., and Garcia, A. A. F. (2012). Efficient exact maximum a posteriori computation for Bayesian SNP genotyping in polyploids. PLoS ONE 7:e0030906. doi: 10.1371/journal.pone.0030906
Swarts, K., Li, H., Alberto Romero Navarro, J., An, D., Romay, M. C., and Hearne, S. (2014). Novel methods to optimize genotypic imputation for low-coverage, next-generation sequence data in crop plants. Plant Genome 7, 1–12. doi: 10.3835/plantgenome2014.05.0023
Torkamaneh, D., Laroche, J., and Belzile, F. (2016). Genome-wide SNP calling from genotyping by sequencing (GBS) data: a comparison of seven pipelines and two sequencing technologies. PLoS ONE 11:e0161333. doi: 10.1371/journal.pone.0161333
Troggio, M., Gleave, A., Salvi, S., Chagné, D., Cestaro, A., Kumar, S., et al. (2012). Apple, from genome to breeding. Tree Genet. Genomes 8, 509–529. doi: 10.1007/s11295-012-0492-9
Van Ooijen, J. W. (2006). JoinMap 4, Software for the Calculation of Genetic Linkage Maps in Experimental Populations. Wageningen: Kyazma BV.
Voorrips, R. E. (2002). MapChart: software for the graphical presentation of linkage maps and QTLs. J. Hered. 93, 77–78. doi: 10.1093/jhered/93.1.77
Ward, J. A., Bhangoo, J., Fernández-Fernández, F., Moore, P., Swanson, J., Viola, R., et al. (2013). Saturated linkage map construction in Rubus idaeus using genotyping by sequencing and genome-independent imputation. BMC Genomics 14:2. doi: 10.1186/1471-2164-14-2
Weston, R. J. (2010). Bioactive products from fruit of the feijoa (Feijoa sellowiana, Myrtaceae): a review. Food Chem. 121, 923–926. doi: 10.1016/j.foodchem.2010.01.047
Wu, R., Ma, C.-X., Painter, I., and Zeng, Z.-B. (2002a). Simultaneous maximum likelihood estimation of linkage and linkage phases in outcrossing species. Theor. Popul. Biol. 61, 349–363. doi: 10.1006/tpbi.2002.1577
Wu, R., Ma, C.-X., Wu, S. S., and Zeng, Z.-B. (2002b). Linkage mapping of sex-specific differences. Genet. Res. 79, 85–96. doi: 10.1017/S0016672301005389
Keywords: Acca sellowiana, feijoa, pineapple guava, genotyping by sequencing, composite genetic map, multiparent family, Myrtaceae
Citation: Quezada M, Amadeu RR, Vignale B, Cabrera D, Pritsch C and Garcia AAF (2021) Construction of a High-Density Genetic Map of Acca sellowiana (Berg.) Burret, an Outcrossing Species, Based on Two Connected Mapping Populations. Front. Plant Sci. 12:626811. doi: 10.3389/fpls.2021.626811
Received: 06 November 2020; Accepted: 12 January 2021;
Published: 23 February 2021.
Edited by:
Maria Luisa Badenes, Instituto Valenciano de Investigaciones Agrarias, SpainReviewed by:
Shouvik Das, Indian Agricultural Research Institute (ICAR), IndiaCopyright © 2021 Quezada, Amadeu, Vignale, Cabrera, Pritsch and Garcia. This is an open-access article distributed under the terms of the Creative Commons Attribution License (CC BY). The use, distribution or reproduction in other forums is permitted, provided the original author(s) and the copyright owner(s) are credited and that the original publication in this journal is cited, in accordance with accepted academic practice. No use, distribution or reproduction is permitted which does not comply with these terms.
*Correspondence: Antonio Augusto Franco Garcia, YXVndXN0by5nYXJjaWFAdXNwLmJy
Disclaimer: All claims expressed in this article are solely those of the authors and do not necessarily represent those of their affiliated organizations, or those of the publisher, the editors and the reviewers. Any product that may be evaluated in this article or claim that may be made by its manufacturer is not guaranteed or endorsed by the publisher.
Research integrity at Frontiers
Learn more about the work of our research integrity team to safeguard the quality of each article we publish.