 Guang Feng
 Jihong Huang
 Yue Xu
 Runguo Zang
- 1Key Laboratory of Biodiversity Conservation of the National Forestry and Grassland Administration, Key Laboratory of Forest Ecology and Environment of the National Forestry and Grassland Administration, Research Institute of Forest Ecology, Environment and Protection, Chinese Academy of Forestry, Beijing, China
- 2Co-Innovation Center for Sustainable Forestry in Southern China, Nanjing Forestry University, Nanjing, China
- 3College of Forestry, Beijing Forestry University, Beijing, China
As a transitional vegetation type between evergreen broadleaved forest and deciduous broadleaved forest, evergreen-deciduous broadleaved mixed forest is composed of diverse plant species. This distinctive forest is generally distributed in mountainous areas with complex landforms and heterogeneous microenvironments. However, little is known about the roles of environmental conditions in driving the species diversity patterns of this forest. Here, based on a 15-ha plot in central China, we aimed to understand how and to what extent topographical characteristics and soil nutrients regulate the number and relative abundance of tree species in this forest. We measured environmental factors (terrain convexity, slope, soil total nitrogen, and phosphorus concentrations) and species diversity (species abundance distribution and species richness) in 20 m × 20 m subplots. Species abundance distribution was characterized by skewness, Berger–Parker index, and the proportion of singletons. The generalized additive model was used to examine the variations in diversity patterns caused by environmental factors. The structural equation model was used to assess whether and how topographical characteristics regulate species diversity via soil nutrients. We found that soil nutrients had significant negative effects on species richness and positive effects on all metrics of species abundance distribution. Convexity had significant positive effects on species richness and negative effects on all metrics of species abundance distribution, but these effects were mostly mediated by soil nutrients. Slope had significant negative effects on skewness and the Berger–Parker index, and these effects were almost independent of soil nutrients. Soil nutrients and topographical characteristics together accounted for 9.5–17.1% of variations in diversity patterns and, respectively, accounted for 8.9–13.9% and 3.3–10.7% of the variations. We concluded that soil nutrients were more important than topographical factors in regulating species diversity. Increased soil nutrient concentration led to decreased taxonomic diversity and increased species dominance and rarity. Convexity could be a better proxy for soil nutrients than slope. Moreover, these abiotic factors played limited roles in regulating diversity patterns, and it is possible that the observed patterns are also driven by some biotic and abiotic factors not considered here.
Introduction
Understanding the drivers of diversity patterns is an essential objective of ecological researches and several far-reaching theories, such as the species pool hypothesis (Zobel et al., 2011), neutral theory (Hubbell, 2001), and the island biogeography theory (MacArthur and Wilson, 1967). It is important to note that both the number and the relative abundance of species in communities are the fundamental attributes of species diversity (Mcgill et al., 2007; Chao et al., 2014). Almost all ecological factors or processes acting on communities may not only affect the number of species but also regulate species relative abundance (Ulrich et al., 2015). Therefore, these details are worth considering together in biodiversity studies. The number of species is referred to as species richness (SR), while the species abundance distribution (SAD) describes the relative abundance of species compared with any single index of species diversity (Mcgill et al., 2007).
SAD has long been studied by qualitative analyses based on model fitting (Mcgill et al., 2007; Matthews and Whittaker, 2014). However, even if the models are built on specific mechanisms, model fitting alone is less effective in revealing the mechanisms underlying SAD, because a given SAD pattern could result from more than one mechanism (Mcgill et al., 2007; Chisholm and Pacala, 2010; Matthews et al., 2017). Therefore, quantitative analyses have become more popular in recent years (Qiao et al., 2015a; Ulrich et al., 2015; Arellano et al., 2017; Matthews et al., 2019). Quantifying the shape of SAD makes it feasible to better detect SAD difference and to test their drivers. Two essential components underlying the shape of SAD are species dominance (or commonness) and rarity, because communities in the nature are, to varying degrees, composed of a few highly abundant species and many rare species (Magurran, 2004; Mcgill et al., 2007). Specifically, species dominance usually refers to the extent to which the highly abundant species are numerically dominant, and species rarity refers to the proportion of species that rare species account for Magurran (2004), Simons et al. (2017). Therefore, SAD evenness depends on both dimensions.
Soil nutrients and topographical characteristics have been widely confirmed to be important determinants of forest community patterns at the local scale (John et al., 2007; Baldeck et al., 2013; Punchi-Manage et al., 2014; Qiao et al., 2015b). Nitrogen and phosphorus are key limiting nutrient elements for plant growth in terrestrial ecosystems (Du et al., 2020), especially in China’s forests (Tang et al., 2018). Topographical characteristics regulate a series of factors (e.g., light availability, microclimate, and soil properties) that directly matter to plant growth and survival (Chadwick and Asner, 2016; Fortunel et al., 2018). This implies that topographical influences on plant communities may be intrinsic. In essence, environmental conditions could be the determinants of community patterns because the differences among species are ecologically significant and community assembly follows the niche-based assembly rules. For example, floristic composition changes with soil nutrient level, if plant species differ highly in their nutrient preference. Under such assembly rules, local communities are hypothesized to be shaped by abiotic filtering and biotic interaction (Keddy, 1992), and both of them are related to environmental conditions (Cadotte and Tucker, 2017). In general, abiotic (environmental) filtering tends to be intensive in harsh or stressful conditions (Kraft and Ackerly, 2010), whereas strong competition (the biotic filtering process) usually takes place in benign or less stressful environments (Bertness and Callaway, 1994). That is, diversity maintenance to some degree depends on how species persist and coexist in given environmental conditions.
Although these niche-based processes are known for limiting species diversity by selectively filtering species, the imprints of either of them on SAD do not follow a uniform paradigm. Similar to the “extinction debt” concept in the context of studying habitat destruction (Tilman et al., 1994), species suffering from those filtering processes may persist with extremely low abundances for a period of time, but eventually go extinct because the populations are too small to be viable. Thus, it is not surprising that both of those filtering processes may regulate SAD evenness by either increasing (Maire et al., 2012; Arellano et al., 2017) or decreasing the proportion of rare species (Kunte, 2008; Matthews et al., 2019). Meanwhile, both processes may also reduce SAD evenness by making a few species overabundant (Jabot, 2009; Peña-Claros et al., 2012; Qiao et al., 2015a; Simons et al., 2017). These circumstances on the whole mirror the aforementioned complexity in ecology that one-to-one relationships between patterns and processes are rarely seen (Levin, 1995).
Subtropical evergreen-deciduous broadleaved mixed forest (EDBMF) is a transitional vegetation type between evergreen broadleaved forest and deciduous broadleaved forest in China (Wu, 1980; Ge and Xie, 2017). The EDBMF is composed of diverse woody plant species, especially that in central China (Huang et al., 2016; Yao et al., 2016). Given that these forests are generally distributed in mountainous areas with complex terrain and heterogeneous microenvironments, even at a local scale, understanding the roles of environmental conditions in regulating the species diversity pattern will be ecologically meaningful. Previous studies on this forest have revealed that topographical factors such as convexity and slope and soil nutrients such as total phosphorus and nitrogen concentrations are important drivers of species compositions and distributions (Wang et al., 2014; Huang et al., 2015; Qiao et al., 2015b). However, little is known about which, how, and to what extent environmental factors regulate the number and the relative abundance of species in local communities. To fill these gaps, using data from a 15-ha plot of an old-growth EDBMF established in southwest Hubei Province, central China, we aimed to understand the effects of topographical factors and soil nutrients on local SR and SAD patterns. Specifically, we focus on addressing the following questions:
(1) Do SR and SAD change with topographical factors and soil nutrients?
(2) What is the relative importance between topographical factors and soil nutrients in determining SR and SAD?
(3) How do topographical factors affect SR and SAD via soil nutrients?
Materials and Methods
Study Area
Our study was conducted in a 15-ha plot of an old-growth EDBMF (300 m × 500 m; 30°4′28.50″ N, 110°12′19.30″ E; Figure 1) in Mulinzi National Nature Reserve, Southwest Hubei Province, Central China. The research area has a humid monsoon climate with a mean annual relative humidity of 82%. Mean annual precipitation is between 1,700 and 1,900 mm, and most precipitation occurs from April to September. Mean annual temperature and annual effective accumulated temperature (≥10°C) are approximately 15.5°C and 4925.4°C, respectively. Annual sunshine duration ranges from 1,253 to 1,342 h, and the frost-free period lasts for 270–279 days.
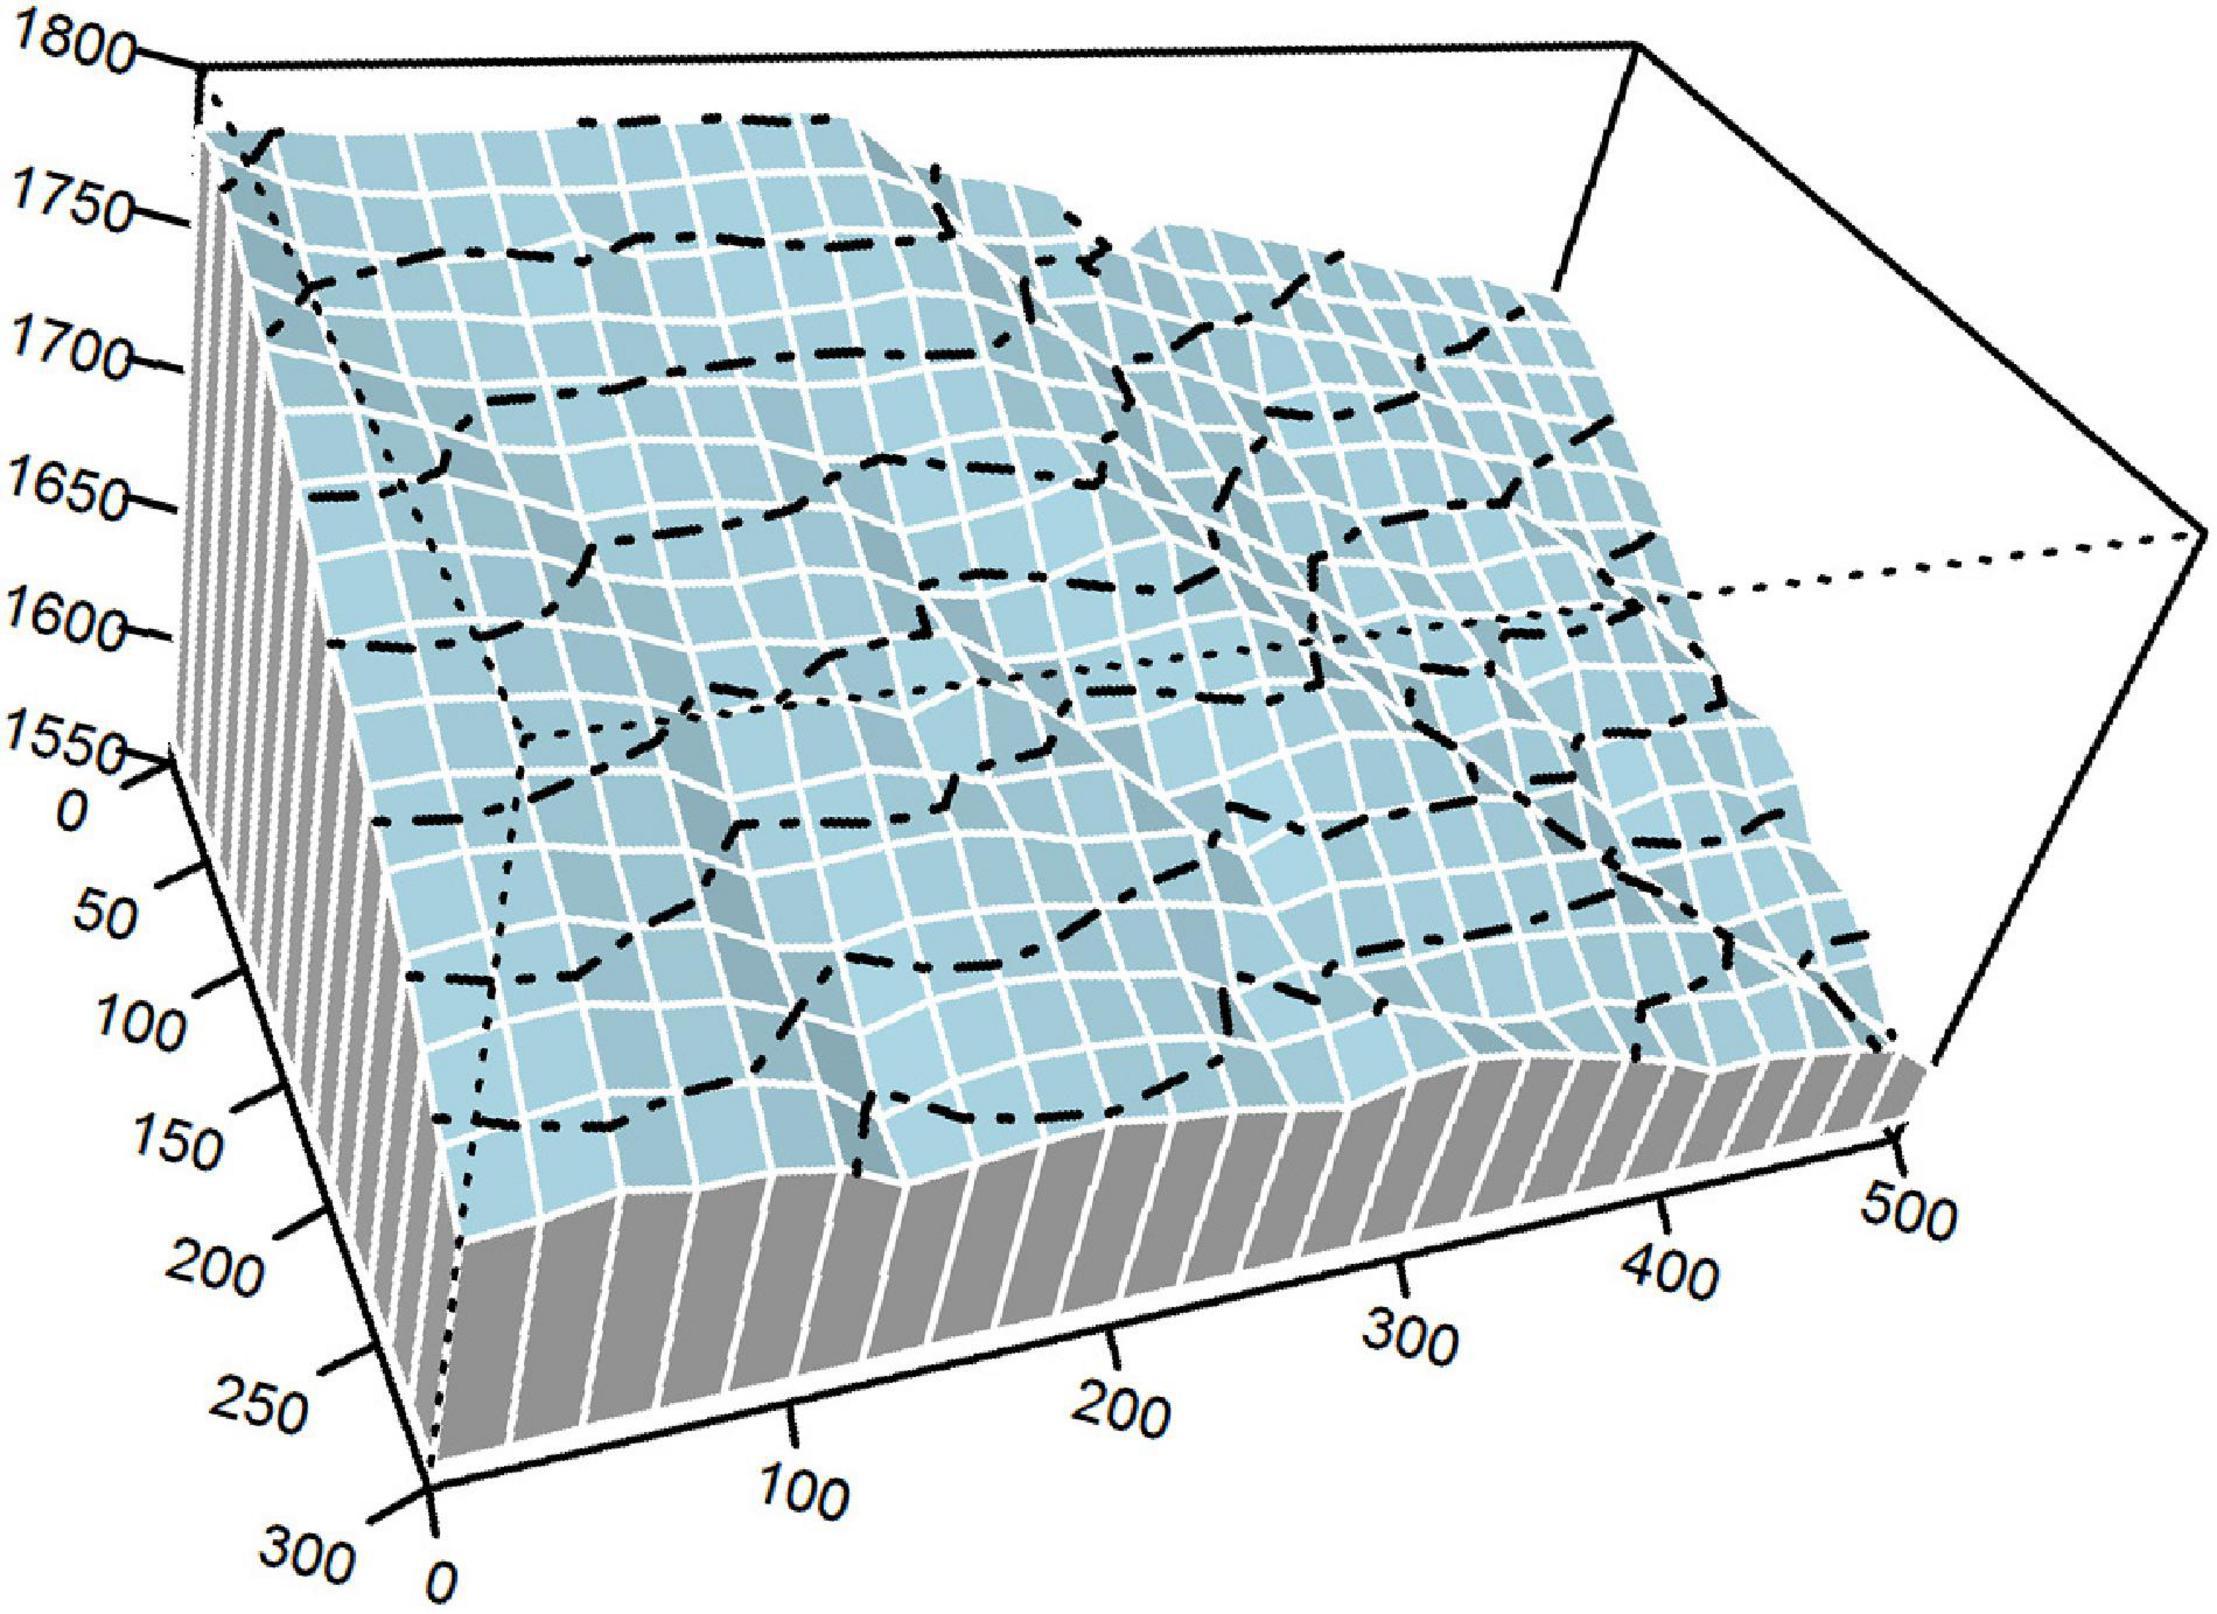
Figure 1. The 15-ha plot of an evergreen-deciduous broadleaved mixed forest (EDBMF). Dashed lines are contours with 20-m intervals.
Measurement of Tree Species Diversity
The 15-ha plot was established and divided into 375 subplots (20 m × 20 m) using a real-time kinematic method. In this plot, woody plants with diameter at breast height ≥ 1 cm were identified, tagged, and mapped in 2014. This survey included 84,171 individuals from 227 species in total. Within subplots, SR was calculated as the number of species, and SAD was characterized by skewness, Berger–Parker index (d), and the proportion of singletons (PS). Specifically, d is a dominance index (Magurran, 2004):
where Nmax is the number of individuals for the most abundant species and N is the total number of individuals.
PS is a rarity index (Magurran, 2004):
where Ssingleton is the number of singletons (i.e., species represented by just one individual) and Stotal is the total number of species.
Skewness is the well-known third moment of a probability distribution. Skewness calculated from log-transformed species abundance data depicts SAD symmetry (Magurran, 2004). Negative skewness (strong species rarity) commonly reflects that there is an excess of less-abundant species, compared with a lognormal SAD (Ulrich et al., 2015). Positive skewness (strong species dominance) reflects strong monodominance and/or an excess of abundant species compared with a lognormal SAD.
Measurement of Environmental Factors
The following environmental factors were measured in each subplot: soil total phosphorus (TP) and total nitrogen concentrations (TN), terrain convexity, and slope (steepness). Because elevation and convexity are highly correlated, we did not consider elevation in analyses. Convexity was measured as the average elevation of the focal site minus that of its surrounding sites. Slope was calculated as the mean deviation angle from the four planes to horizontal (created in sequence by taking elevation data at three corners of each subplot). In each subplot, after removing the visible litter and humus layers, a mixed soil sample was collected at 5–15 cm depth (soils at 0–5 cm depth mixed with humus were not sampled) at three locations, including one at the center of each subplot and two along the diagonal. After the soil samples were air-dried, TP and TN were determined by the HClO4–H2SO4 digestion method and the semi-micro Kjeldahl method (Bao, 2000), respectively.
Statistical Analyses
Because modeling and parameter estimation may be biased by outliers, 14 subplots with outliers were filtered out according to the three-sigma rule. The remainders (i.e., 361 subplots; Figure 2) were considered in the following analyses. Data can be viewed in Supplementary Data S1.
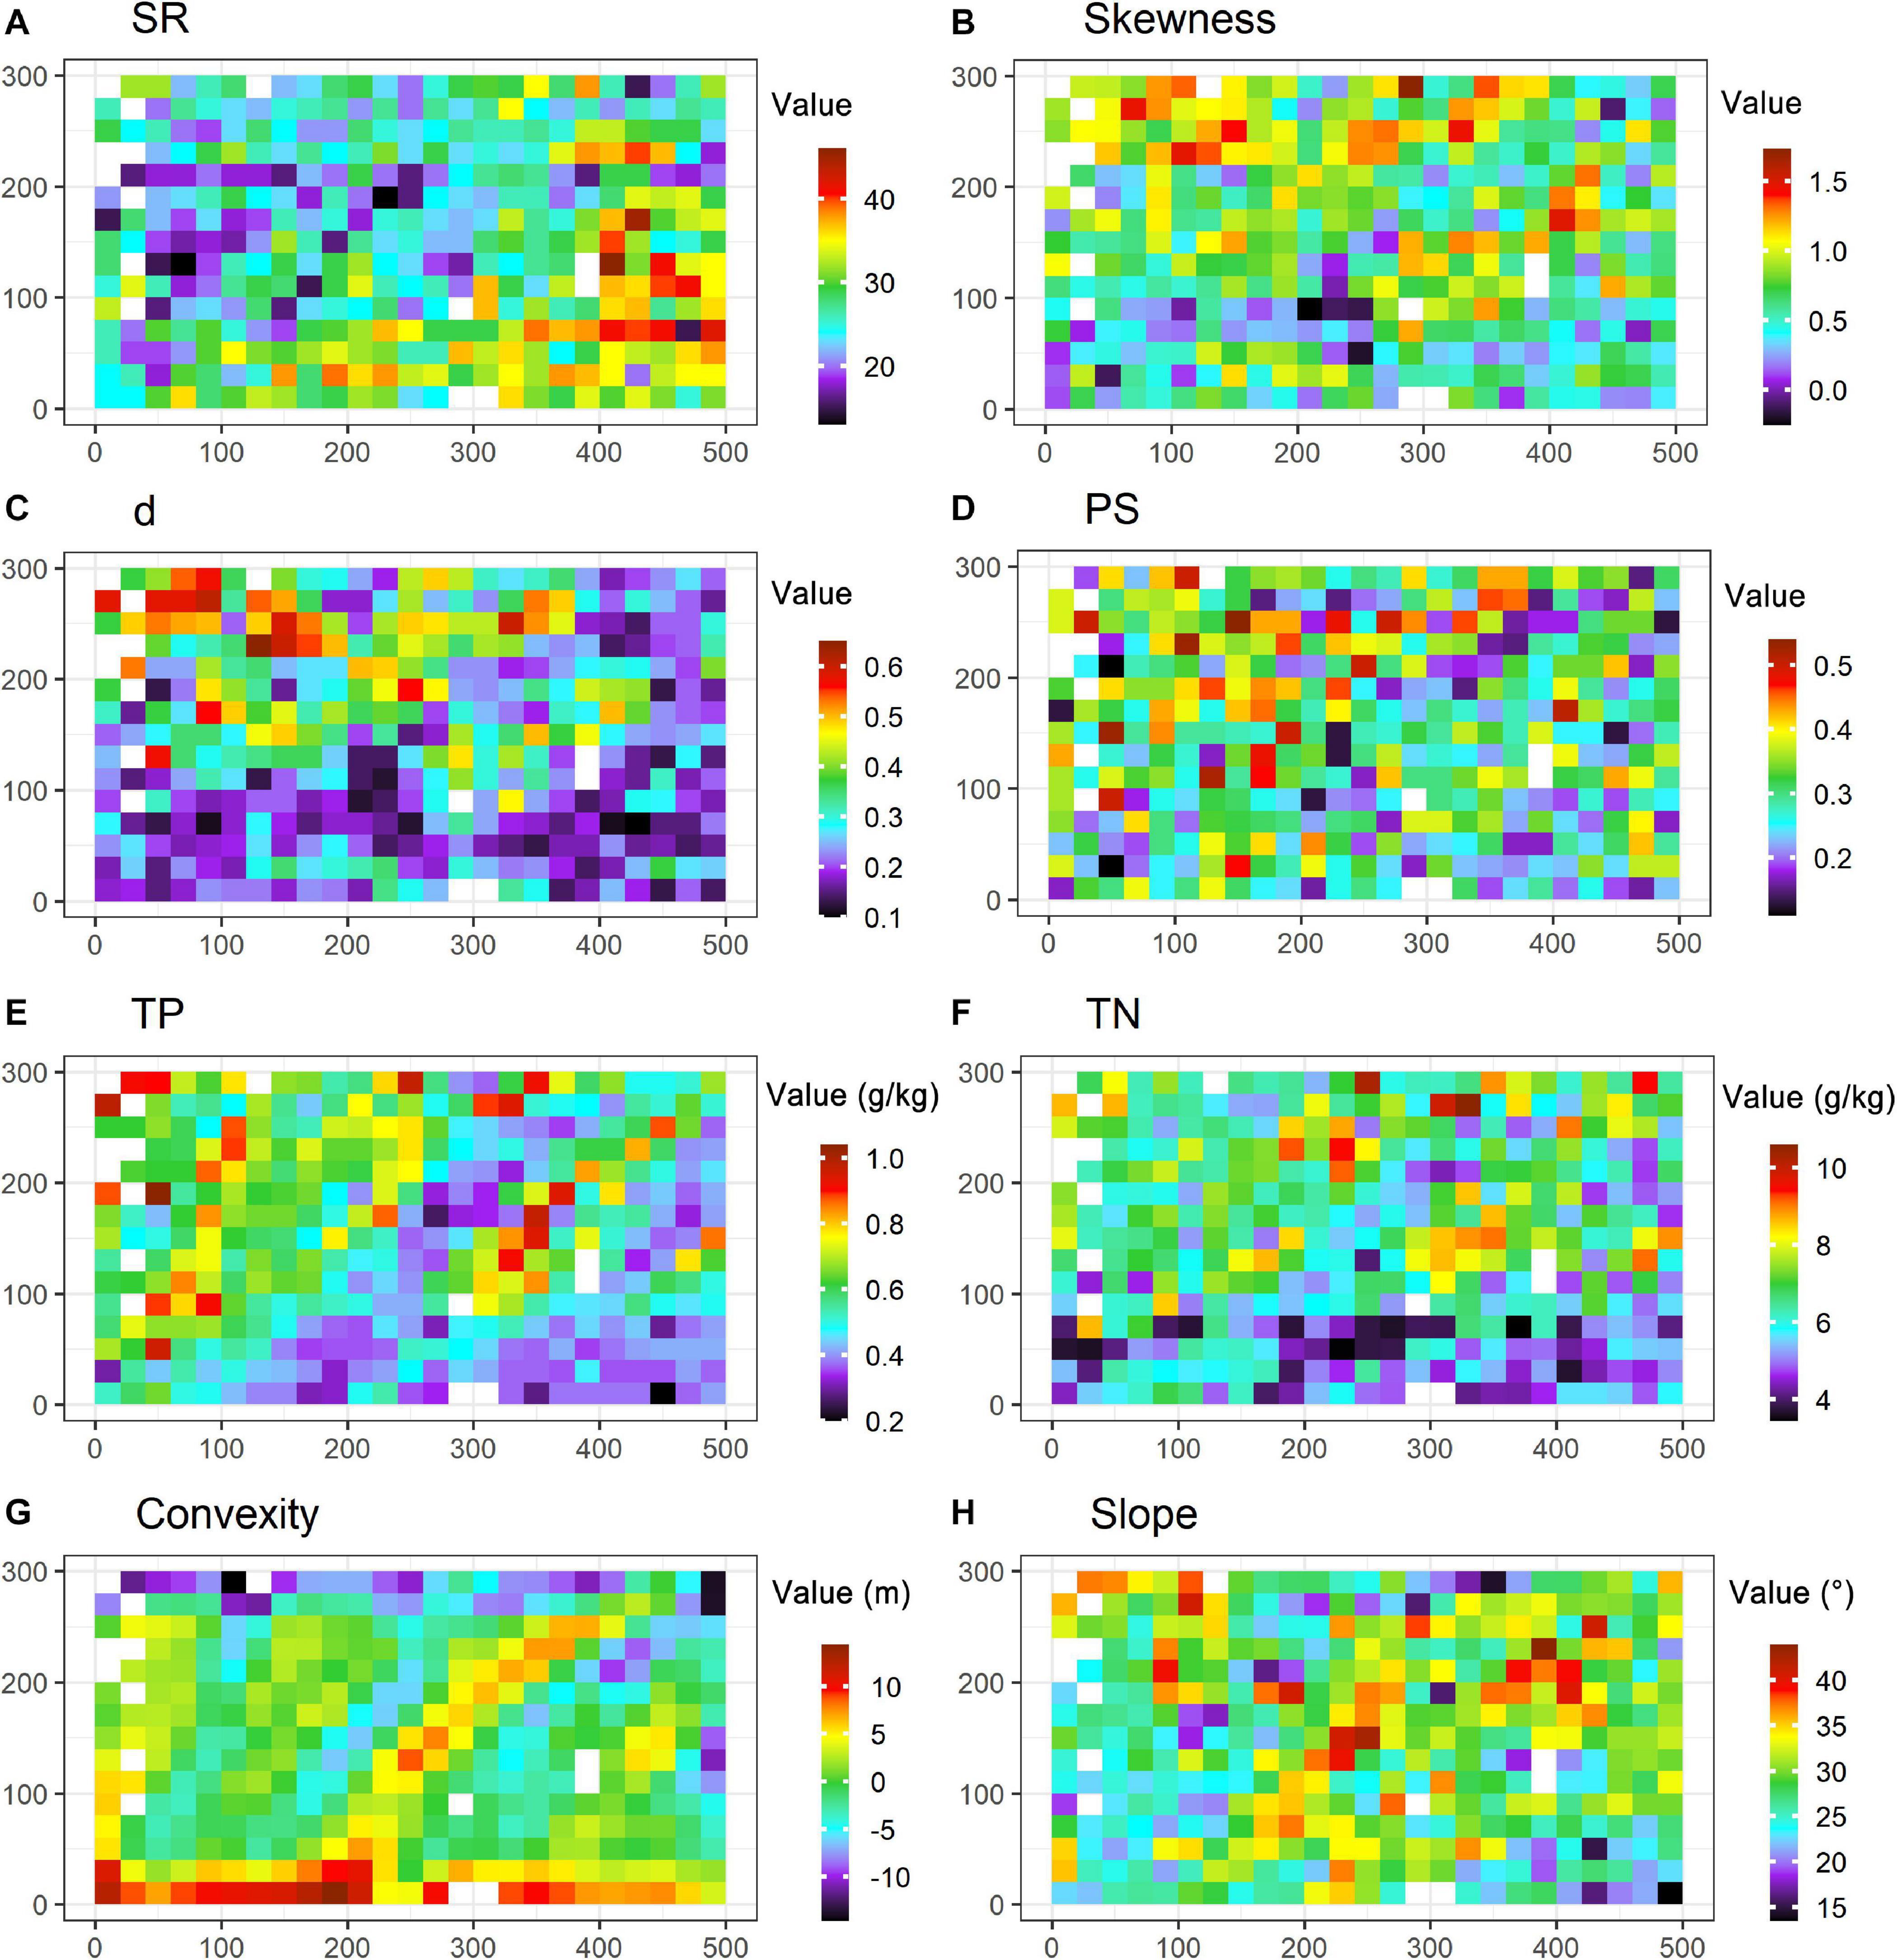
Figure 2. Species diversity and environmental conditions in the 15-ha plot. Subgraphs are the maps of SR (species richness, A), skewness (B), d (the Berger-Parker index, C), PS (proportion of singletons, D), TP (soil total phosphorus, E), TN (soil total nitrogen, F), convexity (G) and slope (H) at the 15-ha plot with the resolution at 20 m × 20 m. Blanks refer to the subplots with outliers that are filtered out in analyses.
We first ran a principal component analysis (PCA) on environmental variables to determine the major environmental gradients across subplots and to illustrate the correlations among environmental variables, which were further quantified by Pearson correlation analysis (see Supplementary Figure S1). Similarly, pairwise correlations among diversity patterns (SR, skewness, d, and PS) were also evaluated by Pearson correlation analysis. The generalized additive model (GAM) was used to examine variations in diversity patterns along environmental gradients. Based on the GAM, variance partitioning was performed to quantify the variations explained by topographical factors and soil nutrients. A structural equation model (SEM) was used to disentangle whether and how topographical factors acted on diversity patterns by regulating soil nutrients. In SEM, environmental effects were measured by standardized effect size (SES). In the modeling, soil nutrients were considered as a latent variable characterized by TP and TN; soil nutrients were hypothesized to affect SAD and SR patterns directly; topographical impacts on those patterns are hypothesized to be partly mediated by soil nutrients. The overall fitting of SEM was evaluated by p-value (in chi-square test), goodness-of-fit index (GFI), comparative fit index (CFI), and standardized root-mean-square residual (SRMR). As a rule of thumb, the model is acceptable if p > 0.05 (i.e., differences between observations and fitted values are non-significant), CFI > 0.95, GFI > 0.95, and SRMR < 0.08 (Grace et al., 2016). We also ran a redundancy analysis on the highly abundant species at the plot level to examine their distributions along environmental gradients (see Supplementary Figure S2).
The above statistical analyses were carried out by using the “mgcv,” “lavaan,” “vegan,” “moments,” “stats,” and “Hmisc” packages in R software version 3.5.0 (R Core Team, 2013).
Results
The first two PCA axes accounted for 75.9% of the environmental variations (Figure 3) and represented the major environmental gradients in our study area. The first axis was positively correlated with TP and TN but negatively correlated with convexity, while the second axis was mainly positively correlated with slope. Correlations among environmental factors were further explicitly examined by Pearson correlation analysis (Supplementary Figure S1), which revealed a significant positive correlation between TP and TN and a significant negative correlation between convexity and each of the other environmental variables. In addition, correlations among skewness, d, and PS were significantly positive, while the correlation between SR and d was significantly negative (Figure 4). In particular, d had a stronger correlation with skewness than PS, indicating that SAD symmetry is more dependent on species dominance.
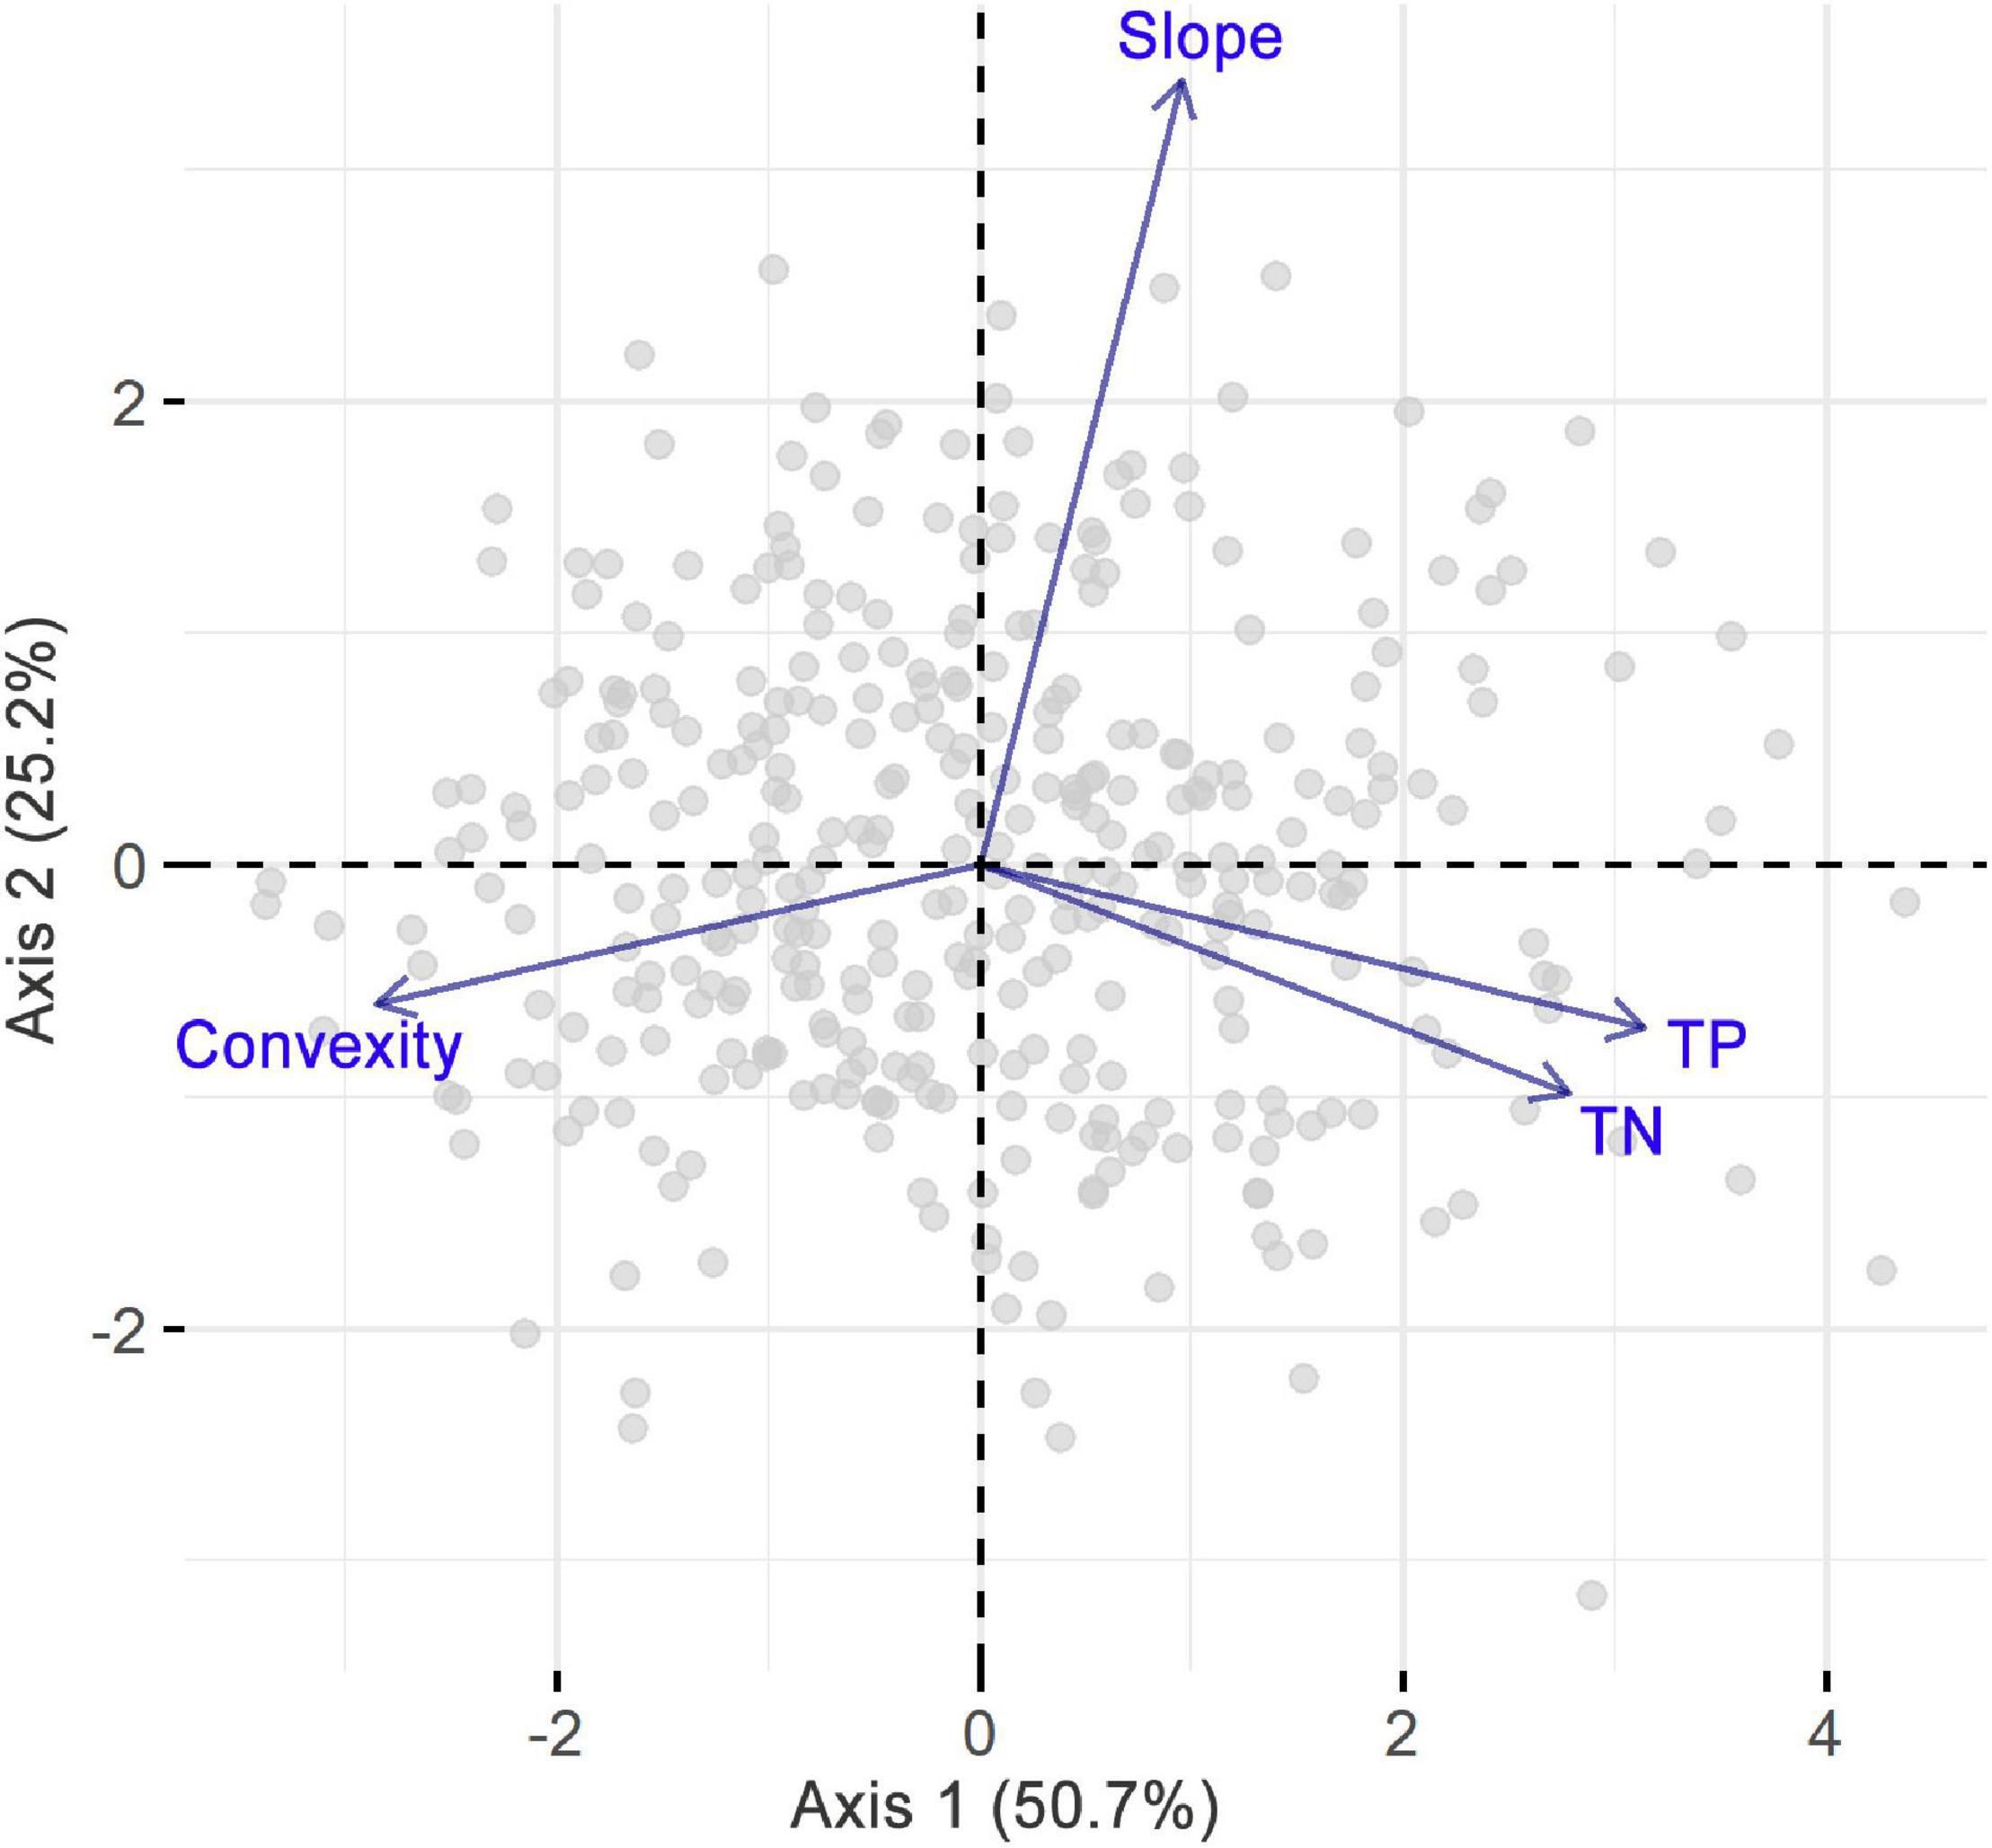
Figure 3. Principal component analysis on slope, convexity, soil total nitrogen (TN), and phosphorus (TP) concentrations.
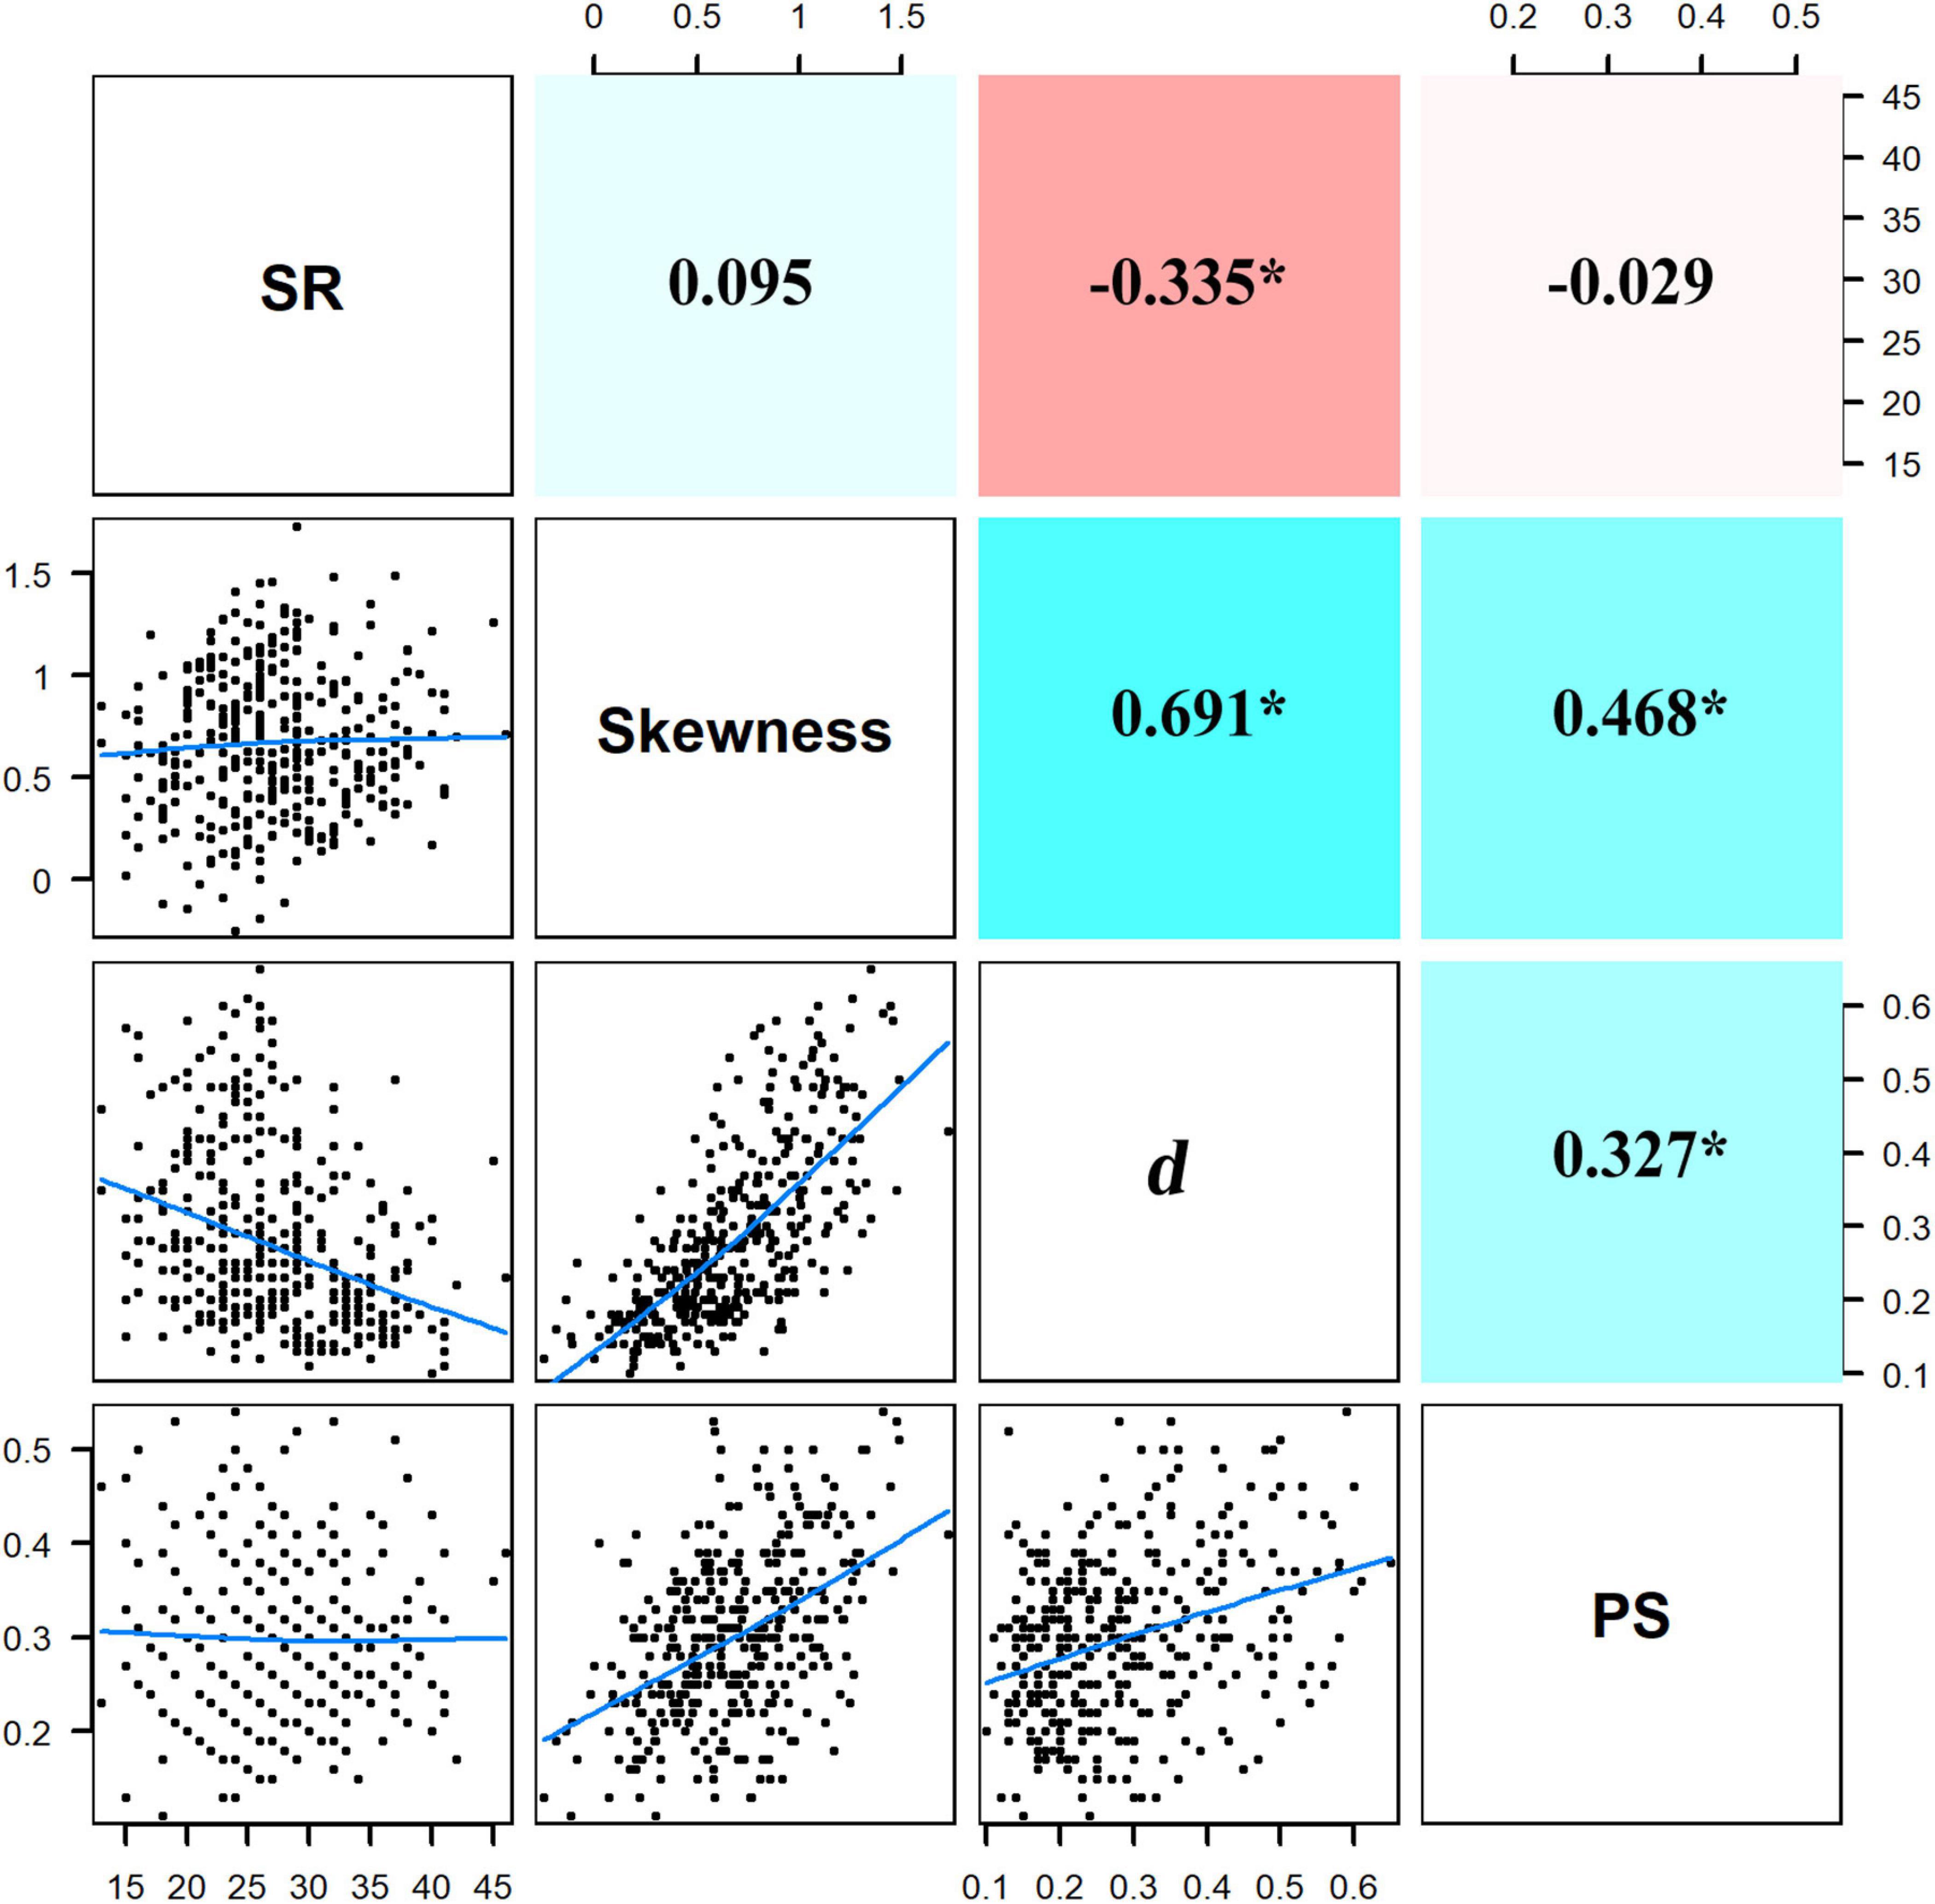
Figure 4. Pairwise relationships among species richness (SR), skewness, Berger–Parker index (d), and proportion of singletons (PS). Blue lines in the bottom left panels are the smooth curves about the pairwise relationships. Values in the upper right panels are the coefficients of correlation with significant values asterisked (p < 0.05); positive and negative coefficients have their background panels colored with cyan and red, respectively, larger absolute values of coefficients are in darker colors.
SR significantly decreased along gradients of TP and TN (Figure 5). Values of SAD metrics significantly increased along gradients of TP and TN but decreased with increasing convexity. Moreover, values of skewness and d also showed significant increases with increasing slope degree. In total, 9.5–17.1% of variations in diversity patterns were explained by environmental factors. Only 1.2–5.9% of variations in diversity patterns were explained by both soil nutrients and topographical factors (Figure 6). Soil nutrients and topographical factors displayed the same explanatory power for skewness by accounting for 10.7% of variations; soil nutrients displayed stronger explanatory power for SR, d, and PS by accounting for more of their variations.
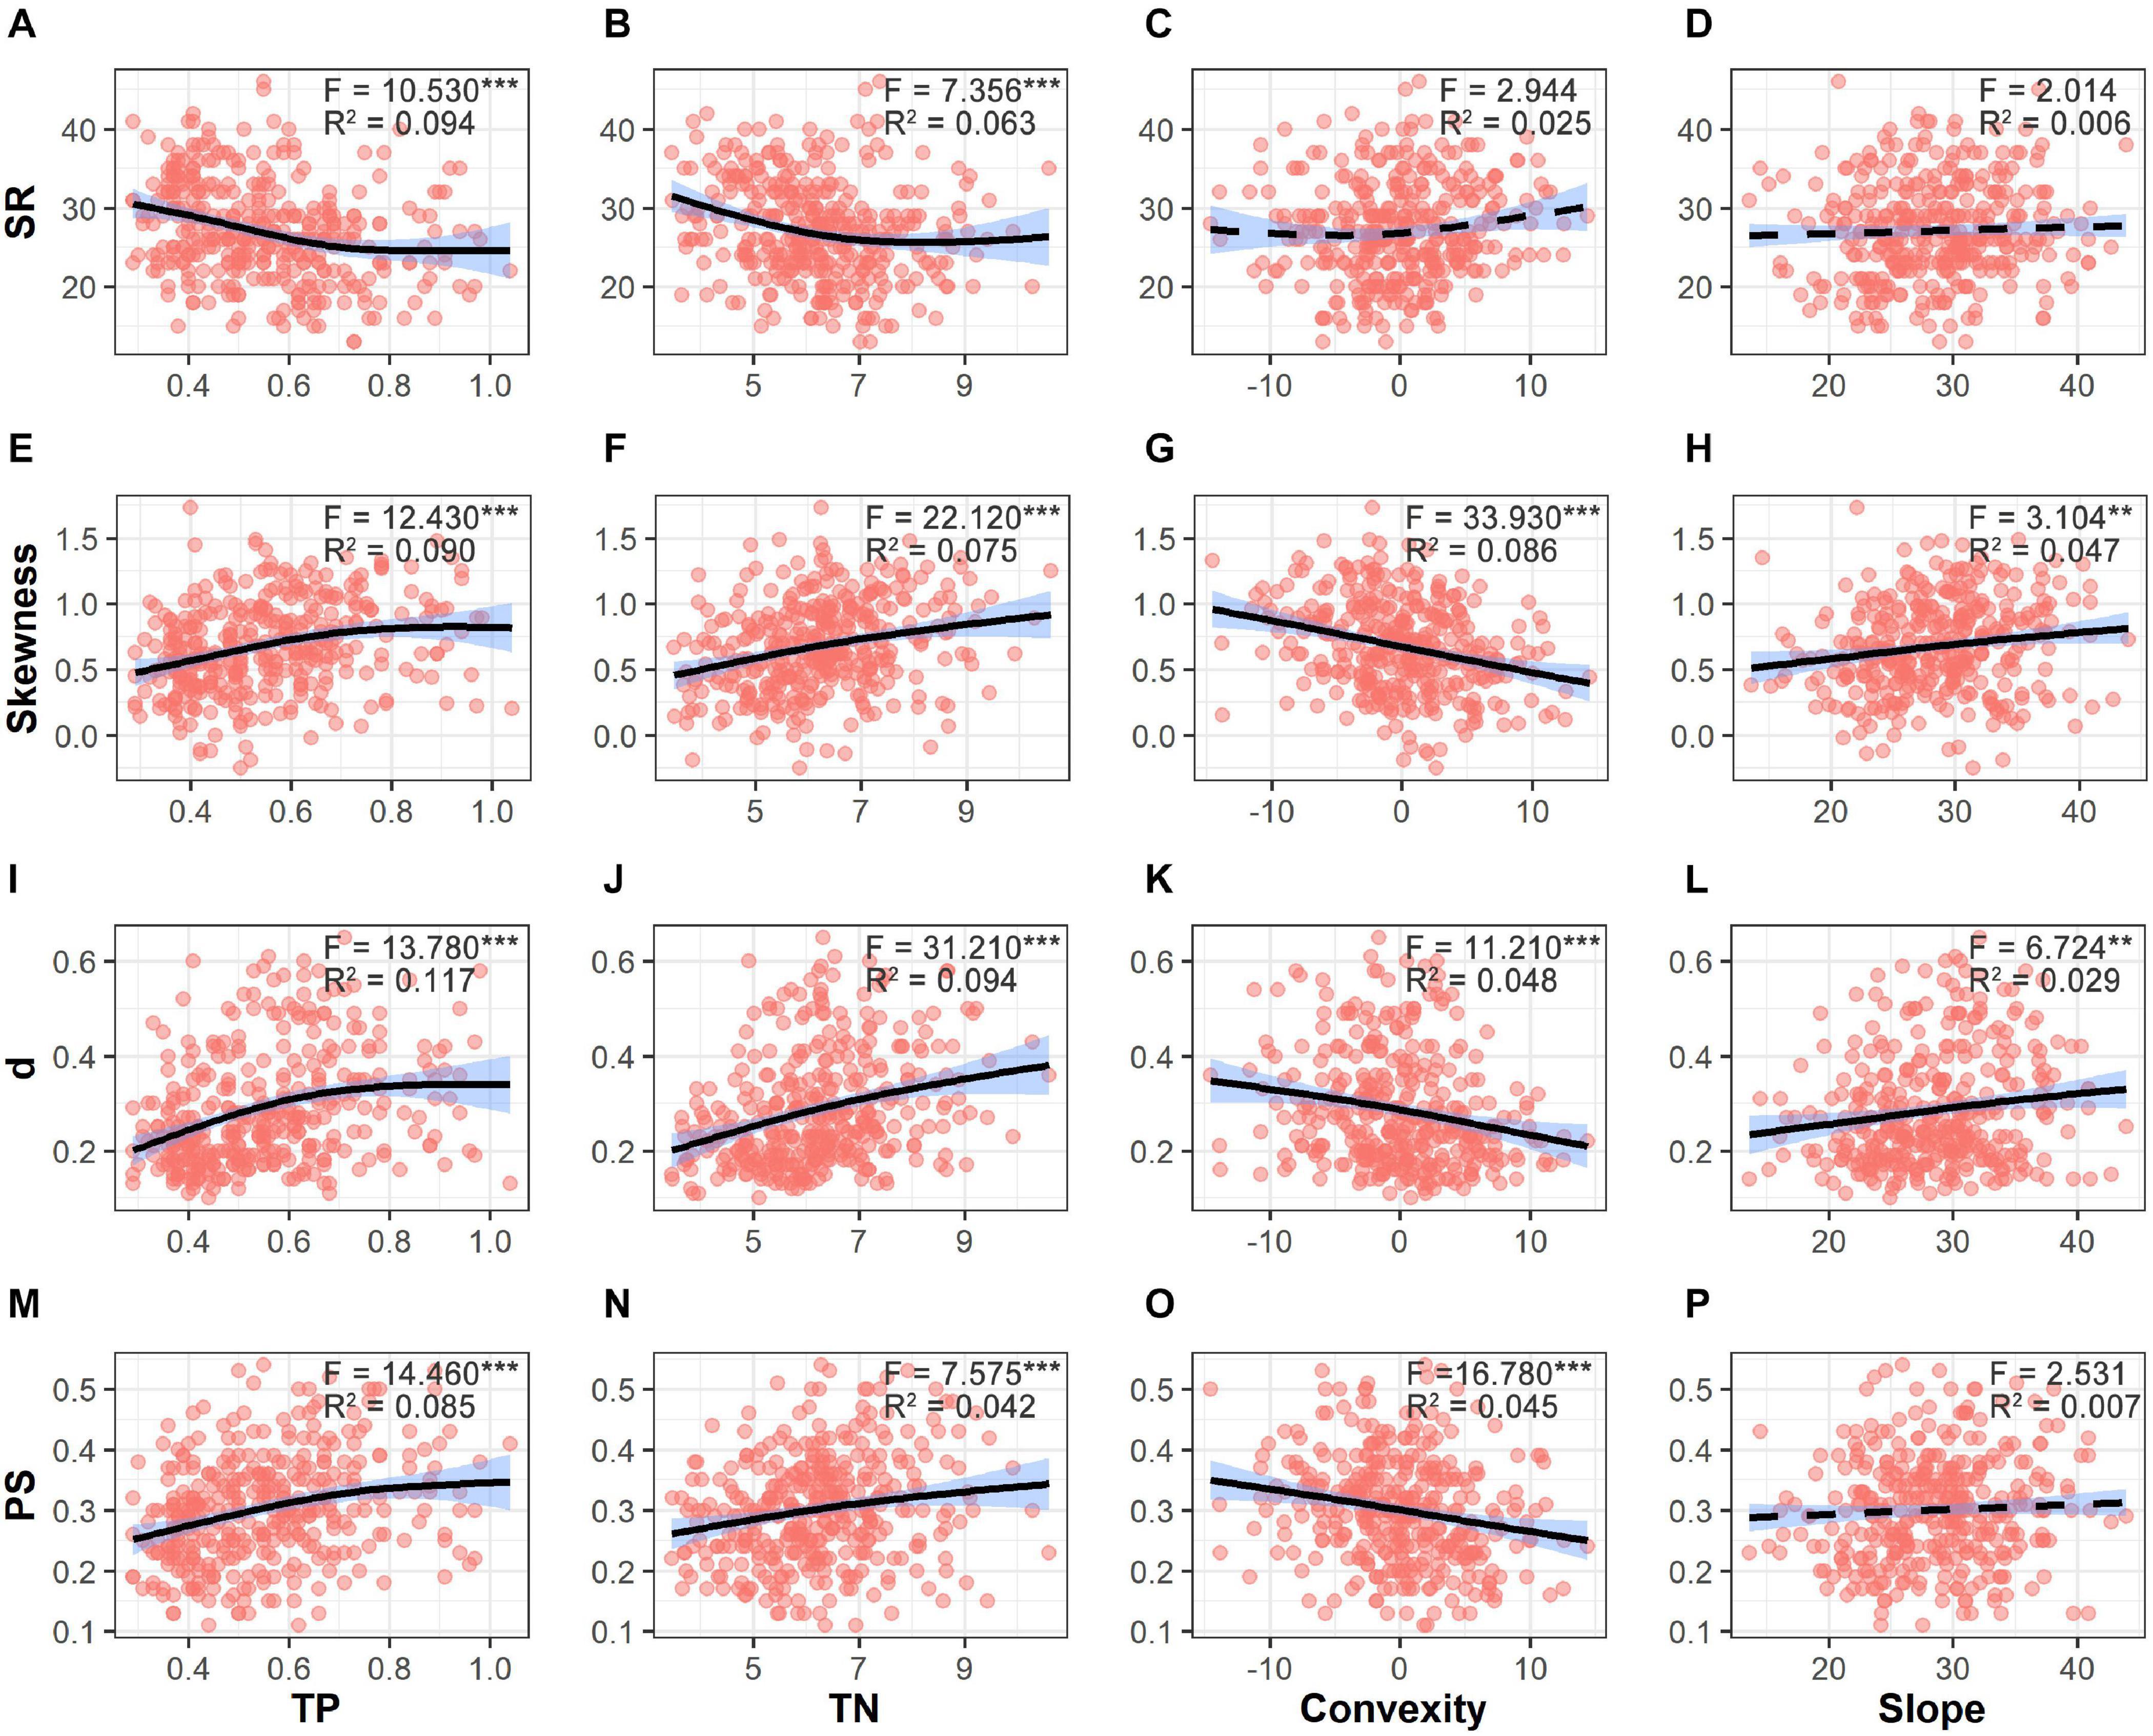
Figure 5. Variations in species richness (SR, A–D), skewness (E–H), d (the Berger–Parker index, I–L), and PS (proportion of singletons, M–P) along the gradients of soil total phosphorus (TP), soil total nitrogen (TN), convexity and slope. Fitted lines are shown in black with 95% interval colored in blue. Solid lines refer to significant relationships (p < 0.05), while dashed lines refer to non-significant relationships. Significant level: ***p < 0.001; **p < 0.01.
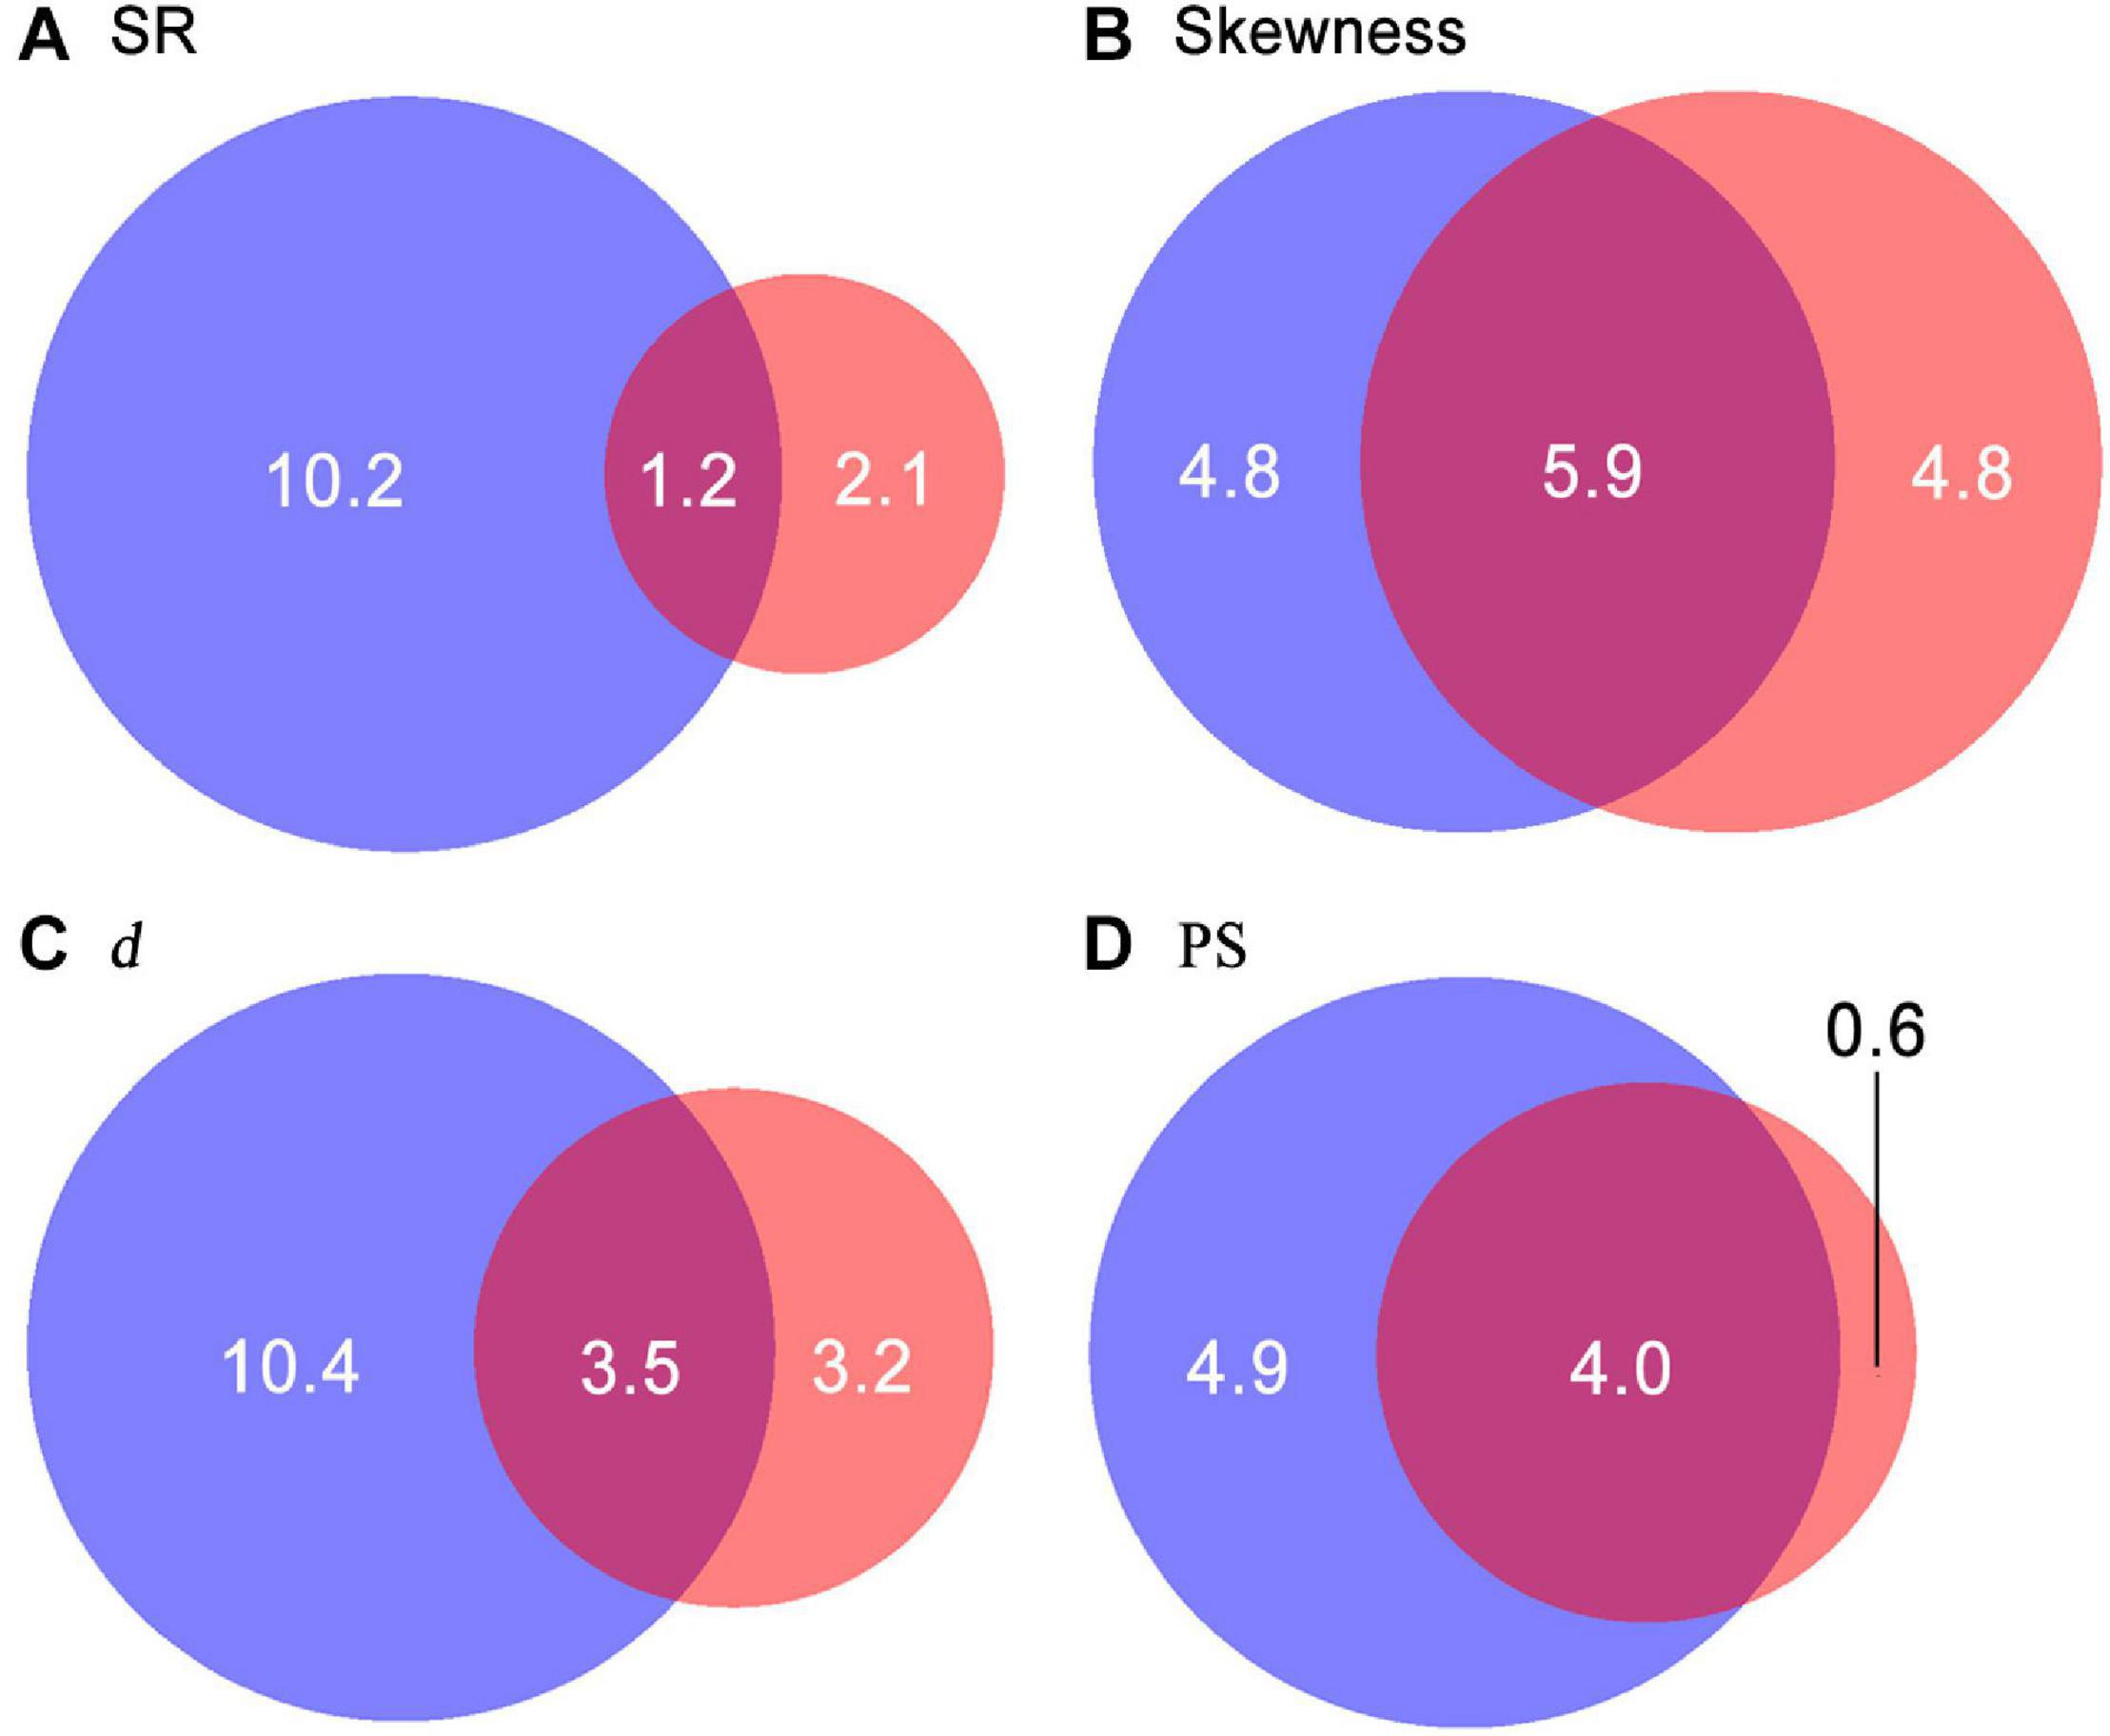
Figure 6. Variation partitioning for SR (species richness, A), skewness (B), d (the Berger–Parker index, C), and PS (proportion of singletons, D). Sums of values within the blue and red circles are the percentage of variations in diversity patterns explained by soil nutrients and topographical factors, respectively. Values in the overlapping areas between the two circles are the proportions of variations jointly explained by soil nutrients and topographical factors.
The SEM provided reliable fits to environmental effects on diversity patterns (p > 0.05, CFI > 0.95, GFI > 0.95, SRMR < 0.08; Figure 7 and Supplementary Table S1). Soil nutrients had significantly negative effects on SR (SES = −0.39) and positive effects on SAD metrics (SES = 0.24–0.38). The total effects of slope on skewness (SES = 0.11) and d (SES = 0.12) are significant, and such effects were almost independent of soil nutrients. The total effects of convexity on SR (SES = 0.12) and all SAD metrics (SES = −0.27 to −0.19) were also significant, but these effects were mostly mediated by soil nutrients. In addition, convexity also negatively effected SR (SES = −0.12) and skewness (SES = −0.12), independent of soil nutrients, but these effects were only significant at the 10% level.
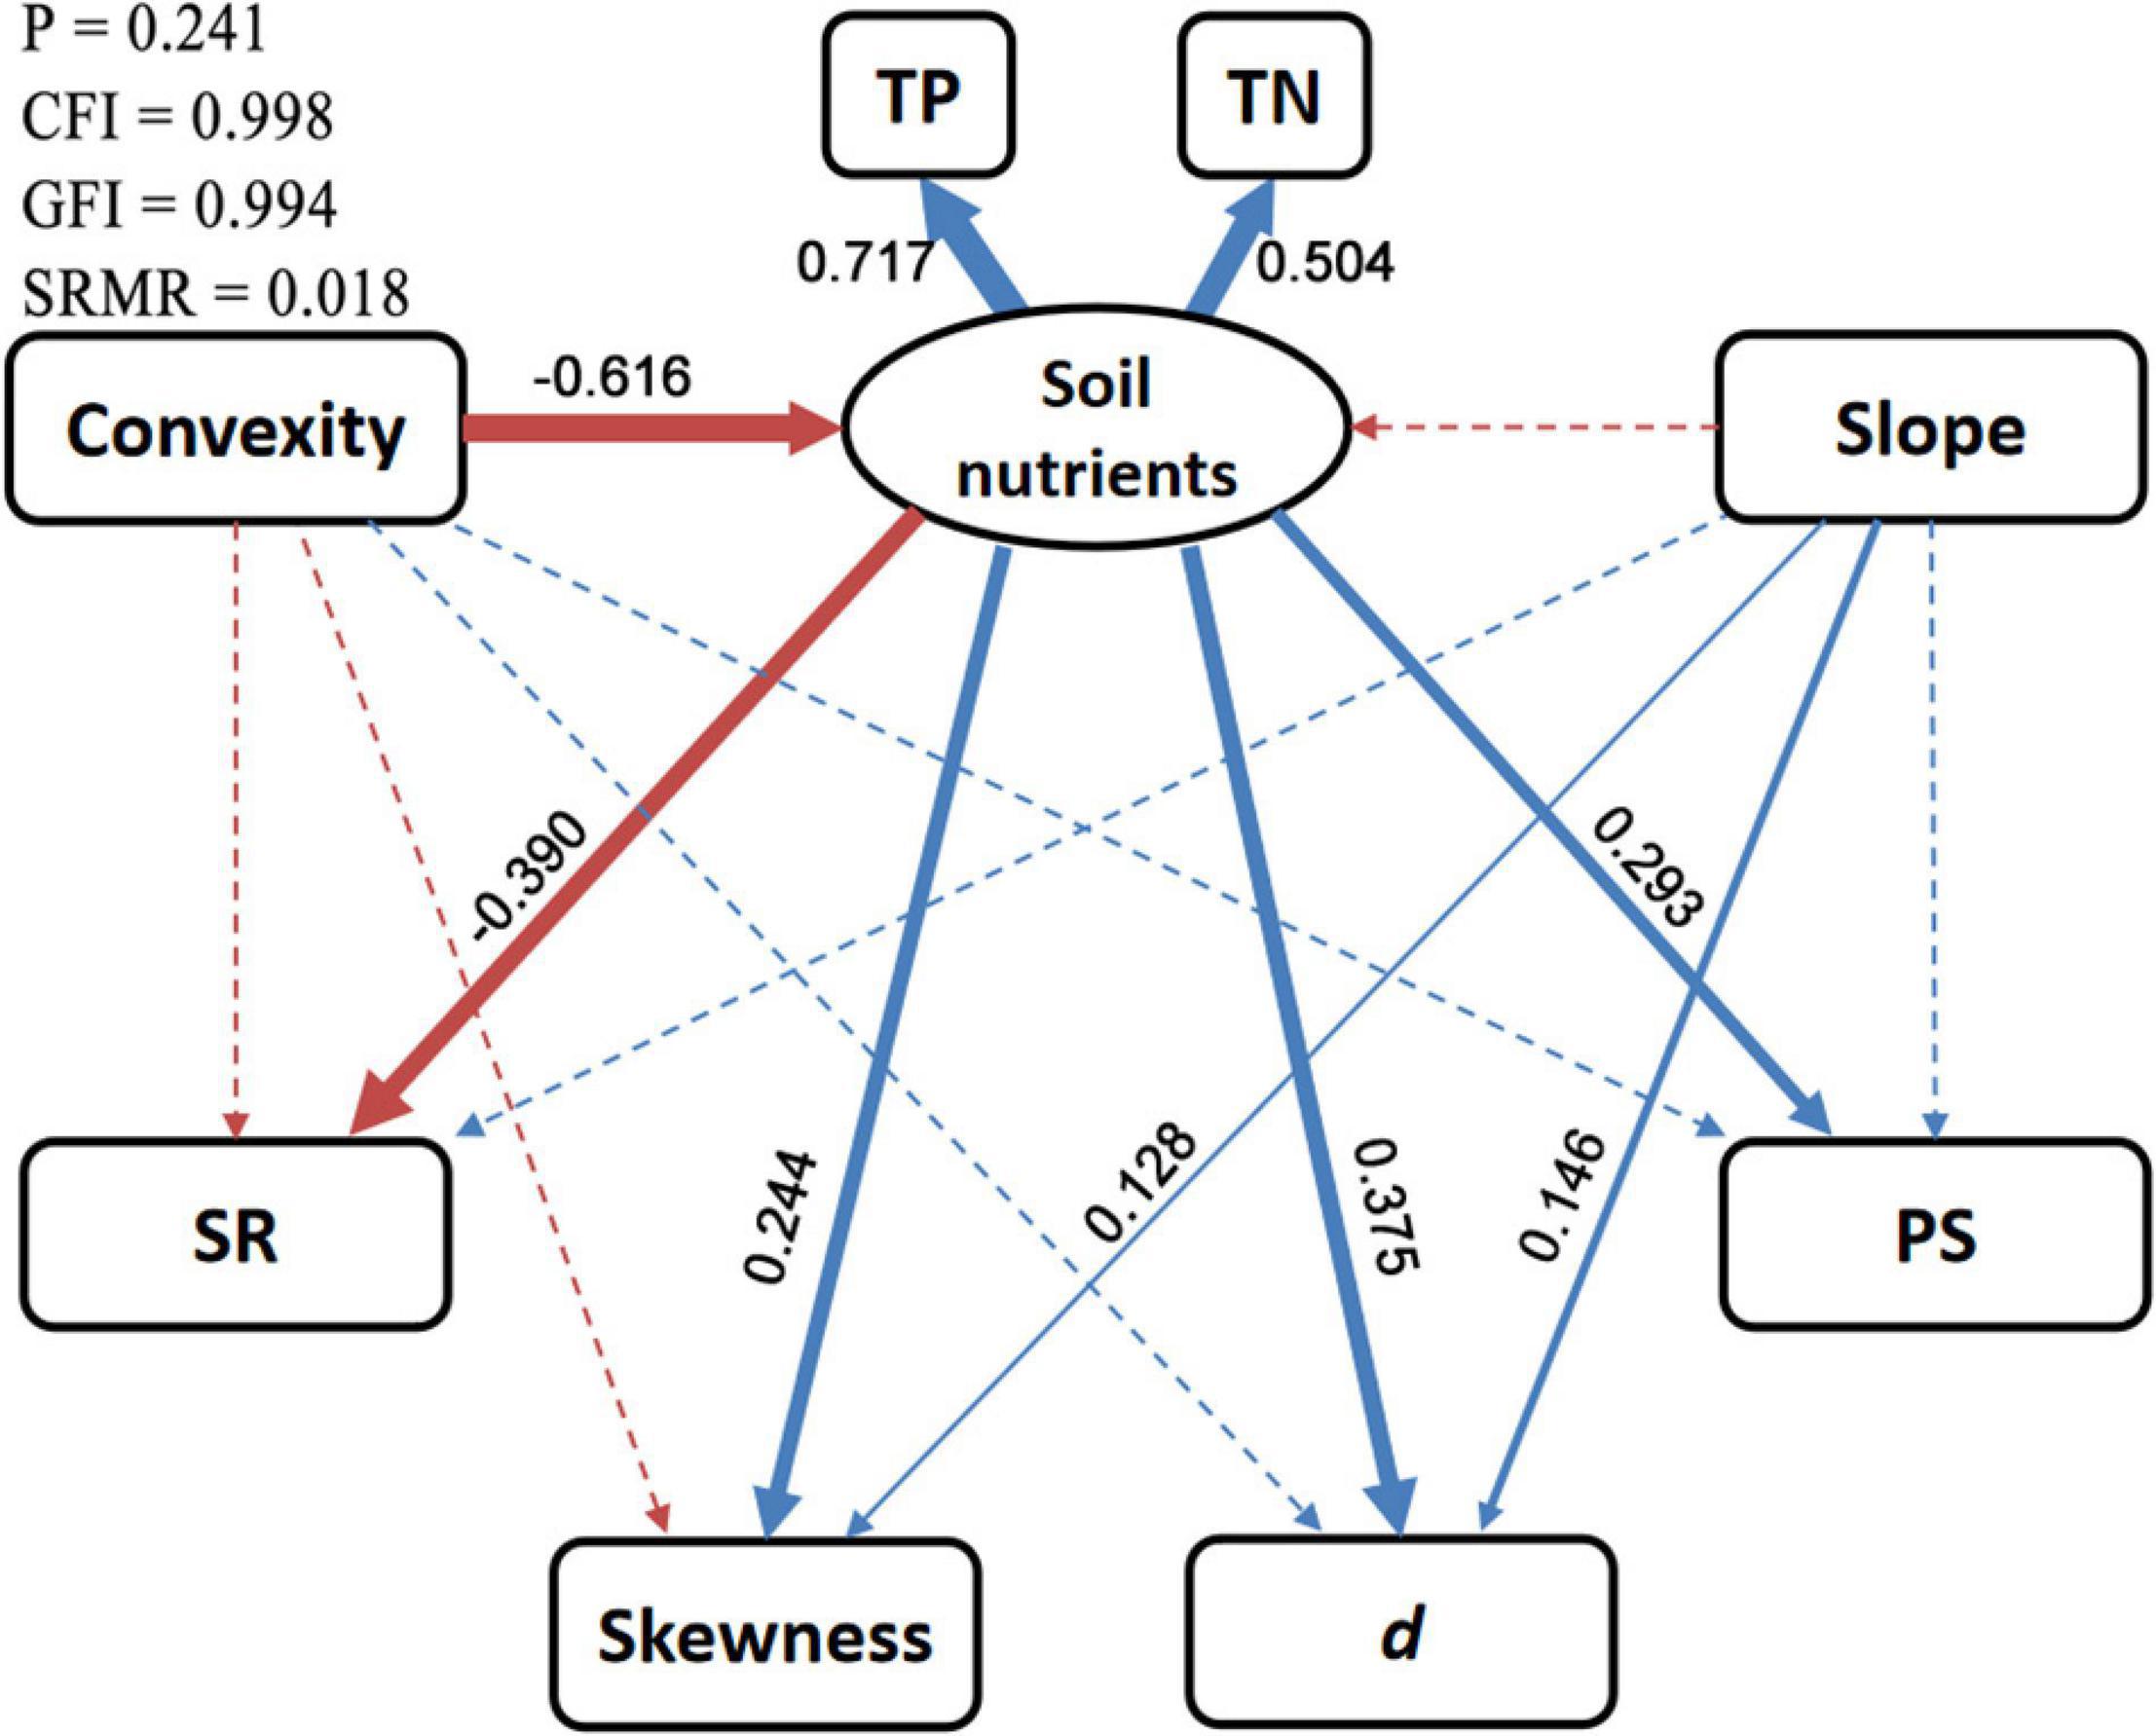
Figure 7. Diagrammatic sketch of structural equation model for environmental effects on diversity patterns. Solid and dashed arrows represent significant (p < 0.05) and non-significant direct effects, respectively. Blue and red arrows represent positive and negative effects, respectively. Standardized effect sizes (SESs) for the significant direct effects are shown beside arrows with widths proportional to the absolute values of SESs. SR, species richness; d, Berger–Parker index; PS, proportion of singletons; TP, soil total phosphorus; TN, soil total nitrogen. More detailed results are shown in Supplementary Table S1.
Discussion
At local scales, topographical factors and soil nutrients have been widely recognized as significant determinants of forest community features (Baldeck et al., 2013; Jucker et al., 2018; Zuleta et al., 2018; Sellan et al., 2019; Chun et al., 2020). In EDBMF, these factors turn out to be the important drivers for species distribution and composition (Wang et al., 2014; Huang et al., 2015; Qiao et al., 2015b; Wang et al., 2017). However, it remains poorly understood how tree species dominance, rarity, and richness in this forest vary in response to topographical factors and soil nutrients. Such information was investigated in the present study using data from a 15-ha plot to inform scientific understanding of the role of environmental conditions in the local species diversity maintenance in EDBMF.
Our results showed that SAD attributes varied with either topographical factors or soil nutrients, whereas SR only exhibited significant variations along soil nutrient gradients. The resulting weak SR–topography relationship is consistent with the recent finding in a tropical forest (Rodrigues et al., 2020). We further discovered that soil nutrients accounted for more variations in species dominance, rarity, and richness than topographical factors, reflecting a relatively greater importance of soil nutrients in governing local diversity patterns. Specifically, increasing soil nutrient levels led to decreases in taxonomic diversity and increases in species dominance and rarity. Similar outcomes evidenced in several ecosystems (Midolo et al., 2018), especially in forest (Peña-Claros et al., 2012) and grassland (Simons et al., 2017), have been attributed to plant competitions.
Plant competition has long been assumed to depend on soil nutrients, which are the limiting factors for plant growth and community productivity. A resource-implicit hypothesis suggests that total competition intensity increases with productivity (Grime, 1973). A resource-explicit hypothesis states that plant competitions would shift from below- to above-ground parts as productivity increases, and then species diversity becomes more limited by the intensive above-ground competitions for light (Newman, 1973; Tilman, 1988). In essence, along with individual growth, plants are more engaged in competing for nutrients because of the ever-growing requirements, and/or for light as neighborhood shading becomes more prevalent. These circumstances underlie the intense competitions in the productive communities. Many studies on forests have revealed strong light limitation in nutrient-rich sites caused by canopy shading (Coomes and Grubb, 2000; Palmiotto et al., 2004; Coomes et al., 2009). This could be the reason why the resource-explicit hypothesis has been widely advocated (DeMalach et al., 2016, 2017; Harpole et al., 2016).
Intensive interspecific competitions could reduce taxonomic diversity and SAD evenness (Grime, 1973; Arellano et al., 2017). Under such competitions, some of the less-competitive species are excluded within a short time, while the others have their population sizes limited to low levels and then face a high risk of going extinct locally. Only a few competitive species are able to be dominant. Interestingly, there is a long-standing debate on what underlies the competitive ability of plants (Bengtsson et al., 1994). Eurya alata, known for its shade tolerance, conservative resource use, and slow growth (Tang et al., 2016), was the only species that highly predominated in the nutrient-rich sites of our study area (Supplementary Figure S2). This finding supports the standpoint that slow-growing species with conservative resource use and strong tolerance to low resource levels can be the superior competitors (Tilman, 1982; Dybzinski and Tilman, 2007; Atwater et al., 2020). A demographic trade-off among trees denotes that fast-growing species are generally intolerant to low resource levels and more vulnerable to competition (Shipley and Keddy, 1988; Kobe and Vriesendorp, 2011; Rüger et al., 2020). Hence, slow-growing, tolerant tree species are more likely to predominate in forest communities, especially over the long run.
Topographical effects on forest communities are mediated by several factors related to, e.g., thermal, hydrologic, and edaphic conditions (Moser et al., 2009; Punchi-Manage et al., 2014; Fortunel et al., 2018). In our study, convexity showed significant effects on SAD and SR via soil nutrients, but slope did not; specifically, decreased convexity enriched soil nutrients and then reduced SAD evenness and SR, while soil nutrients hardly changed with slope. Hydrologic leaching and soil erosion may be the processes making low-lying conditions more nutrient-rich (Chadwick and Asner, 2016; Jucker et al., 2018). In addition, topographical factors were also influential in a way that was independent of soil nutrients. Increasing steepness was found to result in strong species dominance. This may be due to the large surface area of steep sites (Wang et al., 2014) or to the strong environmental heterogeneity. Slope per se is a measure of topographical heterogeneity (Stein et al., 2014). Heterogeneous conditions consist of various micro-habitats that favor prevalence of generalists in resource use (Batáry et al., 2007). However, increased slope only led to a slight SR increase, hardly supporting for the hypothesis that diverse species can coexist in environmentally heterogeneous conditions (Stein et al., 2014). Moreover, convexity exhibited non-significant but noticeable negative effects on species dominance and richness. This probably relates to the typical increase in soil thickness with decreasing convexity (Fortunel et al., 2018), because thick soil layers may promote the persistence and coexistence of species with varying root depths (Levine and HilleRisLambers, 2009).
Topographical factors should be used as proxy variables (for soil properties as well as for other factors) with caution, as suggested by our findings. We found non-significant SR variations along the convexity gradient, but convexity showed noticeable positive and negative effects on SR via different pathways. This indicates that investigating diversity variations along topographical gradients is inefficient for revealing topographical effects on diversity patterns. Therefore, it is essential to consider the directly effectual environmental factors for studying environmental impacts on forest communities, or else it may result in misunderstandings. Zuleta et al. (2018) found that soil properties were less heterogeneous across a 25-ha tropical forest plot and varied weakly along topographical gradients; the authors attributed this to the homogeneity of parent material, which should be common at a local scale. In such cases, the effect of soil factors will be overestimated if topographical factors are used as proxy variables for that. In a 100-ha tropical forest plot, Hall et al. (2004) observed that none of the focal species showed any preferences for topographical conditions, but most of them were significantly associated with soil properties. In our study, convexity was a surrogate for soil nutrients, but slope was not, suggesting the need to evaluate the applicability of individual topographical factors for being the proxy variable.
Environmental factors considered in this study accounted for a fraction of variation in diversity patterns. This may be ascribed to the spatial scale at which the environmental effects and species diversity were examined. From the perspective of grain size, forest community features are of strong variability across small quadrats, and this may obscure the variations along environmental gradients (Spake et al., 2020). In consideration of spatial extent, it is plausible that forest community features do not change remarkably along the relatively short environmental gradients within a local scale (<1 km2). As such, it is not surprising that environmental factors play limited roles in shaping small-scale community features. At the 20 m × 20 m local scale, for example, the impacts of resource quantity (i.e., a group of various resource factors) on SR patterns in two species-rich forests were studied by Zhang et al. (2020), who found that resource quantity only accounted for 0.8% of SR variation in a 50-ha tropical forest plot in Barro Colorado Island and for 4.9% of that in a 24-ha subtropical forest plot in Gutianshan.
It is also noteworthy that we only considered the roles of a few abiotic factors, and some biotic and other abiotic factors (e.g., microclimate and light conditions) that are not considered here may act on diversity patterns as well. In particular, the diversity maintenance mechanisms could be various and based on different ecological processes, but not all of them underlie how environmental conditions affect diversity patterns. At small scales, population dynamics and species turnovers are assumed to be susceptible to ecological drifts (Shipley et al., 2012), immigration events (Volkov et al., 2007), and some processes taking place among neighbors. This denotes the potential importance of neutral processes and negative density dependence on diversity maintenance. To better decipher the diversity maintenance mechanisms of EDBMF, exploring the influences of the other potential factors and/or processes on diversity patterns would be a significant step forward.
Conclusion
In our study area, SR and SAD varied along gradients of topography and soil nutrients, while soil nutrients exhibited stronger influences than topographical factors on these patterns. Forest communities tended to show low taxonomic diversity and strong species dominance and rarity in nutrient-rich conditions. Convexity mainly acted on diversity SR and SAD patterns via soil nutrients, while slope had positive effects, barely related to the effects of soil nutrients, on species dominance. Topographical factors and soil nutrients played significant but limited roles in local diversity maintenance. Presumably, the limited roles of environmental factors can be attributed to the fact that environmental effects were studied at small scales, but this also indicates the potential importance of the other drivers for the observed diversity patterns.
Data Availability Statement
The original contributions presented in the study are included in the article/Supplementary Material, further inquiries can be directed to the corresponding author/s.
Author Contributions
JL, RZ, and JH designed the research project and provided theoretical guidance. GF collected the data. GF analyzed the data and wrote the first draft with the help of YX. All authors approved the final submission.
Funding
This study was founded by the Fundamental Research Funds for the Central Non-profit Research Institution of CAF (CAFYBB2019ZA002) and the National Natural Science Foundation of China (41771059 and 41701055).
Conflict of Interest
The authors declare that the research was conducted in the absence of any commercial or financial relationships that could be construed as a potential conflict of interest.
Acknowledgments
We would like to thank Xunru Ai, Lan Yao, Jiang Zhu, Yi Ding, and Yongtao Huang for establishing this 15-ha plot. We are grateful to Gangqing Xiao, Xianqi Mi, and Heng Zeng from the Administration of the Mulinzi National Nature Reserve for their assistance in our field work. We are also grateful to Saraj Bahadur at Hainan University and Elizabeth Tokarz at Yale University for their English language editing.
Supplementary Material
The Supplementary Material for this article can be found online at: https://www.frontiersin.org/articles/10.3389/fpls.2021.622043/full#supplementary-material
References
Arellano, G., Umaña, M. N., Macía, M. J., Loza, M. I., Fuentes, A., Cala, V., et al. (2017). The role of niche overlap, environmental heterogeneity, landscape roughness and productivity in shaping species abundance distributions along the Amazon–Andes gradient. Glob. Ecol. Biogeogr. 26, 191–202. doi: 10.1111/geb.12531
Atwater, D. Z., Callaway, R. M., and Xiao, S. (2020). Competition as a demolition derby: why tolerating competitors is more important than suppressing them. Oikos 130, 143–155. doi: 10.1111/oik.07634
Baldeck, C. A., Harms, K. E., Yavitt, J. B., John, R., Turner, B. L., Valencia, R., et al. (2013). Soil resources and topography shape local tree community structure in tropical forests. Proc. R. Soc. B 280, 20122532. doi: 10.1098/rspb.2012.2532
Batáry, P., Báldi, A., Gyõzõ, S., Attila, P., István, R., and Sarolta, E. (2007). Responses of grassland specialist and generalist beetles to management and landscape complexity. Divers. Distrib. 13, 196–202.
Bengtsson, J., Fagerström, T., and Rydin, H. (1994). Competition and coexistence in plant communities. Trends Ecol. Evol. 9, 246–250. doi: 10.1016/0169-5347(94)90289-5
Bertness, M. D., and Callaway, R. (1994). Positive interactions in communities. Trends Ecol. Evol. 9, 191–193. doi: 10.1016/0169-5347(94)90088-4
Cadotte, M. W., and Tucker, C. M. (2017). Should environmental filtering be abandoned? Trends Ecol. Evol. 32, 429–437. doi: 10.1016/j.tree.2017.03.004
Chadwick, K. D., and Asner, G. P. (2016). Tropical soil nutrient distributions determined by biotic and hillslope processes. Biogeochemistry 127, 273–289. doi: 10.1007/s10533-015-0179-z
Chao, A., Gotelli, N. J., Hsieh, T. C., Sander, E. L., Ma, K. H., Colwell, R. K., et al. (2014). Rarefaction and extrapolation with Hill numbers: a framework for sampling and estimation in species diversity studies. Ecol. Monogr. 84, 45–67. doi: 10.1890/13-0133.1
Chisholm, R. A., and Pacala, S. W. (2010). Niche and neutral models predict asymptotically equivalent species abundance distributions in high-diversity ecological communities. Proc. Natl. Acad. Sci. U.S.A. 107, 15821–15825. doi: 10.1073/pnas.1009387107
Chun, J. H., Ali, A., and Lee, C. B. (2020). Topography and forest diversity facets regulate overstory and understory aboveground biomass in a temperate forest of South Korea. Sci. Total Environ. 744:140783. doi: 10.1016/j.scitotenv.2020.140783
Coomes, D. A., and Grubb, P. J. (2000). Impacts of root competition in forests and woodlands: a theoretical framework and review of experiments. Ecol. Monogr. 70, 171–207.
Coomes, D. A., Kunstler, G., Canham, C. D., and Wright, E. (2009). A greater range of shade-tolerance niches in nutrient-rich forests: an explanation for positive richness–productivity relationships? J. Ecol. 97, 705–717. doi: 10.1111/j.1365-2745.2009.01507.x
DeMalach, N., Zaady, E., and Kadmon, R. (2017). Light asymmetry explains the effect of nutrient enrichment on grassland diversity. Ecol. Lett. 20, 60–69. doi: 10.1111/ele.12706
DeMalach, N., Zaady, E., Weiner, J., and Kadmon, R. (2016). Size asymmetry of resource competition and the structure of plant communities. J. Ecol. 104, 899–910. doi: 10.1111/1365-2745.12557
Du, E., Terrer, C., Pellegrini, A. F. A., Ahlström, A., van Lissa, C. J., Zhao, X., et al. (2020). Global patterns of terrestrial nitrogen and phosphorus limitation. Nat. Geosci. 13, 221–226. doi: 10.1038/s41561-019-0530-4
Dybzinski, R., and Tilman, D. (2007). Resource use patterns predict long-term outcomes of plant competition for nutrients and light. Am. Nat. 170, 305–318. doi: 10.1086/519857
Fortunel, C., Lasky, J. R., Uriarte, M., Valencia, R., Wright, S. J., Garwood, N. C., et al. (2018). Topography and neighborhood crowding can interact to shape species growth and distribution in a diverse Amazonian forest. Ecology 99, 2272–2283. doi: 10.1002/ecy.2441
Ge, J., and Xie, Z. (2017). Geographical and climatic gradients of evergreen versus deciduous broad-leaved tree species in subtropical China: implications for the definition of the mixed forest. Ecol. Evol. 7, 3636–3644. doi: 10.1002/ece3.2967
Grace, J. B., Anderson, T. M., Seabloom, E. W., Borer, E. T., Adler, P. B., Harpole, W. S., et al. (2016). Integrative modelling reveals mechanisms linking productivity and plant species richness. Nature 529:390. doi: 10.1038/nature16524
Grime, J. P. (1973). Competitive exclusion in herbaceous vegetation. Nature 242, 344–347. doi: 10.1038/242344a0
Hall, J. S., McKenna, J. J., Ashton, P. M. S., and Gregoire, T. G. (2004). Habitat characterizations underestimate the role of edaphic factors controlling the distribution of Entandrophragma. Ecology 85, 2171–2183. doi: 10.1890/03-0043
Harpole, W., Sullivan, L., Lind, E., Firn, J., Adler, P., Borer, E., et al. (2016). Addition of multiple limiting resources reduces grassland diversity. Nature 537, 93–96. doi: 10.1038/nature19324
Huang, J., Huang, J., Liu, C., Zhang, J., Lu, X., and Ma, K. (2016). Diversity hotspots and conservation gaps for the Chinese endemic seed flora. Biol. Conserv. 198, 104–112. doi: 10.1016/j.biocon.2016.04.007
Huang, Y., Ai, X., Yao, L., Zang, R., Ding, Y., Huang, J., et al. (2015). Changes in the diversity of evergreen and deciduous species during natural recovery following clear-cutting in a subtropical evergreen-deciduous broadleaved mixed forest of central China. Trop. Conserv. Sci. 8, 1033–1052. doi: 10.1177/194008291500800413
Hubbell, S. P. (2001). The Unified Neutral Theory of Biodiversity and Biogeography. Princeton, NJ: Princeton University Press.
Jabot, F. (2009). A stochastic dispersal-limited trait-based model of community dynamics. J. Theor. Biol. 262, 650–661. doi: 10.1016/j.jtbi.2009.11.004
John, R., Dalling, J. W., Harms, K. E., Yavitt, J. B., Stallard, R. F., Mirabello, M., et al. (2007). Soil nutrients influence spatial distributions of tropical tree species. Proc. Natl. Acad. Sci. U.S.A. 104, 864–869. doi: 10.1073/pnas.0604666104
Jucker, T., Bongalov, B., Burslem, D. F. R. P., Nilus, R., Dalponte, M., Lewis, S. L., et al. (2018). Topography shapes the structure, composition and function of tropical forest landscapes. Ecol. Lett. 21, 989–1000. doi: 10.1111/ele.12964
Keddy, P. A. (1992). Assembly and response rules two goals for predictive community ecology. J. Veg. Sci. 3, 157–164.
Kobe, R. K., and Vriesendorp, C. F. (2011). Conspecific density dependence in seedlings varies with species shade tolerance in a wet tropical forest. Ecol. Lett. 14, 503–510. doi: 10.1111/j.1461-0248.2011.01612.x
Kraft, N. J. B., and Ackerly, D. D. (2010). Functional trait and phylogenetic tests of community assembly across spatial scales in an Amazonian forest. Ecol. Monogr. 80, 401–422. doi: 10.1890/09-1672.1
Kunte, K. (2008). Competition and species diversity: removal of dominant species increases diversity in Costa Rican butterfly communities. Oikos 117, 69–76. doi: 10.1111/j.2007.0030-1299.16125.x
Levin, S. A. (1995). “The problem of pattern and scale in ecology,” in Ecological Time Series, eds M. Powell and J. H. Steele (Boston, MA: Springer US), 277c326.
Levine, J., and HilleRisLambers, J. (2009). The importance of niches for the maintenance of species diversity. Nature 461, 254–257. doi: 10.1038/nature08251
MacArthur, R. H., and Wilson, E. O. (1967). The Theory of Island Biogeography. Princeton, NJ: Princeton University Press.
Maire, V., Gross, N., Börger, L., Proulx, R., Wirth, C., Pontes, L. D. S., et al. (2012). Habitat filtering and niche differentiation jointly explain species relative abundance within grassland communities along fertility and disturbance gradients. New Phytol. 196, 497–509. doi: 10.1111/j.1469-8137.2012.04287.x
Matthews, T. J., Borges, P. A. V., de Azevedo, E. B., and Whittaker, R. J. (2017). A biogeographical perspective on species abundance distributions: recent advances and opportunities for future research. J. Biogeogr. 44, 1705–1710. doi: 10.1111/jbi.13008
Matthews, T. J., Sadler, J. P., Kubota, Y., Woodall, C. W., and Pugh, T. A. M. (2019). Systematic variation in North American tree species abundance distributions along macroecological climatic gradients. Global Ecol. Biogeogr. 28, 601–611. doi: 10.1111/geb.12879
Matthews, T. J., and Whittaker, R. J. (2014). Fitting and comparing competing models of the species abundance distribution: assessment and prospect. Front. Biogeogr. 6:6700. doi: 10.5811/westjem.2011.5.6700
Mcgill, B. J., Etienne, R. S., Gray, J. S., Alonso, D., Anderson, M. J., Benecha, H. K., et al. (2007). Species abundance distributions: moving beyond single prediction theories to integration within an ecological framework. Ecol. Lett. 10, 995–1015. doi: 10.1111/j.1461-0248.2007.01094.x
Midolo, G., Alkemade, R., Schipper, A. M., Benítez-Lóez, A., Perring, M. P., and De Vries, W. (2018). Impacts of nitrogen addition on plant species richness and abundance: a global meta−analysis. Global Ecol. Biogeogr. 28, 1–16. doi: 10.111/geb.12856
Moser, K. F., Ahn, C., and Noe, G. B. (2009). The influence of microtopography on soil nutrients in created mitigation wetlands. Restoration Ecol. 17, 641–651. doi: 10.1111/j.1526-100X.2008.00393.x
Newman, E. I. (1973). Competition and diversity in herbaceous vegetation. Nature 244, 310–310. doi: 10.1038/244310a0
Palmiotto, P. A., Davies, S. J., Vogt, K. A., Ashton, M. S., Vogt, D. J., and Ashton, P. S. (2004). Soil-related habitat specialization in dipterocarp rain forest tree species in Borneo. J. Ecol. 92, 609–623. doi: 10.1111/j.0022-0477.2004.00894.x
Peña-Claros, M., Poorter, L., Alarcón, A., Blate, G., Choque, U., Fredericksen, T. S., et al. (2012). Soil effects on forest structure and diversity in a moist and a dry tropical forest. Biotropica 44, 276–283. doi: 10.1111/j.1744-7429.2011.00813.x
Punchi-Manage, R., Wiegand, T., Wiegand, K., Getzin, S., Gunatilleke, C. V. S., and Gunatilleke, I. A. U. N. (2014). Effect of spatial processes and topography on structuring species assemblages in a Sri Lankan dipterocarp forest. Ecology 95, 376–386. doi: 10.1890/12-2102.1
Qiao, X., Jabot, F., Tang, Z., Jiang, M., and Fang, J. (2015a). A latitudinal gradient in tree community assembly processes evidenced in Chinese forests. Global Ecol. Biogeogr. 24, 314–323. doi: 10.1111/geb.12278
Qiao, X., Li, Q., Jiang, Q., Lu, J., Franklin, S., Tang, Z., et al. (2015b). Beta diversity determinants in Badagongshan, a subtropical forest in central China. Sci. Rep. 5:17043. doi: 10.1038/srep17043
R Core Team (2013). R: A Language and Environment for Statistical Computing, Vol. 14. Vienna: R Foundation for Statistical Computing, 12–21.
Rodrigues, A. C., Villa, P. M., Ali, A., Ferreira-Júnior, W., and Neri, A. V. (2020). Fine-scale habitat differentiation shapes the composition, structure and aboveground biomass but not species richness of a tropical Atlantic forest. J. Forestry Res. 31, 1599–1611. doi: 10.1007/s11676-019-00994-x
Rüger, N., Condit, R., Dent, D. H., Dewalt, S. J., Hubbell, S. P., Lichstein, J. W., et al. (2020). Demographic trade-offs predict tropical forest dynamics. Science 368, 165–168. doi: 10.1126/science.aaz4797
Sellan, G., Thompson, J., Majalap, N., and Brearley, F. Q. (2019). Soil characteristics influence species composition and forest structure differentially among tree size classes in a bornean heath forest. Plant Soil 438, 173–185. doi: 10.1007/s11104-019-04000-5
Shipley, B., and Keddy, P. A. (1988). The relationship between relative growth rate and sensitivity to nutrient stress in 28 species of emergent macrophytes. J. Ecol. 76, 1101–1110. doi: 10.2307/2260637
Shipley, B., Paine, C. E. T., and Baraloto, C. (2012). Quantifying the importance of local niche-based and stochastic processes to tropical tree community assembly. Ecology 93, 760–769. doi: 10.1890/11-0944.1
Simons, N. K., Lewinsohn, T., Blüthgen, N., Buscot, F., Boch, S., Daniel, R., et al. (2017). Contrasting effects of grassland management modes on species-abundance distributions of multiple groups. Agric. Ecosyst. Environ. 237, 143–153. doi: 10.1016/j.agee.2016.12.022
Spake, R., Mori, A. S., Beckmann, M., Martin, P. A., Christie, A. P., Duguid, M. C., et al. (2020). Implications of scale dependence for cross−study syntheses of biodiversity differences. Ecol. Lett. 24, 374–390. doi: 10.1111/ele.13641
Stein, A., Gerstner, K., and Kreft, H. (2014). Environmental heterogeneity as a universal driver of species richness across taxa, biomes and spatial scales. Ecol. Lett. 17, 866–880. doi: 10.1111/ele.12277
Tang, Q., Huang, Y., Ding, Y., and Zang, R. (2016). Interspecific and intraspecific variation in functional traits of subtropical evergreen and deciduous broad-leaved mixed forests. Biodivers. Sci. 24, 262–270. doi: 10.17520/biods.2015200
Tang, Z., Xu, W., Zhou, G., Bai, Y., Li, J., Tang, X., et al. (2018). Patterns of plant carbon, nitrogen, and phosphorus concentration in relation to productivity in China’s terrestrial ecosystems. Proc. Natl. Acad. Sci. U.S.A. 115, 4033–4038. doi: 10.1073/pnas.1700295114
Tilman, D. (1982). Resource Competition and Community Structure. Princeton: Princeton University Press.
Tilman, D. (1988). Plant Strategies and the Dynamics and Structure of Plant Communities. Princeton, NJ: Princeton University Press.
Tilman, D., May, R. M., Lehman, C. L., and Nowak, M. A. (1994). Habitat destruction and the extinction debt. Nature 371, 65–66. doi: 10.1038/371065a0
Ulrich, W., Kusumoto, B., Shiono, T., and Kubota, Y. (2015). Climatic and geographic correlates of global forest tree species-abundance distributions and community evenness. J. Veg. Sci. 27, 295–305. doi: 10.1111/jvs.12346
Volkov, I., Banavar, J. R., Hubbell, S. P., and Maritan, A. (2007). Patterns of relative species abundance in rainforests and coral reefs. Nature 450, 45–49. doi: 10.1038/nature06197
Wang, Q., Punchi-Manage, R., Lu, Z., Franklin, S. B., Wang, Z., Li, Y., et al. (2017). Effects of topography on structuring species assemblages in a subtropical forest. J. Plant Ecol. 10, 440–449. doi: 10.1093/jpe/rtw047
Wang, Q., Xu, Y., Lu, Z., Bao, D., Guo, Y., Lu, J., et al. (2014). Disentangling the ef- fects of topography and space on the distributions of dominant species in a sub- tropical forest. Chin. Sci. Bull. 59, 5113–5122. doi: 10.1007/s11434-014-0453-9
Yao, L., Cui, G., Yi, Y., Huang, Y., Feng, G., Liu, J., et al. (2016). Species diversity of woody plants in Mulinzi nature reserve of Hubei province. Sci. Silvae Sin. 51, 1–9.
Zhang, L., Mi, X., Harrison, R. D., Yang, B., Man, X., Ren, H., et al. (2020). Resource heterogeneity, not resource quantity, plays an important role in determining tree species diversity in two species-rich forests. Front. Ecol. Evol. 8:224. doi: 10.3389/fevo.2020.00224
Zobel, M., Otto, R., Laanisto, L., Naranjo-Cigala, A., Pärtel, M., and Fernández-Palacios, J. (2011). The formation of species pools: historical habitat abundance affects current local diversity. Global Ecol. Biogeogr. 20, 251–259. doi: 10.2307/41058240
Keywords: diversity maintenance, evergreen-deciduous broadleaved mixed forest, forest dynamics plot, species abundance distribution, species richness, soil nutrients, topographical characteristics
Citation: Feng G, Huang J, Xu Y, Li J and Zang R (2021) Disentangling Environmental Effects on the Tree Species Abundance Distribution and Richness in a Subtropical Forest. Front. Plant Sci. 12:622043. doi: 10.3389/fpls.2021.622043
Received: 27 October 2020; Accepted: 16 February 2021;
Published: 22 March 2021.
Edited by:
Jian-Guo Huang, Chinese Academy of Sciences, ChinaCopyright © 2021 Feng, Huang, Xu, Li and Zang. This is an open-access article distributed under the terms of the Creative Commons Attribution License (CC BY). The use, distribution or reproduction in other forums is permitted, provided the original author(s) and the copyright owner(s) are credited and that the original publication in this journal is cited, in accordance with accepted academic practice. No use, distribution or reproduction is permitted which does not comply with these terms.
*Correspondence: Jihong Huang, bm9ydGhhbGx1dmlvbkBjYWYuYWMuY24=