 Aleksey A. Penin1
 Artem S. Kasianov1
 Anna V. Klepikova1
 Ilya V. Kirov2
 Evgeny S. Gerasimov3Aleksey N. Fesenko4
 Maria D. Logacheva1,5*
- 1Institute for Information Transmission Problems of the Russian Academy of Sciences, Moscow, Russia
- 2All-Russia Research Institute of Agricultural Biotechnology, Moscow, Russia
- 3Biological Faculty, Lomonosov Moscow State University, Moscow, Russia
- 4Federal Scientific Center of Legumes and Groat Crops, Orel, Russia
- 5Skolkovo Institute of Science and Technology, Moscow, Russia
Common buckwheat (Fagopyrum esculentum) is an important non-cereal grain crop and a prospective component of functional food. Despite this, the genomic resources for this species and for the whole family Polygonaceae, to which it belongs, are scarce. Here, we report the assembly of the buckwheat genome using long-read technology and a high-resolution expression atlas including 46 organs and developmental stages. We found that the buckwheat genome has an extremely high content of transposable elements, including several classes of recently (0.5–1 Mya) multiplied TEs (“transposon burst”) and gradually accumulated TEs. The difference in TE content is a major factor contributing to the three-fold increase in the genome size of F. esculentum compared with its sister species F. tataricum. Moreover, we detected the differences in TE content between the wild ancestral subspecies F. esculentum ssp. ancestrale and buckwheat cultivars, suggesting that TE activity accompanied buckwheat domestication. Expression profiling allowed us to test a hypothesis about the genetic control of petaloidy of tepals in buckwheat. We showed that it is not mediated by B-class gene activity, in contrast to the prediction from the ABC model. Based on a survey of expression profiles and phylogenetic analysis, we identified the MYB family transcription factor gene tr_18111 as a potential candidate for the determination of conical cells in buckwheat petaloid tepals. The information on expression patterns has been integrated into the publicly available database TraVA: http://travadb.org/browse/Species=Fesc/. The improved genome assembly and transcriptomic resources will enable research on buckwheat, including practical applications.
Introduction
Common buckwheat (Fagopyrum esculentum) is an important non-cereal grain crop of particular importance in Russia, China and Ukraine, with production of ∼ 2 million tons. With the growing interest in healthy lifestyles, buckwheat has received a great deal of attention worldwide as a component of functional food in recent years [(for review, see Alvarez-Jubete et al., 2010; Giménez-Bastida and Zieliński, 2015)]. Buckwheat is highly resistant to soil contamination by aluminium and lead and is a promising phytoremediator (Ma et al., 1997; Honda et al., 2007). Its productivity as an agricultural plant is, however, limited by several unfavorable traits: obligate insect outcrossing pollination, an extended period of flowering and susceptibility to drought and freezing. Novel methods of breeding that involve marker-assisted and genomic selection have the potential to overcome these limitations. For this purpose, genomic information is highly desired. A draft assembly of the buckwheat genome was reported in 2016 (Yasui et al., 2016); however, it is based only on Illumina technology and shows moderate continuity (contig N50 1 Kb, scaffold N50 = 25 Kb). This assembly is likely to encompass most coding regions and is suitable for the analysis of single genes (though with some limitations, see, e.g., Lei et al., 2017). Many researchers opt not to use this assembly as a reference for transcriptomic studies on buckwheat and instead generate their own de novo transcriptome assemblies (Xu et al., 2017; Fang et al., 2019a, b). This situation decreases the accuracy of gene expression estimates and hampers the comparison and meta-analysis of the results. Thus, the generation of a more contiguous assembly for the buckwheat genome complemented with transcriptomic information is urgently needed (Joshi et al., 2019).
Sequencing technologies have been responsible for tremendous progress; one of the key innovations of these technologies in recent years was the development of NGS platforms capable of generating long reads. This is of special importance for plant scientists because plant genomes are large and complex and are shaped by multiple segmental and whole-genome duplications and transposable element (TE) activity. Thus, they cannot be reliably assembled using second-generation NGS technologies, which generate reads with a maximum length of 100–300 bp. The utility of long-read technology for the assembly of complex genomes has been demonstrated in several plant species (Schmidt et al., 2017; Murigneux et al., 2020). Long-read technologies have encouraged scientists to conduct studies that were impossible even with the gold-standard quality genome of Arabidopsis thaliana due to the complex rearrangements caused by transposition. On this basis, we performed the sequencing, de novo assembly and annotation of the buckwheat genome using third-generation technologies – SMRT and nanopore sequencing – and generated a transcriptome map of F. esculentum from 46 organs and developmental stages. We demonstrate the utility of detailed transcriptome profiling for testing and generating hypotheses about the involvement of genes in specific processes, particularly the genetic basis of floral organ identity. We show that gene expression patterns are a valuable addition to sequence-based information.
We expect that this newly generated genome and transcriptome resource will be useful for the development of buckwheat genetics and breeding. Buckwheat belongs to an isolated group of flowering plants, the non-core Caryophyllales, which are distantly related to model species (Yao et al., 2019). While their sister clade, the core Caryophyllales, contains several plants with well-characterized genomes [sugarbeet (Dohm et al., 2014) and quinoa (Jarvis et al., 2017)], genomic and transcriptomic resources for the non-core Caryophyllales are scarce. Thus, the development of a high-resolution transcriptome map will provide a resource for comparative transcriptomic analyses in the phylogenetic context.
Results and Discussion
Assembly and Annotation
The Dasha cultivar was selected for reference genome assembly. Dasha is a recently developed fast-growing determinate cultivar characterized by resistance to lodging and a high photosynthesis efficiency (Fesenko et al., 2018). The assembly process consisted of three stages: contig assembly, scaffolding and gap closing. For contig assembly, a Newbler assembler was used. This assembler, initially developed for 454 data, also performs well for other types of sequencing data, including merged Illumina paired 250-bp or 300-bp reads. The 250-bp Illumina reads and mate-pair reads provided a backbone for the assembly; further improvement of the assembly, including gap closing, was performed using long reads generated by SMRT CCS technology on the Pacific Bioscience platform (Supplementary Table 1). The final assembly consisted of 88 078 scaffolds with a total length of 1.2 Gb and N50 ∼ 180 Kb (Supplementary Table 2). The N50 of this assembly represents a 39x improvement compared with that of the previous assembly (Yasui et al., 2016) at the level of contigs. A search of the conserved gene set (BUSCOs) also showed high continuity of the assembly: the percentage of complete genes was 98.6%, and those of fragmented and missing genes were both 0.7%. For comparison, these metrics for the previous assembly were 84.2%, 11.5%, and 4.3% (Supplementary Table 3). The annotation yielded 29 514 genes; the annotation metrics are summarized in Supplementary Table 4. The majority of the genes (97.5%) were supported by RNA-seq (Supplementary Table 4 and text below). The parameters of the coding fraction of the genes (CDS length, exon length) of buckwheat were similar to those of other plants, while the introns of buckwheat were longer, which is in accord with its larger genome size (Figure 1A). The number of genes was close to that found in sugar beet (Dohm et al., 2014), which belongs to Caryophyllales along with buckwheat, and in A. thaliana and was generally within the range typical for the genomes of plants that have not undergone a recent whole-genome duplication. A total of 24,765 buckwheat genes were classified into 13,289 orthogroups. Notably, the buckwheat genome contains a smaller number of orthogroups that include one gene and a larger number of orthogroups that include two or more genes compared to A. thaliana, tomato and sugarbeet (Figure 1B). This pattern is not, however, compatible with that observed in tetraploids (see e.g., Leushkin et al., 2013); taking into account the unusually high content and activity of TEs in the buckwheat genome (see below), we suggest that it is a result of segmental duplications caused by TEs. The distribution of gene ontology categories was similar between buckwheat and Arabidopsis (except for the “secondary metabolic process” category, which includes more genes in Arabidopsis, presumably due to its ability to synthesize glucosinolates) (Figure 1C). Additionally, a search for GO enrichment in the genes belonging to the 1-to-many orthogroups (one gene in Arabidopsis and two or more in buckwheat) did not reveal any enrichment (FDR < 0.01). This shows that duplications are not confined to specific gene groups. A total of 1,425 buckwheat genes were classified as transcription factors (TFs, Supplementary Table 5); the total number and distribution of TF classes were similar to those of other caryophyllids (1,058 in Beta vulgaris, 1,259 in Amaranthus hypochondriacus), and A. thaliana (1,717). The extranuclear genomes – plastid and mitochondrial – were assembled using different procedures and are reported elsewhere (Logacheva et al., 2020).
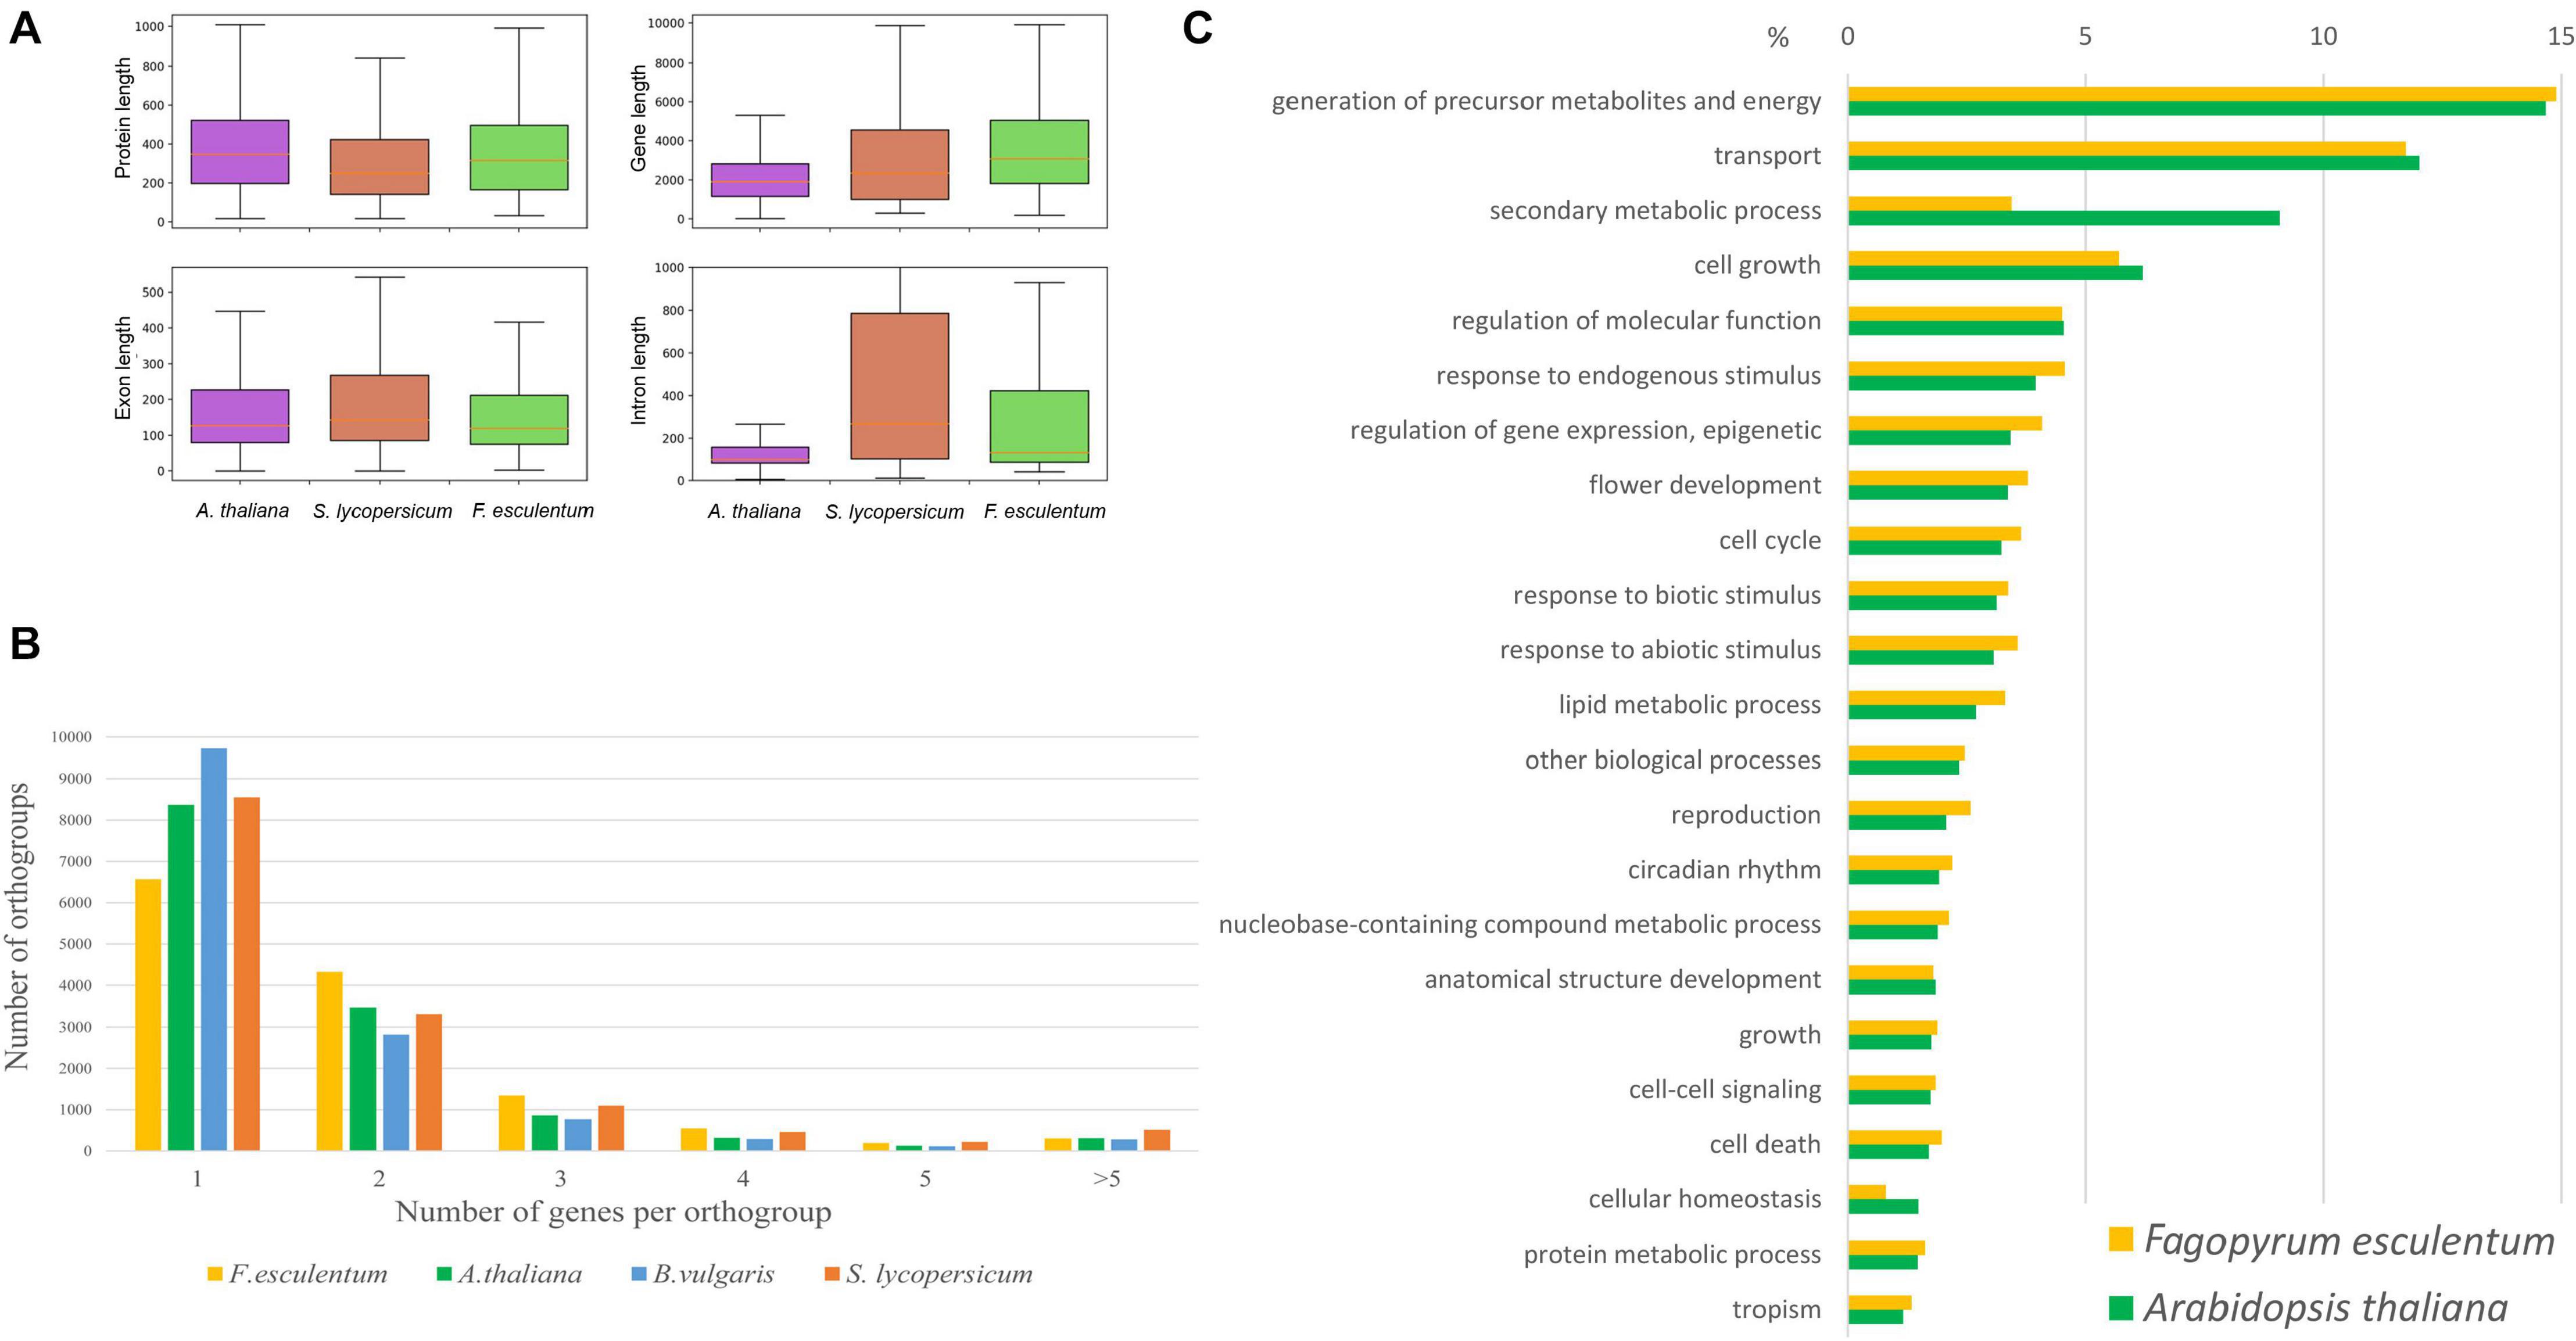
Figure 1. (À) Annotation of F. esculentum compared with those of A. thaliana and S. lycopersicum in terms of the gene, exon, and intron length distribution. (B) The number of genes per orthogroup in Fagopyrum esculentum, Beta vulgaris, Solanum lycopersicum, and Arabidopsis thaliana. (C) The distribution of GO categories (biological function) in Fagopyrum esculentum and Arabidopsis thaliana.
Transposable Elements and the Evolution of Genome Size in the Genus Fagopyrum
The genus Fagopyrum includes approximately 25 species, which fall into two clades: cymosum (large achene) and urophyllum (small achene) [reviewed in Ohsako and Li (2020)]. The genome sizes of the two clades vary significantly despite showing the same chromosome number (eight) in most species (Nagano et al., 2000); the basis of this variation is unknown. F. esculentum is a member of the large-seeded clade; its genome is ∼3 times larger (1.39 pg/1C) than that of the closely related species F. tataricum (0.56 pg/1C), while the chromosome number is the same in these species (Neethirajan et al., 2011). Polyploidy and TEs are the main drivers of plant genome size variability across species (Bennett and Leitch, 2005; Vitte and Panaud, 2005). Because both species are diploids and they show the same chromosome number (2n = 2x = 16), we hypothesized that TE activity may be responsible for the increase in F. esculentum genome size. To obtain preliminary insight into the genome-wide differences in the repeatome composition between the two species, we performed the comparative clustering of genomic NGS reads followed by cluster annotation using RepeatExplorer software (Novak et al., 2013; Novák et al., 2017). The RepeatExplorer characterization of repeatome is based on raw NGS reads and independent on genome assembly quality that may slightly differ for the two species. This analysis revealed a similar genome abundance of satellite (3.45% and 4%) and class II (DNA transposons, 1.97% and 1.98%) repeats, while the portion of the genome occupied by retrotransposons (RTEs, class I repeats) was ∼2 times greater in F. esculentum (64.8%) than in F. tataricum (30.7%) (Figure 2A). Then, we took advantage of the current F. esculentum genome sequence assembly to obtain deeper insight into LTR RTE diversity and compared these data with those of F. tataricum1 (Zhang et al., 2017). The classification of RTEs indicated that ∼70% of all RTEs in both species belonged to the Ty3/Gypsy superfamily. The family-based classification of all RTEs revealed striking differences in the copy numbers of distinct Ty3/Gypsy and Ty1/Copia families between the two species (Figures 2B,C). Analysis of RTE families within a genome revealed that Athila Ty3/Gypsy was the most prevalent RTE family (42% of all RTEs) in the F. esculentum genome while Tekay Ty3/gypsy was the major family (59% of all RTEs) in F. tataricum genome (Figure 2B). Comparison of RTE copies between the genomes showed that F. esculentum genome has ∼25 times more elements (6117 RTEs) of Athila Ty3/Gypsy family than in F. tataricum (241 RTEs). In addition, Ale, SIRE, TAR, and Ikeros families of Ty1/Copia also showed significant discrepancies in the number of RTEs between the genomes of two species. These suggest that the RTEs of several families have accumulated at a higher rate in F. esculentum than in F. tataricum. We then asked whether the insertion time of RTE activity differed between these species. The obtained estimates clearly showed significant differences (Fisher’s exact test for count data, p-value < 2.2e-16) between the species, with 26.6% (3 834 complete RTEs) of the RTEs of the F. esculentum genome having been inserted during the last 0.5 million years (“recent” insertions), while only 9.6% of F. tataricum RTE insertions were classified as “recent” insertions. Surprisingly, the comparison of insertion times for different RTE families revealed that Athila accumulation was characterized by gradual dynamics in both species, without a burst of recent activity in F. esculentum (Figure 2E). A similar situation was observed for the CRM and TAR families. In contrast, the Ale, Ikeros, and Tork families in F. esculentum genome and the SIRE family in F. tataricum genome showed signatures of bursts of recent activity. Thus, the greater F. esculentum genome size compared with that of F. tataricum is influenced by the generally higher rate of transposition activity and gradual accumulation of Athila members, together with the burst of recent activity of Ale, Ikeros and Tork family members. In turn, the continuous accumulation of RTEs can be balanced or reduced by higher RTE elimination rate via homologous recombination or small deletions (Shirasu et al., 2000; Ma et al., 2004). This may result in much slower rate of genome expansion by RTEs and, as a consequence, smaller genome size of F.tataricum. Along with the comparison of F. tataricum and F. esculentum, which allowed us to reveal the basis of the rapid genome size change, we surveyed the TE content within F. esculentum. We analyzed WGS data for 10 cultivars and the ancestral subspecies F. esculentum ssp. ancestrale and found that the abundance of TEs differed between the cultivars and F. esculentum ssp. ancestrale and between the cultivars (Supplementary Figure 1). These differences were correlated with the breeding history of the cultivars; for example, the Kazanka (Kaz) and Dialog (Dia) cultivars, which were clustered together in the TE abundance tree (Supplementary Figure 2), are indeed closely related, with Kazanka being one of the progenitors of Dialog (Fesenko, 2009).
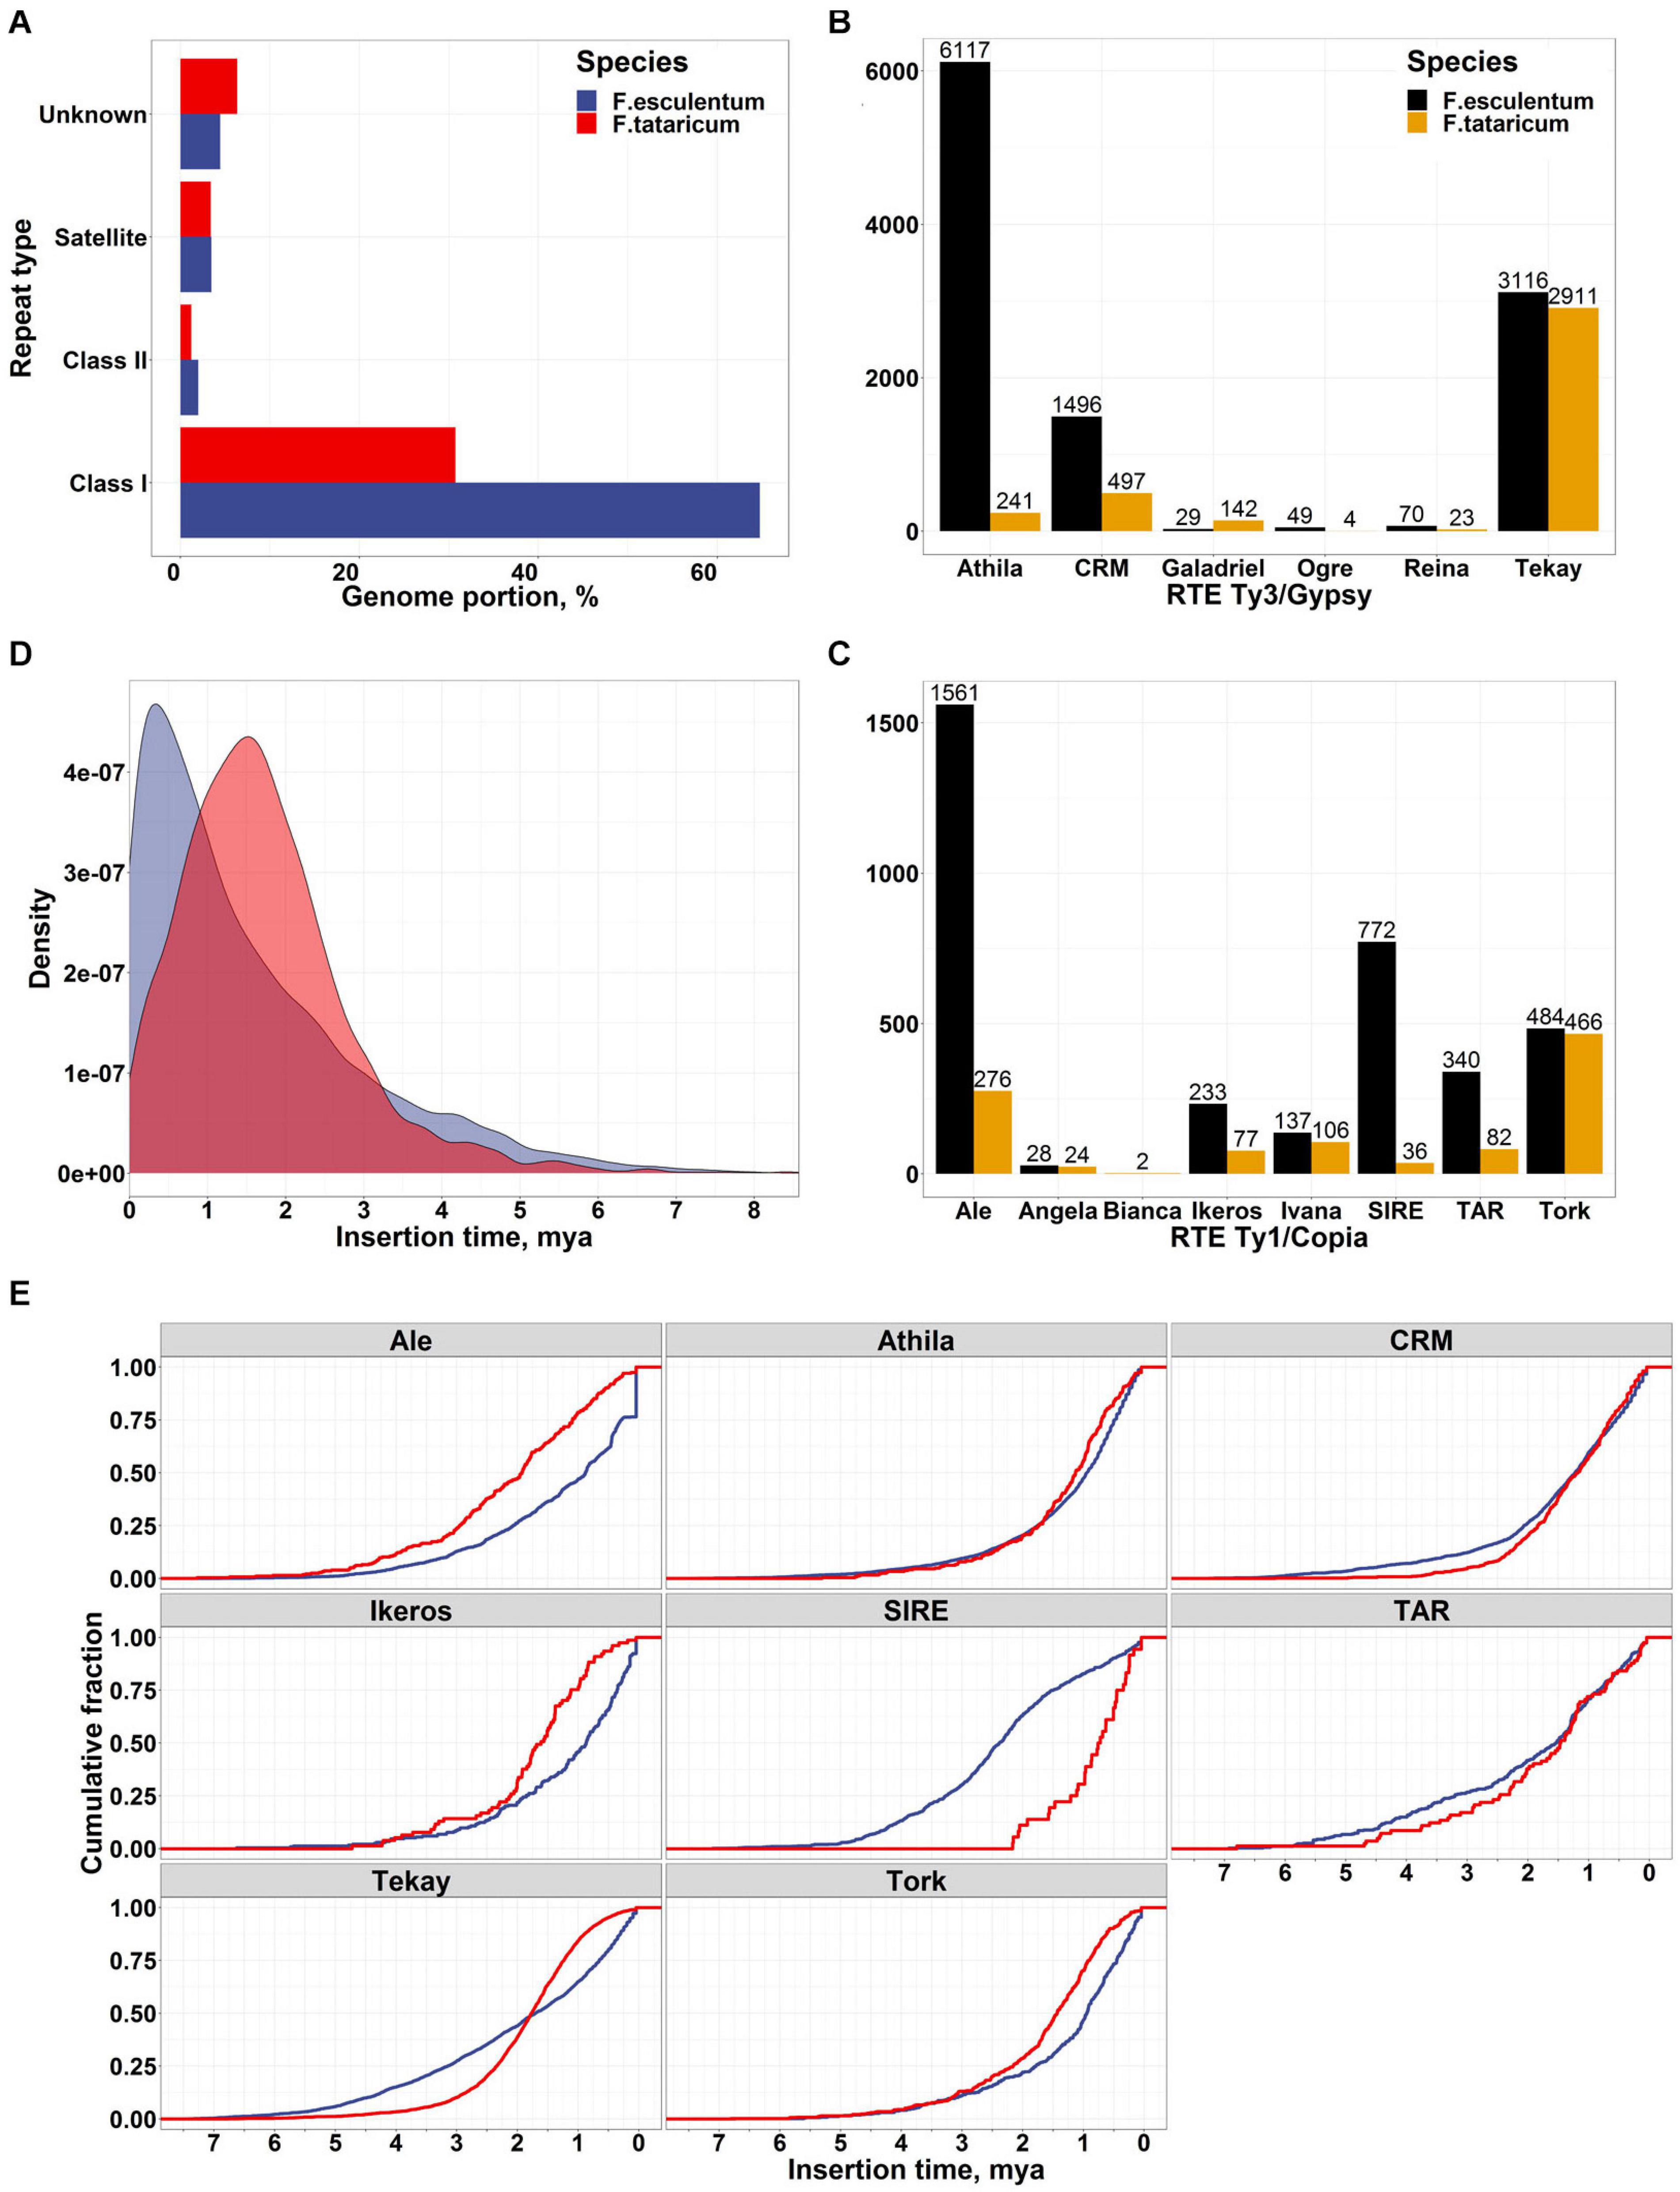
Figure 2. (A) Comparison of genome abundance of different types of repeats in the F. esculentum and F. tataricum genomes based on the RepeatExplorer (Novak et al., 2013) clustering of NGS genomic reads. (B,C) Number of full-length Ty3/Gypsy and Ty1/Copia LTR RTEs of different families based on prediction in the assembled genome sequences. (D) Insertion time comparison for F. esculentum (blue) and F. tataricum (red) LTR RTEs. (E) Cumulative plot of the insertion time for RTE families.
Buckwheat Transcriptome Atlas and FescTraVA Database
Gene expression information is integral for many areas of plant biology; in particular, it helps to reveal the role of genes in growth, development and stress response (see e.g., Shumayla et al., 2017), to find the loci associated with agriculturally important traits (Galpaz et al., 2018), to infer phylogenetic relationships between species (Guo et al., 2020). With this premise we constructed transcriptome map of buckwheat based on newly generated genome sequence and annotation. We selected 46 samples from different organs and developmental stages of buckwheat, ranging from seeds and seedlings to senescent organs (Supplementary Table 6). Since buckwheat exhibits two forms of flowers – pin (long style and short stamens) and thrum (short style and long stamens) – most samples of flowers and floral parts were collected separately for the two forms. The transcriptome is highly dynamic, especially in plants, in which it depends greatly on environmental conditions and the circadian cycle. Taking this into account, the growing and collection of samples for the transcriptome map was performed under the same conditions and at the same time of the day. For each sample, >20 million reads were obtained, and the average number of uniquely mapped reads per sample was 12 million. The correlation coefficient of the samples lies in the range 0.85–1.00 with an average of 0.96 (Supplementary Table 7). The clustering of the samples reflects their biological similarity (Figure 3A). The number of genes expressed in each sample was similar, and the greatest numbers were observed in seeds and flowers (Figure 3B). The number of genes expressed in at least one sample was 28,770 (97% of annotated genes), while 12,172 genes were expressed in all samples, and 744 genes were not expressed in any (Figure 3C). The estimation of gene expression breadth using Shannon entropy showed that most genes exhibited broad expression patterns (Supplementary Figure 2). The second small peak of expression is formed by tissue-specific genes with low entropy values. The similar distribution was observed on Arabidopsis thaliana (Klepikova et al., 2016). The genes in the fraction with the broadest expression patterns were enriched in the GO categories “photoperiodism, flowering” and “protein transporter activity,” while those in the fraction with the narrowest expression patterns were enriched in “serine-type endopeptidase inhibitor activity,” “negative regulation of endopeptidase activity,” and “endomembrane system” (Supplementary Table 8). The majority of identified genes were specific to anthers of young flower and their expression was also visible in whole young flowers at the same stage. The second gene group was associated with anthers of mature flower. We also identified genes specifically expressed in the root apex, young inflorescence, young, and mature seeds (Supplementary Figure 3).
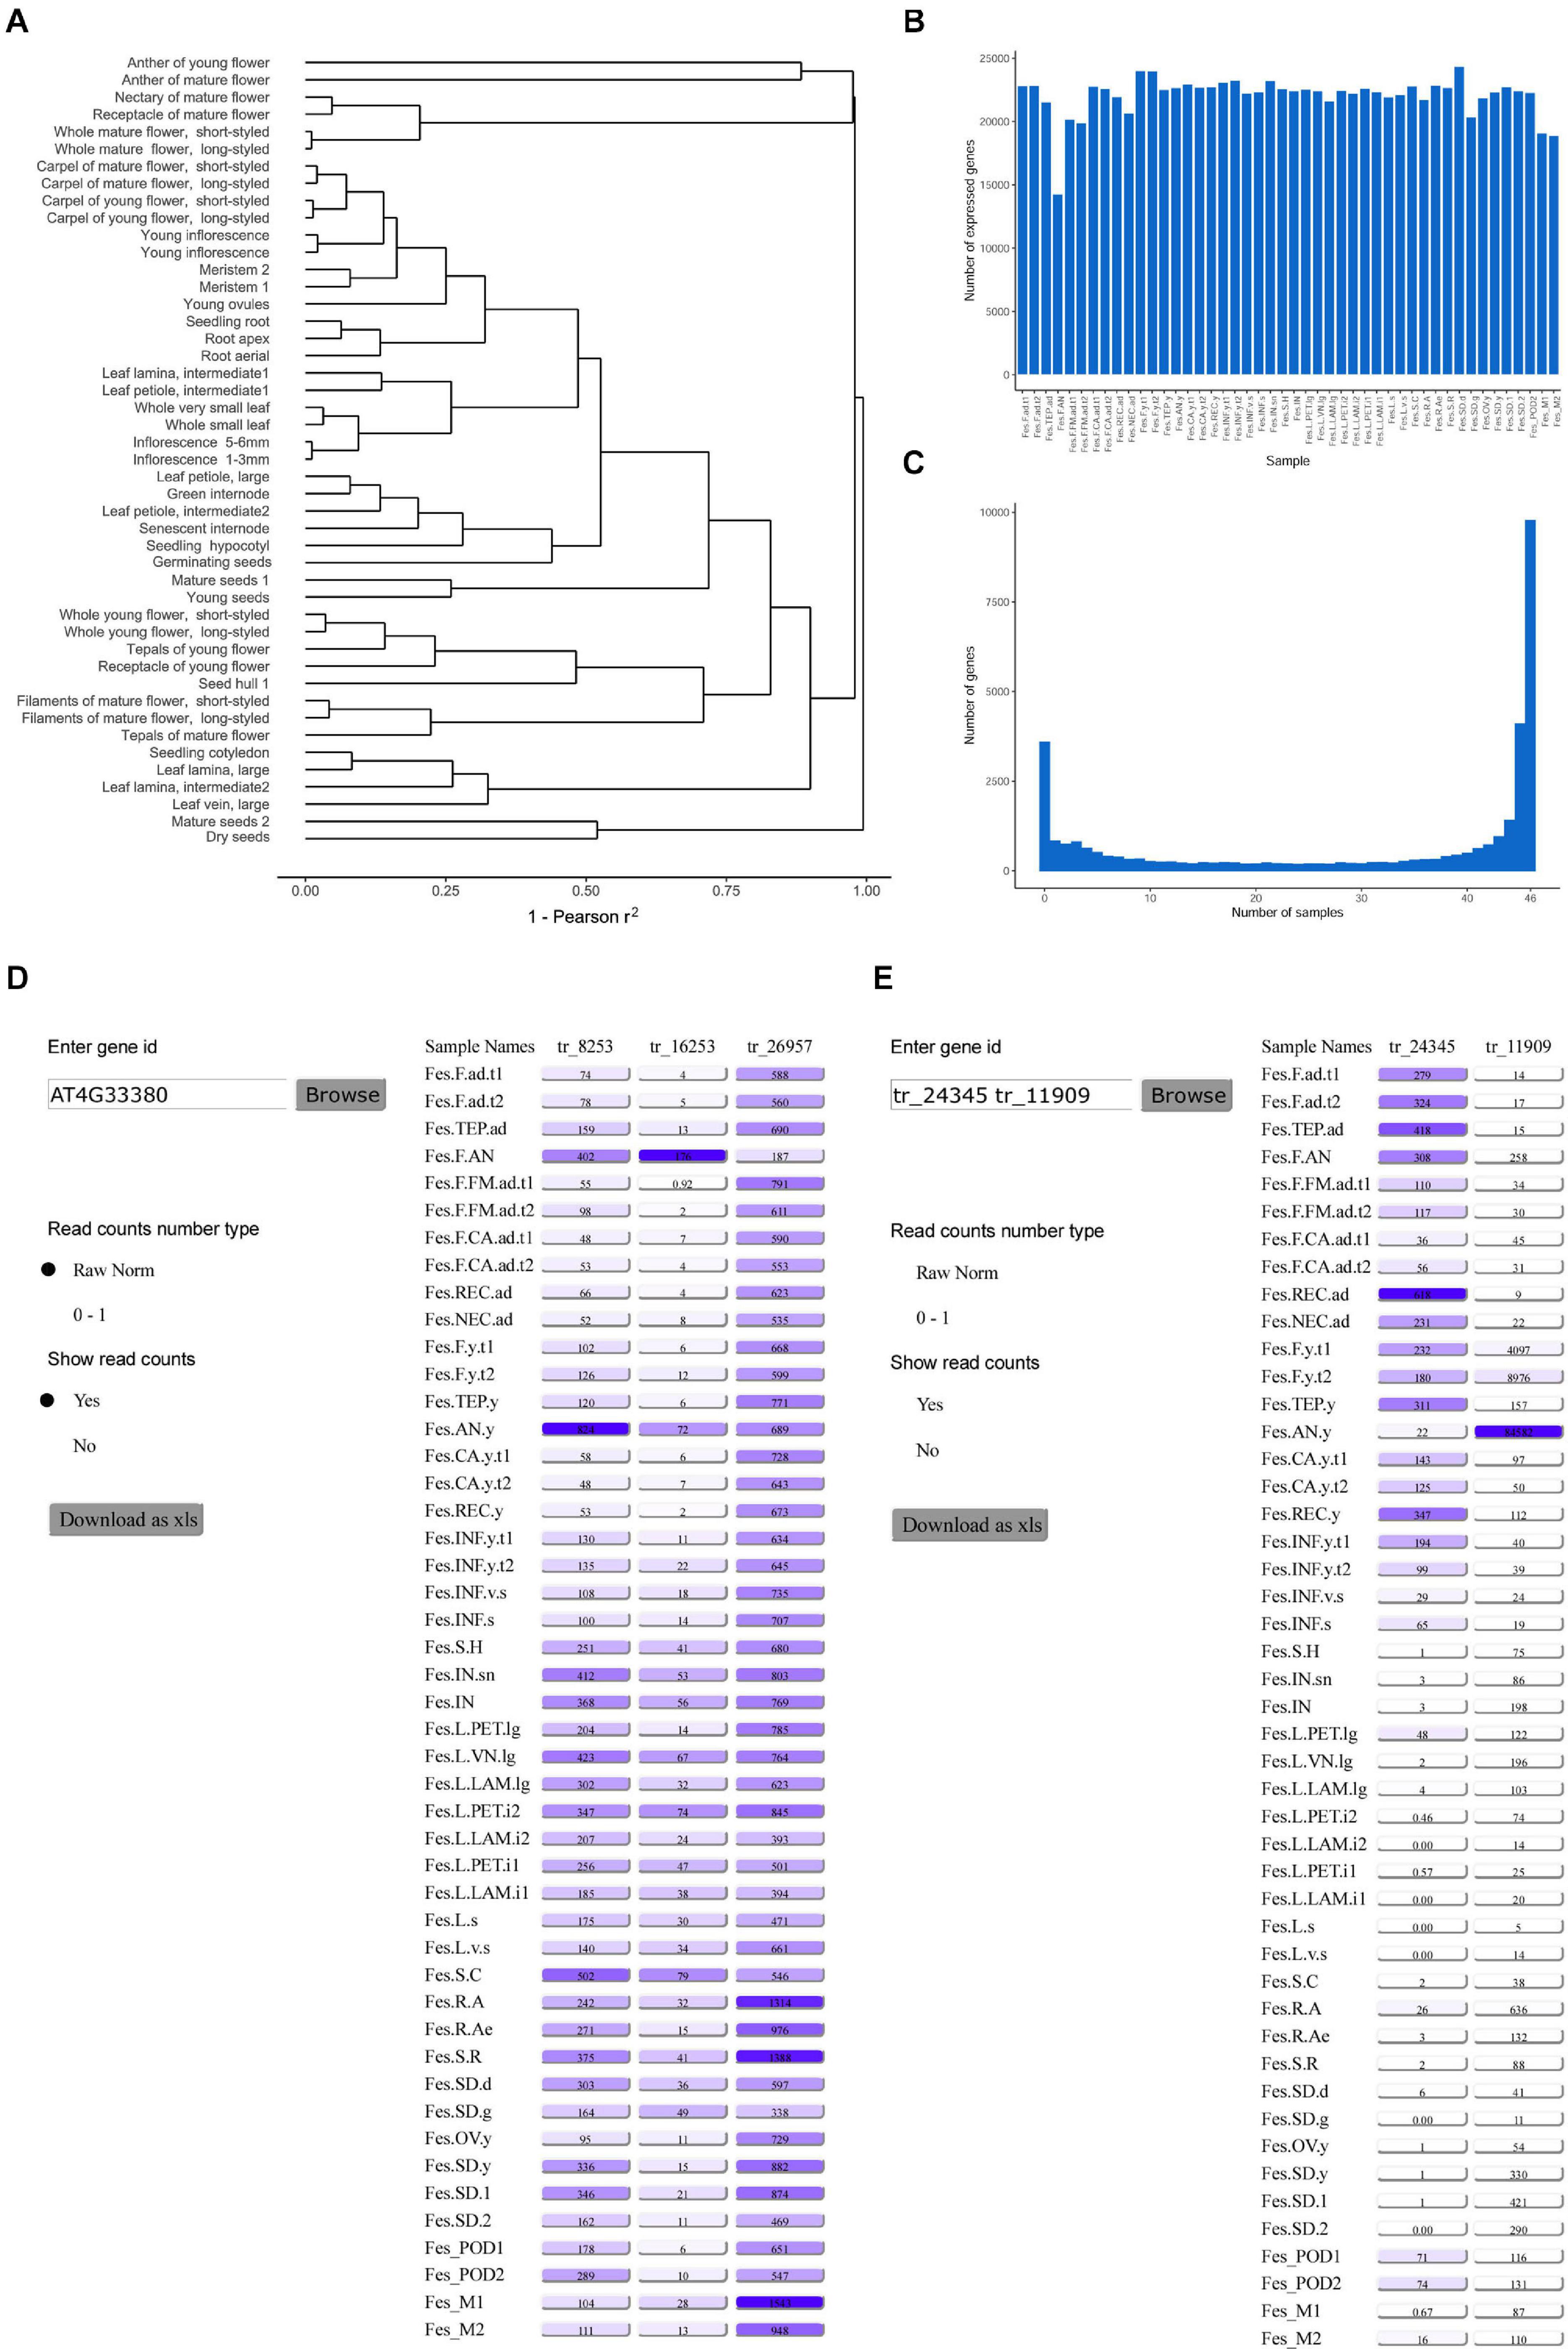
Figure 3. (A) Clustering of the samples (the distance measure is 1 – square of Pearson correlation coefficient, the expression values for replicates are averaged). (B) The number of genes expressed in each sample. (C) The specificity of gene expression. (D) The interface of the FescTraVA database, showing an example of a search with an Arabidopsis TAIR gene ID. (E) An example of a search with a buckwheat gene ID. Numbers in boxes denote normalized read counts.
RNA-seq data, especially high-resolution transcriptome maps, are an important resource for the identification of stably expressed genes, which are useful as reference genes for qRT-PCR (Zhou et al., 2017; Machado et al., 2020). We used the standard deviation of gene expression divided by mean expression (standard deviation; SD)/mean) as a measure of expression stability, and we identified 20 transcripts with SD/mean ratios < 0.2, 205 with ratios < 0.25, and 720 with ratios < 0.3. In a previous study, several gene orthologs of stably expressed Arabidopsis genes (Czechowski et al., 2005) were evaluated in five organs of buckwheat using qRT-PCR (Demidenko et al., 2011). Ten transcripts corresponded to these genes, and only one of them – tr_15881 (an ortholog of AT4G34270) – was stably expressed. The organs where expression showed the greatest differences were the anthers and roots (Supplementary Figure 4), which were not sampled in the abovementioned study. This stresses the importance of balanced and high-resolution transcriptome maps for the assessment of gene stability.
To make the information on gene expression levels readily available to the research community, we summarized the results in the TraVA database2. This database uses the same intuitive user-friendly interface as the transcriptome atlas of A. thaliana published earlier (Klepikova et al., 2016). For convenience, the database can be searched according to either the identifier of the buckwheat transcript or the identifier (common name or AT∗G∗ TAIR identifier) of the homologous A. thaliana gene. When the A. thaliana gene is a member of an orthogroup including several buckwheat genes, the expression profiles for all of these genes are shown (Figures 3D,E). The data can be downloaded in PNG and XLS formats.
The Potential of Comparative Transcriptomics for the Inference of Gene Function
High-resolution gene expression maps are a useful tool for the generation and testing of hypotheses about gene function in non-model organisms. A commonly used approach is the identification of an ortholog of a gene of interest in a model organism, where the functions of the orthologs are assumed to be similar (the so-called ortholog conjecture) (Altenhoff et al., 2012; Gabaldón and Koonin, 2013). Thus, the efforts of comparative genomics are focused on the identification of orthologs (Tulpan and Leger, 2017). However, this approach has several limitations. The aspect that is the most critical for plant science is the complexity of plant gene families, which are shaped by multiple whole-genome and segmental duplications. This leads to the impossibility of inferring 1-to-1 orthologs and makes it necessary to work with orthogroups – the sets of genes descended from a single gene of their common ancestor. The diversification of gene function within an orthogroup is a common way in which new structures and pathways emerge in plants (e.g., Ober, 2005; Yamaguchi et al., 2006). However, based on sequence similarity, it is usually impossible to identify genes that share the same function in two species because subtle differences at the coding sequence level can contribute greatly to changes in function (a single amino acid change can turn a repressor to an activator) (Hanzawa et al., 2005).
The transcriptome atlas enables the comparison of the expression profiles of the genes within an orthogroup, thus allowing the prioritization of the hypotheses regarding their functional correspondence. In a previous study, we constructed transcriptome atlases for Arabidopsis (Klepikova et al., 2016) and tomato (Penin et al., 2019) using the same approaches and a similar set of samples; these species represent two major groups of eudicots (rosids and asterids) and provide a basis for the comparative analysis of gene expression profiles. As an illustration of the novel information that the atlas can provide, we will focus on at the orthogroup including the APETALA1 gene. This gene encodes a MADS-box transcription factor that is responsible for sepal and (together with APETALA3 and PISTILLATA) petal identity and is thus the A-class gene (Irish and Sussex, 1990); it also plays a role in the inflorescence development (Mandel et al., 1992). The buckwheat genome carries three orthologs of the AP1 gene. They share high similarity (74–77% at the nucleotide sequence level) and likely arose via whole-genome or segmental duplication after the diversification of core and non-core Caryophyllales (Figure 4A). The comparison of their expression profiles showed that the expression of all of these genes was confined to the flower; however, the patterns and levels of expression were different (Figure 4A). tr_22431 showed the highest expression level in tepals (the structures surrounding the reproductive organs of the flower in buckwheat, which are similar to petals and sepals; see discussion below), while two others showed the highest expression in the anthers and the receptacle of the developing flower. In Arabidopsis, AP1 is known to regulate sepal and petal development (Irish and Sussex, 1990, p. 1). Based on the expression profiles, the most plausible candidate for this function was tr_22431. This gene has a maximal expression level in developing tepals. Two other candidates, tr_8095 and tr_4713, are expressed at the maximal level in other floral organs (receptacle and anthers, correspondingly). Their expression levels in tepals are two orders of magnitude lower that that of tr_22431 suggesting that the determination of petaloidy is not their primary function. Indeed, a study by Liu et al. (2019), who performed a complementation assay with an Arabidopsis ap1 mutant and a buckwheat AP1 ortholog (corresponding to tr_8095 from our annotation, 100% identity) under 35S promoter, showed a limited conservation of function between Arabidopsis AP1 and this buckwheat gene. This shows the congruence of functional studies and expression profiles and calls for the widespread application of the buckwheat transcriptome atlas for functional genomics.
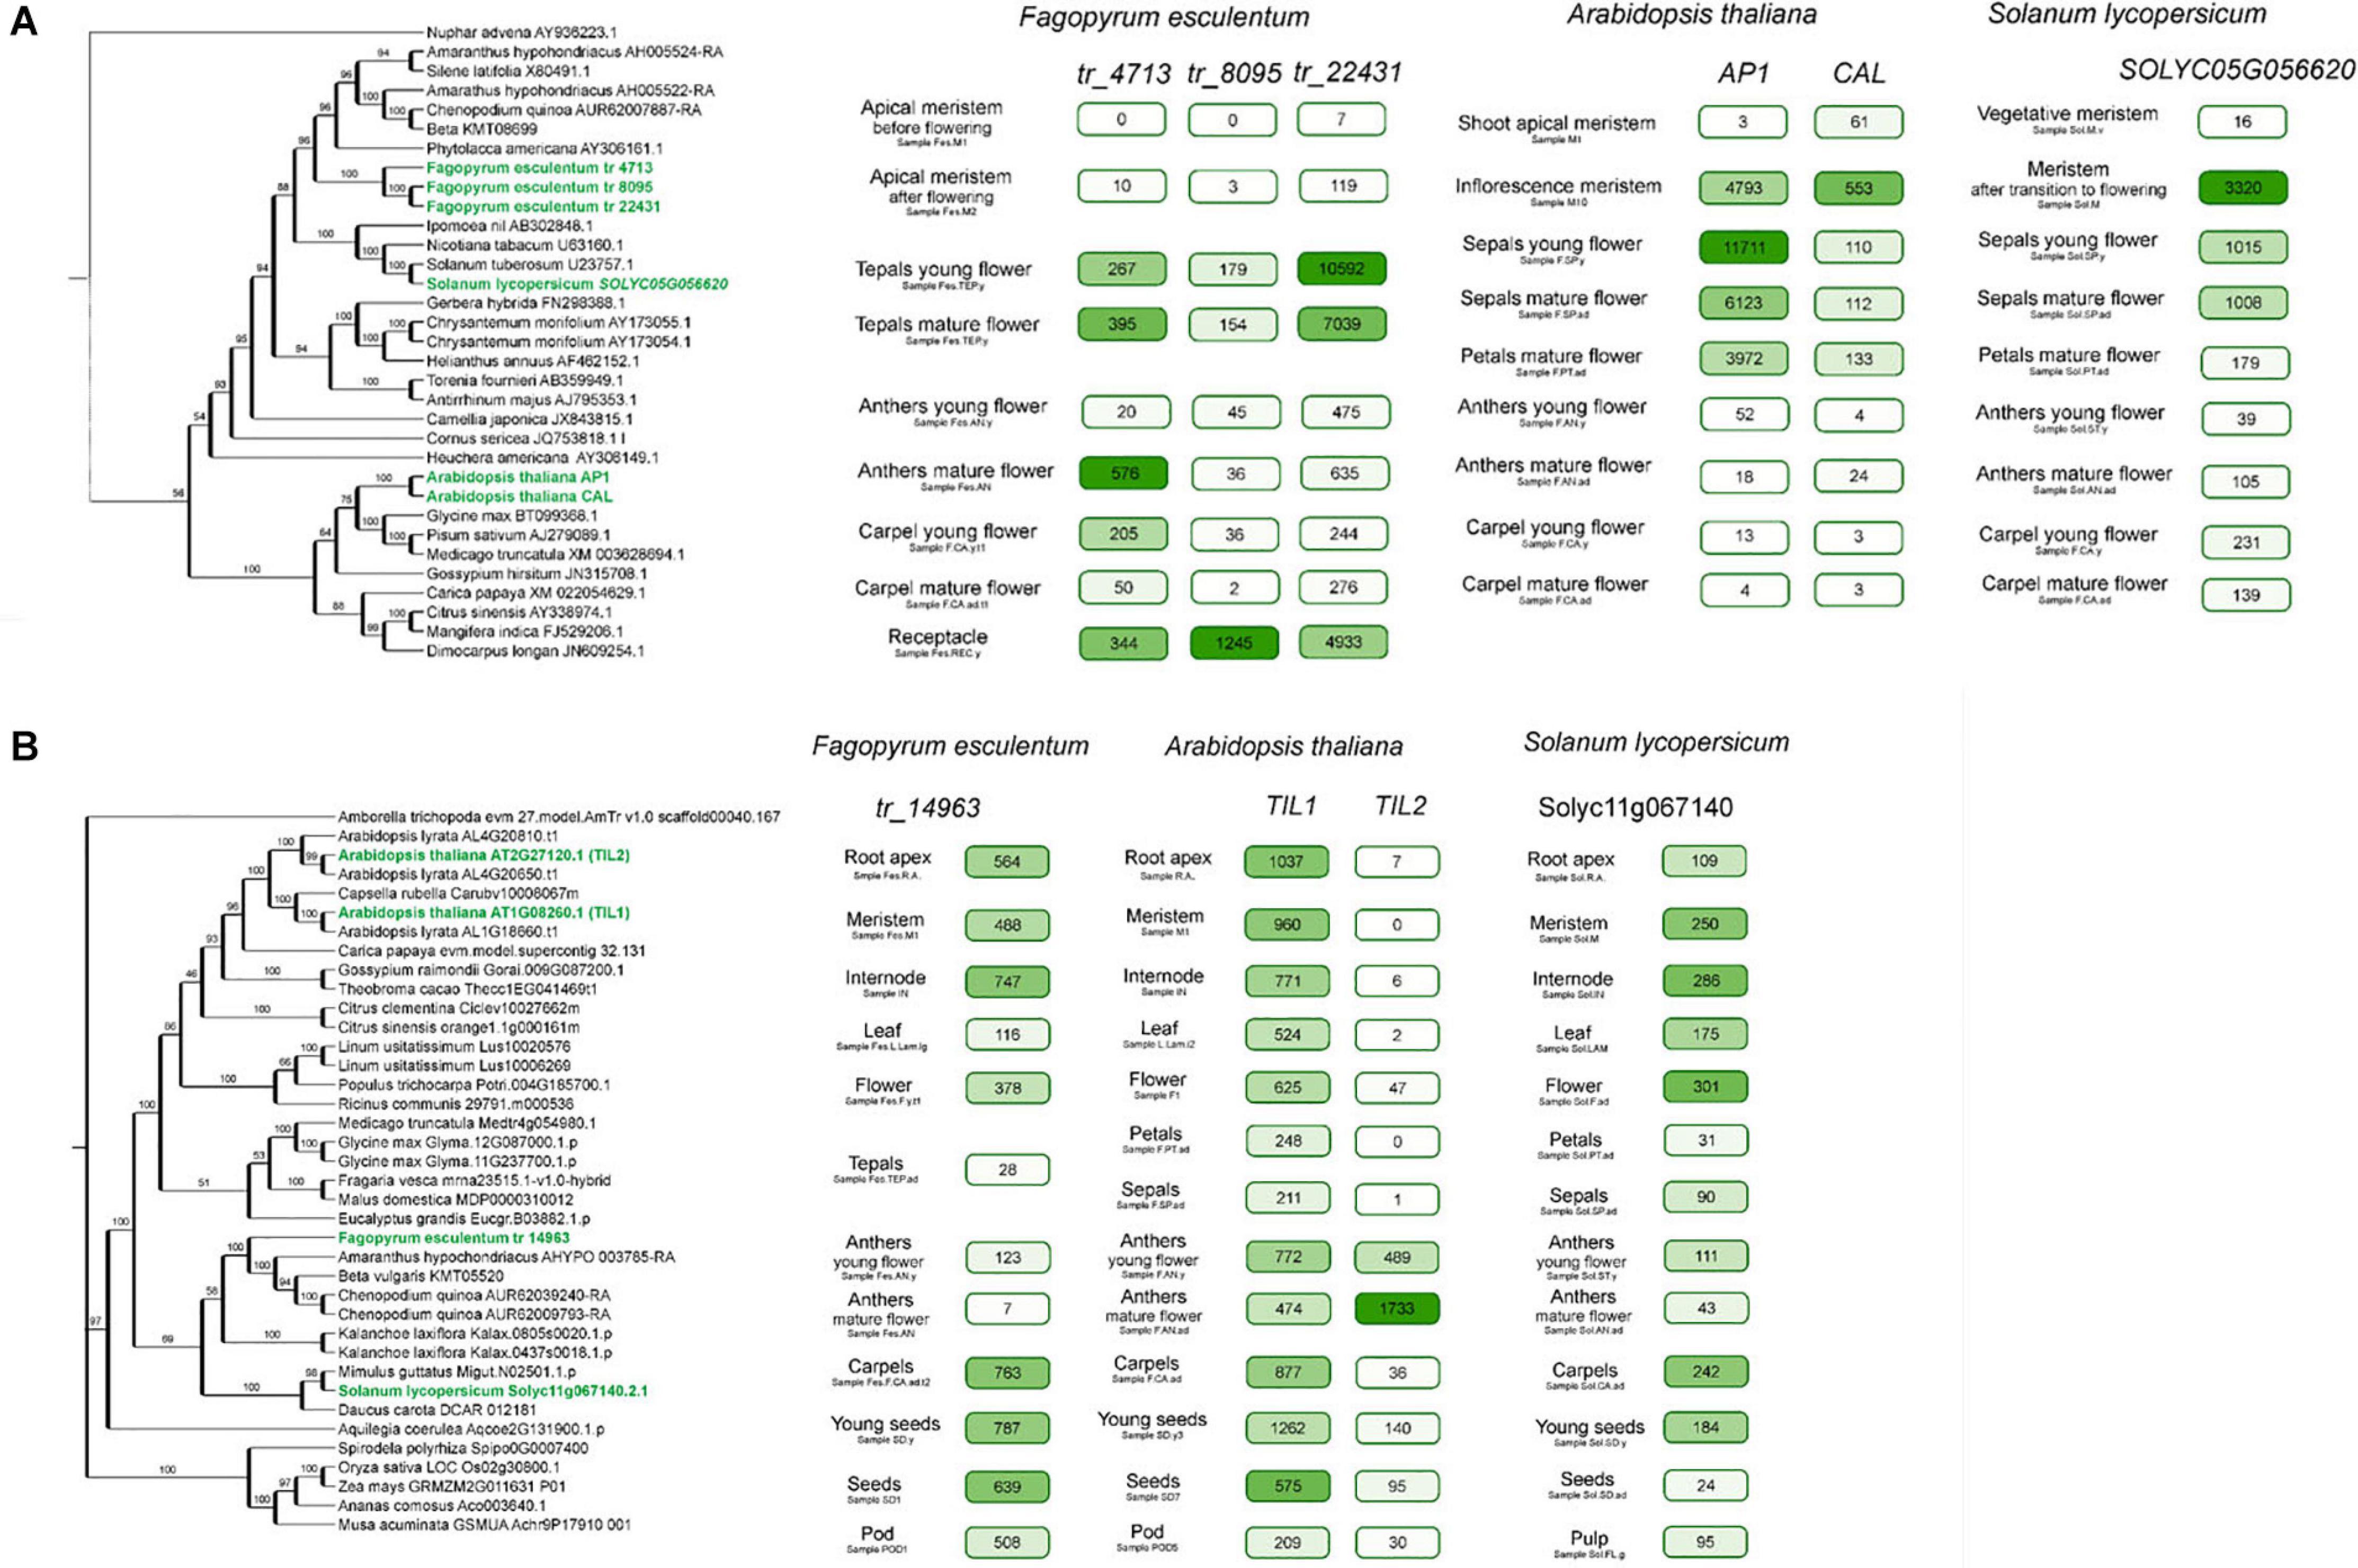
Figure 4. (A) Phylogeny and expression patterns of the AP1 orthogroup genes in Arabidopsis, buckwheat, and tomato. Numbers in boxes denote normalized read counts. Color saturation is proportional to the expression level (each gene has its own scale). Selected samples are represented; complete profiles are available at http://travadb.org/. (B) Phylogeny and expression patterns of the TIL1-2 orthogroup in Arabidopsis, buckwheat and tomato. Numbers in boxes denote normalized read counts. Color saturation is proportional to the expression level (each gene has its own scale). Selected samples are represented; complete profiles are available at http://travadb.org/.
Another example is provided by the buckwheat tr_14963 gene, which encodes an ∼2000 aa protein with high similarity to the DNA polymerase epsilon subunit. It exists in a single copy in most plants, excluding those that recently underwent a whole-genome duplication (Figure 4B). However, in A. thaliana, there are two genes, TILTED1 (TIL1, AT2G27120) and TILTED2 (TIL2, AT2G27120), corresponding to this single gene. They show very close similarity values (56%) to the buckwheat ortholog, making it impossible to determine which of the TIL genes corresponds functionally to the buckwheat tr_14963 gene. In contrast, the expression profiles show clear differentiation. TIL1 presents a more similar pattern to the buckwheat gene, where the maximal expression level is associated with growing tissues – as well as tr_14963, which also has a broad expression pattern with maximal level in the developing inflorescence.In contrast, TIL2 exhibits a narrow pattern and is expressed almost exclusively in the anthers (Figure 4B). This suggests that TIL1 and tr_14963 share the same function, ancestral for this gene while TIL2 underwent sub- or neofunctionalization.
The Transcriptome Atlas Provides a Clue Regarding the Origins of Petaloidy in Buckwheat
An important characteristic of flowering plants is the perianth – the organs that surround the reproductive structures of the flower and function in protection and/or the attraction of pollinators. The perianth can be either double, being differentiated into a calyx (sepals, usually small and green, protect the developing floral organs) and corolla (petals, large and showy, attract pollinators) or undifferentiated, in which a single type of organ resembles either petals or sepals. A double perianth is typical for eudicots (including the model species A. thaliana), while an undifferentiated perianth is usually found in monocots. The well-known ABC model of floral organ identity suggests that this structure is controlled by the combinatorial action of three classes of TFs – A, B, and C. According to this model, sepal identity is mediated by the A class genes, carpel identity by C class, petal identity by classes A and B and stamen identity by classes B and C (Coen and Meyerowitz, 1991). The undifferentiated petaloid perianth has been hypothesized to be attributable to the expansion of the B class (van Tunen et al., 1993); this hypothesis has been experimentally corroborated in several monocot species (Kanno et al., 2003; Nakamura et al., 2005). In Caryophyllales, perianth structure is highly diverse; this group includes species with both double and undifferentiated perianths; the latter type is presumably an ancestral character for the whole order (Brockington et al., 2009). Buckwheat and other species from the family Polygonaceae exhibit an undifferentiated perianth. In F. esculentum, the perianth is petal-like, white or pink, while in several other buckwheat species, it is green, sepal-like. A plausible hypothesis is that in F. esculentum, class A and B genes are active in the perianth, while in species with a sepal-like perianth, only class A genes are active. The availability of the genome sequence in combination with a detailed transcriptome map allows this hypothesis to be tested. The search for orthologs of B-class genes showed that the buckwheat genome carries four orthologs of AP3 and one ortholog of PI (Figure 5). We searched for their expression in different floral organs, and we found that B is not expressed or is expressed at background levels in the perianth. In tomato, the expression pattern of B-class genes is compatible with the ABC model; the conservation of the function of AP3 and PI orthologs (the latter is duplicated in tomato) was previously shown in direct RNAi experiments (de Martino et al., 2006; Guo et al., 2016). Tomato belongs to the asterids, while Arabidopsis belongs to the rosids. Buckwheat is more closely related to the asterids, which suggests that the control of petal identity by the B-class genes was lost in an ancestor of buckwheat after its divergence from asterids. Earlier, we suggested that B-class genes are not involved in petaloidy in buckwheat based on the phenotype of a buckwheat homeotic mutant (Logacheva et al., 2008). It has carpelloid organs instead of tepals, presumably due to the overexpression of C-class gene(s); in case if B-class genes had been involved these would have been stamens. This hypothesis now gains support from the obtained expression profiles. Studies on the complementation of Arabidopsis ap3 and pi mutants via the overexpression of buckwheat AP3 and PI genes also show limited conservation of function (Fang et al., 2014, 2015). An alternative program of petal development, which is not dependent on B-class genes, was also found in a family of the core Caryophyllales, Aizoaceae (Brockington et al., 2012).
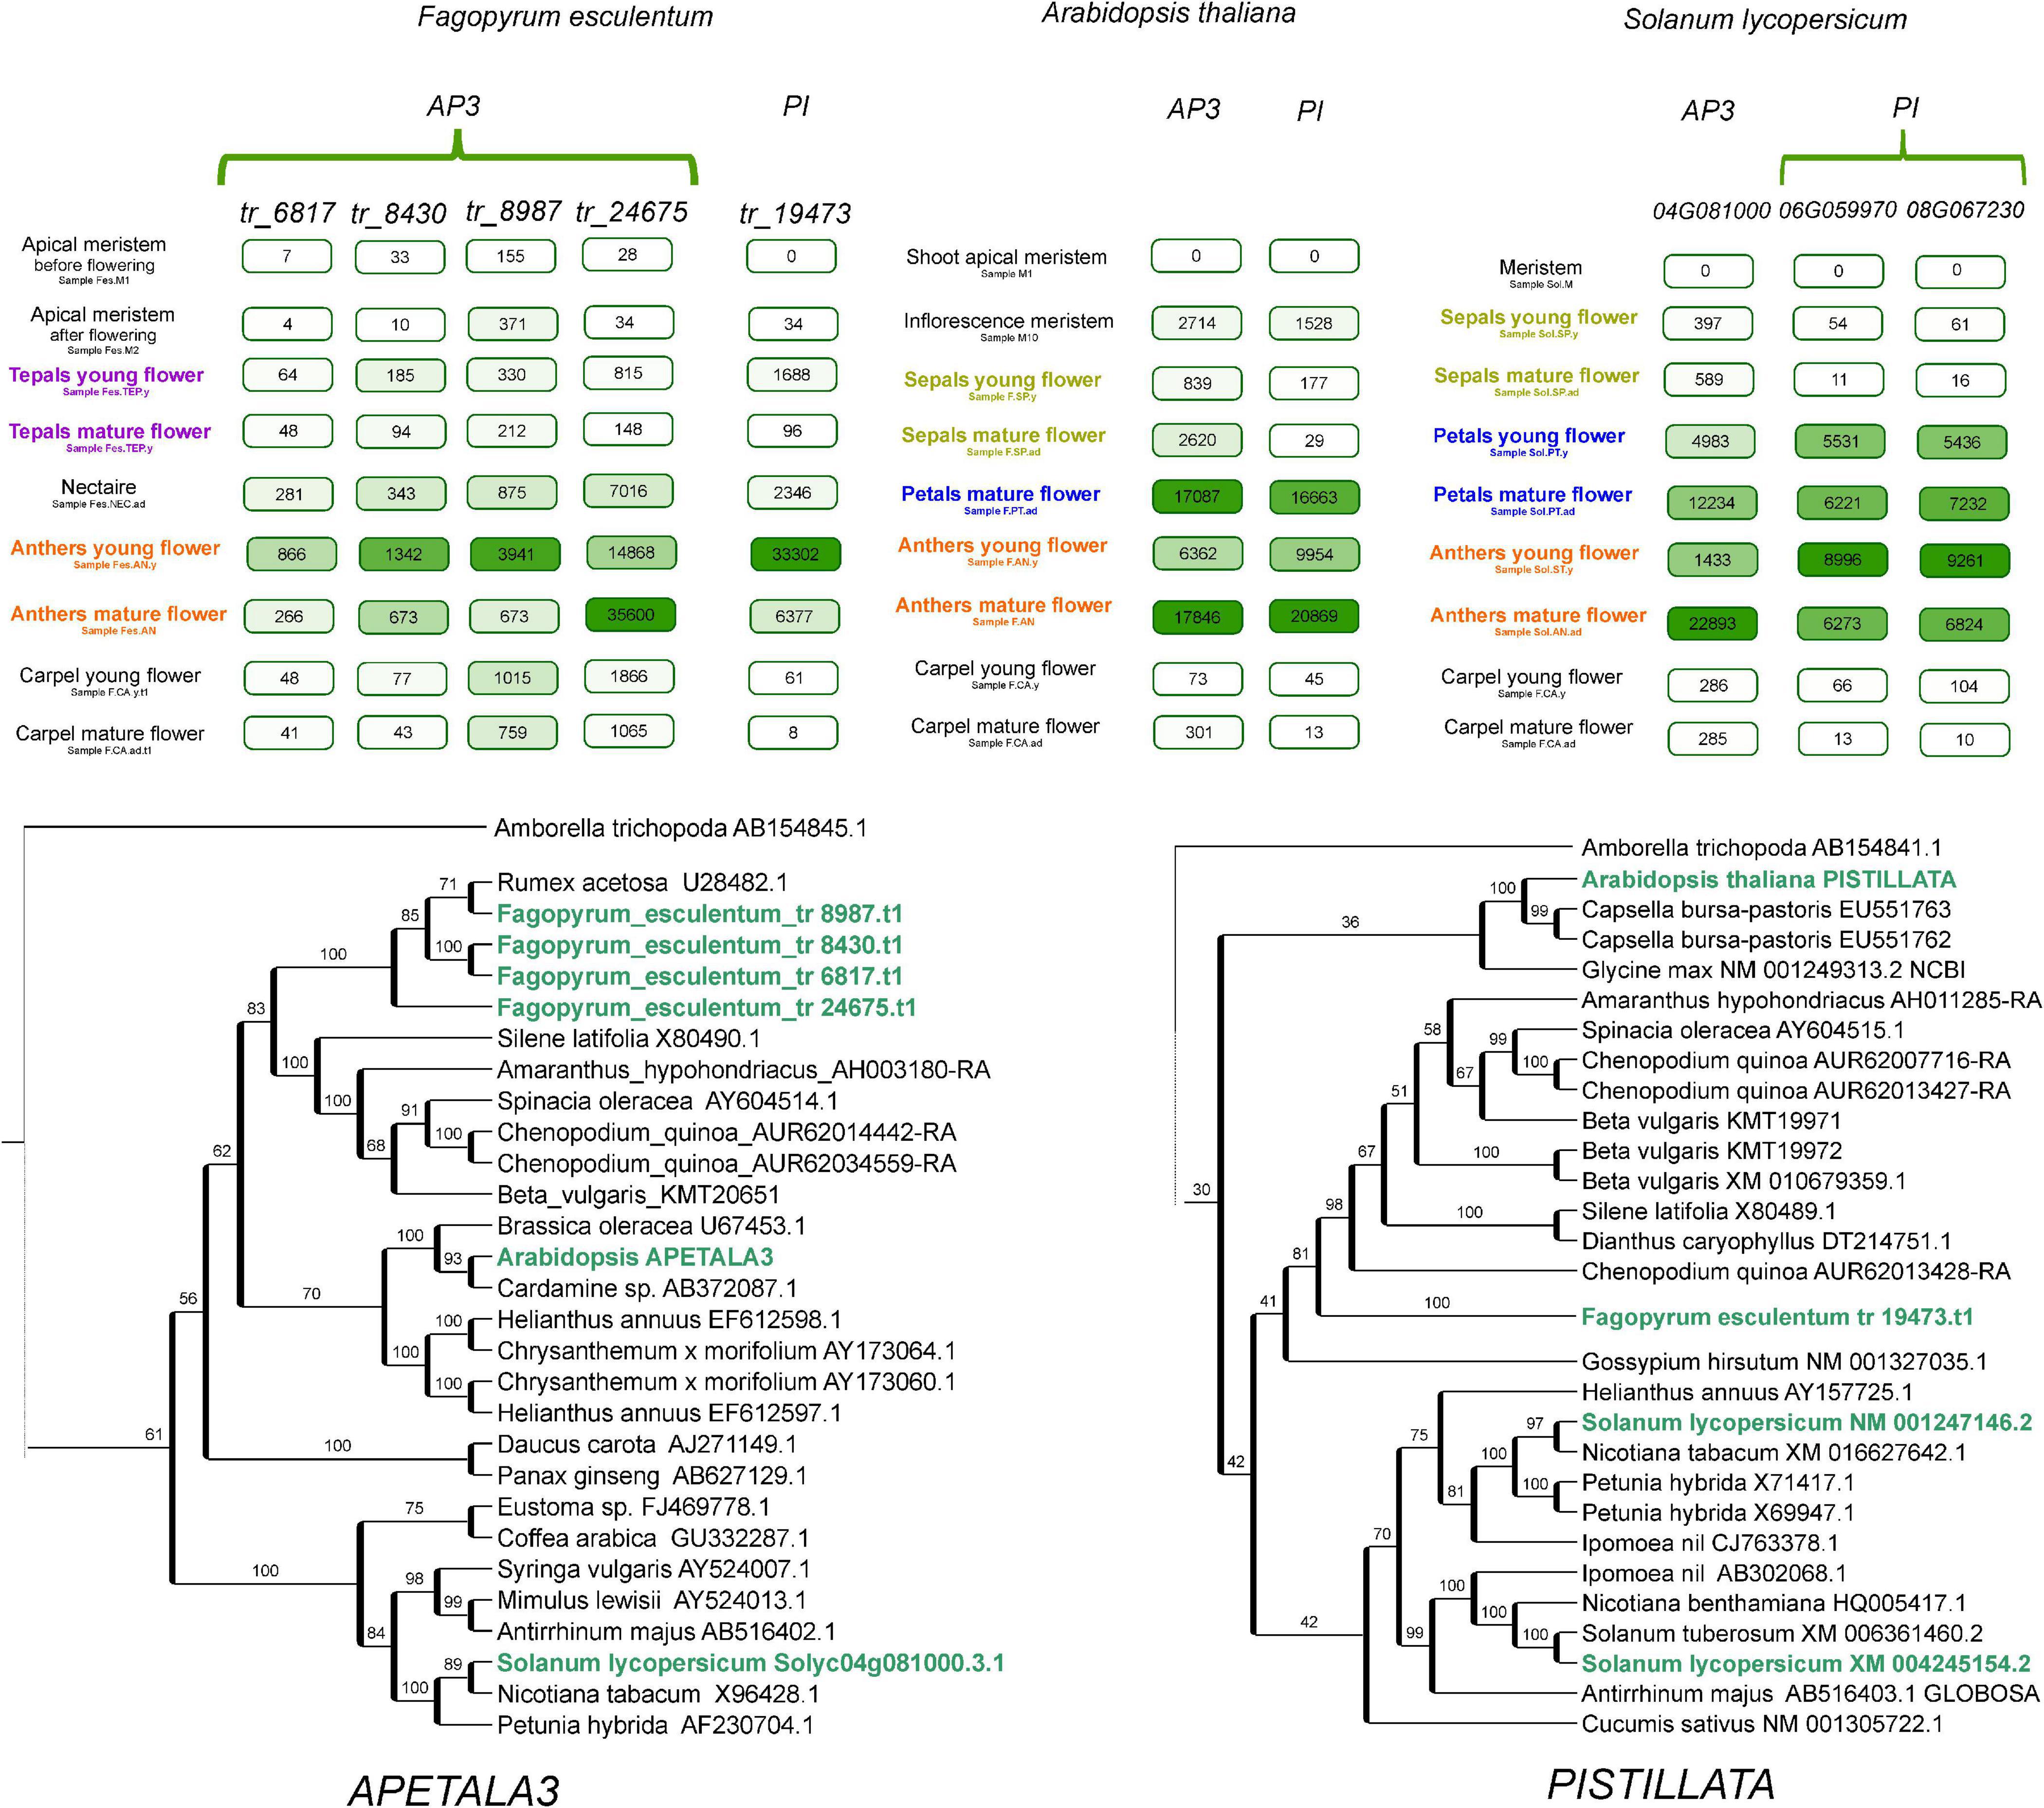
Figure 5. Phylogeny and expression patterns of the orthologs of the B-class genes APETALA3 and PISTILLATA in Arabidopsis, buckwheat and tomato, with a focus on floral organs. Numbers in boxes denote normalized read counts. Color saturation is proportional to the expression level (each has its own scale). Selected samples are represented; complete profiles are available at http://travadb.org/.
The most notable features of petaloidy in buckwheat tepals are white color (while the sepals are usually green) and the shape of epidermal cells, which are conical (Hong et al., 1998), as found in the petals of most plants (Whitney et al., 2011). Studies in the model organism Antirrhinum majus have shown that the major role in the development of conical cells is played by the MIXTA gene, encoding an R2R3-MYB transcription factor (Glover et al., 1998; Perez-Rodriguez, 2005). Additional factors from the MYB family that are closely related to MIXTA control other aspects of this process (Perez-Rodriguez, 2005). Arabidopsis does not have a MIXTA ortholog, but two genes from a sister clade, MYB106 (AT3G01140), and MYB16 (AT5G15310), as well as several other MYB family TFs, participate in the control of epidermal cell development (Oshima et al., 2013). The evolutionary history of MIXTA/MIXTA-like genes is complicated, being shaped by multiple duplications and gene losses, particularly in the MIXTA clade (Brockington et al., 2013). In the buckwheat genome, we identified 118 genes with significant similarity to MIXTA/MYB16/MYB106 (Supplementary Table 9). Six of them showed an expression pattern compatible with their role in the determination of conical cells, with prevalent expression in developing tepals (Supplementary Figure 5). One of these transcripts – tr_18111 – exhibit a protein motif that is characteristic of MIXTA, MYB16, and MYB106. Phylogenetic analysis also indicates that tr_18111 falls into the clade of MIXTA-like genes (Supplementary Figure 6). The evidence from phylogenetic analysis and expression patterns leads us to the hypothesis that tr_18111 is a gene that perform the same function in buckwheat as MIXTAin A. majus. Within Antirrhinum, MIXTA has been shown to be under the control of B-class genes in A. majus (Perez-Rodriguez, 2005; Manchado-Rojo et al., 2012), and this regulatory contour seems to be conserved as far as the monocots (Pan et al., 2014). The absence of B-class gene activity in buckwheat tepals along with the presence of conical cells suggests that this link is not universal. The current data do not allow to hypothesize about what genes take this role in buckwheat instead of B-class genes. We expect that comparative analysis of buckwheat species that differ in the shape and cell wall structure of tepal epidermal cells will help to delineate possible candidates. The morphology of tepal epidermal cells differs within the genus Fagopyrum: they are conical in F. esculentum and F. tataricum (though the latter has green “sepaloid” tepals), whereas they are elongated with sinuated walls in other species (Hong et al., 1998). This genus is thus a good model for the study of the genetic control of petal identity and petal epidermal cell structure. The characterization of the genome and expression profiles of F. esculentum enables a comparative transcriptomic study of the genus.
Conclusion
We characterized the 1.5 Gb genome of F. esculentum, providing a reference assembly with high contiguity and an improved representation of protein-coding genes. The genome size of F. esculentum, which is three times larger than that of its sister species F. tataricum, is a product of a “transposon burst” that occurred 0.5–1 Mya. To provide a framework for the functional and comparative genomics of buckwheat, we constructed a comprehensive transcriptome atlas from 46 tissues, organs and developmental stages. We demonstrated that high-resolution transcriptome maps provide new information that allows us to discern the function of closely related genes and to test biological hypotheses regarding gene function and the conservation of developmental programs.
Experimental Procedures
Genome Sequencing, Assembly, and Assembly Quality Check
The Dasha cultivar was chosen as the source material for the construction of the reference genome. DNA was extracted from fresh-frozen young leaves free of visible injuries, necrosis and/or presence of pathogens using the CTAB protocol (Doyle and Doyle, 1987). For Illumina sequencing, a fragment library was prepared using the TruSeq DNA sample preparation kit (Illumina), with 500 ng of DNA as the input and size selection of fragments in the range of 500–600 bp (corresponding to a 380–480 bp insert length) in 2% agarose gels. Sequencing was performed on a HiSeq2500 instrument with HiSeq Rapid 500 cycle reagents at the University of Illinois at Urbana-Champaign (Roy J. Carver Biotechnology Center). Mate-pair libraries were prepared with a Nextera Mate-pair sample preparation kit (Illumina) with 5000 ng of DNA as the input. Size selection was performed in agarose gels; three lengths were selected: 3–4 kbp, 5–7 kbp and 8–10 kbp. Mate-pair libraries were sequenced on a HiSeq2000 instrument with a TruSeq SBS 200 cycle kit. For sequencing on the Pacific Bioscience platform, DNA was extracted in the same way indicated above and sequenced with a SMRT cell on a Sequel II instrument with CCS read settings at the DNALink facility.
The assembly process consisted of three stages: contig assembly, scaffolding and gap closing. For contig assembly, a Newbler assembler was used. Newbler v. 2.9 was run on a 4 Intel(R) Xeon(R) CPU E7-4830 v2 2.20 GHz computer with 2 TB RAM with the following parameters: “-large -ml 150 -mi 85 -het.” These parameters specified a minimal overlap length of not less than 150 bp and minimal overlap identity of 85%. The “long” parameter indicates a large genome (> 100 Mb), and the “het” parameter indicates heterozygosity. The resulting contigs with lengths greater than 1000 bp were retained for scaffolding. Scaffolding was performed using Platanus v. 1.0.0 (Kajitani et al., 2014) (subprogram scaffold) with the parameter “−l 3,” indicating that contig joining should be supported by at least 3 mate-pair links. The closing of the gaps was carried out in two stages. In the first stage, gaps were closed with Platanus version 1.0.0 software (with default parameters) and Illumina mate-pair data. In the second stage, gaps were closed with PacBio CCS data and LR_Gapcloser software (Xu et al., 2019) with the parameter “−r 5.”
RNA Extraction and Sequencing
For RNA-seq analysis, RNA was extracted from a set of different organs and developmental stages using the RNEasy Plant Mini kit (Qiagen, Netherlands) with the modifications described previously (Logacheva et al., 2011). For the transcriptome map, each sample was collected in two biological replicates. Each replicate was a pool of organs/tissues taken from at least 5 plants, in order to decrease the variation of the expression levels not related to the difference between samples but to the within-group variation (see e.g., Takele Assefa et al., 2020). RNA quality was checked using a Bioanalyzer2100 (Agilent, United States); samples with RIN > 7 were employed for subsequent analysis. For Oxford Nanopore Technologies sequencing, RNA was converted to cDNA using a Mint cDNA synthesis kit (Evrogen, Russia). The primers for reverse transcription included custom barcodes unique to each sample; thus, the samples corresponding to different organs/stages were pooled after reverse transcription. cDNA was amplified via 24 cycles of amplification. Amplified cDNA was used as the input for library preparation via a standard protocol for genomic DNA with an LSK-309 kit. Sequencing was performed on a MinION system with a 9.5.1 flow cell, and base calling was performed with Guppy. For Illumina sequencing, the libraries were prepared using a TruSeq RNA sample preparation kit (Illumina, United States) following the manufacturer’s protocol and sequenced on a HiSeq2000 instrument (Illumina, United States) with 50-bp single reads.
Annotation
The assembled scaffolds after the first stage of the gap-closing procedure for F. esculentum were repeat masked with RepeatMasker (version 3.3.0) before annotation3. Gene models that overlapped with any of the repeat regions were given a score penalty. RNA-seq data were mapped with STAR (version 2.4) on the masked genome assembly, and the obtained alignment files were used to generate hints for Augustus consisting of hints about the intron start and end sites and transcribed regions. The initial set of genes was predicted ab initio by running the Augustus (version 3.0.1) gene prediction program with different parameters (species model: Arabidopsis/tomato; hints: with/without hints, 4 runs in total) and GeneMark. ES (version 2.3). All predicted gene models were combined. All predicted gene models were evaluated and ranked according to the following criteria: (1) a small positive bonus was added to the gene model if the intron or exon was supported by RNA-seq data; (2) a positive bonus proportional to the quality and significance of blastp alignment with known proteins from the following datasets: A. thaliana (maximal bonus if the alignment was significant), SwissProt (smaller bonus) and the NCBI non-redundant database (smallest bonus), was added to the gene model; (3) large negative penalties were applied if the model intersected with repeat regions or showed a hit with a TE. Models were sorted by score. The best-scoring models were picked first, and only one best-scoring isoform was included in the final annotation (no overlapping models). Orthogroups were obtained using Orthofinder software version 2.4.0 (Emms and Kelly, 2019) with four species – F. esculentum (assembly from the current study), Beta vulgaris (Dohm et al., 2014), Solanum lycopersicum and A. thaliana (annotation version TAIR10). The annotation of TFs was performed using PlantRegMap (Tian et al., 2019). The completeness of the assembly was estimated using BUSCO version 4.0.6 software (Simão et al., 2015) for the eudicot lineage and the Viridiplantae lineage.
Transposable Element Analysis
To compare the repeatome composition between species, 4,000,000 F. esculentum and 1,600,000 F. tataricum high-quality paired-end Illumina genomic reads were randomly sampled, and suffixes and prefixes were added using a Python script4. The reads were combined into a single FASTA file and used for RepeatExplorer (Novak et al., 2013) and TAREAN analysis (Novák et al., 2017). The locally installed version of RepeatExplorer containing the built-in TAREAN program was run with the following settings: -p -c 150 -C -r 400000000 -P 2. The automatic annotation data were used for repeat classification. Clusters corresponding to organelle DNA were removed, and the portion of the genome consisting of repeats was corrected according to the new number of reads. The table containing the information about cluster annotation and read number was analyzed in Rstudio Version 1.2.13355 with R version 3.6.0 using custom scripts with relevant packages, including ggplot2 (Wickham, 2009) and data.table6. For the comparison of the repeatome composition between FE cultivars, 2,000,000 high-quality paired-end Illumina genomic reads were randomly selected, and RepeatExplorer was run as described above. A heatmap was constructed using the ComplexHeatmap R package (Gu et al., 2016).
For the genome-based analysis of LTR RTEs in the two species, the genome assembly of F. tataricum [(see text footnote 1, Zhang et al., 2017)] was downloaded. The LTRharvest tool with default parameters (Ellinghaus et al., 2008) was used to predict putative coordinates of LTR RTEs in the genomes. The obtained gff3 file was sorted and used as the input for the LTRdigest program (Steinbiss et al., 2009) with the following settings: -aaout yes -pptlen 10, 30 -pbsoffset 0, 3 -pdomevalcutoff 0.001. Hmm repeat profiles of RTE domains were downloaded from the GyDB database (Llorens et al., 2011). The gff3 file from LTRdigest analysis was parsed using a custom python script7 to extract the sequences of full-length LTR RTEs (those possessing similarity to GAG, RT, RH, AP and INT domains) and their LTRs. TEsorter software (Zhang et al., 2019) was used for RTE classification. The insertion time was calculated with the formula T = k/2r, where k is the distance between LTRs estimated via Kimura’s two-parameter method (Kimura, 1980) and r is the mutation rate. A mutation rate of 1.3 × 10⁻⁸ substitutions per site per year (Ma and Bennetzen, 2004) was used. Parameter K was calculated as 0.5 log [(1–2p -q) ∗ sqrt(1–2q)], where p is the transition frequency and q is the transversion frequency. The transition and transversion frequencies were estimated after the alignment of 5′ and 3′ LTR sequences with clustalw2 software8. The insertion time analysis was automated with a custom Python script9.
Gene Expression Analysis
The total number of reads mapped on a given gene (TGR) was used as a measure of the expression level. The “DESeq” (Anders and Huber, 2010) median approach was used for the normalization of gene expression levels according to library size. We used a threshold of 5 or a more normalized TGR in both biological replicates to identify the expressed genes. “DESeq2” (Love et al., 2014) was used for differential expression analysis with the following settings: a false discovery rate (FDR) < 0.05 and a fold change ≥ 2. The differential expression (DE) score was defined as reported previously (Klepikova et al., 2016). Gene expression pattern width was assessed as described by Penin et al. (2019).
Phylogenetic Analysis
Nucleotide sequences were used for phylogenetic analysis. Alignment was performed using MUSCLE (Edgar, 2004), and further was conducted processing using GBlocks with “less stringent” settings (Castresana, 2000). For phylogenetic tree reconstruction, we used IQ-tree (Minh et al., 2020) with the GTR model and 1000 bootstrap replicates.
Data Availability Statement
Genome assembly and raw sequencing reads for the Dasha cultivar (reference genome) are available in the NCBI database under Bioproject # PRJNA487881. Raw reads from buckwheat cultivars and F. esculentum ssp. ancestrale are available under Bioproject # PRJNA627307. The transcriptome reads are available from NCBI SRA, and their accession numbers are listed in Supplementary Table 6.
Author Contributions
AP constructed transcriptome libraries and coordinated the part of the work on the transcriptome analysis. ASK performed genome assembly. AVK performed gene expression analysis. IK analyzed the repeatome and participated in writing. EG performed genome annotation. AF provided plant material. ML conceived and coordinated the study, constructed genome libraries, performed phylogenetic analysis, and drafted the manuscript. All authors contributed to the article and approved the submitted version.
Funding
This study was supported by Russian Foundation for Basic Research, project # 18-29-13017 (development of a transcriptome map) and Russian Science Foundation, project # 18-76-10018.
Conflict of Interest
The authors declare that the research was conducted in the absence of any commercial or financial relationships that could be construed as a potential conflict of interest.
Acknowledgments
We are grateful to Dr. Alexey Kondrashov for the access to sequencing and computational facilities.
Supplementary Material
The Supplementary Material for this article can be found online at: https://www.frontiersin.org/articles/10.3389/fpls.2021.612382/full#supplementary-material
Supplementary Figure 1 | Repeat content in F. esculentum spp. ancestrale and different buckwheat cultivars. DAS, Dasha; BAS, Bashkirskya krasnostebelnaya; DEM, Demetra; DEV, Devyatka; DIA, Dialog; DIZ, Dizajn; KAR, Karadag; KAZ, Kazanka; KUJ, Kujbyshevskaya; DRR/YAS, the sample from the study by Yasui et al. (2016), cultivar unknown, presumably of Japanese origin, KIT/SHI, Shinanonatsusoba, FEA – F. esculentum spp. ancestrale.
Supplementary Figure 2 | The distribution of Shannon entropy across expressed genes of F. esculentum.
Supplementary Figure 3 | Heatmap showing tissue-specific (Shannon enthropy cut-off 0.25) buckwheat genes. For each gene expression values were normalized by maximal value.
Supplementary Figure 4 | Heatmap showing the expression profiles of the genes – orthologs of the stably expressed genes in Arabidopsis thaliana.
Supplementary Figure 5 | Heatmap showing the expression of buckwheat MYB genes sharing significant similarity with MIXTA/MYB16/MYB106.
Supplementary Figure 6 | Phylogenetic tree of angiosperm MIXTA/MIXTA-like genes.
Supplementary Table 1 | Data generated for the de novo assembly of the buckwheat genome and accession numbers of raw reads.
Supplementary Table 2 | Statistics of the assembly.
Supplementary Table 3 | Statistics for the presence of universal single-copy orthologs for the earlier assembly of the buckwheat genome and for the assembly reported in our study.
Supplementary Table 4 | Statistics of the protein-coding gene annotation.
Supplementary Table 5 | Transcription factor genes annotated in the buckwheat genome.
Supplementary Table 6 | List of the samples included in the transcriptome mapping procedure and accession numbers of the raw reads.
Supplementary Table 7 | Samples included in the transcriptome mapping procedure and correlations.
Supplementary Table 8 | GO enrichment of the genes with broadest and narrowest expression patterns.
Supplementary Table 9 | Buckwheat MYB genes selected based on similarity to MIXTA and MYB16/MYB106.
Footnotes
- ^ http://mbkbase.org/Pinku1/FtChromosomeV2.fasta.gz
- ^ http://travadb.org/browse/Species=Fesc/
- ^ http://www.repeatmasker.org
- ^ https://github.com/Kirovez/RepeatExplorer_scripts/blob/master/prepareReadsREv2.py
- ^ http://www.rstudio.com/
- ^ https://cran.r-project.org/web/packages/data.table/index.html
- ^ https://github.com/Kirovez/LTR-RTE-analysis/blob/master/LtrDiParser_v2.2.py
- ^ http://www.clustal.org/clustal2
- ^ https://github.com/Kirovez/LTR-RTE-analysis/blob/master/TEinsertionEstimator.py
References
Altenhoff, A. M., Studer, R. A., Robinson-Rechavi, M., and Dessimoz, C. (2012). Resolving the ortholog conjecture: orthologs tend to be weakly, but significantly, more similar in function than paralogs. PLoS Comput. Biol. 8:e1002514. doi: 10.1371/journal.pcbi.1002514
Alvarez-Jubete, L., Arendt, E. K., and Gallagher, E. (2010). Nutritive value of pseudocereals and their increasing use as functional gluten-free ingredients. Trends Food Sci. Technol. 21, 106–113. doi: 10.1016/j.tifs.2009.10.014
Anders, S., and Huber, W. (2010). Differential expression analysis for sequence count data. Genome Biol. 11:R106.
Bennett, M. D., and Leitch, I. (2005). Nuclear DNA amounts in angiosperms: progress, problems and prospects. Ann. Bot. 95, 45–90. doi: 10.1093/aob/mci003
Brockington, S. F., Alexandre, R., Ramdial, J., Moore, M. J., Crawley, S., Dhingra, A., et al. (2009). Phylogeny of the caryophyllales sensu lato: revisiting hypotheses on pollination biology and perianth differentiation in the core caryophyllales. Int. J. Plant Sci. 170, 627–643. doi: 10.1086/597785
Brockington, S. F., Alvarez-Fernandez, R., Landis, J. B., Alcorn, K., Walker, R. H., Thomas, M. M., et al. (2013). Evolutionary analysis of the MIXTA gene family highlights potential targets for the study of cellular differentiation. Mol. Biol. Evol. 30, 526–540. doi: 10.1093/molbev/mss260
Brockington, S. F., Rudall, P. J., Frohlich, M. W., Oppenheimer, D. G., Soltis, P. S., and Soltis, D. E. (2012). ‘Living stones’ reveal alternative petal identity programs within the core Eudicots. Plant J. 69, 193–203. doi: 10.1111/j.1365-313x.2011.04797.x
Castresana, J. (2000). Selection of conserved blocks from multiple alignments for their use in phylogenetic analysis. Mol. Biol. Evol. 17, 540–552. doi: 10.1093/oxfordjournals.molbev.a026334
Coen, E. S., and Meyerowitz, E. M. (1991). The war of the whorls: genetic interactions controlling flower development. Nature 353, 31–37. doi: 10.1038/353031a0
Czechowski, T., Stitt, M., Altmann, T., Udvardi, M. K., and Scheible, W.-R. (2005). Genome-Wide identification and testing of superior reference genes for transcript normalization in Arabidopsis. Plant Physiol. 139, 5–17. doi: 10.1104/pp.105.063743
de Martino, G., Pan, I., Emmanuel, E., Levy, A., and Irish, V. F. (2006). Functional analyses of two tomato APETALA3 genes demonstrate diversification in their roles in regulating floral development. Plant Cell 18, 1833–1845. doi: 10.1105/tpc.106.042978
Demidenko, N. V., Logacheva, M. D., and Penin, A. A. (2011). Selection and validation of reference genes for quantitative real-time PCR in buckwheat (Fagopyrum esculentum) based on transcriptome sequence data. PLoS One 6:e19434. doi: 10.1371/journal.pone.0019434
Dohm, J. C., Minoche, A. E., Holtgräwe, D., et al. (2014). The genome of the recently domesticated crop plant sugar beet (Beta vulgaris). Nature 505, 546–549. doi: 10.1038/nature12817
Doyle, J. J., and Doyle, J. L. (1987). A rapid DNA isolation procedure for small quantities of fresh leaf tissue. Phytochem. Bull. 19, 11–15.
Edgar, R. C. (2004). MUSCLE: multiple sequence alignment with high accuracy and high throughput. Nucleic Acids Res. 32, 1792–1797. doi: 10.1093/nar/gkh340
Ellinghaus, D., Kurtz, S., and Willhoeft, U. (2008). LTRharvest, an efficient and flexible software for de novo detection of LTR retrotransposons. BMC Bioinform. 9:18. doi: 10.1186/1471-2105-9-18
Emms, D. M., and Kelly, S. (2019). OrthoFinder: phylogenetic orthology inference for comparative genomics. Genome Biol. 20:238. doi: 10.1186/s13059-019-1832-y
Fang, X., Zhang, Y., Zhang, Y., Huang, K., Yang, W., Li, X., et al. (2019a). De novo transcriptome assembly and identification of genes related to seed size in common buckwheat (Fagopyrum esculentum M.). Breed. Sci. 69, 487–497. doi: 10.1270/jsbbs.18194
Fang, Z., Hou, Z., Wang, S., Liu, Z., Wei, S., Zhang, Y., et al. (2019b). Transcriptome analysis reveals the accumulation mechanism of anthocyanins in buckwheat (Fagopyrum esculentum Moench) cotyledons and flowers. Int. J. Mol. Sci. 20:1493. doi: 10.3390/ijms20061493
Fang, Z., Qi, R., Li, X., and Liu, Z. (2014). Ectopic expression of FaesAP3, a Fagopyrum esculentum (Polygonaceae) AP3 orthologous gene rescues stamen development in an Arabidopsis ap3 mutant. Gene 550, 200–206. doi: 10.1016/j.gene.2014.08.029
Fang, Z.-W., Li, X.-P., and Li, X.-F. and Liu, Z.-X. (2015). FaesPI, a Fagopyrum esculentum PISTILLATA ortholog, is involved only in stamen development. J. Plant Biol. 58, 102–109. doi: 10.1007/s12374-014-0390-9
Fesenko, A. N. (2009). New Methods of Buckwheat Breeding [Novye Metody Selekcii Grechihi]. D. Sci. Thesis. N.I. Vavilov All-Russian Institute of plant genetic resources: Saint Petersburg.
Fesenko, A. N., Amelin, A. V., Fesenko, I. N., Biryukova, O. V., and Zaikin, V. V. (2018). Novyj Sort Grechihi Dasha [Dasha-A Novel Cultivar Of Buckwheat]. Available online at: https://cyberleninka.ru/article/n/novyy-sort-grechihi-dasha/pdf [Accessed May 26, 2020].
Gabaldón, T., and Koonin, E. V. (2013). Functional and evolutionary implications of gene orthology. Nat. Rev. Genetics 14, 360–366. doi: 10.1038/nrg3456
Galpaz, N., Gonda, I., Shem-Tov, D., Barad, O., Tzuri, G., Lev, S., et al. (2018). Deciphering genetic factors that determine melon fruit-quality traits using RNA-Seq-based high-resolution QTL and eQTL mapping. Plant J. 94, 169–191. doi: 10.1111/tpj.13838
Giménez-Bastida, J. A., and Zieliński, H. (2015). Buckwheat as a functional food and its effects on health. J. Agric. Food Chem. 63, 7896–7913. doi: 10.1021/acs.jafc.5b02498
Glover, B. J., Perez-Rodriguez, M., and Martin, C. (1998). Development of several epidermal cell types can be specified by the same MYB-related plant transcription factor. Development 125, 3497–3508.
Gu, Z., Eils, R., and Schlesner, M. (2016). Complex heatmaps reveal patterns and correlations in multidimensional genomic data. Bioinformatics 32, 2847–2849. doi: 10.1093/bioinformatics/btw313
Guo, J., Xu, W., Hu, Y., Huang, J., Zhao, Y., Zhang, L., et al. (2020). Phylotranscriptomics in cucurbitaceae reveal multiple whole-genome duplications and key morphological and molecular innovations. Mol. Plant 13, 1117–1133. doi: 10.1016/j.molp.2020.05.011
Guo, X., Hu, Z., Yin, W., Yu, X., Zhu, Z., Zhang, J., et al. (2016). The tomato floral homeotic protein FBP1-like gene, SlGLO1, plays key roles in petal and stamen development. Sci. Rep. 6:20454.
Hanzawa, Y., Money, T., and Bradley, D. (2005). A single amino acid converts a repressor to an activator of flowering. Proc. Natl. Acad. Sci. 102, 7748–7753. doi: 10.1073/pnas.0500932102
Honda, M., Tamura, H., Kimura, T., Kinoshita, T., Mastsufuru, H., and Sasto, T. (2007). Control of lead polluted leachate in a Box-scale phytoremediation test using common buckwheat (Fagopyrum esculentum Moench) grown on lead contaminated soil. Environ. Technol. 28, 425–431. doi: 10.1080/09593332808618805
Hong, S.-P., de Craene, L. R., and Smets, E. (1998). Systematic significance of tepal surface morphology in tribes Persicarieae and Polygoneae (Polygonaceae). Bot. J. Linn. Soc. 127, 91–116. doi: 10.1111/j.1095-8339.1998.tb02091.x
Irish, V. F., and Sussex, I. M. (1990). Function of the apetala-1 gene during Arabidopsis floral development. Plant Cell 2, 741–753. doi: 10.2307/3869173
Jarvis, D. E., Ho, Y. S., Lightfoot, D. J., Schmöckel, S. M., Li, B., Borm, T. J., et al. (2017). The genome of Chenopodium quinoa. Nature 542, 307–312.
Joshi, D. C., Chaudhari, G. V., Sood, S., Kant, L., Pattanayak, A., Zhang, K., et al. (2019). Revisiting the versatile buckwheat: reinvigorating genetic gains through integrated breeding and genomics approach. Planta 250, 783–801. doi: 10.1007/s00425-018-03080-4
Kajitani, R., Toshimoto, K., Noguchi, H., Toyoda, A., Ogura, Y., Okuno, M., et al. (2014). Efficient de novo assembly of highly heterozygous genomes from whole-genome shotgun short reads. Genome Res. 24, 1384–1395. doi: 10.1101/gr.170720.113
Kanno, A., Saeki, H., Kameya, T., Saedler, H., and Theissen, G. (2003). Heterotopic expression of Class B floral homeotic genes supports a modified ABC model for Tulip (Tulipa gesneriana). Plant Mol. Biol. 52, 831–841.
Kimura, M. (1980). A simple method for estimating evolutionary rates of base substitutions through comparative studies of nucleotide sequences. J. Mol. Evol. 16, 111–120. doi: 10.1007/bf01731581
Klepikova, A. V., Kasianov, A. S., Gerasimov, E. S., Logacheva, M. D., and Penin, A. A. (2016). A high resolution map of the Arabidopsis thaliana developmental transcriptome based on RNA-seq profiling. Plant J. 88, 1058–1070. doi: 10.1111/tpj.13312
Lei, G. J., Yokosho, K., Yamaji, N., Fujii-Kashino, M., and Ma, J. F. (2017). Functional characterization of two half-size ABC transporter genes in aluminium-accumulating buckwheat. New Phytol. 215, 1080–1089. doi: 10.1111/nph.14648
Leushkin, E. V., Sutormin, R. A., Nabieva, E. R., Penin, A. A., Kondrashov, A. S., and Logacheva, M. D. (2013). The miniature genome of a carnivorous plant Genlisea aurea contains a low number of genes and short non-coding sequences. BMC Genomics 14:476. doi: 10.1186/1471-2164-14-476
Liu, Z., Fei, Y., Zhang, K., and Fang, Z. (2019). Ectopic Expression of a Fagopyrum esculentum APETALA1 ortholog only rescues sepal development in Arabidopsis ap1 mutant. Int. J. Mol. Sci. 20:2021. doi: 10.3390/ijms20082021
Llorens, C., Futami, R., Covelli, L., Domínguez-Escribá, L., Viu, J. M., Tamarit, D., et al. (2011). The Gypsy Database (GyDB) of mobile genetic elements: release 2.0. Nucleic Acids Res. 39, D70–D74.
Logacheva, M. D., Fesenko, I. N., Fesenko, A. N., and Penin, A. A. (2008). Genetic and morphological analysis of floral homeotic mutants tepal-like bract and fagopyrum apetala of Fagopyrum esculentum. Botany 86, 367–375. doi: 10.1139/b08-010
Logacheva, M. D., Kasianov, A. S., Vinogradov, D. V., Samigullin, T. H., Gelfand, M. S., Makeev, V. J., et al. (2011). De novo sequencing and characterization of floral transcriptome in two species of buckwheat (Fagopyrum). BMC Genomics 12:30.
Logacheva, M. D., Schelkunov, M. I., Fesenko, A. N., Kasianov, A. S., and Penin, A. A. (2020). Mitochondrial genome of Fagopyrum esculentum and the genetic diversity of extranuclear genomes in buckwheat. Plants 9:618. doi: 10.3390/plants9050618
Love, M. I., Huber, W., and Anders, S. (2014). Moderated estimation of fold change and dispersion for RNA-seq data with DESeq2. Genome Biol. 15:550.
Ma, J., and Bennetzen, J. L. (2004). Rapid recent growth and divergence of rice nuclear genomes. Proc. Natl. Acad. Sci. 101, 12404–12410. doi: 10.1073/pnas.0403715101
Ma, J., Devos, K. M., and Bennetzen, J. L. (2004). Analyses of LTR-retrotransposon structures reveal recent and rapid genomic DNA loss in rice. Genome Res. 14, 860–869. doi: 10.1101/gr.1466204
Ma, J. F., Zheng, S. J., Matsumoto, H., and Hiradate, S. (1997). Detoxifying aluminium with buckwheat. Nature 390, 569–570. doi: 10.1038/37518
Machado, F. B., Moharana, K. C., Almeida-Silva, F., Gazara, R. K., Pedrosa-Silva, F., Coelho, F. S., et al. (2020). Systematic analysis of 1298 RNA-Seq samples and construction of a comprehensive soybean (Glycine max) expression atlas. Plant J. 103, 1894–1909. doi: 10.1111/tpj.14850
Manchado-Rojo, M., Delgado-Benarroch, L., Roca, M. J., Weiss, J., and Egea-Cortines, M. (2012). Quantitative levels of deficiens and globosa during late petal development show a complex transcriptional network topology of B function. Plant J. 72, 294–307. doi: 10.1111/j.1365-313x.2012.05080.x
Mandel, A. M., Gustafson-Brown, C., Savidge, B., and Yanofsky, M. F. (1992). Molecular characterization of the Arabidopsis floral homeotic gene APETALA1. Nature 360, 273–277. doi: 10.1038/360273a0
Minh, B. Q., Schmidt, H. A., Chernomor, O., Schrempf, D., Woodhams, M. D., von Haeseler, A., et al. (2020). IQ-TREE 2: new models and efficient methods for phylogenetic inference in the genomic era. Mol. Biol. Evol. 37, 1530–1534. doi: 10.1093/molbev/msaa015
Murigneux, V., Rai, S. K., Furtado, A., et al. (2020). Comparison of Long Read Methods for Sequencing and Assembly of a Plant Genome. Available online at: http://biorxiv.org/lookup/doi/10.1101/2020.03.16.992933 [Accessed May 25, 2020]
Nagano, M., Aii, J., Campbell, C., Kawasaki, S., and Adachi, T. (2000). Genome size analysis of the genus Fagopyrum. Fagopyrum 17, 35–39.
Nakamura, T., Fukuda, T., Nakano, M., Hasebe, M., Kameya, T., and Kanno, A. (2005). The modified ABC model explains the development of the petaloid perianth of Agapanthus praecox ssp. orientalis (Agapanthaceae) flowers. Plant Mol. Biol. 58, 435–445. doi: 10.1007/s11103-005-5218-z
Neethirajan, S., Hirose, T., Wakayama, J., Tsukamoto, K., Kanahara, H., and Sugiyama, S. (2011). Karyotype analysis of buckwheat using atomic force microscopy. Microsc. Microanal. 17, 572–577. doi: 10.1017/s1431927611000481
Novák, P., Ávila Robledillo, L., Koblížková, A., Vrbová, I., Neumann, P., and Macas, J. (2017). TAREAN: a computational tool for identification and characterization of satellite DNA from unassembled short reads. Nucleic Acids Res. 45:e111. doi: 10.1093/nar/gkx257
Novak, P., Neumann, P., Pech, J., Steinhaisl, J., and Macas, J. (2013). RepeatExplorer: a galaxy-based web server for genome-wide characterization of eukaryotic repetitive elements from next-generation sequence reads. Bioinformatics 29, 792–793. doi: 10.1093/bioinformatics/btt054
Ober, D. (2005). Seeing double: gene duplication and diversification in plant secondary metabolism. Trends Plant Sci. 10, 444–449. doi: 10.1016/j.tplants.2005.07.007
Ohsako, T., and Li, C. (2020). Classification and systematics of the Fagopyrum species. Breed. Sci. 70, 93–100. doi: 10.1270/jsbbs.19028
Oshima, Y., Shikata, M., Koyama, T., Ohtsubo, N., Mitsuda, N., and Ohme-Takagi, M. (2013). MIXTA-Like transcription factors and WAX INDUCER1/SHINE1 coordinately regulate cuticle development in Arabidopsis and Torenia fournieri. Plant Cell 25, 1609–1624. doi: 10.1105/tpc.113.110783
Pan, Z.-J., Chen, Y. Y., Du, J. S., Chen, Y. Y., Chung, M. C., and Tsai, W. C. (2014). Flower development of Phalaenopsis orchid involves functionally divergent SEPALLATA-like genes. New Phytol. 202, 1024–1042. doi: 10.1111/nph.12723
Penin, A. A., Klepikova, A. V., Kasianov, A. S., Gerasimov, E. S., and Logacheva, M. D. (2019). Comparative analysis of developmental transcriptome maps of Arabidopsis thaliana and Solanum lycopersicum. Genes 10:50. doi: 10.3390/genes10010050
Perez-Rodriguez, M. (2005). Development of three different cell types is associated with the activity of a specific MYB transcription factor in the ventral petal of Antirrhinum majus flowers. Development 132, 359–370. doi: 10.1242/dev.01584
Schmidt, M. H.-W., Vogel, A., Denton, A. K., Istace, B., Wormit, A., van de Geest, H., et al. (2017). De Novo assembly of a new Solanum pennellii accession using nanopore sequencing. Plant Cell 29, 2336–2348. doi: 10.1105/tpc.17.00521
Shirasu, K., Schulman, A. H., Lahaye, T., and Schulze-Lefert, P. A. (2000). Contiguous 66-kb barley DNA sequence provides evidence for reversible genome expansion. Genome Res. 10, 908–915. doi: 10.1101/gr.10.7.908
Shumayla, Sharma, S., Taneja, M., Tyagi, S., Singh, K., and Upadhyay, S. K. (2017). Survey of high throughput rna-seq data reveals potential roles for lncRNAs during development and stress response in bread wheat. Front. Plant Sci. 8:1019. doi: 10.3389/fpls.2017.01019
Simão, F. A., Waterhouse, R. M., Ioannidis, P., Kriventseva, E. V., and Zdobnov, E. M. (2015). BUSCO: assessing genome assembly and annotation completeness with single-copy orthologs. Bioinformatics 31, 3210–3212. doi: 10.1093/bioinformatics/btv351
Steinbiss, S., Willhoeft, U., Gremme, G., and Kurtz, S. (2009). Fine-grained annotation and classification of de novo predicted LTR retrotransposons. Nucleic Acids Res. 37, 7002–7013. doi: 10.1093/nar/gkp759
Takele Assefa, A., Vandesompele, J., and Thas, O. (2020). On the utility of RNA sample pooling to optimize cost and statistical power in RNA sequencing experiments. BMC Genomics 21:384. doi: 10.1186/s12864-020-6721-y
Tian, F., Yang, D.-C., Meng, Y.-Q., Jin, J., and Gao, G. (2019). PlantRegMap: charting functional regulatory maps in plants. Nucleic Acids Res. 8, D1104–D1113. doi: 10.1093/nar/gkz1020
Tulpan, D., and Leger, S. (2017). The plant orthology browser: an orthology and gene-order visualizer for plant comparative genomics. Plant Genome 10. doi: 10.3835/plantgenome2016.08.0078
van Tunen, A. J., Eikeboom, W., and Angenent, G. C. (1993). Floral organogenesis in Tulipa. Flow. Newsl. 16, 33–38.
Vitte, C., and Panaud, O. (2005). LTR retrotransposons and flowering plant genome size: emergence of the increase/decrease model. Cytogenet. Genome Res. 110, 91–107. doi: 10.1159/000084941
Whitney, H. M., Bennett, K. M. V., Dorling, M., Sandbach, L., Prince, D., Chittka, L., et al. (2011). Why do so many petals have conical epidermal cells? Ann. Bot. 108, 609–616. doi: 10.1093/aob/mcr065
Xu, G.-C., Xu, T.-J., Zhu, R., Zhang, Y., Li, S.-Q., Wang, H.-W., et al. (2019). LR_Gapcloser: A Tiling Path-Based Gap Closer that Uses Long Reads to Complete Genome Assembly. Available online at: https://academic.oup.com/gigascience/article/doi/10.1093/gigascience/giy157/5256637 [Accessed August 5, 2020].
Xu, J. M., Fan, W., Jin, J. F., Lou, H. Q., Chen, W. W., Yang, J. L., et al. (2017). Transcriptome analysis of Al-Induced genes in buckwheat (Fagopyrum esculentum Moench) root apex: new insight into Al Toxicity and resistance mechanisms in an Al Accumulating species. Front. Plant Sci. 8: 1141.
Yamaguchi, T., Lee, D. Y., Miyao, A., Hirochika, H., An, G., and Hirano, H.-Y. (2006). Functional diversification of the Two C-Class MADS box genes OSMADS3 and OSMADS58 in Oryza sativa. Plant Cell 18, 15–28. doi: 10.1105/tpc.105.037200
Yao, G., Jin, J.-J., Li, H.-T., Yang, J. B., Mandala, V. S., Croley, M., et al. (2019). Plastid phylogenomic insights into the evolution of Caryophyllales. Mol. Phylogenetics Evol. 134, 74–86. doi: 10.1016/j.ympev.2018.12.023
Yasui, Y., Hirakawa, H., Ueno, M., Matsui, K., Katsube-Tanaka, T., Yang, S. J., et al. (2016). Assembly of the draft genome of buckwheat and its applications in identifying agronomically useful genes. DNA Res. 23, 215–224. doi: 10.1093/dnares/dsw012
Zhang, L., Li, X., Ma, B., Gao, Q., Du, H., Han, Y., et al. (2017). The tartary buckwheat genome provides insights into rutin biosynthesis and abiotic stress tolerance. Mol. Plant 10, 1224–1237. doi: 10.1016/j.molp.2017.08.013
Zhang, R.-G., Wang, Z.-X., Ou, S., and Li, G.-Y. (2019). TEsorter: Lineage-Level Classification of Transposable Elements Using Conserved Protein Domains. Available online at: http://biorxiv.org/lookup/doi/10.1101/800177 [Accessed September 9, 2020]
Keywords: genome size, transposable elements, petals, genome, Caryophyllales, buckwheat, transcriptome map, Fagopyrum esculentum
Citation: Penin AA, Kasianov AS, Klepikova AV, Kirov IV, Gerasimov ES, Fesenko AN and Logacheva MD (2021) High-Resolution Transcriptome Atlas and Improved Genome Assembly of Common Buckwheat, Fagopyrum esculentum. Front. Plant Sci. 12:612382. doi: 10.3389/fpls.2021.612382
Received: 30 September 2020; Accepted: 03 February 2021;
Published: 16 March 2021.
Edited by:
Michael R. McKain, University of Alabama, United StatesReviewed by:
Robin Van Velzen, Wageningen University and Research, NetherlandsMoyang Liu, Shanghai Jiao Tong University, China
Copyright © 2021 Penin, Kasianov, Klepikova, Kirov, Gerasimov, Fesenko and Logacheva. This is an open-access article distributed under the terms of the Creative Commons Attribution License (CC BY). The use, distribution or reproduction in other forums is permitted, provided the original author(s) and the copyright owner(s) are credited and that the original publication in this journal is cited, in accordance with accepted academic practice. No use, distribution or reproduction is permitted which does not comply with these terms.
*Correspondence: Maria D. Logacheva, bWFyaWEubG9nQGdtYWlsLmNvbQ==