 Zareen Sarfraz1†
 Muhammad Shahid Iqbal1,2†Xiaoli Geng1
 Muhammad Sajid Iqbal1,2
 Mian Faisal Nazir1Haris Ahmed1
 Shoupu He1Yinhua Jia1
 Zhaoe Pan1
 Gaofei Sun3Saghir Ahmad2Qinglian Wang4
 Hongde Qin5Jinhai Liu6Hui Liu7Jun Yang8Zhiying Ma9Dongyong Xu10Jinlong Yang6Jinbiao Zhang11
 Zhikun Li9Zhongmin Cai6Xuelin Zhang12Xin Zhang4Aifen Huang13Xianda Yi5Guanyin Zhou6Lin Li11Haiyong Zhu1Baoyin Pang1Liru Wang1Junling Sun1*
 Xiongming Du1*
- 1State Key Laboratory of Cotton Biology/Institute of Cotton Research, Chinese Academy of Agricultural Sciences (ICR, CAAS), Anyang, China
- 2Cotton Research Institute, Ayub Agricultural Research Institute, Multan, Pakistan
- 3Anyang Institute of Technology, Anyang, China
- 4Henan Institute of Science and Technology, Xinxiang, China
- 5Cash Crops Research Institute, Hubei Academy of Agricultural Sciences, Wuhan, China
- 6Zhongmian Seed Technologies Co., Ltd., Zhengzhou, China
- 7Jing Hua Seed Industry Technologies Inc., Jingzhou, China
- 8Cotton Research Institute of Jiangxi Province, Jiujiang, China
- 9Key Laboratory for Crop Germplasm Resources of Hebei, Agricultural University of Hebei, Baoding, China
- 10Guoxin Rural Technical Service Association, Hebei, China
- 11Zhongli Company of Shandong, Shandong, China
- 12Hunan Cotton Research Institute, Changde, China
- 13Sanyi Seed Industry of Changde in Hunan Inc., Changde, China
For about a century, plant breeding has widely exploited the heterosis phenomenon–often considered as hybrid vigor–to increase agricultural productivity. The ensuing F1 hybrids can substantially outperform their progenitors due to heterozygous combinations that mitigate deleterious mutations occurring in each genome. However, only fragmented knowledge is available concerning the underlying genes and processes that foster heterosis. Although cotton is among the highly valued crops, its improvement programs that involve the exploitation of heterosis are still limited in terms of significant accomplishments to make it broadly applicable in different agro-ecological zones. Here, F1 hybrids were derived from mating a diverse Upland Cotton germplasm with commercially valuable cultivars in the Line × Tester fashion and evaluated across multiple environments for 10 measurable traits. These traits were dissected into five different heterosis types and specific combining ability (SCA). Subsequent genome-wide predictions along-with association analyses uncovered a set of 298 highly significant key single nucleotide polymorphisms (SNPs)/Quantitative Trait Nucleotides (QTNs) and 271 heterotic Quantitative Trait Nucleotides (hQTNs) related to agronomic and fiber quality traits. The integration of a genome wide association study with RNA-sequence analysis yielded 275 candidate genes in the vicinity of key SNPs/QTNs. Fiber micronaire (MIC) and lint percentage (LP) had the maximum number of associated genes, i.e., each with 45 related to QTNs/hQTNs. A total of 54 putative candidate genes were identified in association with HETEROSIS of quoted traits. The novel players in the heterosis mechanism highlighted in this study may prove to be scientifically and biologically important for cotton biologists, and for those breeders engaged in cotton fiber and yield improvement programs.
Introduction
The phenomenon of biological progeny outperforming either of their parents is defined as heterosis (Shull, 1922). The concept of heterosis dates back to early experiments on inbreeding and its complementing hybrid vigor (Shull, 1908, 1909). Generally, heterosis is assumed to be highly characteristic of allogamous crops but less common in purely autogamous crops for improvements in their total growth rate, fitness, and biomass production, as well as yield (Lippman and Zamir, 2007; Chen, 2013; Schnable and Springer, 2013).
Highly conceptual quantitative genetic models attributed to heterosis, known as dominance (Xiao et al., 1995), over dominance (Li et al., 2001, 2008) and epistasis (Yu et al., 1997), are considered insufficient for explaining its basic molecular mechanism. Currently, many omics studies are trying to describe changes in gene expression across genome and histone modifications, deoxyribonucleic acid (DNA) methylation, and micro RNAs. These aspects are being studied in hybrids and their parents as well, but nevertheless the genetic mechanism underlying this phenomenon remains elusive (He et al., 2010, 2013; Fujimoto et al., 2012; Groszmann et al., 2015; Miller et al., 2015). With the revolution in computational methods and extensive advancements in genome sequencing methods, deployment of genome-wide association studies (GWAS) has proven to be a tremendously powerful tool. It has been applied especially for exploring the specific genetic loci potentially accountable for heterotic traits in crop plants (Atwell et al., 2010; Kump et al., 2011; Huang et al., 2012; Meijón et al., 2014).
Cotton is widely cultivated across the globe as a natural fiber crop on a commercial basis. In this respect, Gossypium hirsutum is responsible for approximately 95% of cotton production worldwide (Grover et al., 2015). China is considered a top cotton-growing territory given the vast number of genotypic diversity and agro-ecological zones for cotton that exist in the country. Although both wider adaptability and increased productivity attributes are associated with Upland Cotton crop, the low quality of its fiber product requires novel improvements and advances in spinning technology. According to previous investigation, we know now that a substantial amount of heterosis exists in cotton (Sarfraz et al., 2018). Both India and China are enjoying substantial benefits of hybrid cotton via a cryptic process of heterosis since the last century (Basunanda et al., 2010). Nowadays, the focus of most studies in top edible crops like maize (Frascaroli et al., 2007), rapeseed (Radoev et al., 2008), and rice (Xiao et al., 1995) is on the heterosis mechanism. Linkage mapping studies that utilized segregating populations of these crops have found more than a single gene involved and related mechanisms for hybrid vigor existing among them (Schnable and Springer, 2013). Furthermore, the underlying genetic basis of heterosis in maize and rice is somewhat different. The prominent peculiarity related to the fact seems to be highly correlated to their self-pollinated or open-pollinated nature (Garcia et al., 2008). There is now a need to also study this confounding process systemically in Upland Cotton.
The use of bi-parental crossing scheme yields little additional information, but GWAS or linkage disequilibrium (LD) mapping have emerged as extensively utilized, powerful techniques for the genetic dissection of complex mechanisms via high density molecular markers (Zhu et al., 2008). Further, single nucleotide polymorphism (SNP) assays have empowered GWAS for such studies, especially as related to intricate cotton traits. Yet only a few reports of GWAS mapping have used F1 populations based on SNP markers in cotton.
Accordingly, this study was planned and executed in which GWAS was used to detect allelic variation in the genome of cotton and identify candidate SNPs strongly associated with economic quantitative traits. Restriction-site associated DNA (RAD) sequencing was applied to 1136 F1 individuals of upland cotton; these were then evaluated phenotypically in 10 environments over 2 years. The current study aimed at the (i) detection of SNP loci associated with trait performance of F1 hybrids and of Quantitative Trait Nucleotides (QTNs) related to the heterosis of these traits and (ii) the identification and validation of potential candidate genes, especially heterotic Quantitative Trait Nucleotide (hQTNs), related to the investigated traits.
Materials and Methods
A set of 284 diverse Upland Cotton accessions, collected from gene bank of ICR, CAAS, Anyang, Henan, along with four highly ranked and renowned commercial cultivars. This collection is from a range of different regions of China. A major portion, 83.3% (240), was collected from various conventional cotton-growing areas, including the Yangtze River region, the Yellow River Valley, and Northern and Southern areas of China. The other 16.67% (48) consisted of introductions from different geographical areas of United States, Ivory Coast, Australia, Russia, Turkmenistan, Uganda, Kenya, Burundi, Chad, Sudan, and Vietnam (11 different countries), as shown in Supplementary Table 1. The subgroups present in the experimental accessions were estimated using ADMIXTURE software. This panel of accessions was designated as male and female parents based on their performance and commercial value.
Line × Tester mating design was proposed for the current study to obtain different variables related to heterosis and combining abilities, for the purpose of utilizing them as variables in association studies. For this purpose, 284 female parents (lines) were crossed with four testers as males, namely 7886, A971Bt, 4133Bt, SGK9708 coded, respectively as tester A, C, D, and E to produce the F1 hybrid populations. The ensuing F1 hybrids were divided into four groups (SetA, SetC, SetD, and SetE) according to their respective parents.
Each set of F1 hybrids along with their respective parents were subjected to a field evaluation for plant phenotyping. Field plantations of the experimental material were established during the crop seasons of 2012 and 2013 at 12 locations in cotton-growing belts of China, these mainly spanning parts of the Yangtze River region (Changsha, Changde, Jiujiang, Hefei, Wuhan, and Jingzhou) and the Yellow River region (Anyang [ICR], Anyang [Beibi], Hejian, Dongying, Baoding, and Xinxiang). These locations were selected on the basis of significant differences in agro-ecological features including climate, amount of precipitation, temperature, soil fertility, growing period, and cultural practices.
Field experiments were carried out that used a triplicated randomized complete blocked design (RCBD) at all 12 locations. A single row of genotypes was 8.0 m, row × row distance was maintained at 0.8 m the plant × plant distance was kept at 0.3 m in the Yellow River region and at 0.5 m in the Yangtze River region. The distance between replications was 1.0 m. Local cotton growing practices were followed for sowing; i.e., direct sowing of delinted seeds/seeds with lint or transplanting of seedlings using the method predominantly used in that given region. All recommended agronomic practices–fertilizer application, seed treatment, seed rate, sowing methods, thinning, cultural practices, irrigation, insect pest control and weed management–were followed in similar manner to establish and maintain a good crop stand on all 12 experimental locations.
Data collection for all traits under study was carried out for all experimental units, by following the unanimous standard Descriptors for Data collection used for Cotton Germplasm, which was developed based on guidelines issued by the International Plant Genetic Resources Institute (IPGR). Ten individual guarded plants were randomly selected and tagged for data collection related to agronomic traits as well as quality-related characters. When the crop had about 70% open bolls, 30 bolls from each tagged individual plant (middle branches) per plot were harvested and examined for agronomic and fiber quality traits. The ginning of collected seed cotton samples was done using a roller-gin. About 150 g of ginned and clean lint samples were taken and sent to the Laboratory of Quality and Safety Risk Assessment for Cotton Products, Anyang, Henan, China, to examine fiber quality-related traits. Fiber quality analysis was carried out using high-volume instrument (HVI). Ten phenotypic traits–boll weight (BW), lint percentage (LP), fiber fineness or micronaire (MIC), fiber strength (FS), fiber length (FL), fiber elongation (FE), fiber uniformity (FU), fiber uniformity index (FUI) number of bolls per plant (BN) and plant height (PH)–were recorded (Supplementary Table 2) from 284 individuals of the above-mentioned F1 populations, as well as their parents, planted at different locations as experimental units during the two different years.
Sample Preparation for RAD Sequencing
Young fresh leaves were collected from each genotype and immediately frozen and then stored at −80°C. Genomic DNA was extracted following the CTAB method (Paterson et al., 1993) albeit with some modifications. The purified DNA was digested with FastDigest TaqI (Thermo Scientific Fermentas, United States), at 65°C for 10 min. Bar-coded adapters were ligated to the digested DNA fragments with T4 DNA ligase (Enzymatics, United States), during 1 h incubation at 22°C. The samples were then heated at 65°C for 20 min, after which 24 samples were pooled. The DNA fragments (400–600 bp) were purified from 2% agarose gel electrophoresis with the help of the QIA-quick Gel Extraction kit (QIA, Qiagen, Valencia, CA, United States). Adapter-ligated DNA fragments were further amplified by polymerase chain reaction (PCR), using the Phusion-High-fidelity DNA-polymerase (Finnzymes, Thermo Scientific, United States). Next, these amplified fragments were separated via agarose gel electrophoresis, and the ensuing DNA fragments (400–600 bp) were purified with the QIA-quick PCR Purification kit (Qiagen, Germany). Finally, the purified libraries were quantified on a 2100 Bioanalyzer (Agilent, United States) and each library sequenced by the Hi-Seq 2000 system (Illumina, United States). The raw reads were then aligned with the G. hirsutum L. TM-1 reference genome (v.1.1)1, using the “mem -t 8” parameter of the BWA program (Zhang et al., 2015). The GATK and SAMTools packages were used for SNP calling, after which any SNPs with a high missing-data rate (>40%) and a low minor allele frequency (MAF) (<5%) were eliminated (Li et al., 2009; McKenna et al., 2010). The generated sequencing data have been deposited into the NCBI database (accession number: PRJNA353524).
Phenotypic Data Analysis
The collected data for 10 agronomic and fiber quality traits (BW, LP, MIC, FS, FL, FE, FU, FUI, BN, and PH) recorded from 284 F1 crosses were subjected to univariate analysis for determining variability among the studied traits (Gomez et al., 1984). The relative increase or decrease (in percentage) for F1 hybrids over their respective parental values was determined for the estimation of possible heterotic effects for the agronomic and quality traits, by using these formulas (Fehr, 1987):
Heterobeltosis was calculated this way:
Mid-parent heterosis (MP) was calculated this way:
Competitive heterosis (K) over local cultivar(s)/Check(s) (CK) was calculated as:
In the current study, two standard heterosis measures, K3 and K4, were calculated by using two commercial Chinese cotton cultivars, i.e., Rui za 816 and Eza mian 10 hao (Tai D5), respectively.
The heterosis index (HI) was calculated as follows:
The specific combining ability (SCA) variance was calculated by using Line × Tester variance analysis (Singh and Chaudhary, 1977).
Genotypic Data Analysis
To explore different genetic factors presumably associated with heterosis in cotton, GWAS was performed by considering familial relatedness as well as population structure (Yu et al., 2006), utilizing the data for all traits under investigation for 2 years at 10 locations. The experimental genotypes were examined using “Restriction-site associated DNA (RAD) sequencing.” The BWA v.0.7.12 software was utilized to analyze all the SNP data. Only the reads mapped uniquely to the reference genome and the SNPs with high missing rate (>40%) and MAF (<5%), were considered for elimination for conducting GWAS.
The paired-end reads of each individual were identified by its barcode and aligned against the reference genome, using the BWA v.0.7.12 (Staples et al., 2014). The program SAMTools v.0.1.18 (Price et al., 2006) was used to generate the consensus sequences for every individual under study and further preparation of input data for SNP calling; the latter was carried out by realSFS v0.9832, using Bayesian-based estimation. The data obtained from the four sets of F1 genotypes along with parents were considered for calculations, based on principle that the 284 female parents and 4 male parents must be homozygous; otherwise, they were removed. Moreover, only those female and male parents having a different genotype (e.g., AA, BB) were considered for analysis, to ensure a heterozygous F1 genotype. The expected F1 genotype was calculated, by focusing on the genotype of respective male and female parent and heterozygous SNPs in either of the parents have been scored as missing.
Single nucleotide polymorphisms that met the following criteria were removed: (1) Length (distance) between two adjacent SNP loci was less than 5 bp. (2) SNPs with call rates lower than 70% (Wright et al., 2019) in the whole population. (3) A MAF < 0.05. (4) The proportion of its heterozygous genotypes was above 20%. Here, four F1 sets: F1_A, F1_C, F1_D and F1_E, were finalized for the GWAS analysis using high-quality SNPs.
The GWAS analysis was performed on filtered high-quality SNPs, using EMMAX software, by following an efficient mixed-model association-expedited model designation, as described by Kang et al. (2010), for which a threshold of p = 1.0 × 10⁻⁵ was used throughout. For the visualization of results, Manhattan and quantile–quantile plots were constructed in R using the package “qqman.” The peak SNPs with the highest p-value as well as their detection across multiple environments, were considered as key SNPs. For further confirmation, the favorable allelic variations of the key SNPs were identified for each trait variable (trait phenotype, SCA, and heterosis types). Box plots for the relative phenotypic values were drawn in R software. The HAPLOVIEW 4.2 software (Zhang and Endrizzi, 2015) was used to carry out the haploblock analysis. All genomic positions provided here are based on the G. hirsutum L. reference genome (v.1.1) (Zhang et al., 2015).
Gene ontology (GO) analysis was performed using the cotton functional genomics database3, to propose annotated putative candidate genes for each locus. For the transcriptome-based predictions, the gene expression database (TM-1) (Zhang et al., 2015) was used for the assessment of specific expression patterns of these nearby genes across various tissues: an organ or perhaps different growth and development stages of cotton viz. root, leaf, stem, torus, petal, stamen, pistil, and fiber (5 DPA to 25 DPA) and ovule (−3 DPA to 35 DPA). By applying the above-mentioned criteria within a 100-kb flanking window, candidate genes were thus selected. The differential expression patterns of these genes (i.e., those with expression level >1) were plotted in a heatmap.
Results
Phenotypic Characteristics Evaluation
The results shown in Figure 1 revealed variation among the different agronomic and fiber quality traits performance for F1s and parents. Upper and lower ends as shown in the vertical projections are assumed to represent highest to lowest data points (further details in Supplementary Table 3). Figure 2 shows the five types of studied heterosis related to fiber quality and agronomic traits performance, along with SCA among four sets of crosses (284 each). The averaged MP heterosis of each trait showed a positive trend with highest range occurring for BN (251.8) and the lowest for FU (11.3). A considerable range of variation was observed regarding these variables, thus providing sufficient ground for their further GWAS (Supplementary Table 3).
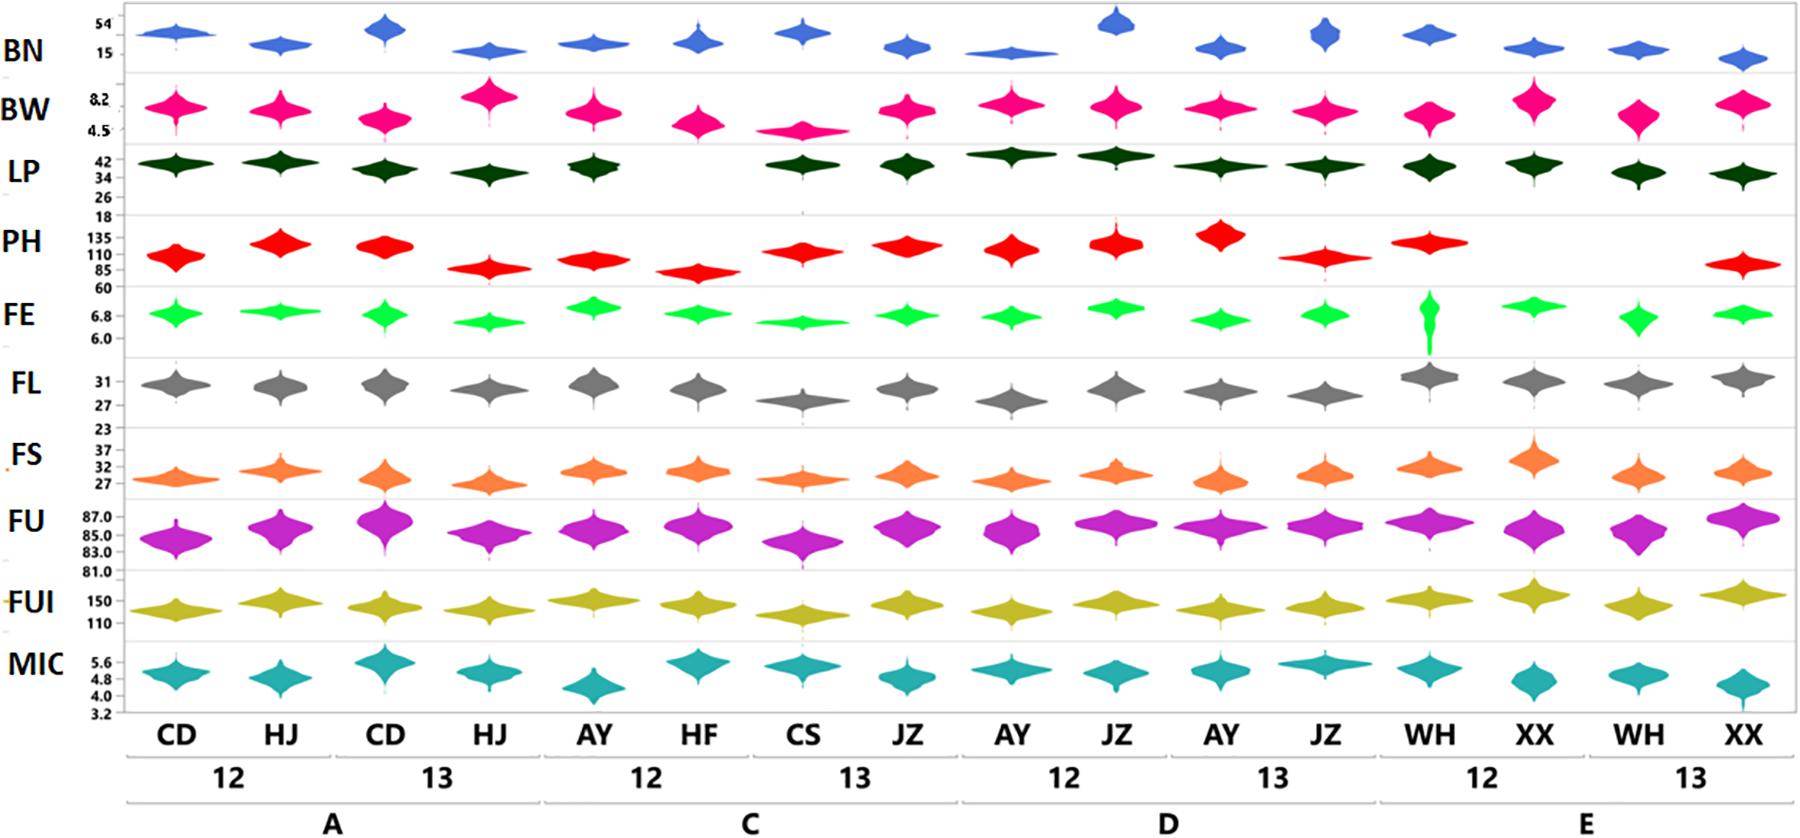
Figure 1. Violin plots based on phenotypic variation of ten agronomic and fiber quality traits of F1 hybrids (Yaxis) from four sets (SetA, SetC, SetD, and SetE) across multiple environments for two years; 2012 and 2013 (Xaxis). Legends on top right in different colors are representing ten evaluated phenotypic traits.
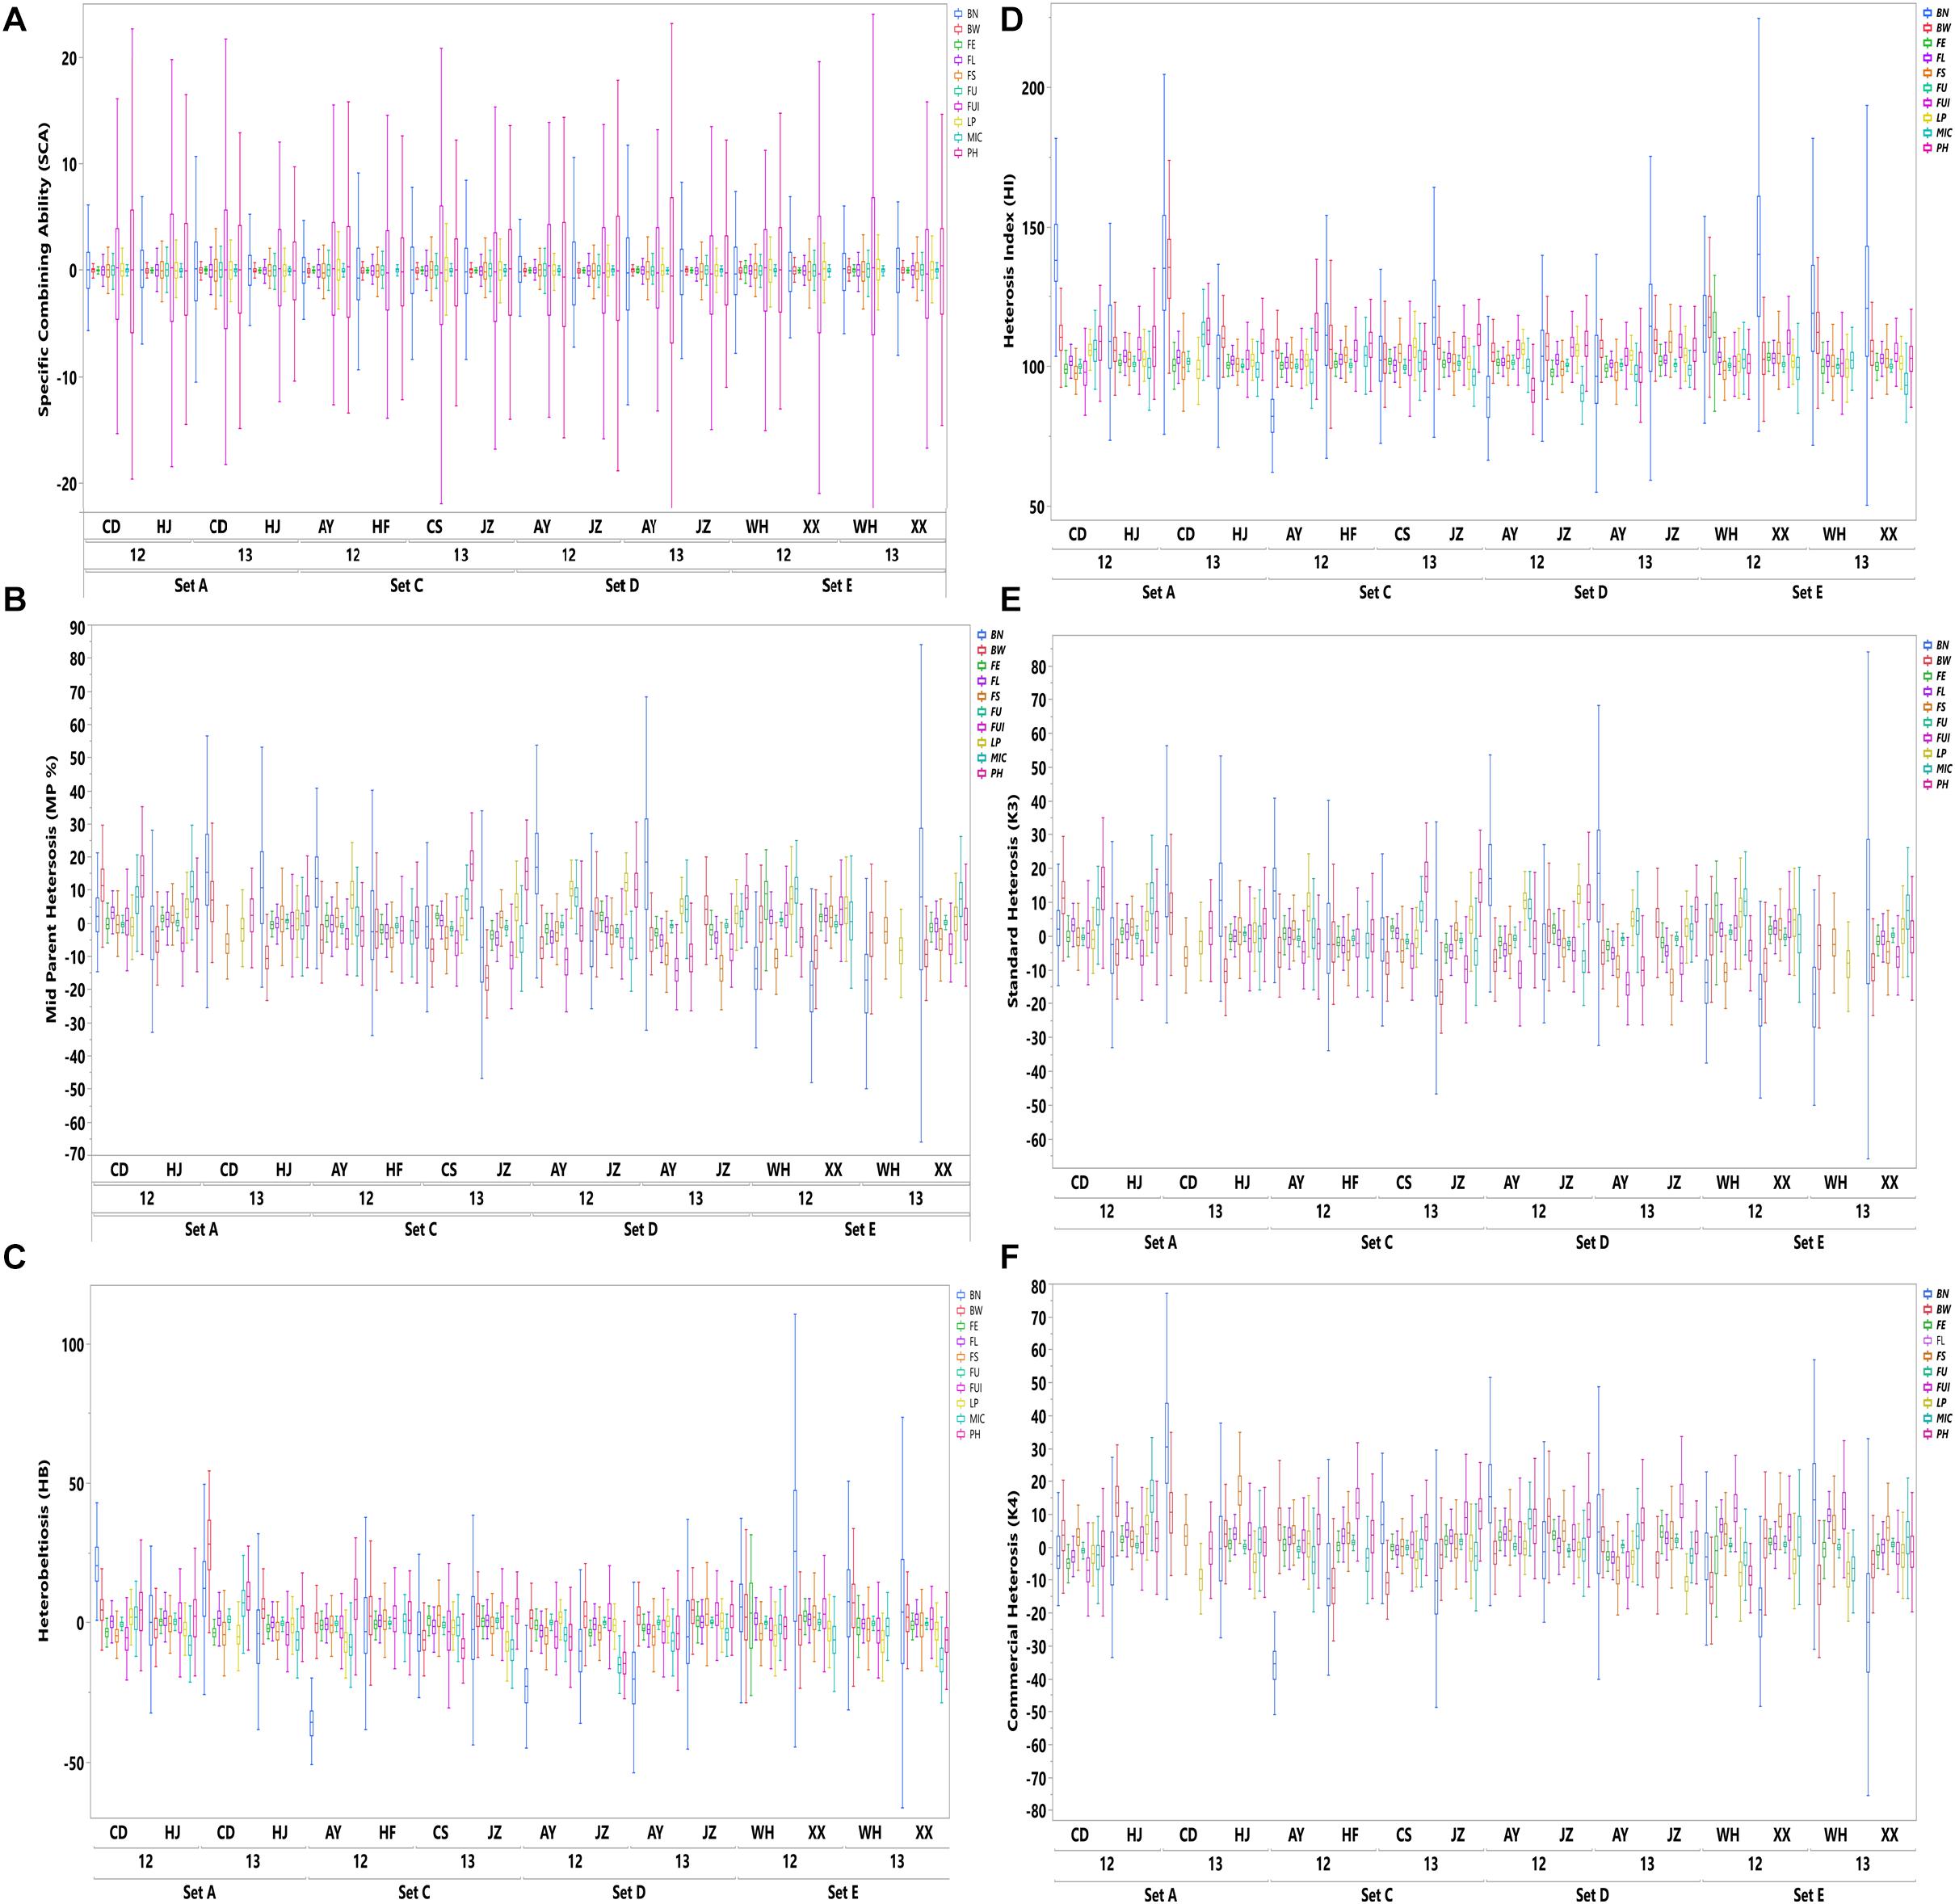
Figure 2. Distribution of SCA and five heterosis types (HB, MP, HI, K3, and K4) of agronomic and fiber quality traits among four F1 hybrid sets (SetA, SetC, SetD, and SetE) across multiple environments for years 2012 and 2013. Legends on the top right in different colors are depicting ten evaluated phenotypic traits.
Population Structure
Based on the fact that population structure increases the authenticity of identified SNPs, the number of subgroups that existed in the experimental accessions was critically estimated. The experimental accessions encompassed subgroups on the basis of their different geographic origins. The results from ADMXTURE software analysis of the experimental accessions could be divided into three divergent groups: Group I, II, and III with 86, 64, and 134 individuals, respectively (Figure 3). A genotypic principal component analysis (G-PCA) was performed in EIGENSOFT v. 6.0.1 software; this clearly displayed the top three eigen vectors: PC1, PC2, and PC3 (Figure 3). Both analyses clearly distinguished the accessions into three groups on the basis of which further GWA studies were implemented, with Q = 3.
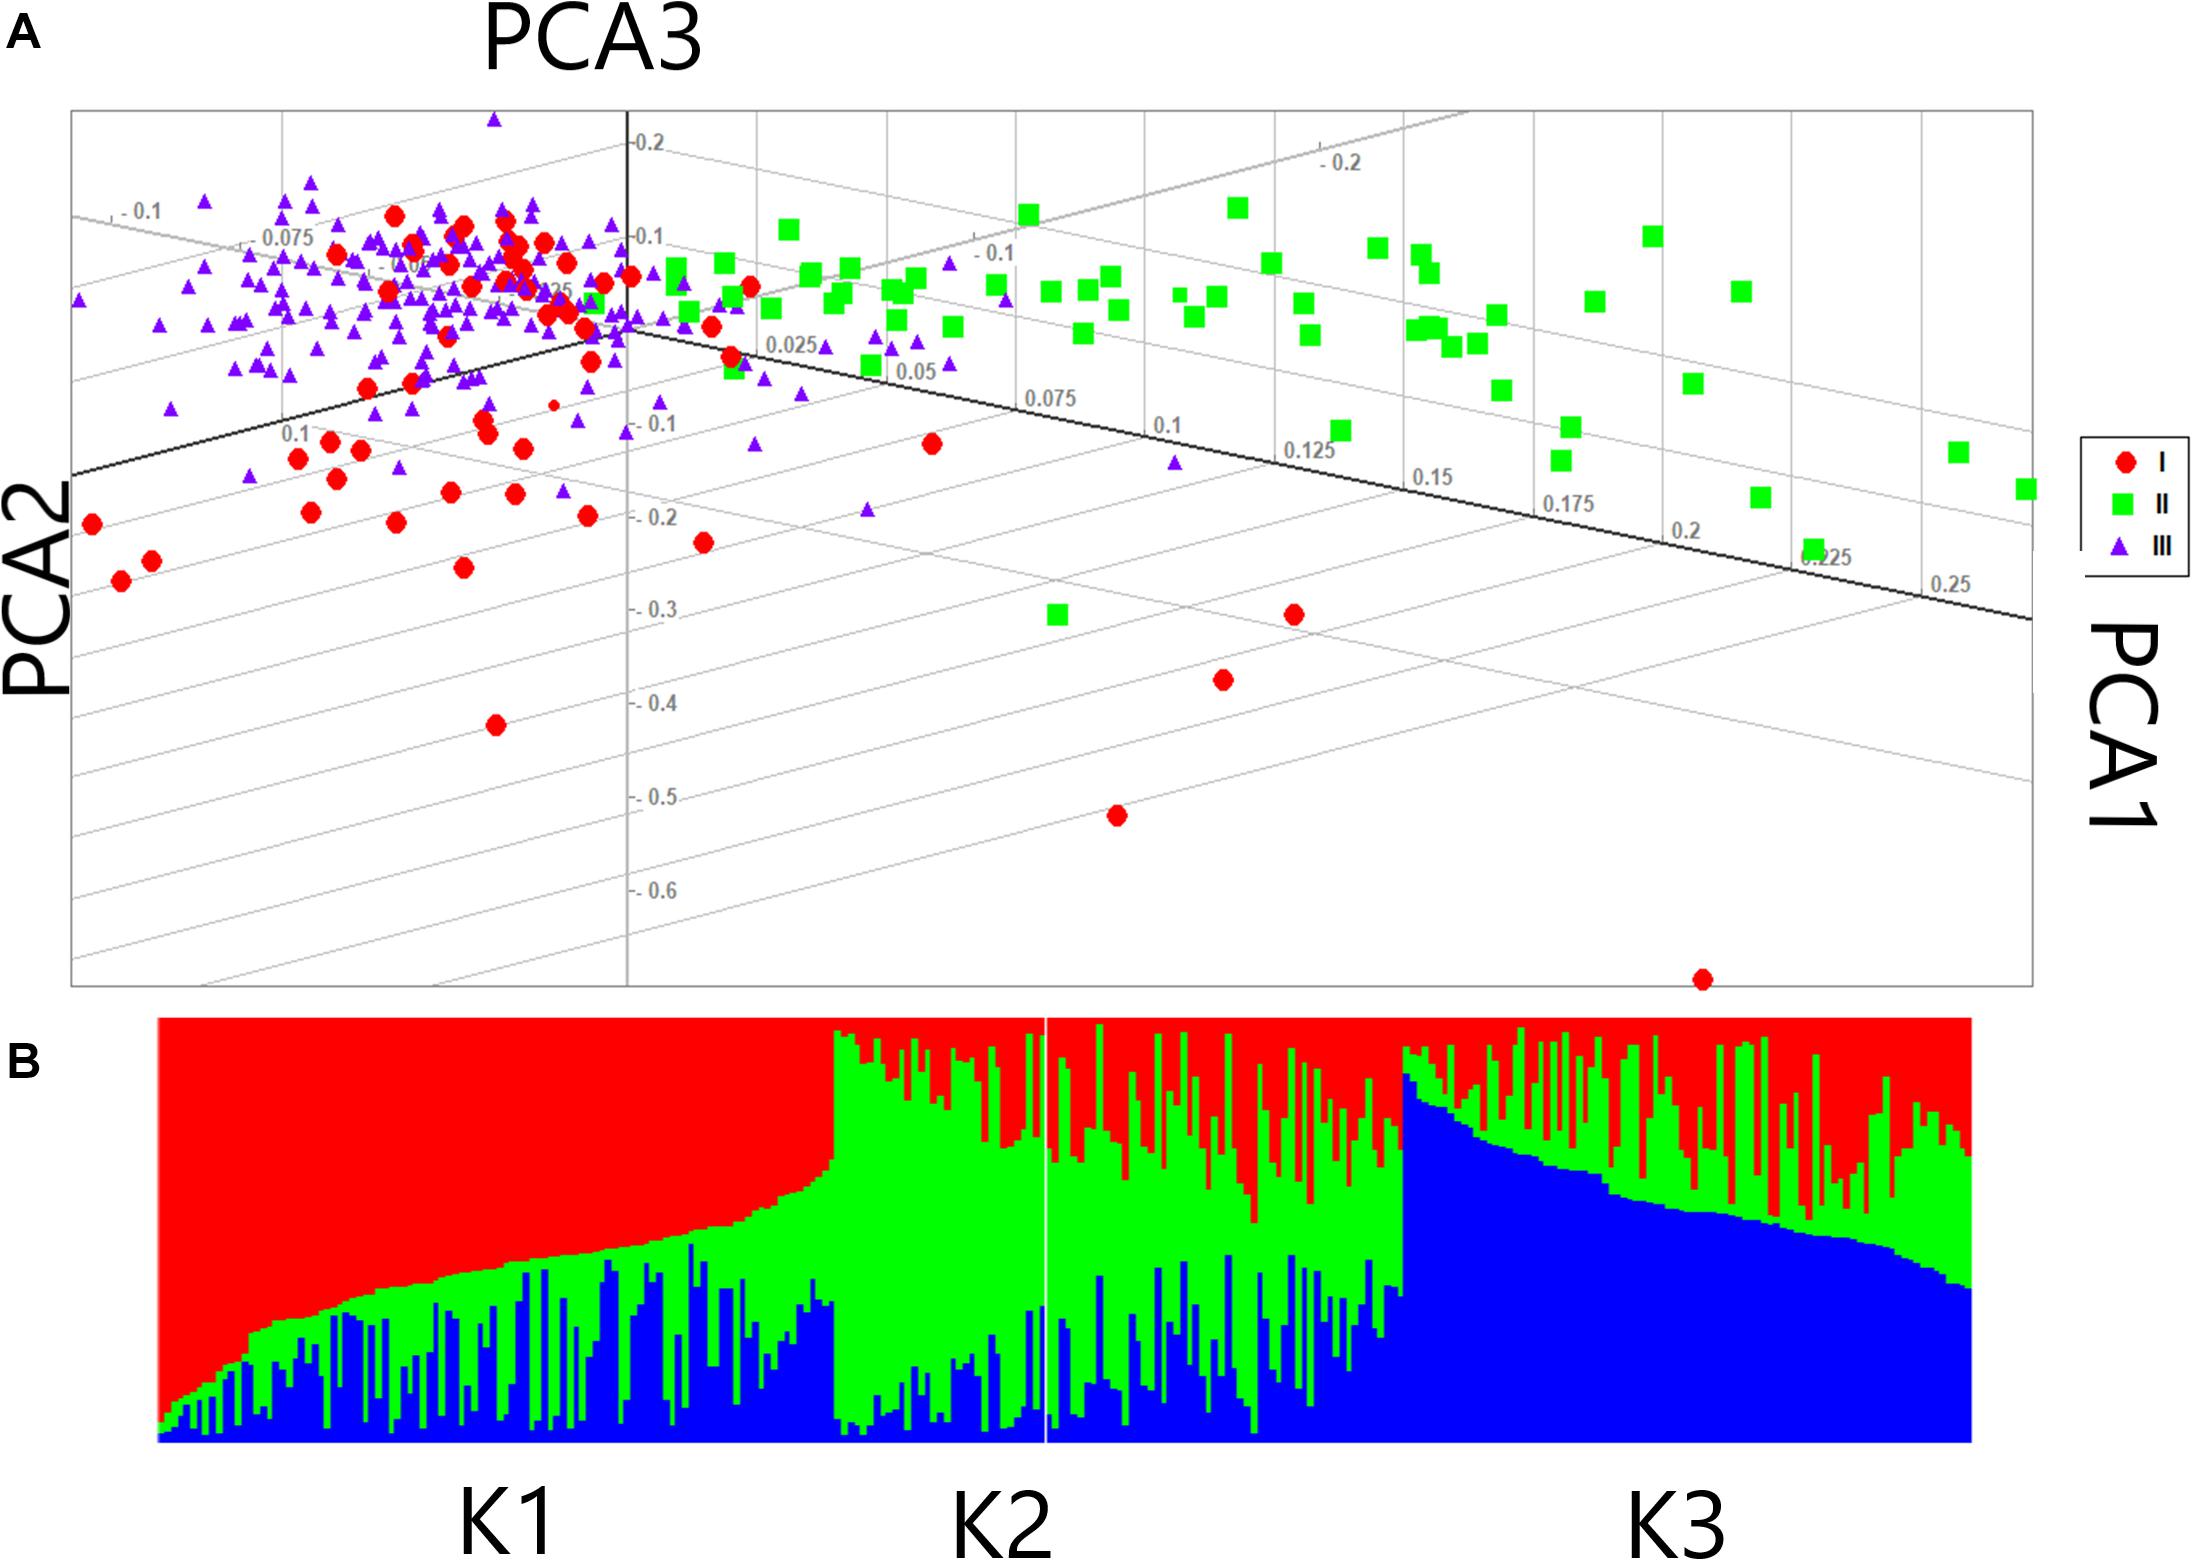
Figure 3. Population structure of 284 female parents in the association panel (A) Principal component analysis (PCA) of female lines (B) Population structure of 284 female parents (K = 3).
Genome Variation Based on the SNPs
Evidently these SNPs, which totaled 252,110 in number, were not evenly distributed across entire cotton genome (At: 151,104 and Dt: 101,006). The At sub-genome housed a greater number of SNPs associated with the fiber quality-related traits, while the Dt sub-genome harbored more SNPs for the agronomic traits. The At08 chromosome had the most SNPs (20,960), whereas the At04 chromosome had the least (4,726) (Supplementary Table 4). All these SNPs were utilized for the GWAS of female parents, amounting to 35,769 high quality SNPs for the four sets of F1s, as follows: 18,391 SNPs for F1_A, 7458 SNPs for F1_C, 23,128 SNPs for F1_D and 17,692 SNPs for F1_E (Figures 4A–E). On chromosome At08, maximum number of associated SNPs were found i.e., 113, while the minimum number of associated SNPs was estimated to be 16, on chromosome Dt04 (Supplementary Table 5).
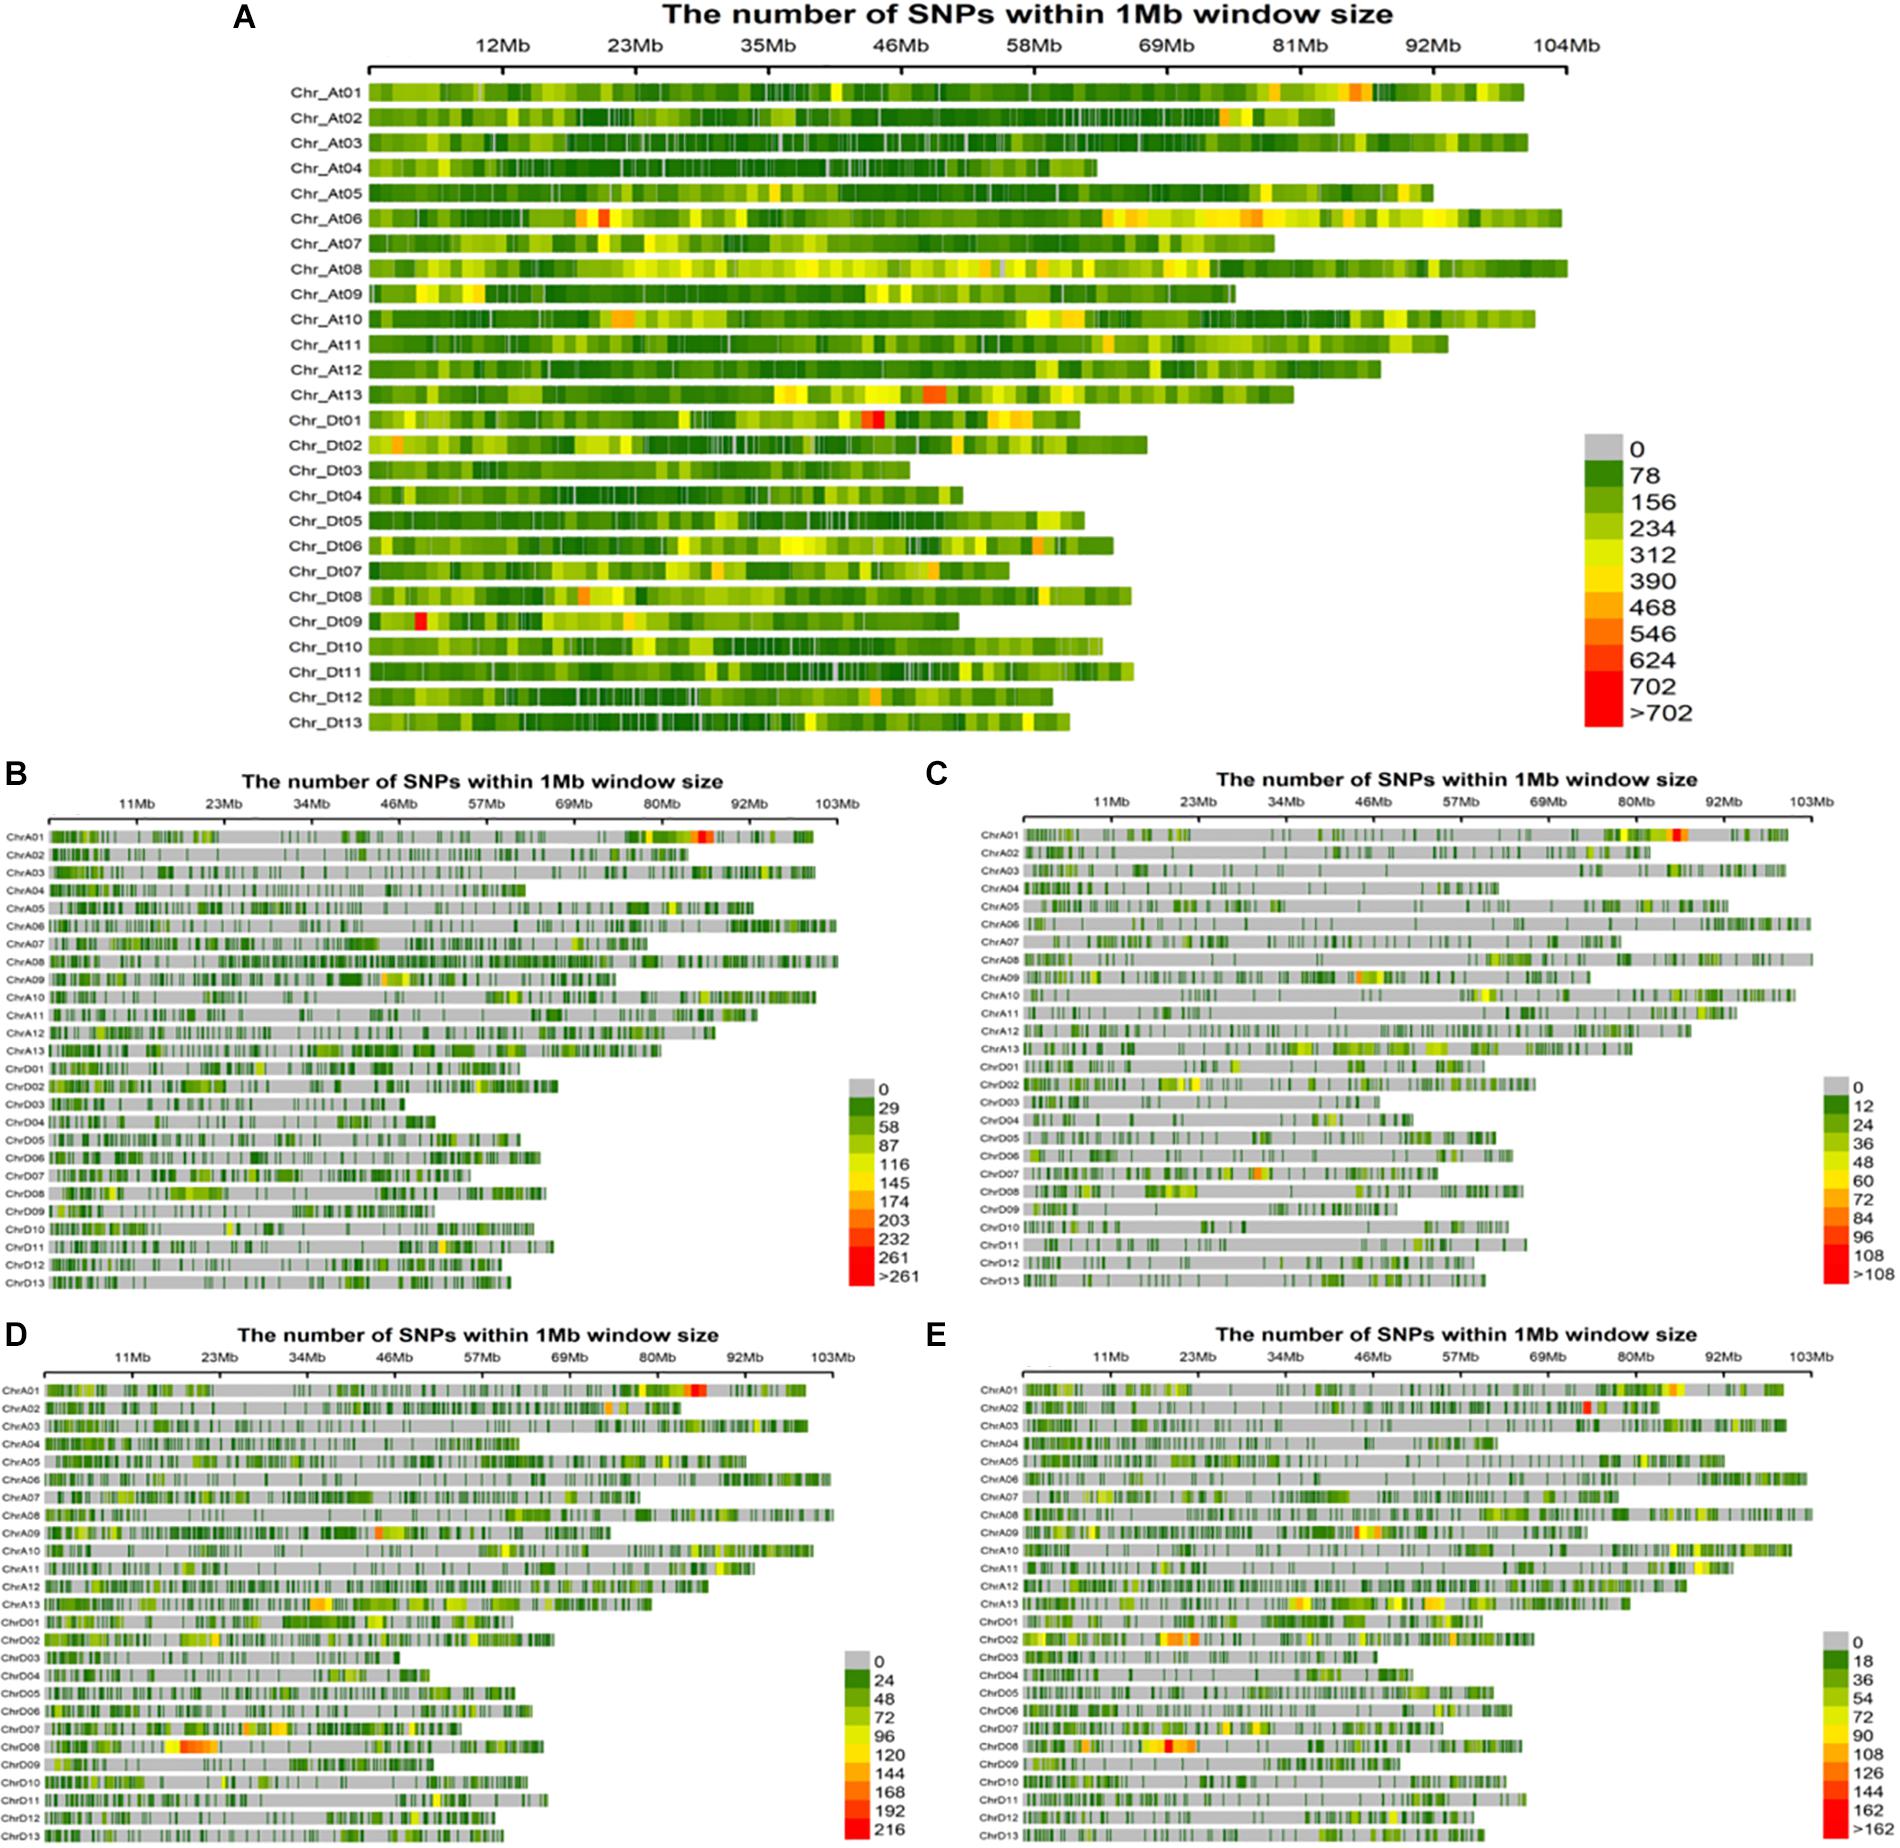
Figure 4. Single nucleotide polymorphism (SNP) distributions on 26 chromosomes of (A) parents, (B) F1_A, (C) F1_C, (D) F1_D, and (E) F1_E. At1∼At13 and Dt1∼Dt13 in vertical axis are the serial number of 26 chromosomes; the horizontal axis shows chromosome length (Mb); = 0 ∼>702 depicts SNP density (the number of SNPs per window).
SNPs’ Associations in F1 Sets and Heterosis Types
A total of 1,192 significant SNPs revealed 2,847 significant associations (−log10 (p) ≥ 4) with the 10 studied traits of the cotton parents and 4 F1 sets (Figure 5). The maximum number of associations was discovered for BW (441) and the minimum for FU (185). However, FE ranked highest in terms of number of associated SNPs, with 181, this being lowest for FU with 92 (Figure 6A and Supplementary Table 6). Collectively, 236, 264, 368 and 268 SNPs were revealed by F1_A, F1_C, F1_D, and F1_E sets, respectively. Furthermore, we discovered six SNPs shared in common by these three sets: F1_C, F1_D, and F1_E. Seven common SNPs were found between the F1_A and F1_C sets, 14 SNPs were commonly shared by F1_A and F1_D sets, and 10 SNPs were commonly shared between the F1_A and F1_E sets. Similarly, 10 SNPs were observed in common between the F1_C and F1_D sets, four in the F1_C and F1_E sets, and five in the F1_D and F1_E sets (Figure 6B and Supplementary Table 7). However, 476 SNPs/hQTNs were found associated with the five evaluated types of heterosis. Of those, 199, 148, and 95 SNPs/hQTNs of heterosis types were also commonly shared by SCA, F1 sets and both SCA and F1 sets, respectively (Figure 6C and Supplementary Table 8). Likewise, the numbers of significant pleiotropic SNPs related to agronomic and fiber quality traits were tallied to gain insight into pleiotropy. Those details are presented in Figure 7 and Supplementary Table 9.
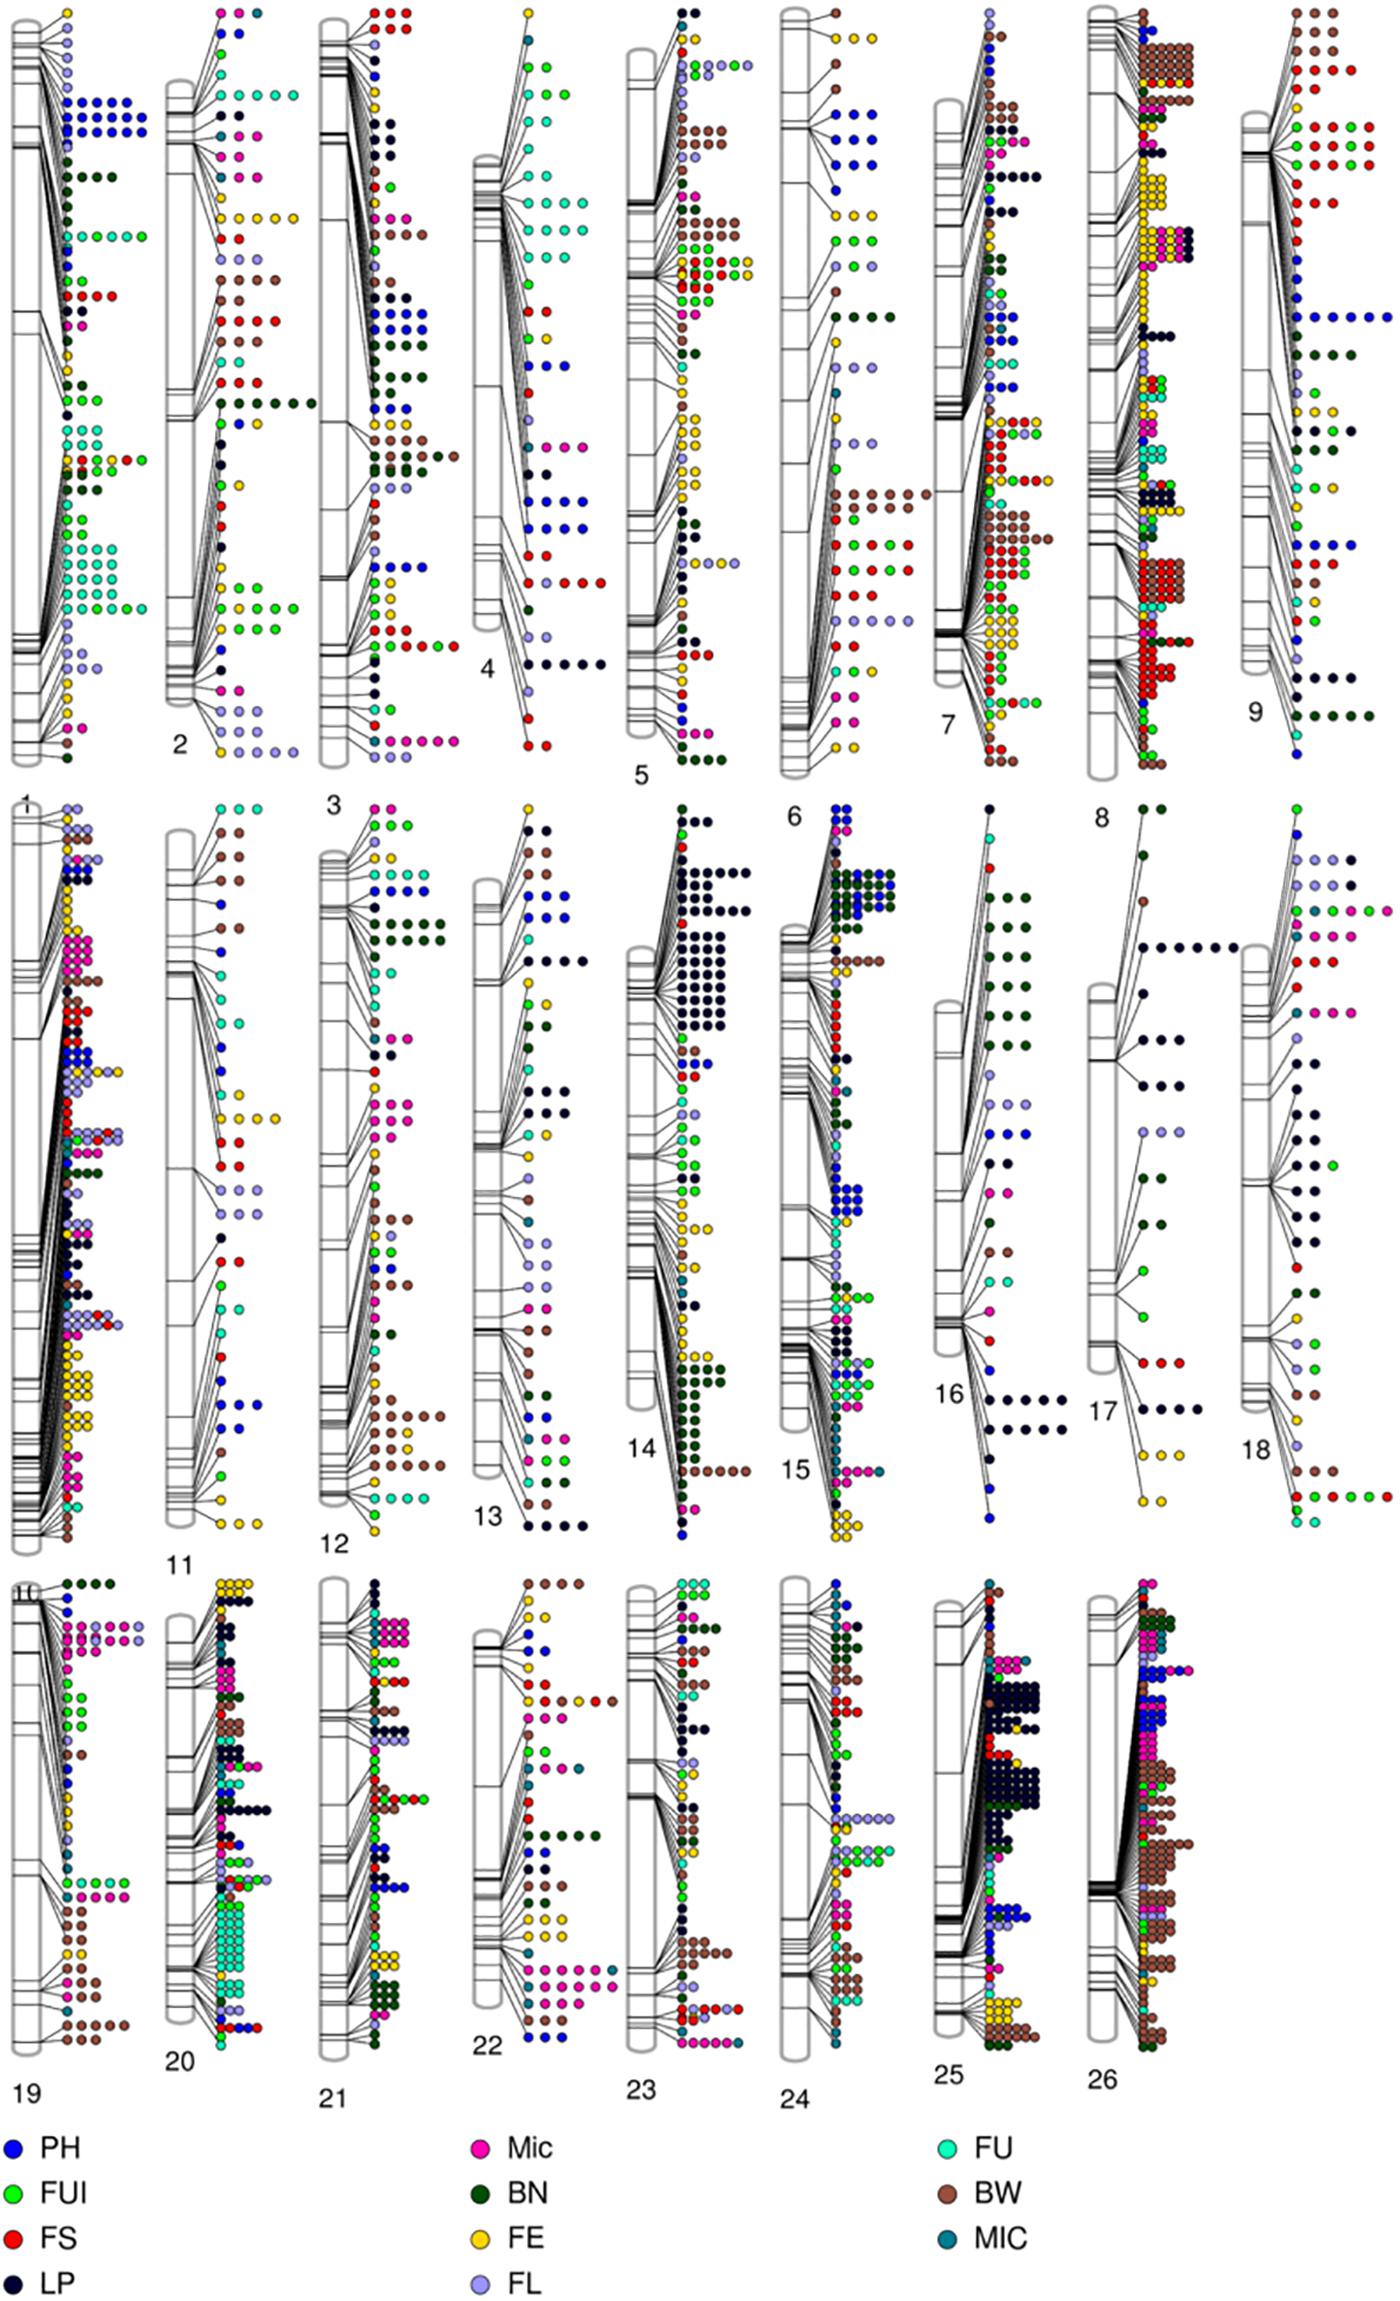
Figure 5. Phenogram displaying the 2847 significant (–log (p) ≥ 4) associations among phenotypic traits and 1348 significant SNPs residing on 26 chromosomes of upland cotton.
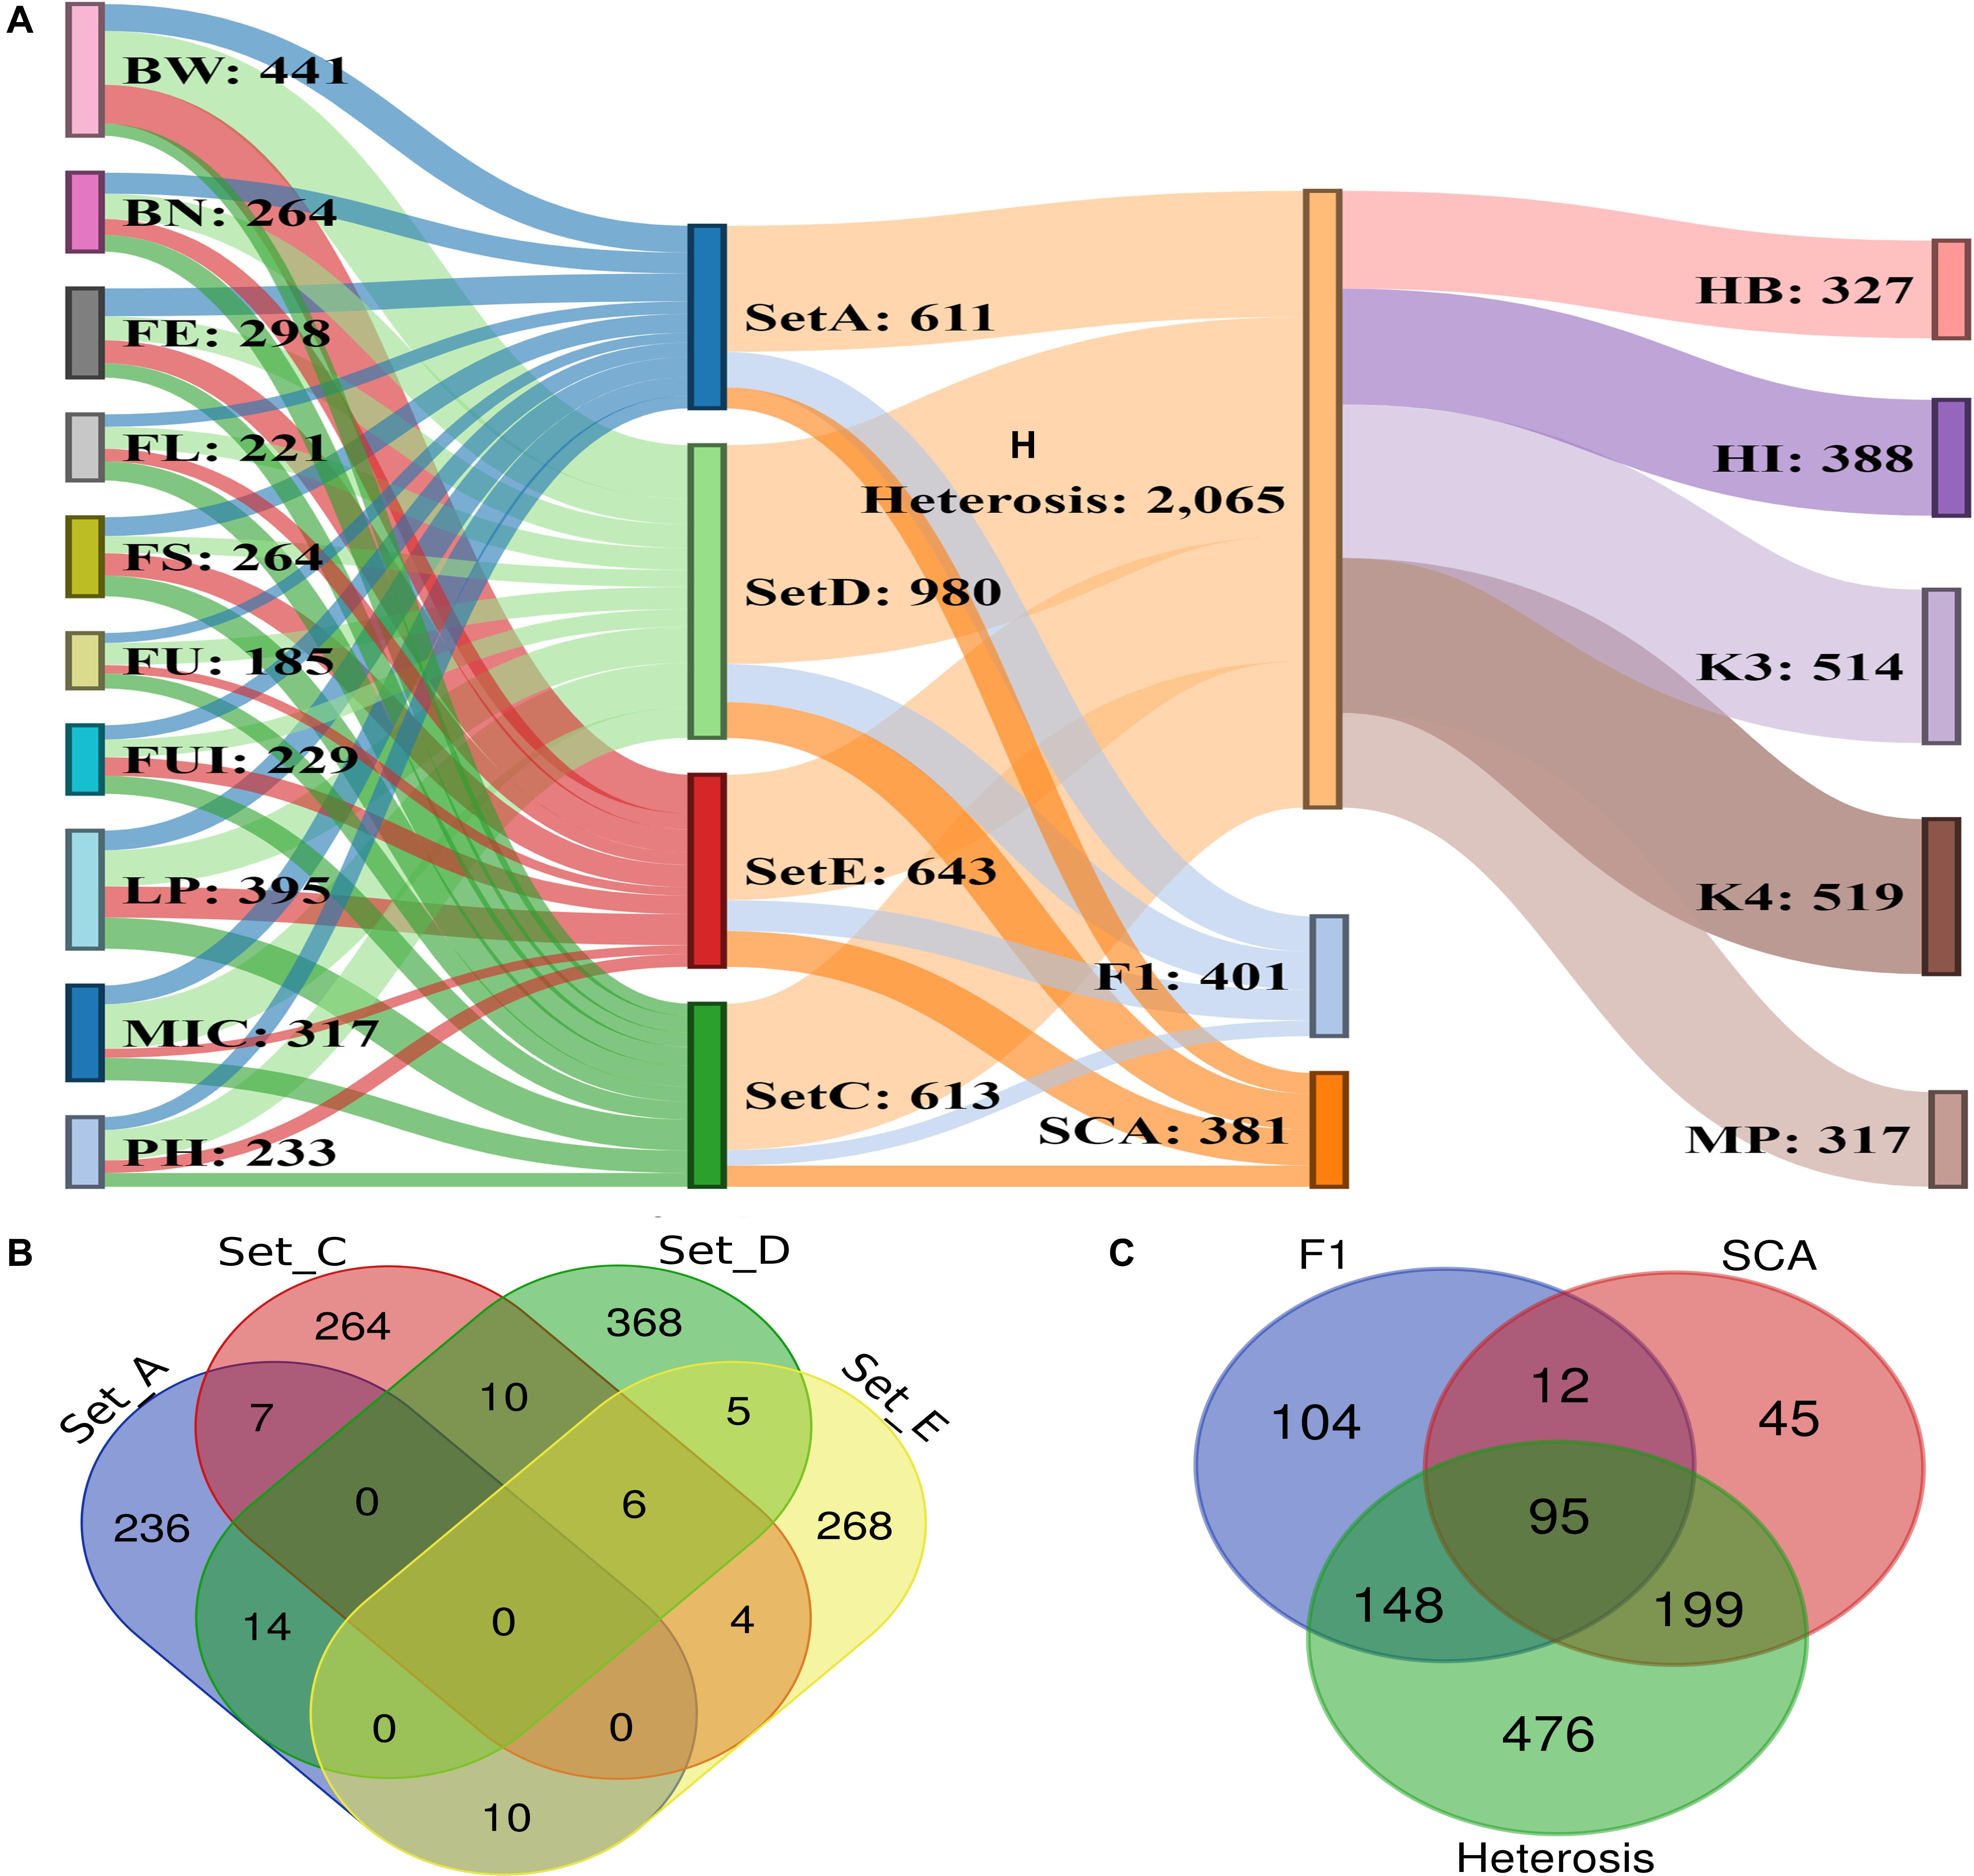
Figure 6. Summary of significant association signals and significant SNPs. (A) Representation of significant associations among 10 phenotypic traits, four F1 sets, five heterosis types, SCA and significant SNPs (B) details of significant SNPs commonly associated across four different sets of F1 hybrids (C) number of significant SNPs/hQTNs associated with heterosis types, SCA and F1 sets.
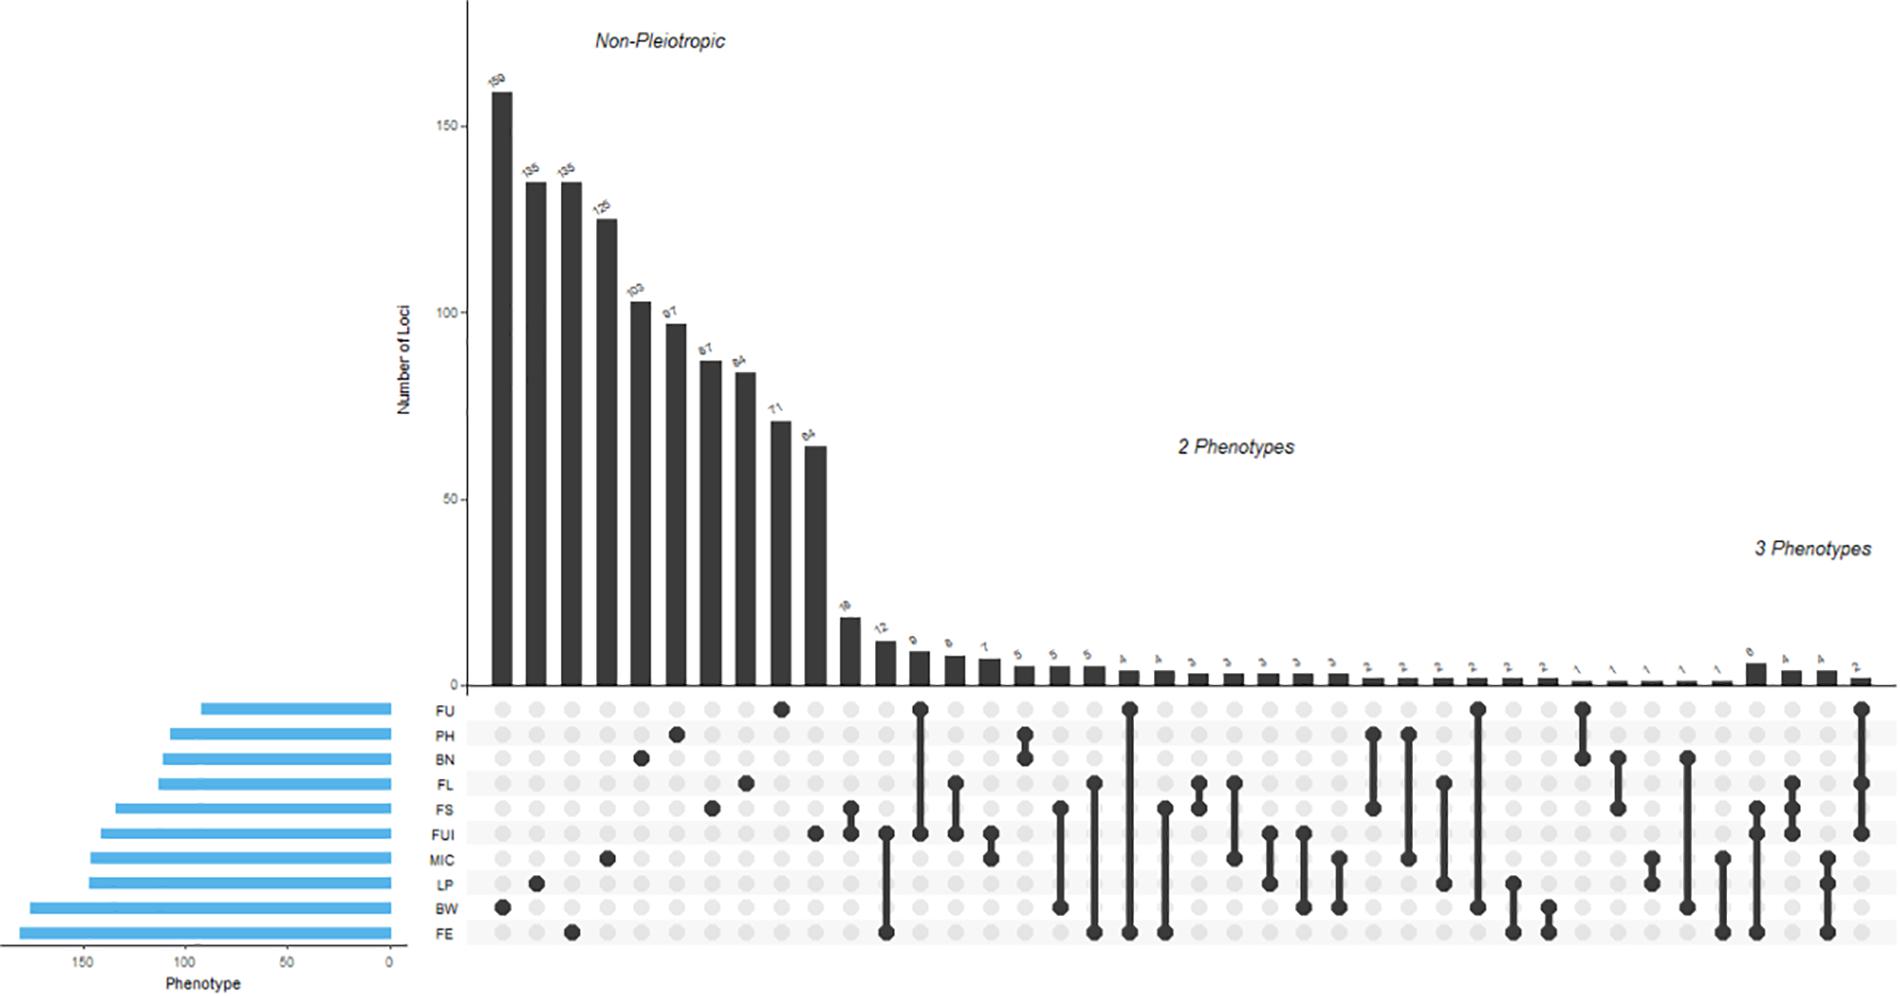
Figure 7. Depicted here are results from the multivariate analysis of pleiotropy. For each associated SNP, the method returns the best-fitting solution of which phenotypes were associated with that SNP. All SNPs with one or more associated phenotypes are shown here. For example, every SNP associated with FE was found to be pleiotropic for other phenotypes. The total number of pleiotropic as well as unique associated SNPs for each trait from these analyses were 181 (FE), 176 (BW), 147 (LP), 146 (MIC), 141 (FUI), 134 (FS), 113 (FL), 111 (BN), 107 (PH), and 92 (FU).
Mining of Associated Key SNPs
A total of 298 significant (−log10 (p) > 4) key SNPs/QTNs were identified, based on the highest p-value, presence in multiple environments and function i.e., boxplots and haploblock analysis (Supplementary Table 10). Figure 8 summarizes the results for the simultaneous identification of key SNPs/QTNs in different F1 sets. Of 298 significant key SNPs/QTNs, 271 heterotic SNPs/hQTNs were related specifically to the heterosis evaluated in this study (Supplementary Table 11). The F1_D set contributed the highest number of key SNPs/hQTNs, with 87, followed by F1_E set with 77 SNPs/hQTNs, the F1_A with 59 SNPs/hQTNs and the F1_C with 56 SNPs/hQTNs (Supplementary Table 12). A total of 19 highly stable hQTNs were detected on the basis of their simultaneous contribution by multiple paternal sources and their detection of association signals in multiple environments (Supplementary Table 13). Further investigations revealed that 8, 4, 4, 2, and 1 stable hQTNs were associated with LP, BW, FS, FL, and MIC, respectively. These hQTNs were further validated by functional analysis using genotype–phenotype interaction, SNP–SNP interaction, and gene expression.
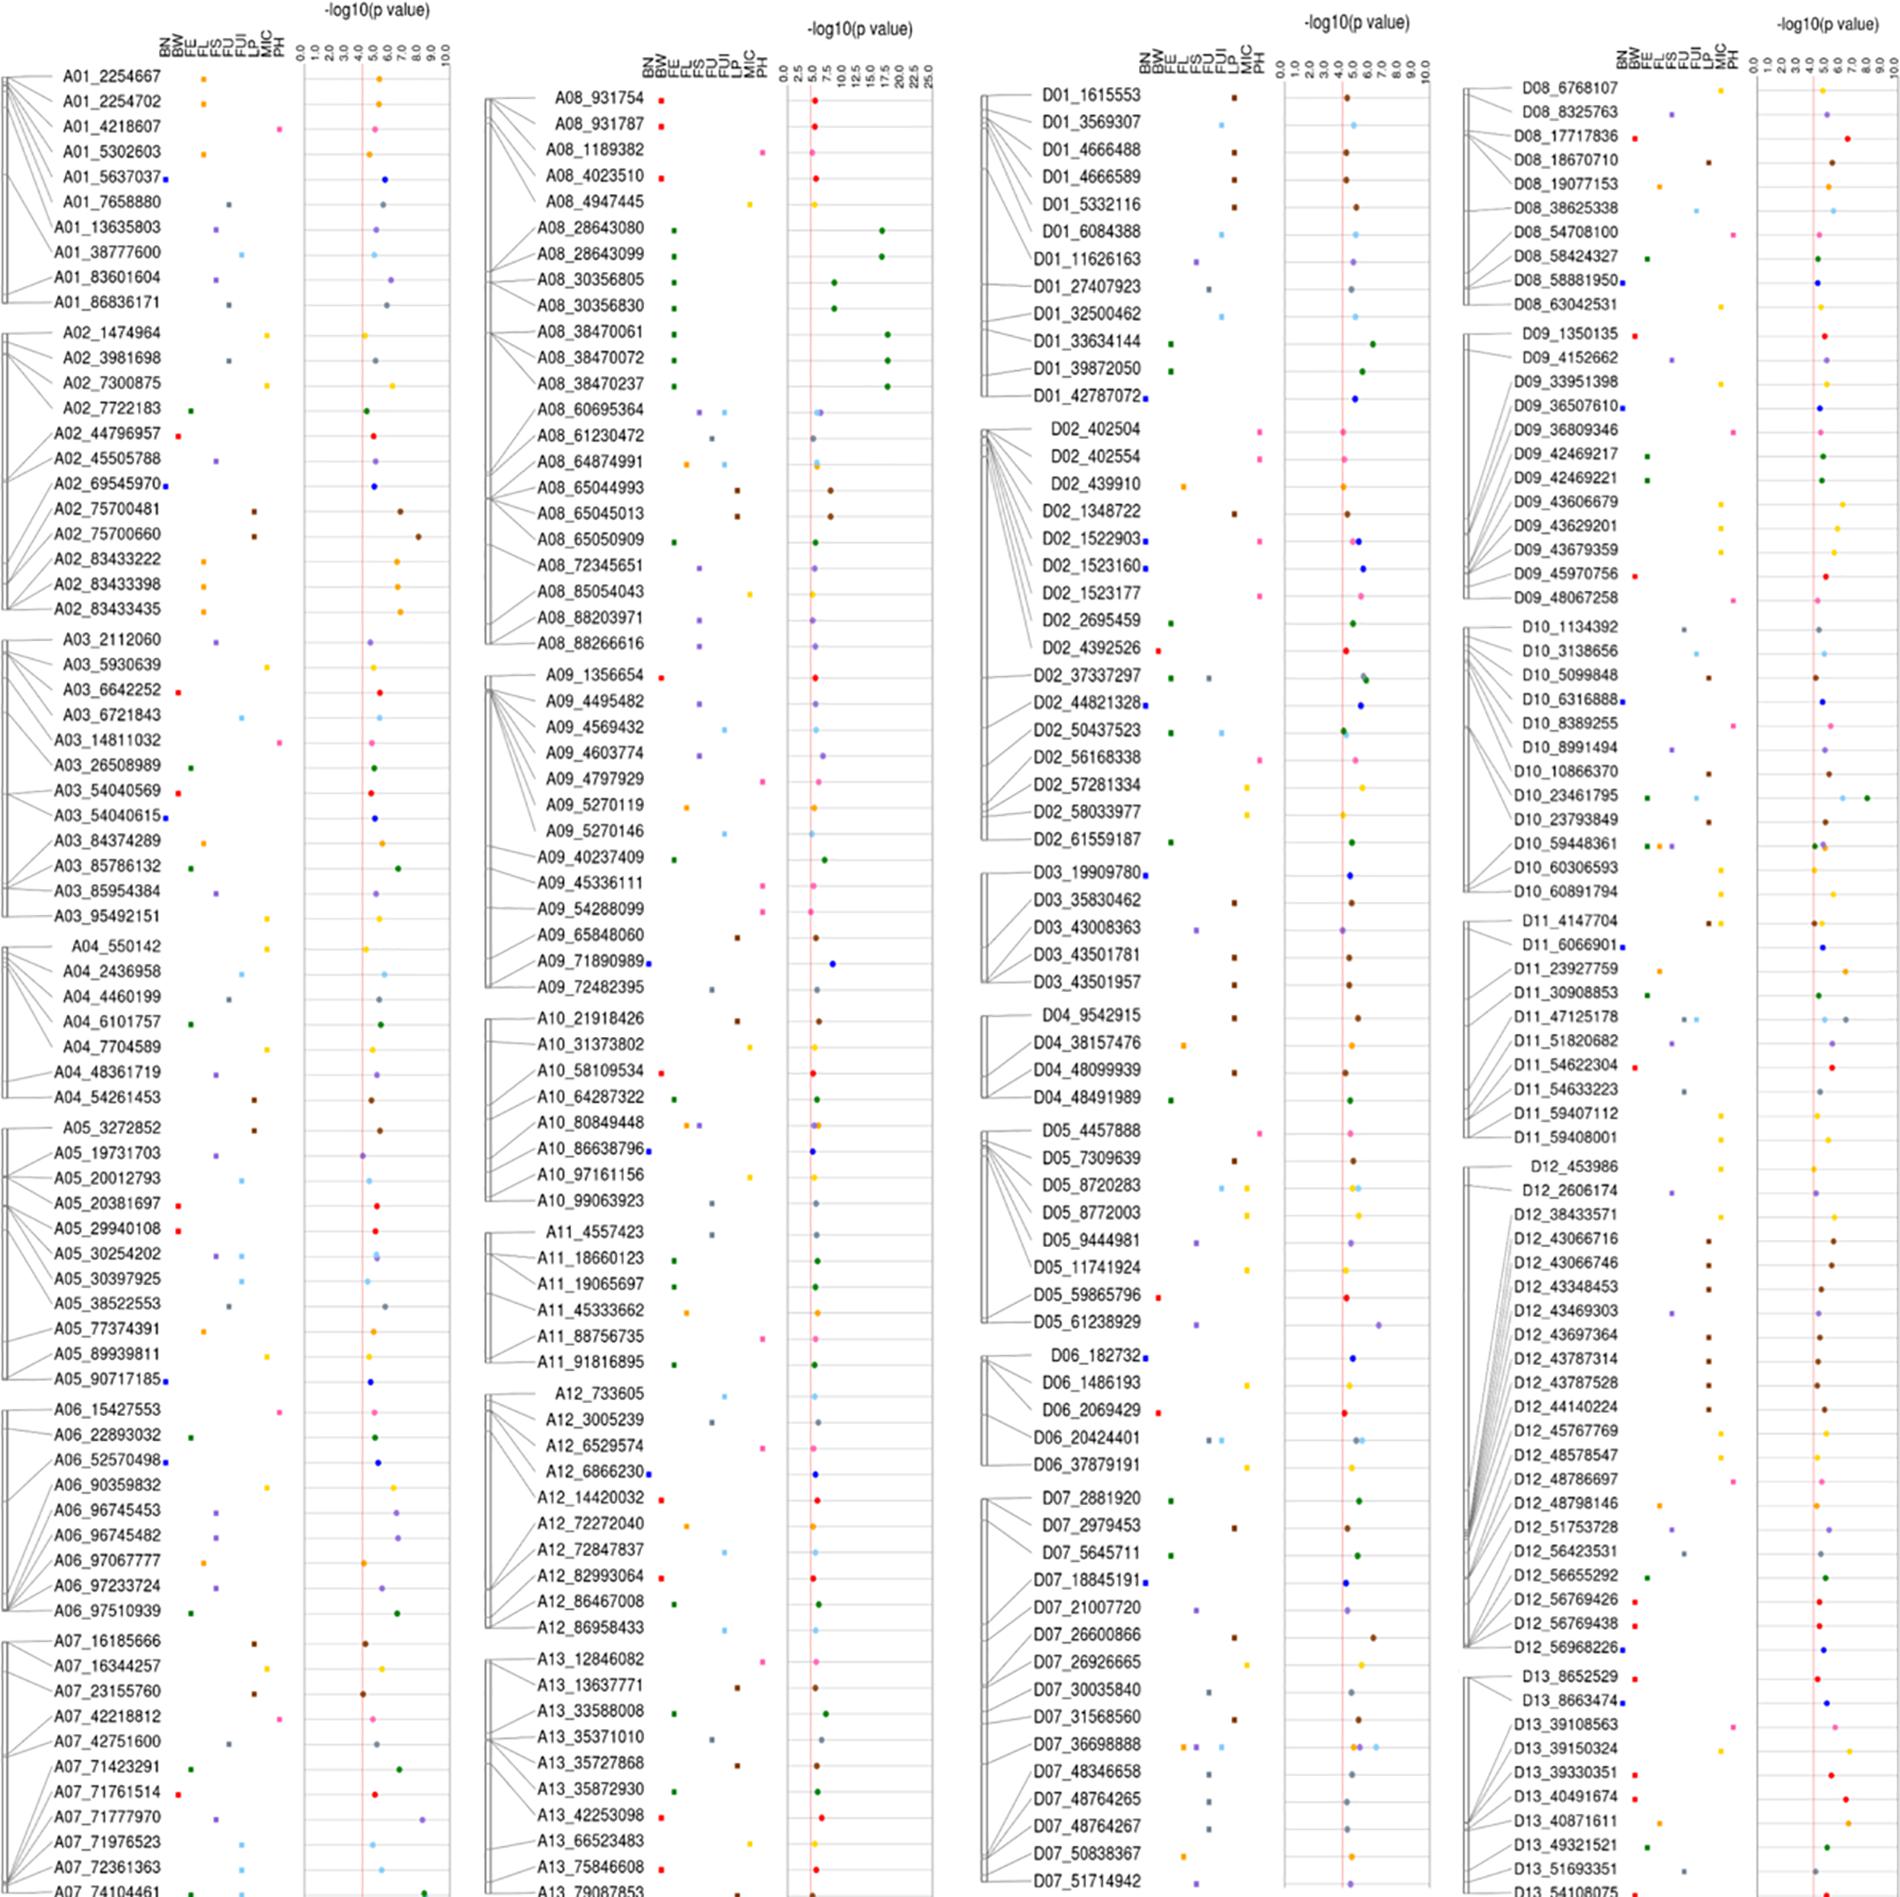
Figure 8. Detailed view of significant SNPs related to five types of heterosis, F1, SCA and studied traits on 26 chromosomes with their physical positions (bp).
Identification of Candidate Genes and Their Annotation
We conducted an exploration of nearby genes (i.e., 100-kb flanking window) of 298 QTNs on the basis of genes’ annotation with reference to TM-1 genome of G. hirsutum (Zhang et al., 2015). Overall, 275 genes (At: 128, Dt: 147) were identified for further scrutiny (Supplementary Table 11). Based on the transcriptome analysis, a heatmap of the differential expression of genes in various tissues and growth stages was plotted (Figure 9). These genes were assumed exert effects on related traits; for instance, a gene differentially expressed across fiber during the different DPA would be involved in determining agronomic quality as well as fiber quality. The GO analysis was performed using cotton functional genomics database (see text footnote 3) to annotate the putative candidate genes with biological processes, cellular components, and molecular functions (Table 1). The GO analysis revealed that those candidate genes with known functions were involved in different catalytic activities, metabolic pathways, and transcription factors. In all, 271 hQTNs were found in close vicinity of 275 candidate genes, including Gh_D02G0165 which had two hQTNs associated with BN and PH; Gh_D12G1396 and Gh_A021302 each harboring two hQTNs and all four of them associated with LP; the rest of the traits were found associated with one hQTN each. The maximum number of associations between genes and traits were detected for LP, at 16, followed by MIC and FUI with 12 and 10 associations, respectively (Table 1). Of 64 putative candidate genes, 54 were considered as potential candidate genes related to the heterosis of the studied traits. Figure 10 shows the GWAS summary of the MIC-associated hQTN, hqMICD09_43629201_C, found on chromosome D09 that was contributed by the male parent A971Bt. This hQTN was found in association with all the types of heterosis as well as trait phenotypes, and it was expressed in cotton’s fiber, ovule, and different plant tissues.
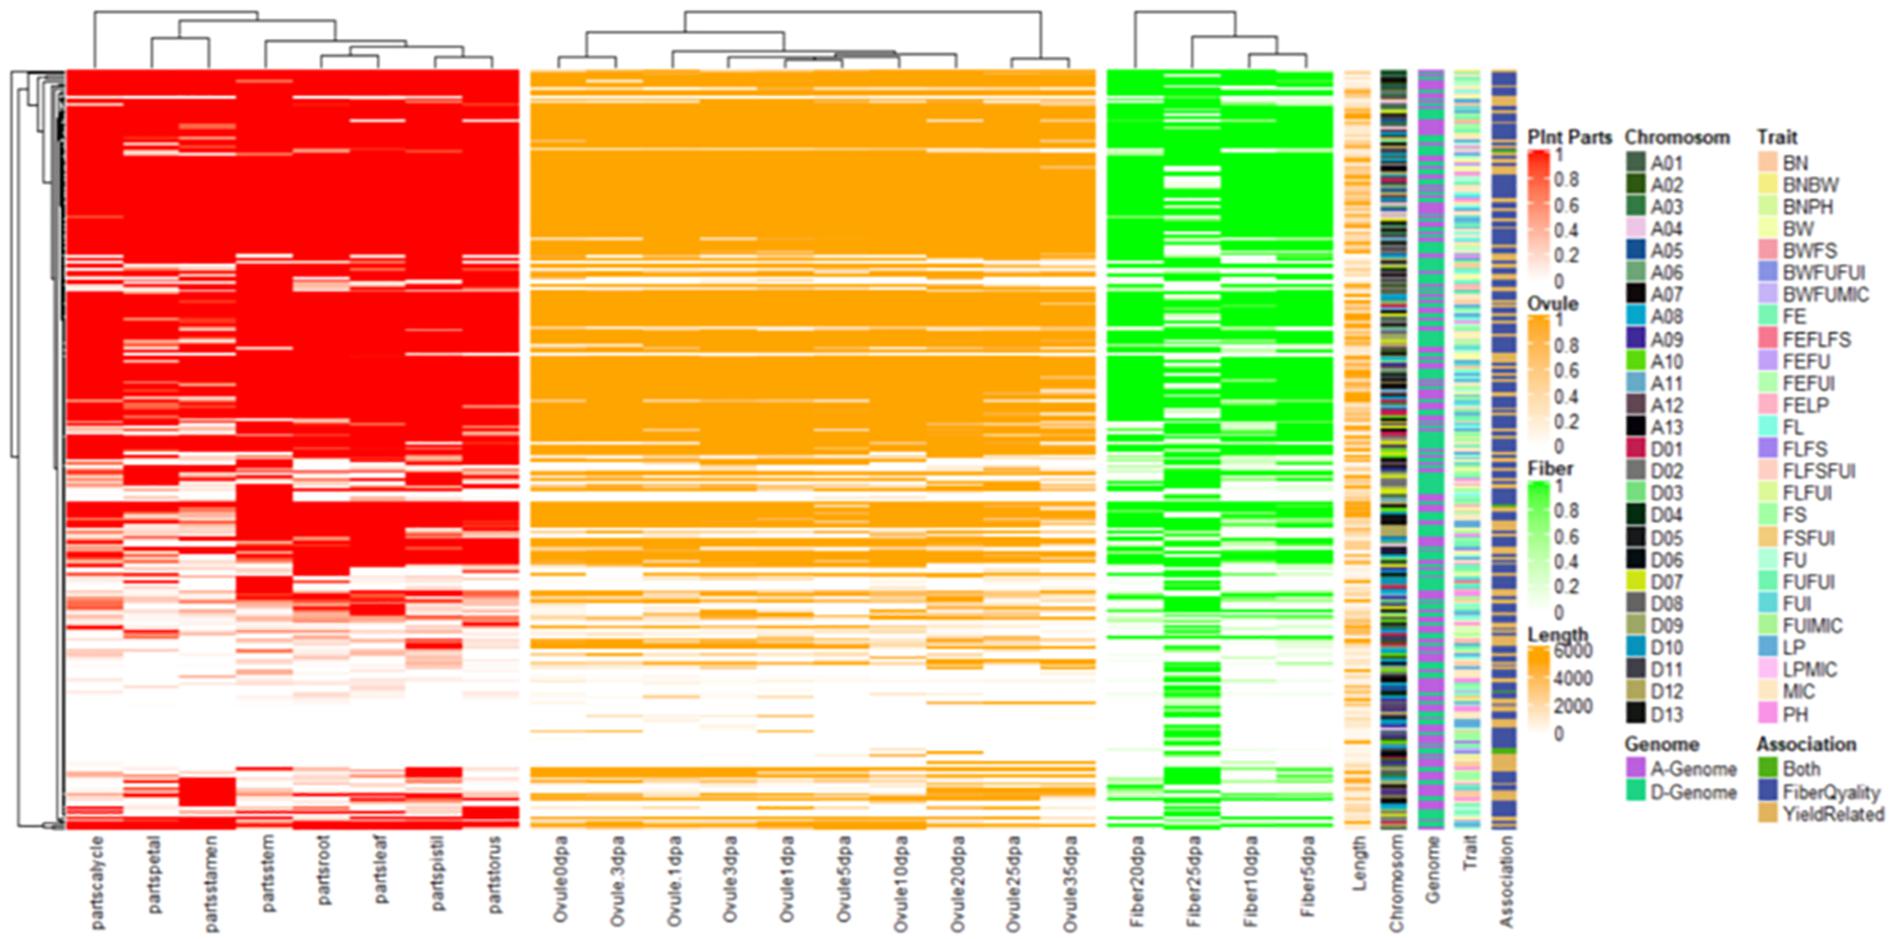
Figure 9. Heat map for expression patterns of the 275 genes nearby significant keys SNPs/QTNs associated with studied agronomic and fiber quality traits. Shaded portion is representing expression >1 while white portion is representing <1.
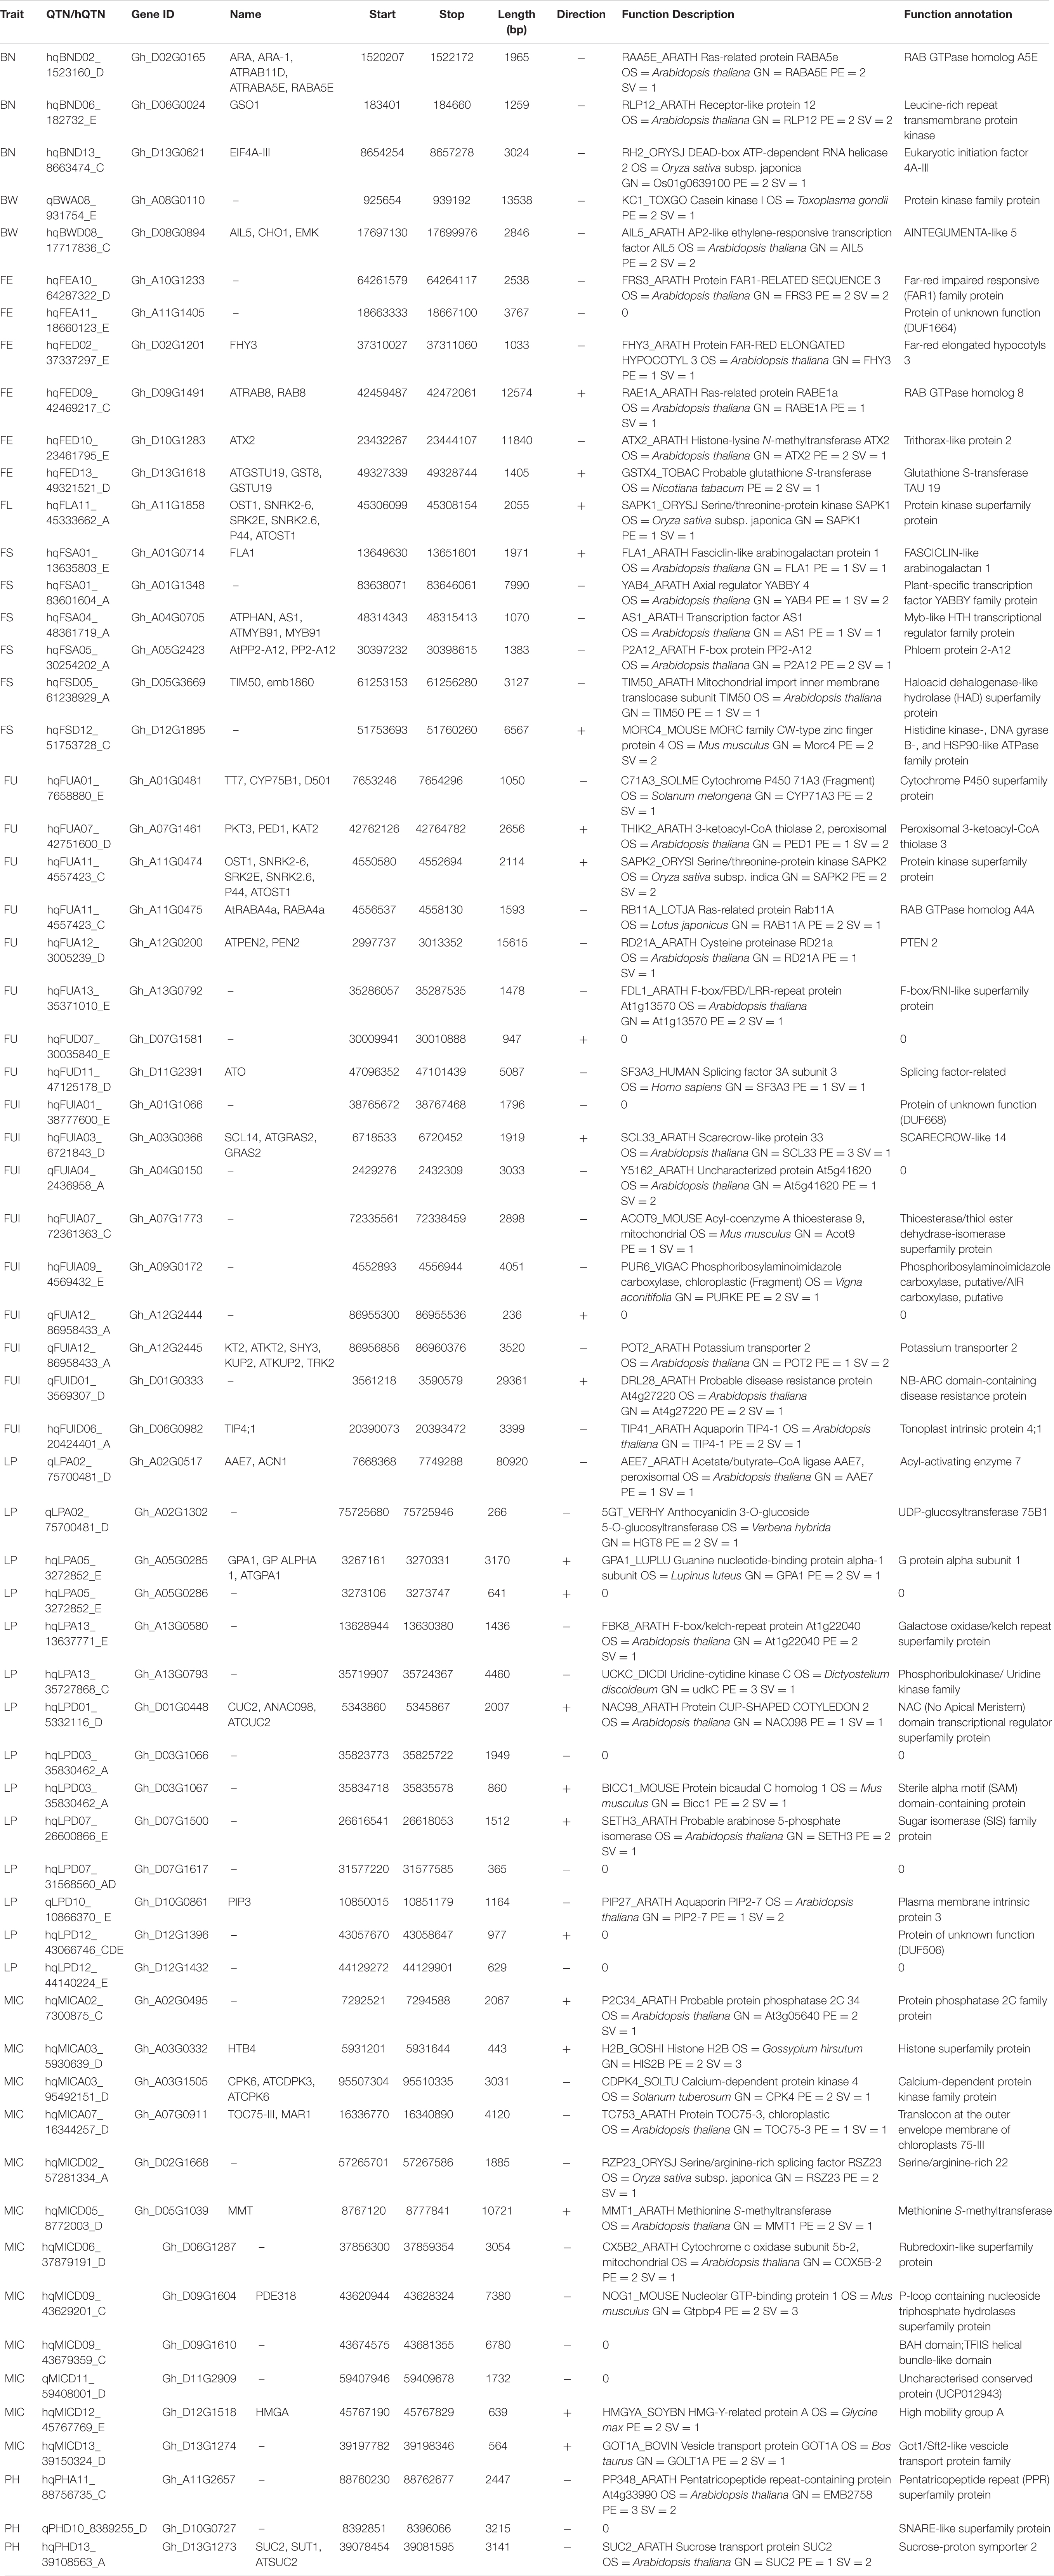
Table 1. List of 64 candidate genes related to fiber quality and yield related traits with their details about biological function (GO items) annotations.
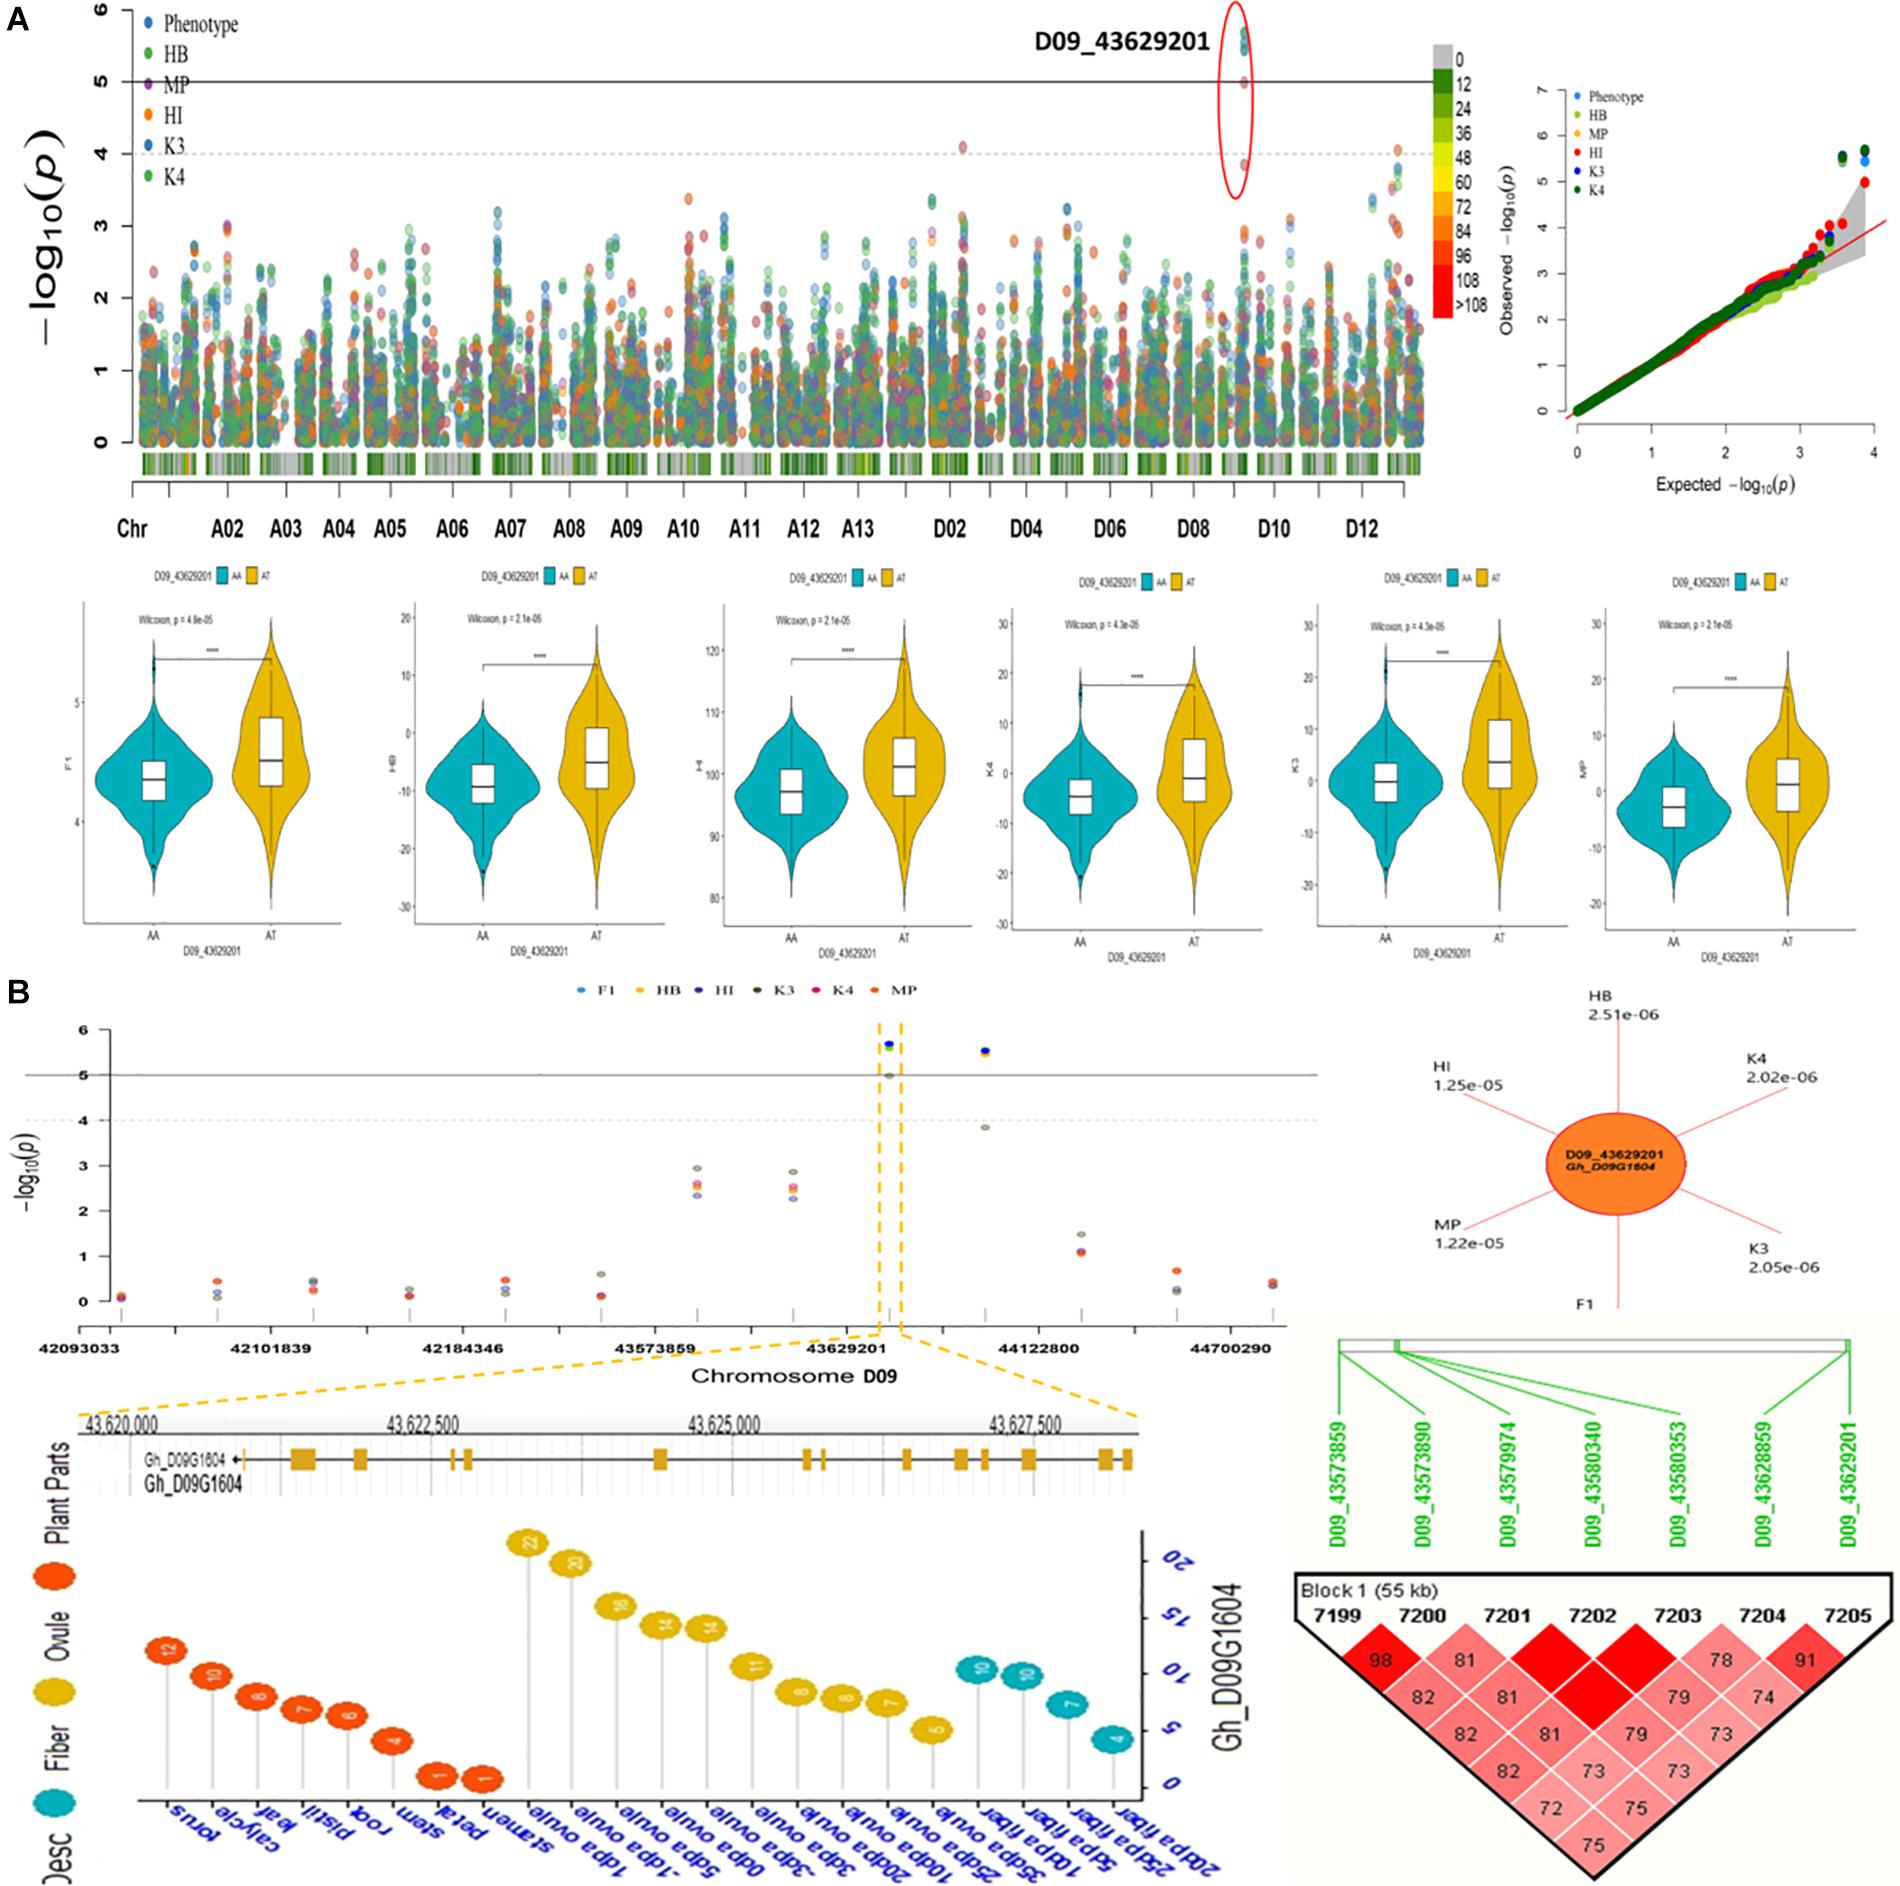
Figure 10. (A) Summary of GWAS results for Fiber micronaire (MIC) including Manhattan plots, QQ plots, violin plots displaying differences for MIC among two haplotypes of SNP/hQTN D09_43629201 in trait phenotype and five heterosis types. (B) Regional Manhattan plots showing presence of hQTN D09_43629201 in trait phenotype and five types of heterosis further narrowing down to genomic location of gene hqMICD09_43629201_C on chromosome D09, sun plot displaying the p-values of variables harboring hqMICD09_43629201_C and gene Gh_D09G1604, Expression levels of representative gene associated with MIC during different growth stages and Haplotype region (55 kb) surrounding the peak on chromosome D09 associated with MIC.
Discussion
In conventional plant breeding, a huge number of hybrid crosses are screened to glean genotypes exhibiting ideal performance traits. However, only a few tested hybrid crosses are considered worthwhile for use as hybrid varieties. Once the heterotic loci or actual causative heterotic genes are identified with certainty, the genotypes are more likely to get scrutinized. The genotypes harboring key loci can be identified through whole-genome assembly of parental lines, by narrowing down directly those potential combinations conferring robust performances. This study is a perfect integration of both conventional and modern techniques for hybrid crosses generation which can be done quickly and with greater predictive ability. Globally, an enormous body of systematic surveys on heterosis has since accumulated. Phenological attributes have been investigated for hybrid vigor in many crops, such as grain amaranths (Amaranthus cruentus, Amaranthus hypochondriacus) (Lehmann et al., 1991), maize (Parentoni et al., 2001; Betrán et al., 2003), tomato (Lycopersicon esculentum) (Makesh, 2002), and rice (Oryza sativa) (Verma et al., 2002). The number of genotypes analyzed in those works is comparable to that accessed in our survey on cotton. In our study, we analyzed 284 female lines, four testers and their subsequent hybrid progenies across a wide spectra of environments. Hence, heterosis also ranged widely, with higher values for agronomic traits but lower values for fiber quality traits, due to the presence of many individuals with varying higher and lower phenotypic values than their parents. Because the genotype of a hybrid is obtained after the combination of both its parental genotypes, the overdominance hypothesis postulates the heterozygosity of individual loci is consequential for the superior performance. Our finding of a higher heterosis trend in agronomic traits than fiber quality traits is consistent with previous findings and can prove beneficial for cotton breeding.
Due to the scarcity of available genetic divergence in the founder parents of Cotton World stock, global climatic changes are continuously posing threats to Upland Cotton crops with respect to progress in breeding and their survival. Thus, it is imperative that we explore potential genetic diversity that might have been eroded from cultivated cotton collections. Population structure within the collection of accessions is considered crucial for explaining heterogeneity. Chinese cotton production as well as cotton breeding programs are largely based on the introduction of germplasms since long (Chen and Du, 2006). However, improved cultivated species in the last two decades have population structures with a reasonable extent of heritability. Accessions used as parents were clustered into three distinct groups on the basis of genotypic data. We identified three major subpopulations in our experimental stock of F1 sets, which formed at earlier stages of the cotton breeding period and were not affected by geographical influences of China.
In the last two decades, GWAS has been extensively utilized by researchers to map different quantitative traits in plants and this achievement is considered a complex milestone (Ingvarsson and Street, 2011). It is thought the power of GWAS usually depends on four distinct factors: availability of rich genetic diversity, credibility in acquisition of phenotypic data, density of markers and use of adequate statistical methods. The current collection of G. hirsutum accessions used as parents exhibited reasonable amounts of phenotypic and genotypic diversity. It offers a highly efficient way to mine heterosis-related loci by high-resolution GWAS in plants. Through GWAS, the relationships among significantly associated hQTNs to fiber quality as well as other agronomic traits, and the annotation of putative genes containing these hQTNs, were examined here in depth.
The identification of hQTNs using five different types of heterosis, trait performance, SCA and four F1 sets is another noteworthy feature of this study. In this way, the loci controlling heterosis of different traits could be separated from those concerned with trait performance in earlier studies. We distinguished 19 highly stable hQTNs for LP, BW, FL, FS and MIC traits based on their detection from five heterosis types and/or four F1 sets across multiple differing environments. These stable heterotic loci could be used in the future to assist in Upland Cotton breeding via MAS applications. The remaining significant hQTNs that were found related to other traits could also prove useful in cotton breeding programs. Moreover, a reasonable number of identified SNPs from the F1 sets and trait phenotypes overlapped with those detected from the heterosis types. These findings revealed that both heterosis and trait performance were not independently controlled by different loci, which agrees with a recent study on upland cotton (Li et al., 2018). Conversely, in rice, (Hua et al., 2003) reported them as being independently controlled by different sets of loci.
Boll weight was identified in relation with Gh_D08G0894, which encodes an ethylene-responsive transcription factor detected earlier in Arabidopsis (Nole-Wilson et al., 2005) and later in cotton (Qin et al., 2019). Ethylene is considered as a key factor in the growth of cotton fiber and in its elongation (Qin et al., 2007; Qin and Zhu, 2011); its crucial role is evident from the findings that when it occurs in excessive or insufficient amounts this negatively affects FE (Li et al., 2015). Two candidate genes, Gh_D02G1201 and Gh_A10G1233, showed an association with FE-related hQTNs. Both Gh_D02G1201 and Gh_A10G1233 encode FAR-RED elongated proteins which are involved in light responses and FE development (Ju et al., 2019) along with the positive regulation of chlorophyll biosynthesis (Tang et al., 2012; Miao et al., 2017). Gh_A11G1858, which displayed an association with the hQTN related to FL, encodes a serine-threonine kinase SAPK1 protein that may play a role in the signal transduction of a hyperosmotic response markedly influencing the fiber development process (Kobayashi et al., 2004; Magwanga et al., 2018; Li et al., 2019). FU was identified with hQTNs associated with Gh_A01G0481 and Gh_A11G0475; the former encodes a cytochrome P450 protein which may have a role in the maturation or aging of tissues (Ju et al., 2019), while the latter encodes the Ras-related protein RAB11A, it detected previously in fiber development and elongation (Qin et al., 2017). The FUI trait was associated with a hQTN related to Gh_A03G0366, which encodes a scarecrow-like protein that acts as transcription factor and which regulates the development of vegetative and reproductive plant parts (Cenci and Rouard, 2017; Zhang et al., 2018). The LP-associated hQTN was related to Gh_A05G0285, a gene earlier detected in cotton for coding nucleotide binding protein responsible for fiber development (Ju et al., 2019). The MIC-directed association toward hQTNs related to Gh_A03G1505, Gh_A03G0332, Gh_A02G0495, and Gh_D06G1287; these reportedly encode in cotton the production of calcium-dependent proteins related respectively to the kinase family (Si et al., 2020), histones H2B (Qin et al., 2019), phosphatase 2C (Ju et al., 2019; Song et al., 2019; Shahzad et al., 2020), and cytochrome C oxidase (Zhang et al., 2019). Finally, FS was associated with a hQTN related to the Gh_A01G1348 gene known for encoding axial regulator proteins controlling the biomass vigor of hybrid cotton (Shahzad et al., 2020).
The current study is based on the concept of genomic hybrid breeding, previously utilized in rice (Xu et al., 2014), which exploited the strategy of genome sequencing. The sequence data was then deployed to evaluate F1 progenies’ performance in hybrid breeding. An earlier study on rice revealed the power of SNP-directed yield estimation of F1 hybrids. In the current study, 298 QTNs were uncovered in association with fiber quality as well as agronomic traits. A set of 271 hQTNs were detected with 19 highly stable heterotic loci in relation with LP, BW, FL, FS, and MIC based on their detection from five evaluated types of heterosis and/or four F1 hybrid sets across a wide spectrum of environments. These discovered hQTNs and putative candidate genes related to HETEROSIS of quoted traits could be used further deliberately in marker-assisted breeding of forthcoming cotton hybrid breeding programs. Once the genotype-based predictions achieve relatively high levels of accuracy, the labor and time costs of hybrid breeding are greatly reduced. The reported information derived in this study is of practical and scientific significance for both cotton breeders and biologists engaged in elucidating the heterosis mechanism of fiber as it could assist in successful accomplishments in both domains.
Data Availability Statement
The data related to RAD-sequencing have been submitted to NCBI under reference No. PRJNA353524. Other used data are provided in the form of Supplementary Material/Tables. Any other information supporting the conclusions of this article, if needed, will be made available by the authors, at appropriate request without undue reservation.
Author Contributions
XD and JS: conceived and designed the research. JS, QW, HQ, JL, HL, JiY, ZM, and DX: managed the project. ZS, ZP, XG, MShI, MFN, MSaI, and HA: designed and performed molecular experiments in lab along with molecular data analysis. YJ, SH, JS, HQ, HL, DX, JuY, JZ, ZL, ZC, XiZ, XuZ, AH, XY, GZ, LL, HZ, BP, and LW: prepared samples and performed phenotyping in Anyang, Henan, Xinxiang, Wuhan, Jingzhou, Baoding, Changde, Shandong etc. ZS, SA, and MShI: analyzed and interpreted data and prepared figures and tables. ZS, MShI, and XD: drafted and processed the manuscript and all authors helped throughout this process and take active part in critical revisions and improvements in important intellectual contents. All authors read the manuscript critically and approved the final version of manuscript for publication. All authors agreed to be accountable for all aspects of the work in ensuring that questions related to the accuracy or integrity of any part of the work are appropriately investigated and resolved.
Funding
This research was supported by grants from the National Natural Science Foundation of China (Grant No. 31571716) and the National Key Research and Development Program of China (2016YFD0101401).
Conflict of Interest
It is declared that, authors, JL, JY, ZC, and GZ were employed by “Zhongmian Seed Technologies Co., Ltd., Zhengzhou, China,” the author, HL employed by “Jing Hua Seed Industry Technologies Inc., Jingzhou, China,” the author, DX employed by “Guoxin Rural Technical Service Association, Hebei, China,” the authors, JZ as well as LL were employed by “Zhongli Company of Shandong, Shandong, China,” and the author AH employed by “Sanyi Seed Industry of Changde in Hunan Inc., Changde, China.”
The remaining authors declare that the research was conducted in the absence of any commercial or financial relationships that could be construed as a potential conflict of interest.
Acknowledgments
We thank the National Mid-term Genebank for Cotton at the Institute of Cotton Research of Chinese Academy of Agricultural Sciences for providing the seeds.
Supplementary Material
The Supplementary Material for this article can be found online at: https://www.frontiersin.org/articles/10.3389/fpls.2021.565552/full#supplementary-material
Abbreviations
BN, boll number; Bt, Bacillus thuringiensis; Dim, dimension; DNA, deoxyribonucleic acid; F1, first filial generation; FE, fiber elongation; FL, upper half mean Length; FS, fiber strength; FU, fiber uniformity; FUI, fiber uniformity index; HB, heterobeltosis; HI, heterosis index; hQTN, heterotic Quantitative Trait Nucleotide; K3, competitive heterosis over check Rui za 816; K4, competitive heterosis over check Eza mian 10 hao (Tai D5); L × T, Line into Tester mating design; LD, linkage disequilibrium; LP, lint percentage; Mb, Million base pairs; MIC, fiber micronaire; MP, Mid-Parent heterosis; PCA, principal component analysis; PH, plant height; r, Correlation; r2, coefficient of regression; SCA, specific combining ability
Footnotes
- ^ http://mascotton.njau.edu.cn/info/1054/1118.htm
- ^ http://128.32.118.212/thorfinn/realSFS/
- ^ https://cottonfgd.org
References
Atwell, S., Huang, Y. S., Vilhjálmsson, B. J., Willems, G., Horton, M., Li, Y., et al. (2010). Genome-wide association study of 107 phenotypes in Arabidopsis thaliana inbred lines. Nature 465:627.
Basunanda, P., Radoev, M., Ecke, W., Friedt, W., Becker, H. C., and Snowdon, R. J. (2010). Comparative mapping of quantitative trait loci involved in heterosis for seedling and yield traits in oilseed rape (Brassica napus L.). Theor. Appl. Genet. 120, 271–281. doi: 10.1007/s00122-009-1133-z
Betrán, F., Ribaut, J., Beck, D., and De Leon, D. G. J. C. S. (2003). Genetic diversity, specific combining ability, and heterosis in tropical maize under stress and nonstress environments. Crop Sci. 43, 797–806. doi: 10.2135/cropsci2003.0797
Cenci, A., and Rouard, M. (2017). Evolutionary analyses of GRAS transcription factors in angiosperms. Front. Plant Sci. 8:273. doi: 10.3389/fpls.2017.00273
Chen, G., and Du, X. (2006). Genetic diversity of basal germplasm phenotypes in upland cotton in China. Acta Bot. Boreali Occident. Sin. 26, 1649–1656.
Chen, Z. J. (2013). Genomic and epigenetic insights into the molecular bases of heterosis. Nat. Rev. Genet. 14, 471–482. doi: 10.1038/nrg3503
Frascaroli, E., Canè, M. A., Landi, P., Pea, G., Gianfranceschi, L., Villa, M., et al. (2007). Classical genetic and quantitative trait loci analyses of heterosis in a maize hybrid between two elite inbred lines. Genetics 176, 625–644. doi: 10.1534/genetics.106.064493
Fujimoto, R., Taylor, J. M., Shirasawa, S., Peacock, W. J., and Dennis, E. S. (2012). Heterosis of Arabidopsis hybrids between C24 and Col is associated with increased photosynthesis capacity. Proc. Natl. Acad. Sci. U.S.A. 109, 7109–7114. doi: 10.1073/pnas.1204464109
Garcia, A. A. F., Wang, S., Melchinger, A. E., and Zeng, Z.-B. (2008). Quantitative trait loci mapping and the genetic basis of heterosis in maize and rice. Genetics 180, 1707–1724. doi: 10.1534/genetics.107.082867
Gomez, K. A., Gomez, K. A., and Gomez, A. A. (1984). Statistical Procedures for Agricultural Research. NewYork, NY: John Wiley & Sons.
Groszmann, M., Gonzalez-Bayon, R., Lyons, R. L., Greaves, I. K., Kazan, K., Peacock, W. J., et al. (2015). Hormone-regulated defense and stress response networks contribute to heterosis in Arabidopsis F1 hybrids. Proc. Natl. Acad. Sci. 112, E6397–E6406.
Grover, C., Zhu, X., Grupp, K., Jareczek, J., Gallagher, J., Szadkowski, E., et al. (2015). Molecular confirmation of species status for the allopolyploid cotton species, Gossypium ekmanianum Wittmack. Genet. Resour. Crop Evol. 62, 103–114. doi: 10.1007/s10722-014-0138-x
He, G., Chen, B., Wang, X., Li, X., Li, J., He, H., et al. (2013). Conservation and divergence of transcriptomic and epigenomic variation in maize hybrids. Genome Biol. 14:R57.
He, G., Zhu, X., Elling, A. A., Chen, L., Wang, X., Guo, L., et al. (2010). Global epigenetic and transcriptional trends among two rice subspecies and their reciprocal hybrids. Plant Cell 22, 17–33. doi: 10.1105/tpc.109.072041
Hua, J., Xing, Y., Wu, W., Xu, C., Sun, X., Yu, S., et al. (2003). Single-locus heterotic effects and dominance by dominance interactions can adequately explain the genetic basis of heterosis in an elite rice hybrid. Proc. Natl. Acad. Sci.U.S.A. 100, 2574–2579. doi: 10.1073/pnas.0437907100
Huang, X., Zhao, Y., Li, C., Wang, A., Zhao, Q., Li, W., et al. (2012). Genome-wide association study of flowering time and grain yield traits in a worldwide collection of rice germplasm. Nat. Genet. 44:32. doi: 10.1038/ng.1018
Ingvarsson, P. K., and Street, N. R. (2011). Association genetics of complex traits in plants. New Phytol. 189, 909–922. doi: 10.1111/j.1469-8137.2010.03593.x
Ju, F., Liu, S., Zhang, S., Ma, H., Chen, J., Ge, C., et al. (2019). Transcriptome analysis and identification of genes associated with fruiting branch internode elongation in upland cotton. BMC Plant Biol. 19:415. doi: 10.1186/s12870-019-2011-8
Kang, H. M., Sul, J. H., Service, S. K., Zaitlen, N. A., Kong, S. Y., Freimer, N. B., et al. (2010). Variance component model to account for sample structure in genome-wide association studies. Nat. Genet. 42, 348–354. doi: 10.1038/ng.548
Kobayashi, Y., Yamamoto, S., Minami, H., Kagaya, Y., and Hattori, T. J. T. P. C. (2004). Differential activation of the rice sucrose nonfermenting1–related protein kinase2 family by hyperosmotic stress and abscisic acid. Plant Cell 16, 1163–1177. doi: 10.1105/tpc.019943
Kump, K. L., Bradbury, P. J., Wisser, R. J., Buckler, E. S., Belcher, A. R., Oropeza-Rosas, M. A., et al. (2011). Genome-wide association study of quantitative resistance to southern leaf blight in the maize nested association mapping population. Nat. Genet. 43:163. doi: 10.1038/ng.747
Lehmann, J., Clark, R., and Frey, K. J. C. S. (1991). Biomass heterosis and combining ability in interspecific and intraspecific matings of grain amaranths. Crop sci. 31, 1111–1116. doi: 10.2135/cropsci1991.0011183x003100050004x
Li, C., Zhao, T., Yu, H., Li, C., Deng, X., Dong, Y., et al. (2018). Genetic basis of heterosis for yield and yield components explored by QTL mapping across four genetic populations in upland cotton. BMC Genomics 19:910. doi: 10.1186/s12864-018-5289-2
Li, F., Fan, G., Lu, C., Xiao, G., Zou, C., Kohel, R. J., et al. (2015). Genome sequence of cultivated Upland cotton (Gossypium hirsutum TM-1) provides insights into genome evolution. Nat. Biotechnol. 33, 524–530.
Li, H., Handsaker, B., Wysoker, A., Fennell, T., Ruan, J., Homer, N., et al. (2009). The sequence alignment/map format and SAMtools. Bioinformatics 25, 2078–2079. doi: 10.1093/bioinformatics/btp352
Li, H.-M., Liu, S.-D., Ge, C.-W., Zhang, X.-M., Zhang, S.-P., Chen, J., et al. (2019). Association analysis of drought tolerance and Associated traits in upland cotton at the seedling stage. Int. J. Mol. Sci. 20:3888. doi: 10.3390/ijms20163888
Li, L., Lu, K., Chen, Z., Mu, T., Hu, Z., and Li, X. J. G. (2008). Dominance, overdominance and epistasis condition the heterosis in two heterotic rice hybrids. Genetics 180, 1725–1742. doi: 10.1534/genetics.108.091942
Li, Z.-K., Luo, L., Mei, H., Wang, D., Shu, Q., Tabien, R., et al. (2001). Overdominant epistatic loci are the primary genetic basis of inbreeding depression and heterosis in rice. I. Biomass and grain yield. Genetics 158, 1737–1753.
Lippman, Z. B., and Zamir, D. (2007). Heterosis: revisiting the magic. Trends Genet. 23, 60–66. doi: 10.1016/j.tig.2006.12.006
Magwanga, R. O., Lu, P., Kirungu, J. N., Diouf, L., Dong, Q., Hu, Y., et al. (2018). GBS mapping and analysis of genes conserved between Gossypium tomentosum and Gossypium hirsutum cotton cultivars that respond to drought stress at the seedling stage of the BC2F2 generation. Int. J. Mol. Sci. 19:1614. doi: 10.3390/ijms19061614
Makesh, S. (2002). Heterosis studies for quality and yield in tomato (Lycopersicon esculentum Mill.). Adv. Plant Sci. 15, 597–601.
McKenna, A., Hanna, M., Banks, E., Sivachenko, A., Cibulskis, K., Kernytsky, A., et al. (2010). The genome analysis toolkit: a mapreduce framework for analyzing next-generation DNA sequencing data. Genome Res. 20, 1297–1303. doi: 10.1101/gr.107524.110
Meijón, M., Satbhai, S. B., Tsuchimatsu, T., and Busch, W. J. N. G. (2014). Genome-wide association study using cellular traits identifies a new regulator of root development in Arabidopsis. Nature genetics 46:77. doi: 10.1038/ng.2824
Miao, Q., Deng, P., Saha, S., Jenkins, J. N., Hsu, C.-Y., Abdurakhmonov, I. Y., et al. (2017). Genome-wide identification and characterization of microRNAs differentially expressed in fibers in a cotton phytochrome A1 RNAi line. PLoS One 12:e0179381. doi: 10.1371/journal.pone.0179381
Miller, M., Song, Q., Shi, X., Juenger, T. E., and Chen, Z. J. (2015). Natural variation in timing of stress-responsive gene expression predicts heterosis in intraspecific hybrids of Arabidopsis. Nat. Commun. 6:7453.
Nole-Wilson, S., Tranby, T. L., and Krizek, B. A. (2005). AINTEGUMENTA-like (AIL) genes are expressed in young tissues and may specify meristematic or division-competent states. Plant Mol. Biol. Rep. 57, 613–628. doi: 10.1007/s11103-005-0955-6
Parentoni, S., Magalhaes, J., Pacheco, C., Santos, M., Abadie, T., Gama, E., et al. (2001). Heterotic groups based on yield-specific combining ability data and phylogenetic relationship determined by RAPD markers for 28 tropical maize open pollinated varieties. Euphytica 121, 197–208.
Paterson, A. H., Brubaker, C. L., and Wendel, J. F. (1993). A rapid method for extraction of cotton (Gossypium spp.) genomic DNA suitable for RFLP or PCR analysis. Plant Mol. Biol. Rep. 11, 122–127. doi: 10.1007/bf02670470
Price, A. L., Patterson, N. J., Plenge, R. M., Weinblatt, M. E., Shadick, N. A., and Reich, D. (2006). Principal components analysis corrects for stratification in genome-wide association studies. Nat. Genet. 38:904. doi: 10.1038/ng1847
Qin, Y., Sun, H., Hao, P., Wang, H., Wang, C., Ma, L., et al. (2019). Transcriptome analysis reveals differences in the mechanisms of fiber initiation and elongation between long-and short-fiber cotton (Gossypium hirsutum L.) lines. BMC Genomics 20:633. doi: 10.1186/s12864-019-5986-5
Qin, Y., Wei, H., Sun, H., Hao, P., Wang, H., Su, J., et al. (2017). Proteomic analysis of differences in fiber development between wild and cultivated Gossypium hirsutum L. J. Proteome Res. 16, 2811–2824. doi: 10.1021/acs.jproteome.7b00122
Qin, Y.-M., Hu, C.-Y., Pang, Y., Kastaniotis, A. J., Hiltunen, J. K., and Zhu, Y.-X. (2007). Saturated very-long-chain fatty acids promote cotton fiber and Arabidopsis cell elongation by activating ethylene biosynthesis. Plant Cell 19, 3692–3704. doi: 10.1105/tpc.107.054437
Qin, Y.-M., and Zhu, Y.-X. J. C. O. I. P. B. (2011). How cotton fibers elongate: a tale of linear cell-growth mode. Curr. opin. Plant Biol. 14, 106–111. doi: 10.1016/j.pbi.2010.09.010
Radoev, M., Becker, H. C., and Ecke, W. J. G. (2008). Genetic analysis of heterosis for yield and yield components in rapeseed (Brassica napus L.) by quantitative trait locus mapping. Genetics 179, 1547–1558. doi: 10.1534/genetics.108.089680
Sarfraz, Z., Iqbal, M. S., Pan, Z., Jia, Y., He, S., Wang, Q., et al. (2018). Integration of conventional and advanced molecular tools to track footprints of heterosis in cotton. BMC Genomics 19:776. doi: 10.1186/s12864-018-5129-4
Schnable, P. S., and Springer, N. M. (2013). Progress toward understanding heterosis in crop plants. Annu. Rev. Plant Biol. 64, 71–88. doi: 10.1146/annurev-arplant-042110-103827
Shahzad, K., Zhang, X., Guo, L., Qi, T., Tang, H., Zhang, M., et al. (2020). Comparative transcriptome analysis of inbred lines and contrasting hybrids reveals overdominance mediate early biomass vigor in hybrid cotton. BMC Genomics 21:140. doi: 10.1186/s12864-020-6561-9
Shull, C. A. (1922). The formation of a new island in the Mississippi River. Ecology 3, 202–206. doi: 10.2307/1929034
Shull, G. H. (1908). The composition of a field of maize. J. Hered. 4, 296–301. doi: 10.1093/jhered/os-4.1.296
Shull, G. H. (1909). A pure-line method in corn breeding. J. Hered. 5, 51–58. doi: 10.1093/jhered/os-5.1.51
Si, H., Liu, H., Sun, Y., Xu, Z., Liang, S., Bo, L., et al. (2020). Transcriptome and metabolome analysis reveal that oral secretions from Helicoverpa armigera and Spodoptera litura influence wound-induced host response in cotton. Crop J. 8, 929–942. doi: 10.1016/j.cj.2019.12.007
Singh, R., and Chaudhary, B. (1977). “Variance and covariance analysis,” in Biometrical Methods in Quantitative Genetic Analysis, Revised Edn, eds R. Singh and B. Chaudhary (Ludhiana: Kalyani Publishers), 39–69.
Song, Y., Li, L., Yang, Z., Zhao, G., Zhang, X., Wang, L., et al. (2019). Target of rapamycin (TOR) regulates the expression of lncRNAs in response to abiotic stresses in cotton. Front. Genet. 9:690. doi: 10.3389/fgene.2018.00690
Staples, J., Qiao, D., Cho, M. H., Silverman, E. K., Nickerson, D. A., and Below, J. E. (2014). PRIMUS: rapid reconstruction of pedigrees from genome-wide estimates of identity by descent. Am. J. Hum. Genet. 95, 553–564. doi: 10.1016/j.ajhg.2014.10.005
Tang, W., Wang, W., Chen, D., Ji, Q., Jing, Y., Wang, H., et al. (2012). Transposase-derived proteins FHY3/FAR1 interact with PHYTOCHROME-INTERACTING FACTOR1 to regulate chlorophyll biosynthesis by modulating HEMB1 during deetiolation in Arabidopsis. Plant Cell 24, 1984–2000. doi: 10.1105/tpc.112.097022
Verma, O., Santoshi, U., and Srivastava, H. (2002). Heterosis and inbreeding depression for yield and certain physiological traits in hybrids involving diverse ecotypes of rice (Oryza sativa L.)[India]. J. Genet. Breed. 56, 267–278.
Wright, B., Farquharson, K. A., Mclennan, E. A., Belov, K., Hogg, C. J., and Grueber, C. E. (2019). From reference genomes to population genomics: comparing three reference-aligned reduced-representation sequencing pipelines in two wildlife species. BMC Genomics 20:453. doi: 10.1186/s12864-019-5806-y
Xiao, J., Li, J., Yuan, L., and Tanksley, S. D. J. G. (1995). Dominance is the major genetic basis of heterosis in rice as revealed by QTL analysis using molecular markers. Genetics 140, 745–754. doi: 10.1093/genetics/140.2.745
Xu, S., Zhu, D., and Zhang, Q. (2014). Predicting hybrid performance in rice using genomic best linear unbiased prediction. Proc. Natl. Acad. Sci. U. S. A. 111, 12456–12461. doi: 10.1073/pnas.1413750111
Yu, J., Pressoir, G., Briggs, W. H., Bi, I. V., Yamasaki, M., Doebley, J. F., et al. (2006). A unified mixed-model method for association mapping that accounts for multiple levels of relatedness. Nat. Genetics 38:203. doi: 10.1038/ng1702
Yu, S., Li, J., Xu, C., Tan, Y., Gao, Y., Li, X., et al. (1997). Importance of epistasis as the genetic basis of heterosis in an elite rice hybrid. Proc. Natl. Acad. Sci. U.S.A. 94, 9226–9231. doi: 10.1073/pnas.94.17.9226
Zhang, B., Zhang, X., Liu, G., Guo, L., Qi, T., Zhang, M., et al. (2018). A combined small RNA and transcriptome sequencing analysis reveal regulatory roles of miRNAs during anther development of Upland cotton carrying cytoplasmic male sterile Gossypium harknessii (D2) cytoplasm. BMC Plant Biol. 18:242. doi: 10.1186/s12870-018-1446-7
Zhang, M., Zhang, X., Guo, L., Qi, T., Liu, G., Feng, J., et al. (2019). Single-base resolution methylomes of cotton CMS system reveal epigenomic changes in response to high-temperature stress during anther development. J. Exp. Bot. 71, 951–969.
Zhang, T., and Endrizzi, J. E. (2015). Cytology and cytogenetics. Cotton 57, 129–154. doi: 10.2134/agronmonogr57.2013.0023
Zhang, T., Hu, Y., Jiang, W., Fang, L., Guan, X., Chen, J., et al. (2015). Sequencing of allotetraploid cotton (Gossypium hirsutum L. acc. TM-1) provides a resource for fiber improvement. Nat. Biotechnol. 33, 531–537.
Keywords: GWAS, heterosis, F1 hybrid, hQTNs, multiple environments, upland cotton
Citation: Sarfraz Z, Iqbal MS, Geng X, Iqbal MS, Nazir MF, Ahmed H, He S, Jia Y, Pan Z, Sun G, Ahmad S, Wang Q, Qin H, Liu J, Liu H, Yang J, Ma Z, Xu D, Yang J, Zhang J, Li Z, Cai Z, Zhang X, Zhang X, Huang A, Yi X, Zhou G, Li L, Zhu H, Pang B, Wang L, Sun J and Du X (2021) GWAS Mediated Elucidation of Heterosis for Metric Traits in Cotton (Gossypium hirsutum L.) Across Multiple Environments. Front. Plant Sci. 12:565552. doi: 10.3389/fpls.2021.565552
Received: 18 June 2020; Accepted: 15 March 2021;
Published: 20 May 2021.
Edited by:
Laurent Gentzbittel, Skolkovo Institute of Science and Technology, RussiaReviewed by:
Shuhui Song, Beijing Institute of Genomics, Chinese Academy of Sciences, ChinaWangzhen Guo, Nanjing Agricultural University, China
Copyright © 2021 Sarfraz, Iqbal, Geng, Iqbal, Nazir, Ahmed, He, Jia, Pan, Sun, Ahmad, Wang, Qin, Liu, Liu, Yang, Ma, Xu, Yang, Zhang, Li, Cai, Zhang, Zhang, Huang, Yi, Zhou, Li, Zhu, Pang, Wang, Sun and Du. This is an open-access article distributed under the terms of the Creative Commons Attribution License (CC BY). The use, distribution or reproduction in other forums is permitted, provided the original author(s) and the copyright owner(s) are credited and that the original publication in this journal is cited, in accordance with accepted academic practice. No use, distribution or reproduction is permitted which does not comply with these terms.
*Correspondence: Junling Sun, c3VuamwwMDBAMTYzLmNvbQ==; Xiongming Du, ZHVqZWZmcmV5ODg0OEBob3RtYWlsLmNvbQ==
†These authors have contributed equally to this work