- 1Horticulture and Product Physiology, Department of Plant Sciences, Wageningen University & Research, Wageningen, Netherlands
- 2Plant Breeding, Department of Plant Sciences, Wageningen University & Research, Wageningen, Netherlands
The recent development of light-emitting diodes (LEDs) and their application in modern horticulture stimulated studies demonstrating that additional far-red (FR) radiation (700–800 nm) increases plant dry mass. This effect of FR has been explained by improved photosynthesis and/or plant architecture. However, the genotypic variation in this response is largely unknown. Here, we aim to explore and explain the genotypic variation in growth responses to additional FR. We expected the genotypic variation in the responses of plant dry mass to additional FR. Further, we hypothesized that a significant improvement of both net assimilation rate (NAR) and leaf area ratio (LAR) is responsible for a strong dry mass increase under additional FR, while some genotypes respond only marginally or even negatively in NAR or LAR under FR, thus resulting in a weak FR effect on plant dry mass. To test these hypotheses, we grew 33 different tomato genotypes for 21 days with 0, 25, or 100 μmol m–2 s–1 of FR added to a common white + red LED background lighting of 150 μmol m–2 s–1. Genotypes responded similarly with respect to plant height, stem dry mass, and shoot:root ratio; i.e., they all increased with increasing FR. However, the response of total plant dry mass varied among genotypes. We categorized the genotypes into three groups (strongly, moderately, and weakly responding groups) based on their relative response in total plant dry mass to FR. Growth component analysis revealed that the strongly responding genotypes increased strongly in NAR rather than LAR. The weakly responding genotypes, however, showed a substantial increase in LAR but not NAR. The increase in LAR was due to the increase in specific leaf area. Leaf mass fraction, which is the other component of LAR, decreased with FR and did not differ between groups. In conclusion, tomato genotypes that increased strongly in NAR in response to FR were able to achieve a more substantial increase in dry mass than did other genotypes. This is the first study to explain the differences in growth responses of a large number of tomato genotypes toward FR in their light environment.
Introduction
Far-red (FR) radiation (700–800 nm) is an important light signal perceived by plants via the phytochrome photoreceptor family. Phytochromes exist as two photo-interconvertible isoforms, that is, the red (R)-absorbing biologically inactive Pr and the FR-absorbing active Pfr (Chen et al., 2005). A low R:FR ratio causes the equilibrium between the two isoforms of phytochromes to shift toward Pr, resulting in a set of morphological and physiological changes collectively known as the shade-avoidance syndrome (SAS). SAS responses such as stem elongation, leaf hyponasty, and flowering acceleration enable the plant to compete for more light capture and to secure reproductive success, as decreased R:FR ratio occurs naturally when plants are shaded (Huber and Wiggerman, 1997; Devlin, 1998; Yang et al., 2016; Michaud et al., 2017).
In the past decades, light-emitting diodes (LEDs) gained popularity in modern horticulture, a development that stimulated the study of spectral effects on plant growth and development. Plant photosynthesis is driven by photosynthetically active radiation (PAR; 400–700 nm). FR is not commonly considered to be part of PAR, as monochromatic FR drives neither CO2 assimilation nor O2 evolution from photosynthesis (Kono et al., 2020). When added to PAR, however, FR radiation may increase not only yield (Ji et al., 2019, 2020) but also total plant biomass production (Li and Kubota, 2009; Park and Runkle, 2017; Zhen and van Iersel, 2017). Much effort has been made to explain FR-enhanced plant growth. It has been found that FR-induced changes in plant architecture increase light interception (Kalaitzoglou et al., 2019). For a long time, FR effect on leaf photosynthesis has been described as the Emerson enhancement effect: radiation at shorter wavelengths enhances the quantum yield of radiation at longer wavelengths (Emerson et al., 1957; Emerson and Rabinowitch, 1960; Govindjee et al., 1964). Several recent studies revisited this concept and proposed the reverse interpretation: FR radiation enhances the quantum yield of PAR (Zhen and van Iersel, 2017). Furthermore, Zhen and Bugbee (2020) demonstrated in an experiment with 14 species of both C3 and C4 crops that FR can be as efficient in driving photosynthesis as PAR, not by itself but when provided in addition to PAR.
Modern horticultural production can benefit from a deeper understanding of plants’ responses to different light spectra. More importantly, it is crucial to explore the genotypic variation in such responses. For example, Ouzounis et al. (2016) showed genotypic differences in growth and physiological parameters when plants were grown in a red LED background with or without 12% of blue LED lighting. Plant’s response to FR is a new way to increase crop production and resource use efficiency (Demotes-Mainard et al., 2016). However, the genotypic variation in plants’ responses to additional FR is largely unknown due to the often-limited numbers of genotypes used in FR-related research. Here, we aim to evaluate and explain the similarities and differences between tomato genotypes in growth responses under additional FR. We hypothesize that not all genotypes respond the same way in their dry mass production under additional FR. Further, we hypothesize that this variation is the result of different morphological or physiological responses in the components of dry mass production under additional FR. To test these hypotheses, we conducted a climate chamber experiment where 33 tomato genotypes were grown for 21 days with 0, 25, or 100 μmol m–2 s–1 of FR added to a common white + red LED lighting background of 150 μmol m–2 s–1. Growth component analysis, which subdivides growth into underlying morphological and physiological components (Jolliffe and Courtney, 1984), is a useful tool to dissect the effect of FR on dry mass production (Higashide and Heuvelink, 2019). Here, growth components such as relative growth rate (RGR), net assimilation rate (NAR), leaf area ratio (LAR), specific leaf area (SLA), and leaf mass fraction (LMF) were determined, and the contribution of the different growth components to the genotypic variation in growth response was evaluated.
Materials and Methods
Plant Materials and Growth Conditions
The experiment was conducted in a fully controlled climate chamber at Wageningen University (Wageningen, Netherlands). The air temperature was maintained at 22°C, and the relative humidity was 70%. In this climate chamber, seeds of 33 tomato (Solanum lycopersicum, Table 1) genotypes, varying in genetic background and morphological traits (Aflitos et al., 2014), were germinated under white fluorescent light (Philips, Eindhoven, Netherlands) with 16 h photoperiod. Ten days after sowing, eight uniform seedlings of each genotype were individually transplanted into 10.5-cm-diameter plastic pots filled with sterilized river sand and placed onto the experimental bench equipped with an ebb-and-flow system. The plants were irrigated daily with nutrient solution (electrical conductivity 2.0 dS m–1, pH 5.5) containing 1.2 mM of NH4+, 7.2 mM of K+, 4.0 mM of Ca2+, 1.8 mM of Mg2+, 12.4 mM of NO3–, 3.3 mM of SO42–, 1.0 mM of PO42–, 35 μM of Fe3+, 8.0 μM of Mn2+, 5.0 μM of Zn2+, 20 μM of B, 0.5 μM of Cu2+, and 0.5 μM of MoO42–.
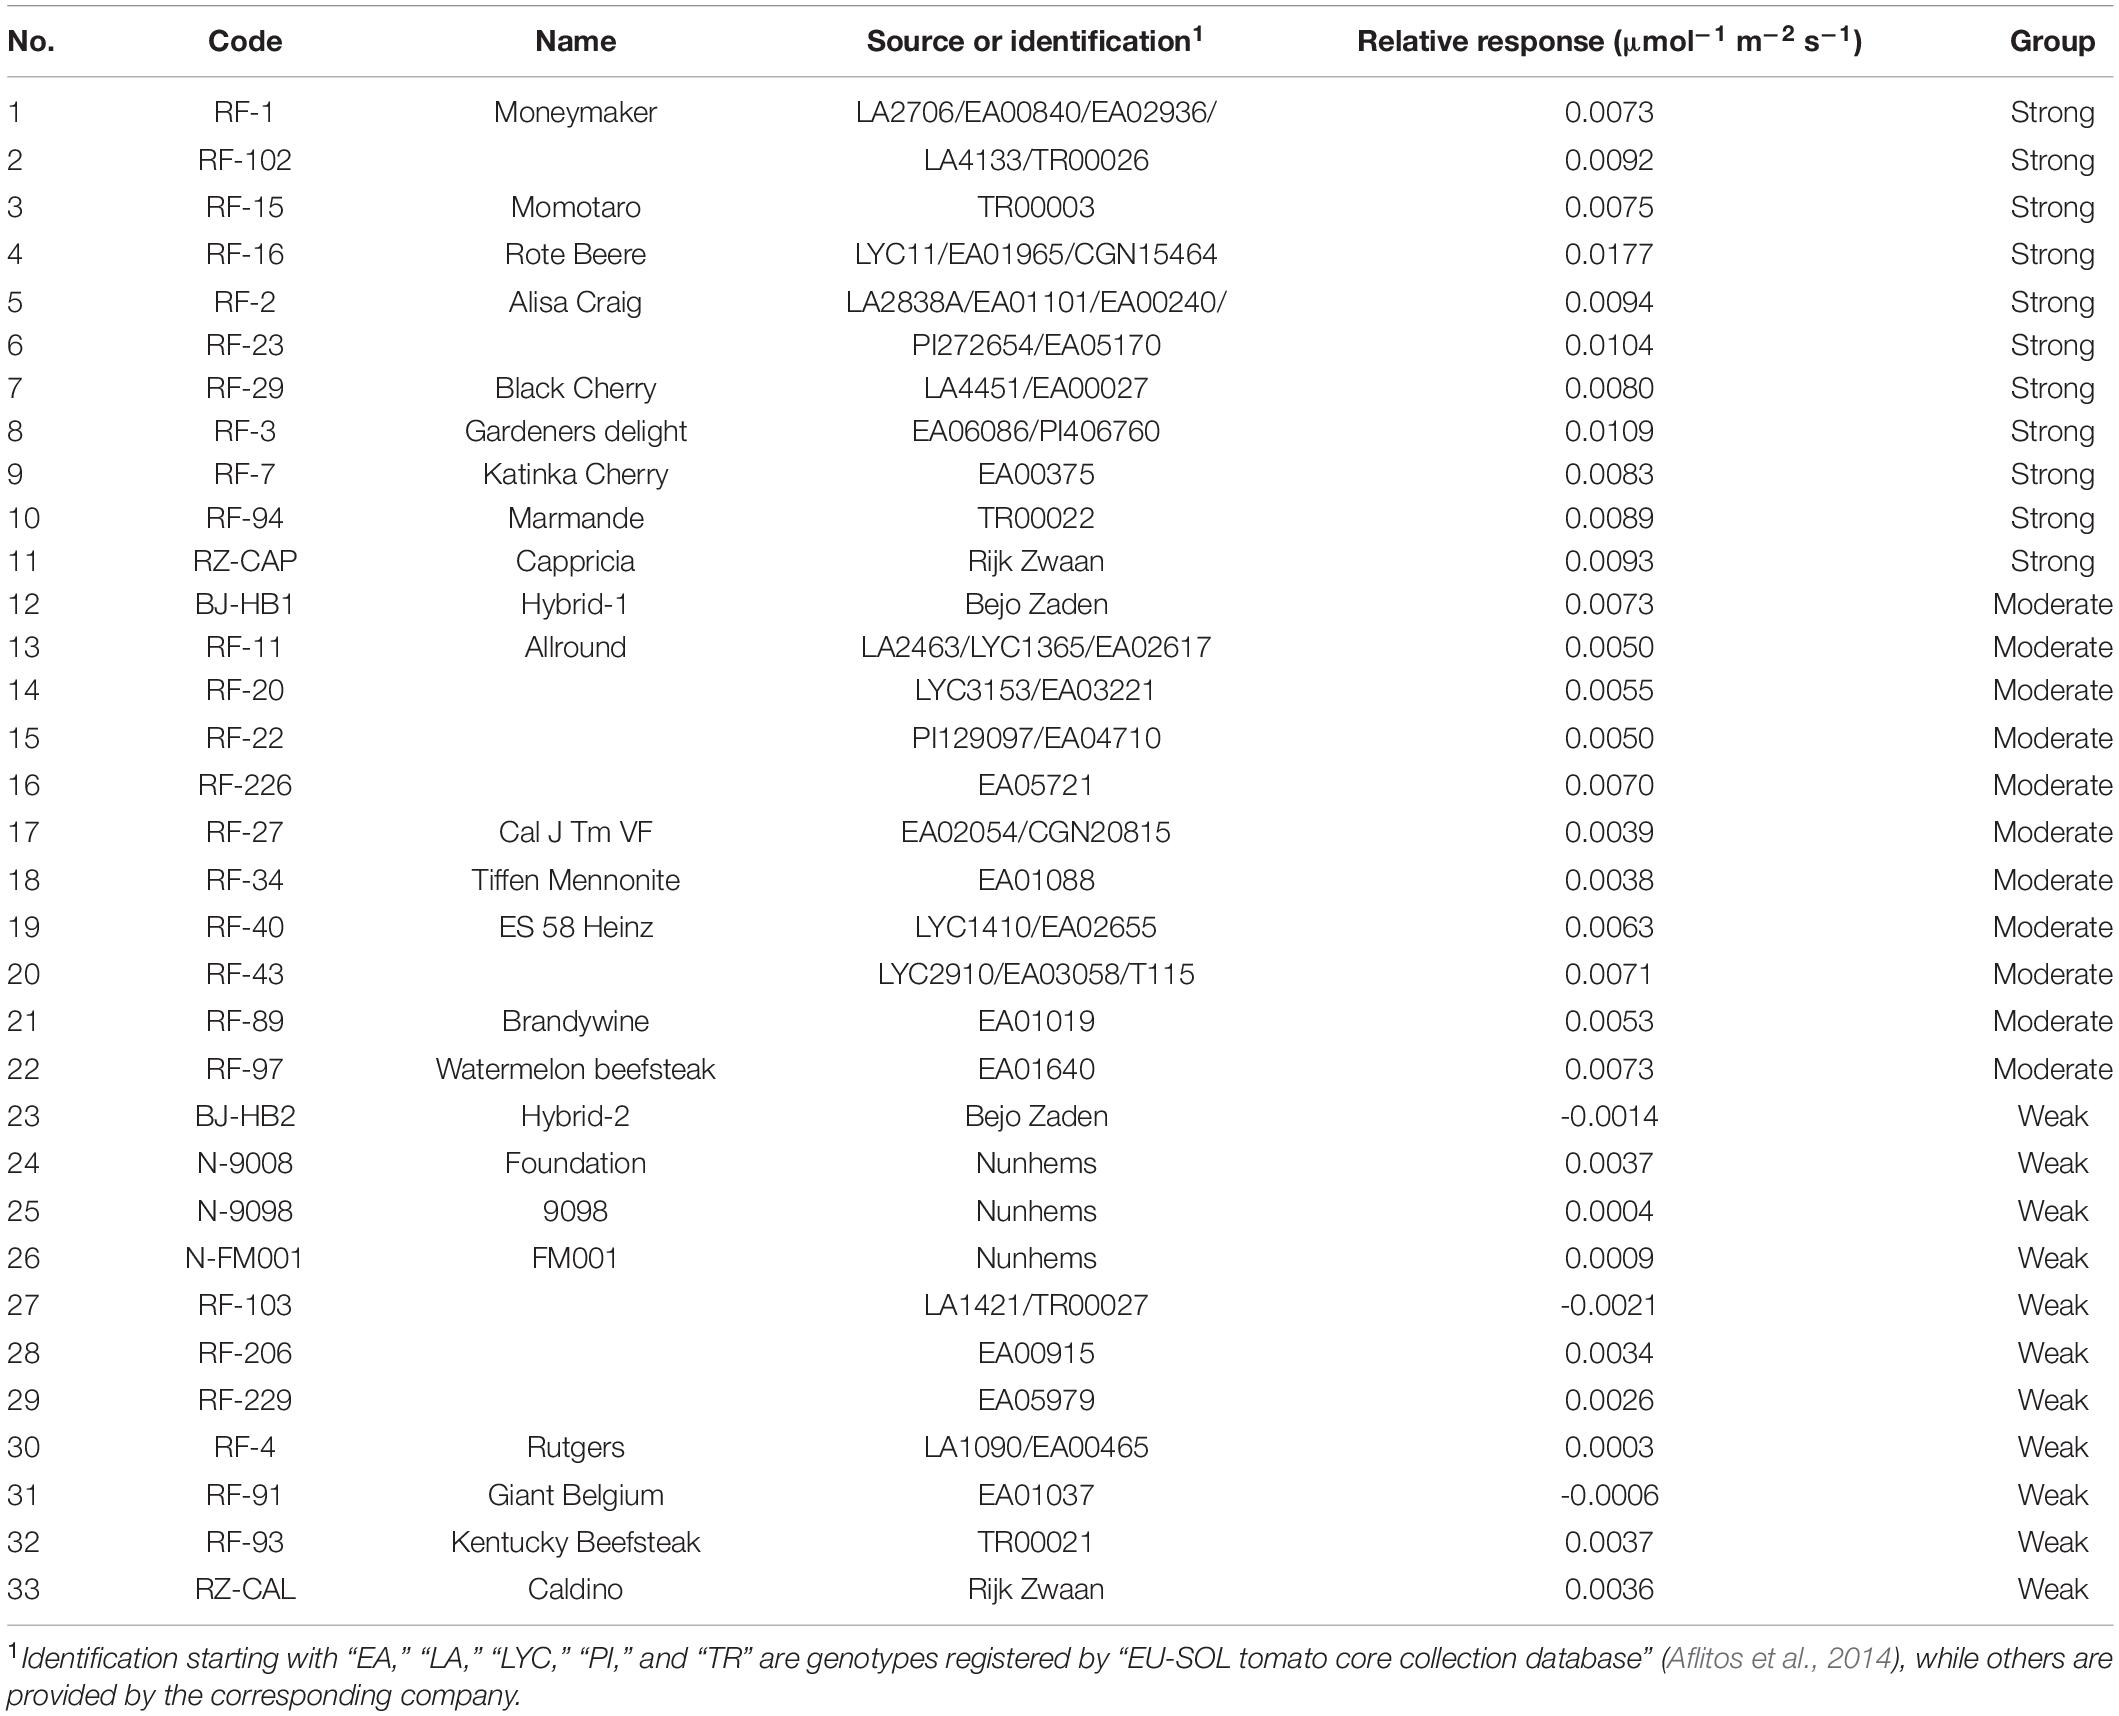
Table 1. List of genotypes used in the experiment and their relative response in total dry mass to increasing far red and their corresponding growth response groups.
Light Treatment
A deep red + white light at 150 μmol m–2 s–1 with 0.16 W m–2 of UV-B of was used as the control light treatment, and two light treatments were applied from transplanting (10 days after sowing). There were three FR treatments: 0, 25, or 100 μmol m–2 s–1 of FR radiation was added to a common background of red + white LED light of 150 μmol m–2 s–1 with 0.16 W m–2 of UV-B. The UV-B radiation was included to mimic the UV dosage in natural solar radiation. All lighting was provided by LED modules (Control: 3× GreenPower LED-TL-DR/W-MB-VISN; FR: 15 or 60× GreenPower LED-RM-FR, Philips, Eindhoven, Netherlands) except for UV-B (2× TL 20W/12 RS Ultraviolet-B, Philips). Light modules were placed 1.3 m above the experimental bench. Spectral distribution (Supplementary Figure S1) and photon flux density (PFD) of the LED lighting (Table 2) was measured at canopy height at transplanting with a spectroradiometer (USB 2000+ UV-VIS, Ocean Optics, Duiven, Netherlands) on 30 evenly distributed spots on the experimental bench. Based on these measurements, values of phytochrome photostationary state (PSS) were calculated as described in Sager et al. (1988).
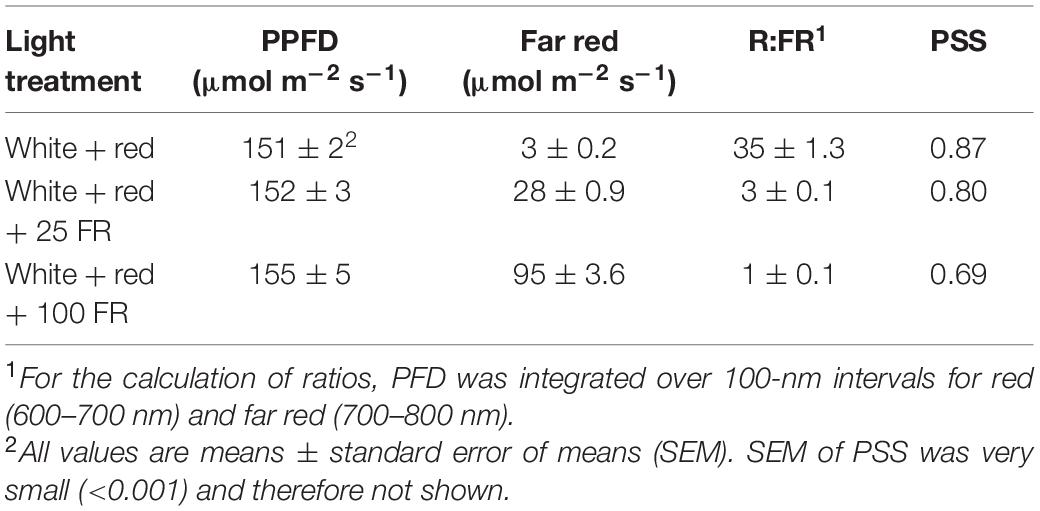
Table 2. Photosynthetic photon flux density (PPFD), photon flux density (PFD) of far red, red:far red ratio, and phytochrome photostationary state (PSS) of the LED light measured at the top of canopy.
Data Collection
Non-destructive Measurement
After 14 days of growth, stomatal conductance and chlorophyll index on the first fully expanded leaf of each experimental plant were determined. Stomatal conductance was measured with a SC-1 leaf porometer (Decagon Devices, Inc., Pullman, WA, United States), and chlorophyll index was measured using a Dualex leaf-clip sensor (Force-A, Orsay, France). For the chlorophyll measurement, the values measured from both sides of the leaf were averaged.
Destructive Measurement
After 21 days from transplanting, a final destructive harvest was carried out. Each experimental plant was carefully cleaned to remove any remaining river sand from the roots. Excess water was wiped clean with tissue paper, and the plant height was measured immediately, after which the plant was separated into roots, stem, and leaves. Total leaf area was measured using an area meter (LI-3100, Li-Cor Biosciences, Lincoln, NE, United States). Leaves, stems, and roots were dried in a ventilated oven for 72 h at 105°C to obtain the dry mass. For each genotype, the initial dry mass at transplanting was measured using seedlings of each genotype germinated in the same conditions as the experimental plants.
Growth Component Analysis
A linear relation was fitted between the total dry mass and PFD of FR for each genotype. Then, the relative response of each genotype was calculated as the ratio between the slope of this line and the absolute total plant dry mass (TDM) in the control light treatment. All 33 genotypes were then ranked by their relative response to increasing FR in total dry mass, and three response groups were distinguished, i.e., the strongly, moderately, and weakly responding groups, with 11 genotypes in each group. Effects of additional FR on RGR were analyzed using a growth component analysis, which separates RGR from its underlying components (Figure 1) (Hunt et al., 2002). RGR is the product of NAR and LAR, as shown in Eq. 1. NAR was calculated by dividing RGR by LAR.
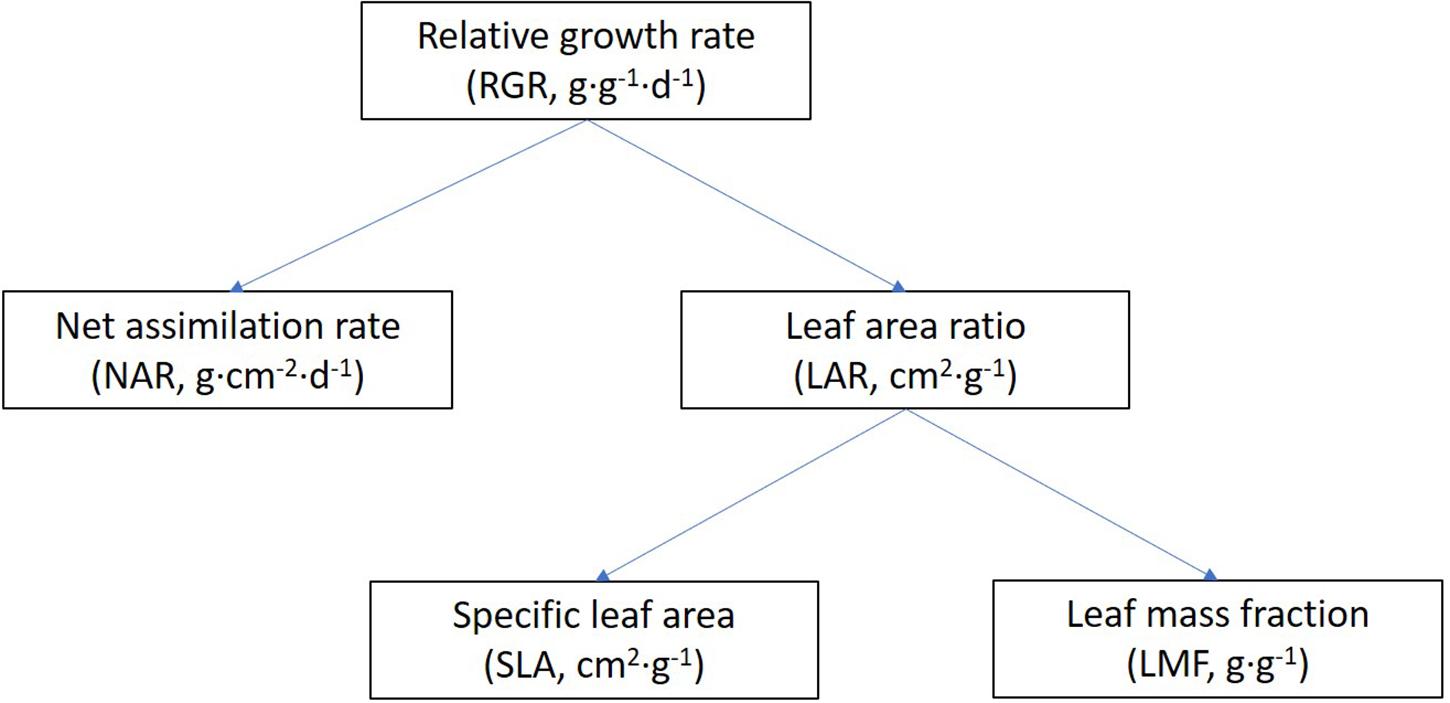
Figure 1. General scheme of a growth component analysis of relative growth rate. Abbreviations and units are included in brackets. RGR is the product of NAR and LAR, and LAR is the product of SLA and LMF.
Relative growth rate was calculated according to Eq. 2 using the initial plant dry mass (DWinitial) and the final plant dry mass (DWfinal) of each plant after 21 days of growth.
Further, LAR was analyzed as the product of SLA and LMF as indicated by Eq. 3.
Leaf area ratio, SLA, and LMF were calculated from the measured total leaf area (LAplant), final plant dry mass (DWfinal), and leaf dry mass per plant (DWleaf) using Eqs 4–6.
Experimental Setup and Statistical Analysis
Each experiment with one light treatment was conducted consecutively in the same fully controlled climate room. For each light treatment, eight blocks were designed according to the light distribution over the bench, and one plant per genotype was randomly placed in each block. The experiment with 25 μmol m–2 s–1 of FR was repeated in time for one extra time (again with eight blocks). To prevent border effects, S. lycopersicum cv. Moneymaker plants were grown around the experimental plants as border plants. Responsiveness of plant dry mass and RGR to additional FR was quantified as the slope of a linear regression with the FR PFD as the regressor. For the growth component analysis, statistical differences for the FR effect in each group were tested with paired sample t-test (genotypes defining the pairs). All statistics were performed in Genstat (18th Edition, VSN International Ltd., Hemel Hempstead, United Kingdom) at α = 0.05.
Results
Effect of Far-Red Radiation on Growth Parameters
Effects of additional FR varied among genotypes and among growth parameters studied (Figure 2). Plant height, stem dry mass, and shoot:root ratio increased in all genotypes with increasing FR. Chlorophyll index showed a minor decrease by adding 25 μmol m–2 s–1 of FR and a stronger and universal decrease in all genotypes by adding 100 μmol m–2 s–1 of FR. Responses of plant dry mass, leaf dry mass, root dry mass, and leaf area to increasing FR varied among genotypes. For plant dry mass, 58% of the genotypes showed a positive response under 25 μmol m–2 s–1 of FR, and this percentage increased to 70% under 100 μmol m–2 s–1 of FR. For leaf dry mass and root dry mass, about 30–40% of the genotypes responded positively to increasing FR, most of which belong to the strongly responding group (genotypes whose total dry mass increased relatively strong with FR). For stomatal conductance, half of the genotypes responded positively to 25 μmol m–2 s–1 of additional of FR, while this fraction decreased to 21% under 100 μmol m–2 s–1 of additional FR. Absolute numbers of each parameter are shown in Supplementary Table S1.
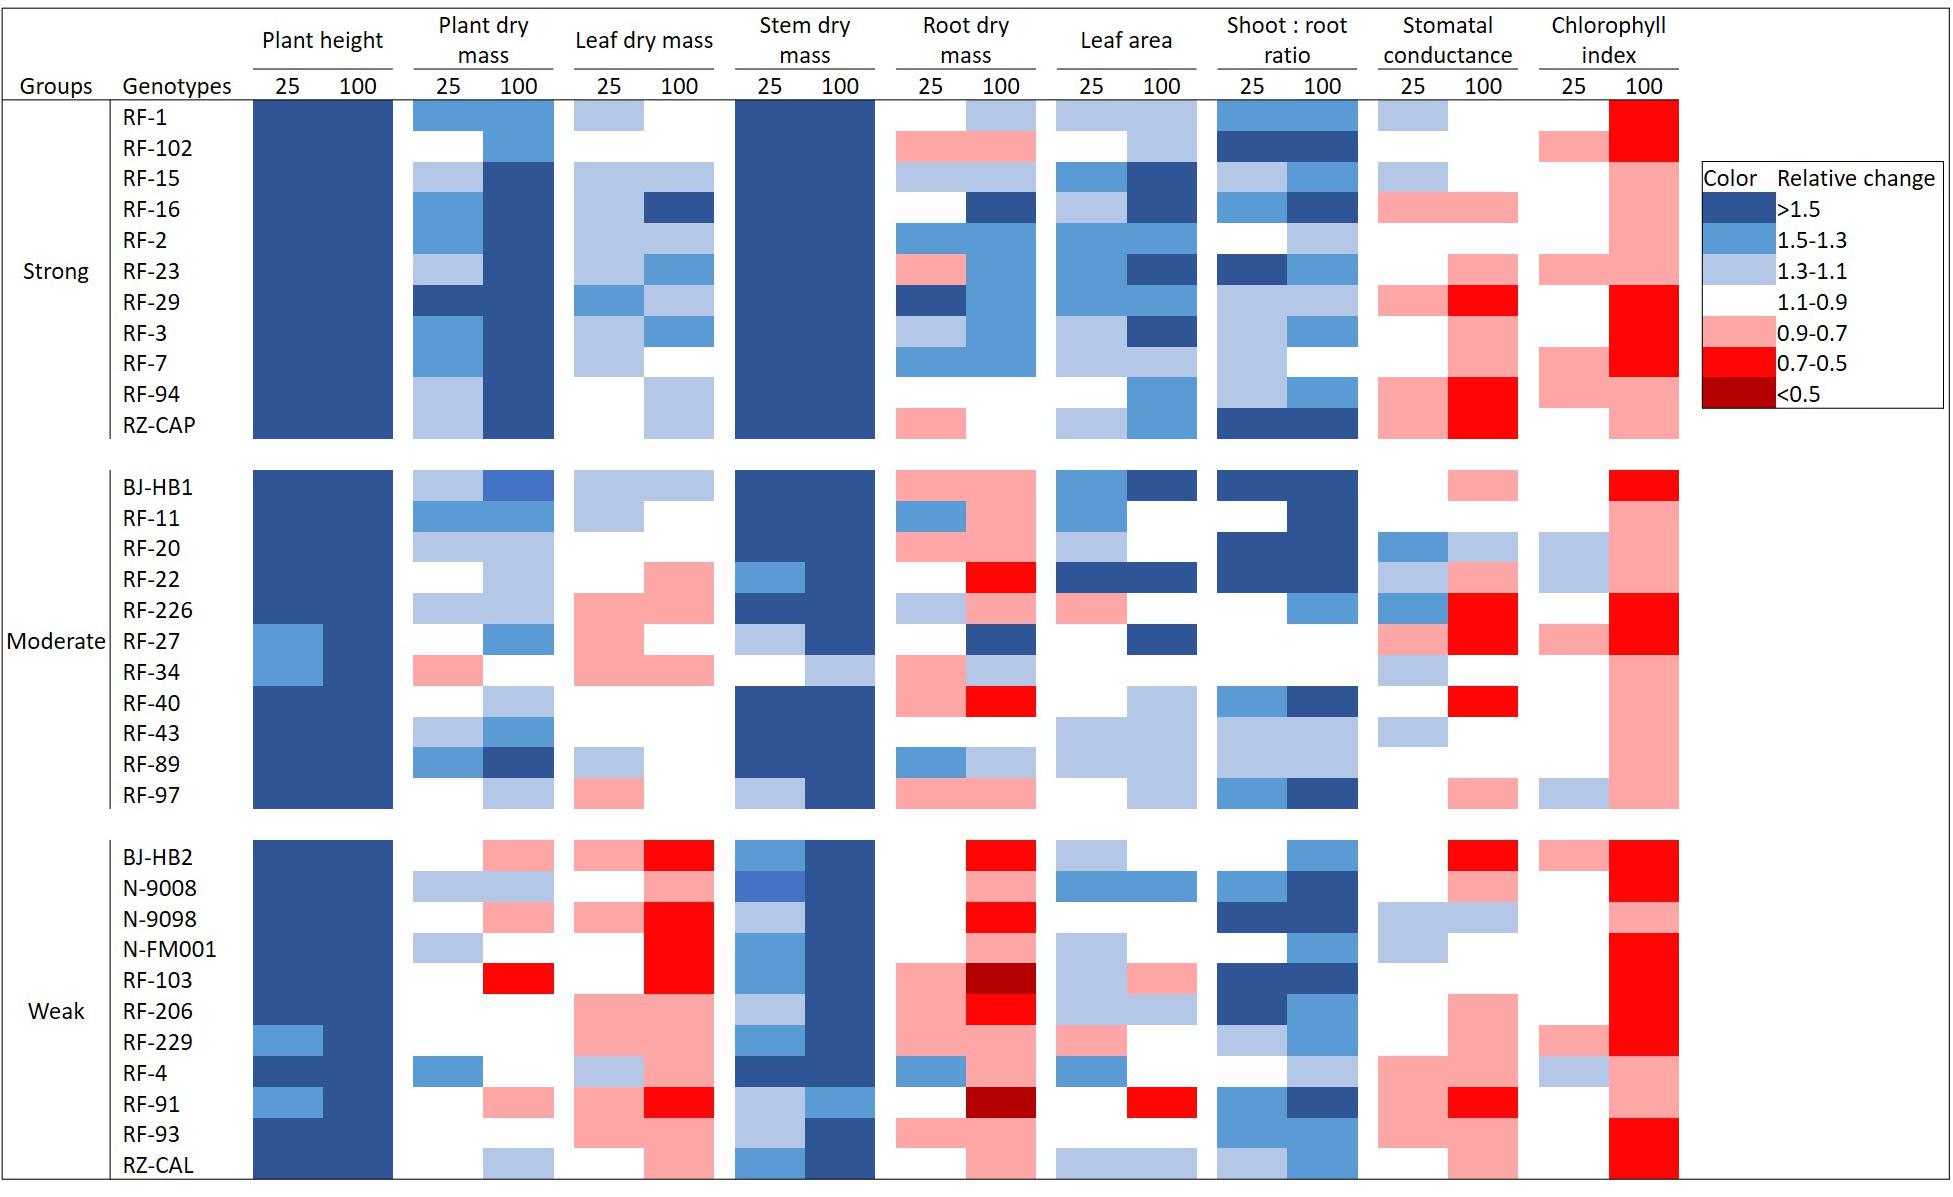
Figure 2. Effects of adding 25 or 100 μmol m–2 s–1 of far-red (FR) radiation on plant height, plant dry mass, leaf dry mass, stem dry mass, root dry mass, leaf area, shoot:root ratio, stomatal conductance, and chlorophyll index in 33 tomato genotypes. Genotypes were categorized into three groups (strongly, moderately, and weakly responding groups) based on their relative responses in total plant dry mass to FR. Color scales represent relative changes of parameters when compared with the control light treatment without FR, with blue indicating an increase under FR and red representing a decrease.
Growth Component Analysis
In order to explain the variation in the FR effect on plant dry mass production, we categorized the genotypes into three groups (i.e., strongly, moderately, and weakly responding groups; 11 genotypes in each group) based on their relative response to increasing FR in TDM (Figure 3A and Table 1). RGR, which is a common parameter used for growth component analysis, showed a similar pattern to TDM in response to increasing FR (Figure 3B). Slopes of the regression models fitted for both total dry mass and RGR showed significant differences between the three groups.
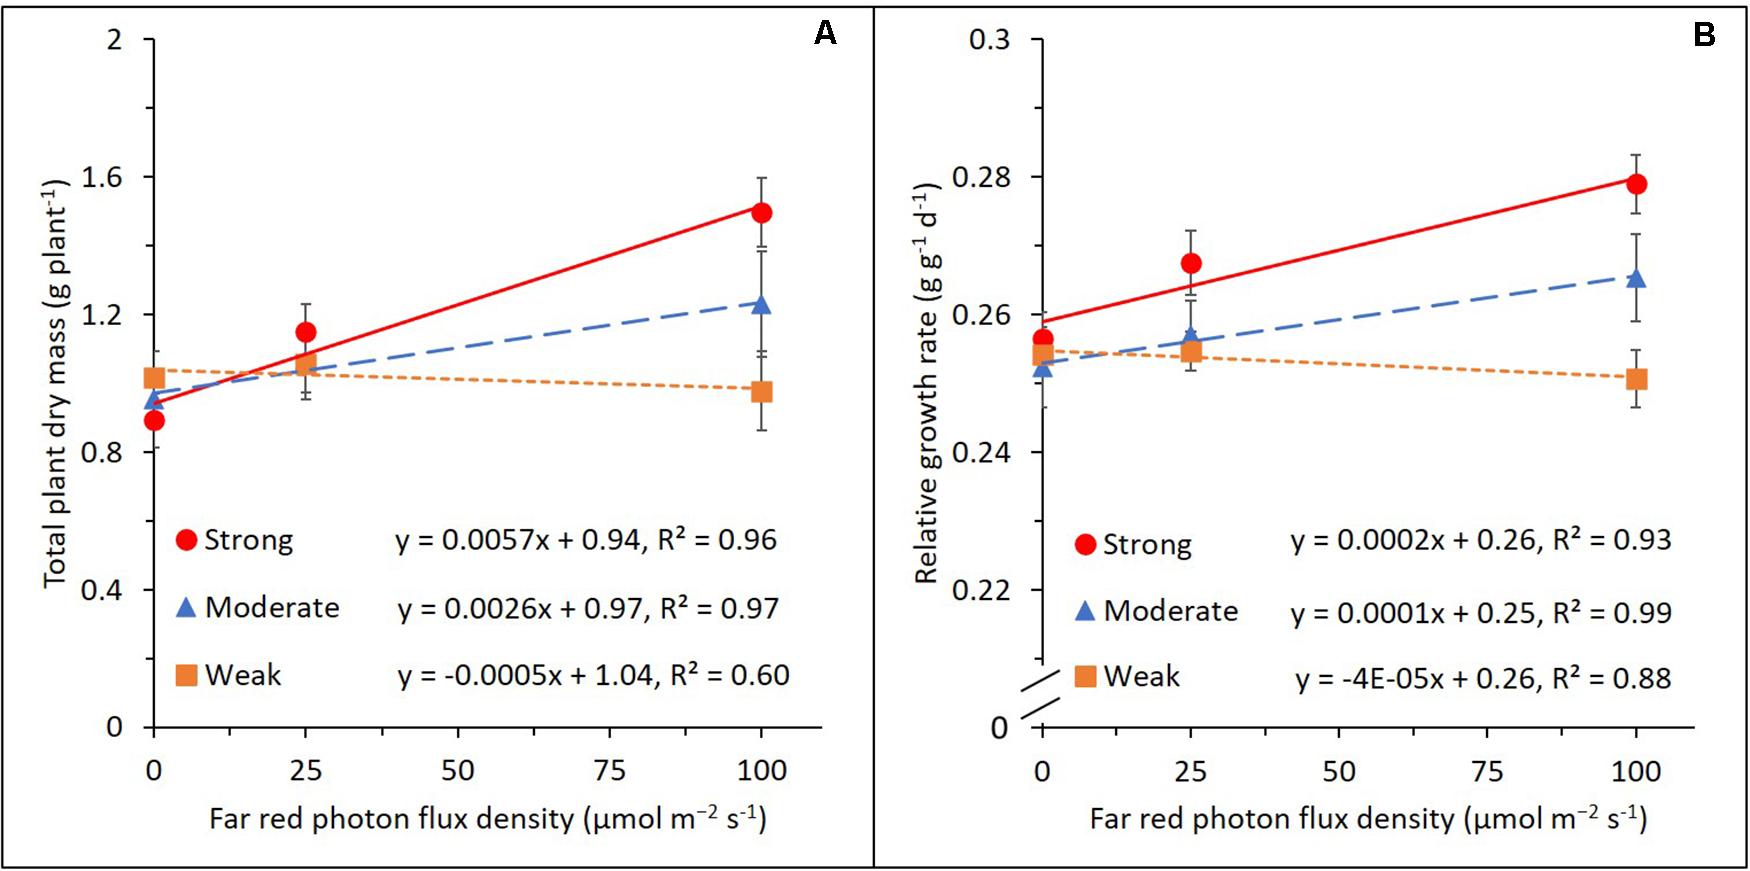
Figure 3. Effects of adding 25 or 100 μmol m–2 s–1 of far-red (FR) radiation on total plant dry mass (A) and relative plant growth rate (B) in the strongly (red circle), moderately (blue triangle), and weakly (orange rectangle) responding groups of genotypes. Lines represent linear regression. Error bars represent standard error of means (n = 8 for 0 and 100 μmol m–2 s–1 of FR and n = 16 for 25 μmol m–2 s–1 of FR).
This similarity facilitates using a growth component analysis of RGR to explain the genotypic variation in the FR effect on total dry mass (Figure 4). When 25 μmol m–2 s–1 of FR was provided, RGR and NAR increased in the strongly responding group, while both were not significantly affected in the moderately and weakly responding groups. LAR showed an opposite response to FR with a decrease in the strongly responding group and an increase in the weakly responding group. LAR was further divided into SLA and LMF. LMF decreased in all three groups by a comparable magnitude, while SLA increased with FR with the weakly responding group showing the strongest increase, followed by moderately and strongly responding groups. Similar responses of the growth components were observed when additional FR increased from 25 to 100 μmol m–2 s–1. Here, an additional 100 μmol m–2 s–1 of FR resulted in a significant increase in RGR and NAR in the strong and moderate groups, while those in the weak group were not statistically significant. Also, 100 μmol m–2 s–1 of FR decreased the LAR in the strong and moderate groups while increasing that in the weak group. This was due to the difference in the increasingly large response in SLA from strong to weak group. LMF strongly decreased with FR with only marginal differences between the three groups. For all parameters, there was a clear dosage effect as the responses became more substantial as FR increased from 25 to 100 μmol m–2 s–1. The absolute numbers of the parameters used in the component analysis are presented in Supplementary Table S2.
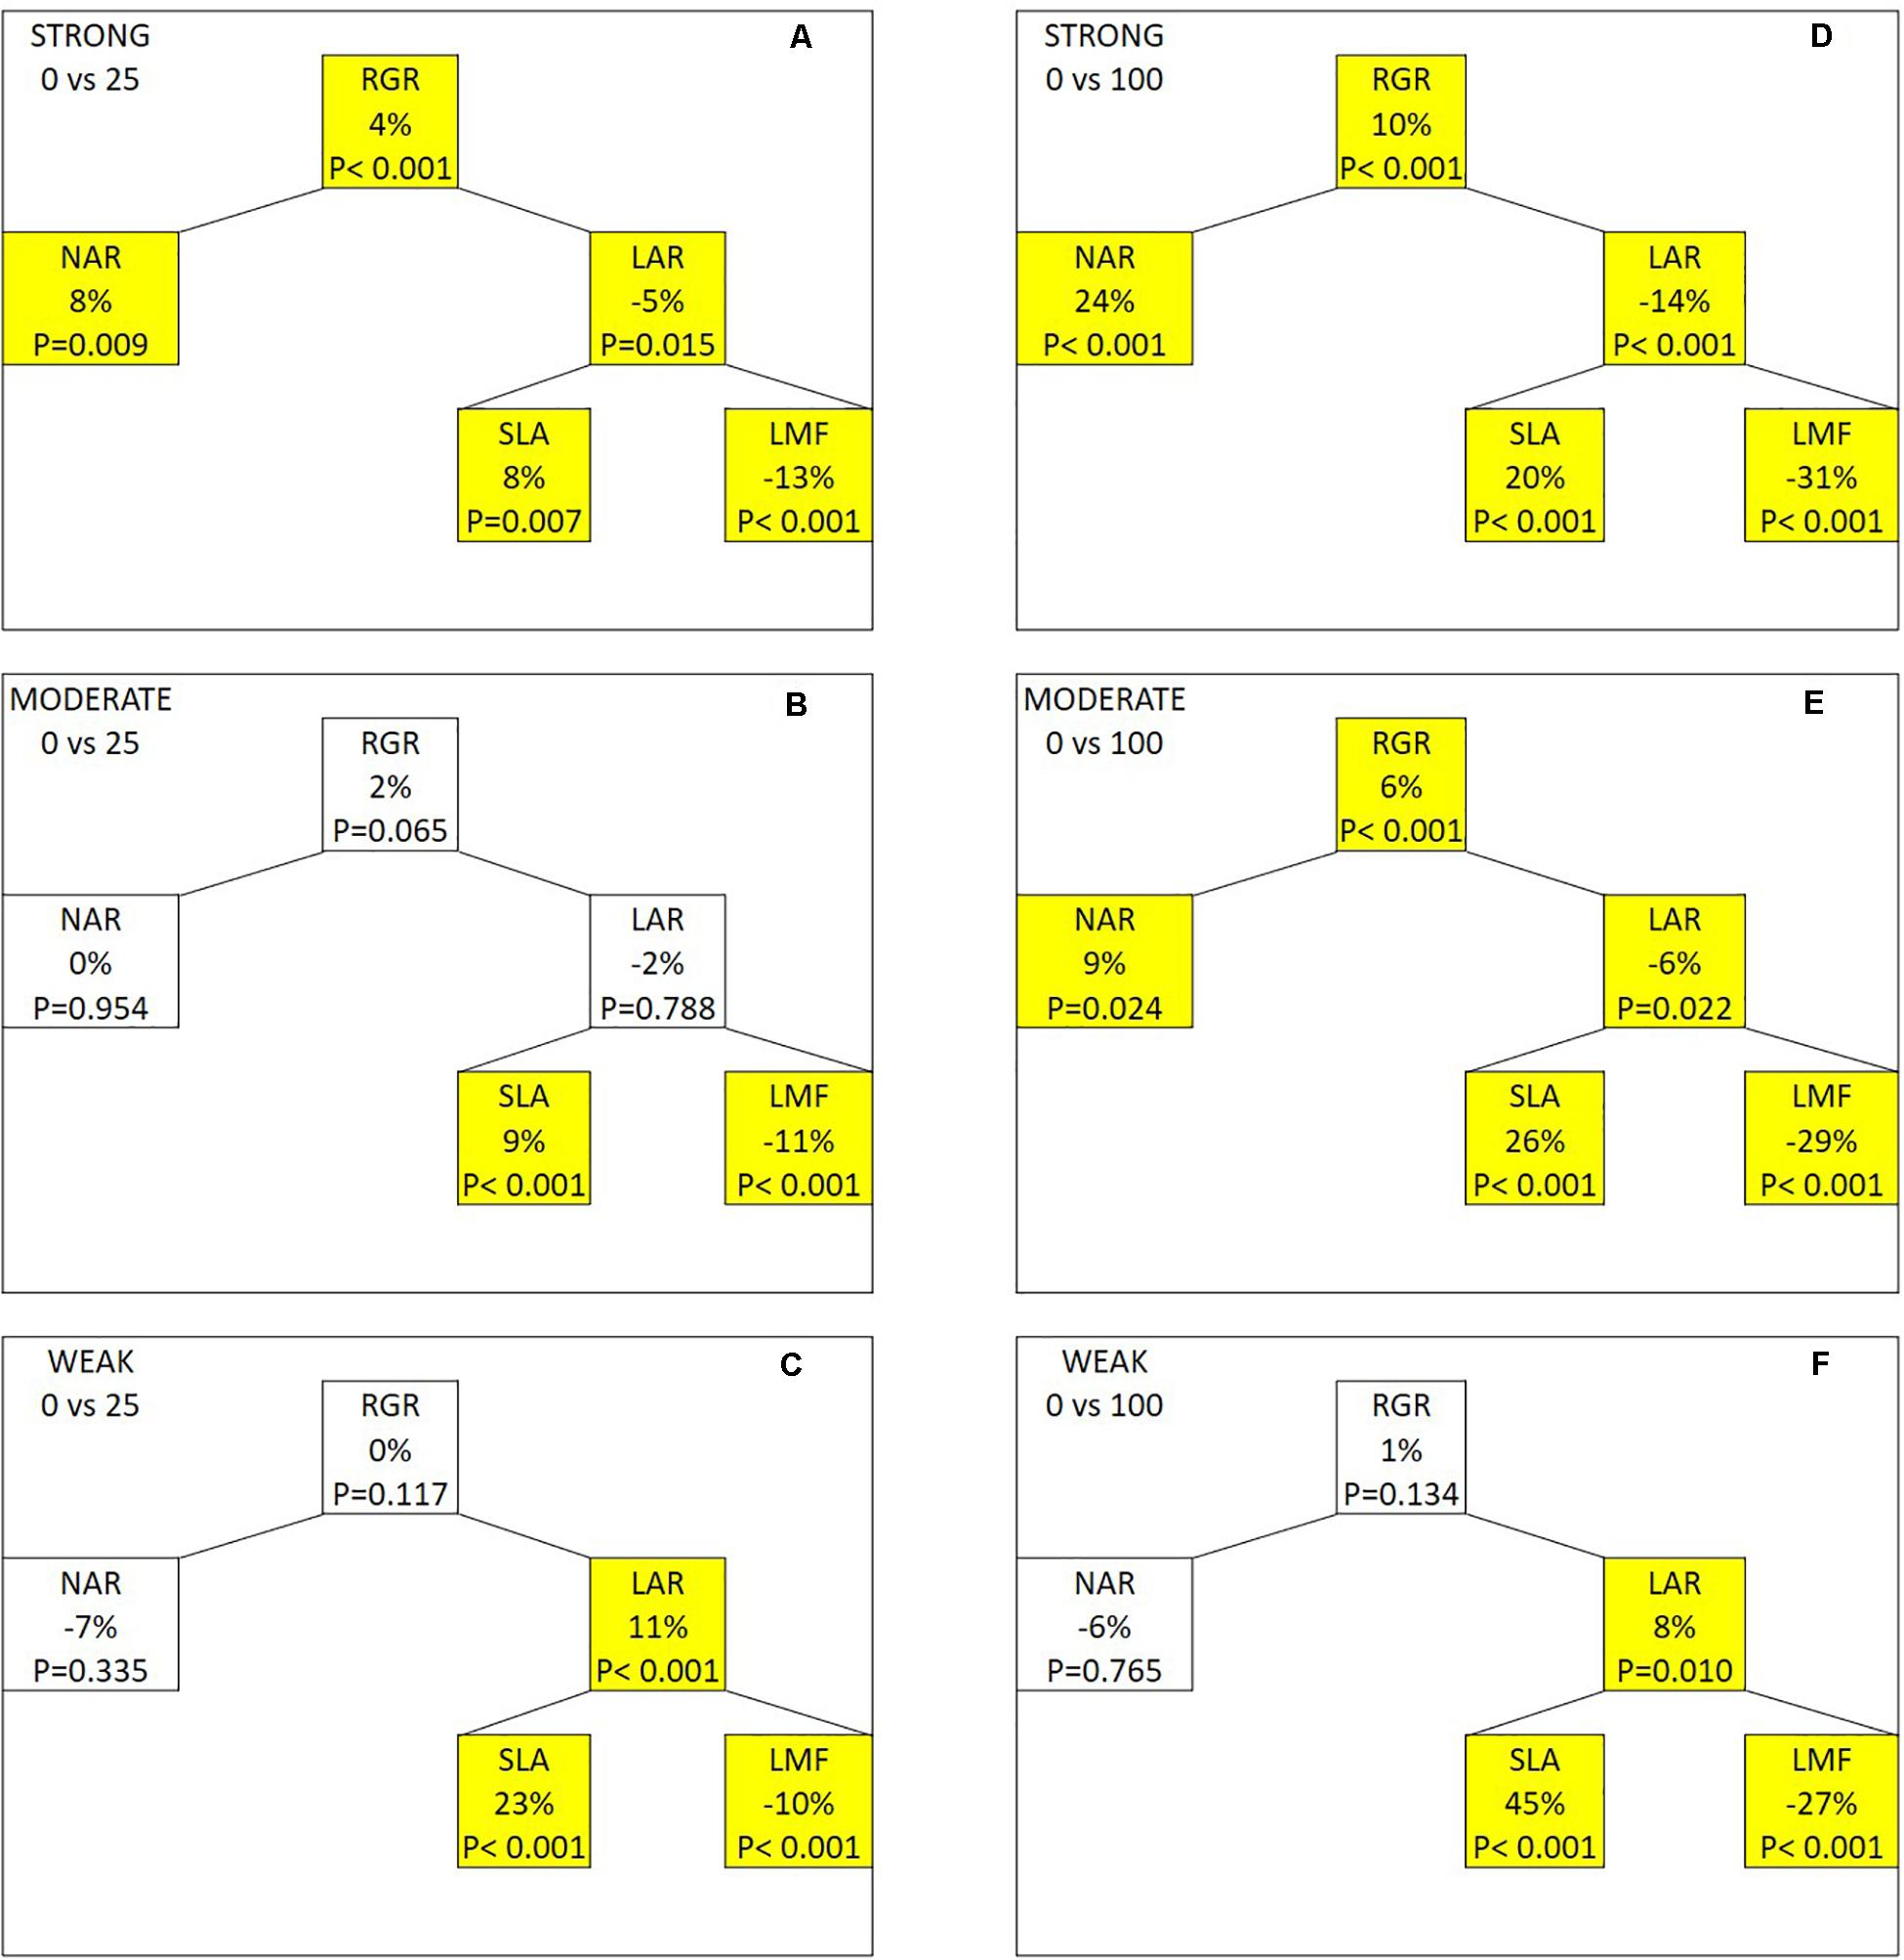
Figure 4. Effects of adding 25 (A–C) or 100 μmol m–2 s–1 of far-red (FR) radiation (D–F) on the growth components in the strongly, moderately, and weakly responding groups of genotypes. Abbreviations in this figure: RGR, relative growth rate; NAR, net assimilation rate; LAR, leaf area ratio; SLA, specific leaf area; LMF, leaf mass fraction. The percentage represents the relative change in the components when compared between the FR treatment and the control treatment. P-value of the paired t-test is indicated in each component with a significant difference (P < 0.05) being highlighted in yellow.
Discussion
Genotypic Similarities and Variations in Growth Response to Far Red
This study is the first to analyze the differences in growth responses of a large number of tomato genotypes toward FR in their light environment (Figure 2). The most distinct response to FR in many species is stem elongation, which has been reported in many species (Kasperbauer, 1971; Franklin and Quail, 2010; Kalaitzoglou et al., 2019; Shibuya et al., 2019). In agreement with this, we observed a universal increase of plant height in all 33 genotypes, and this increase in plant height was dosage dependent. Corresponding to the FR-induced stem elongation, stem dry mass also increased with FR in all genotypes, and this agreed well with other studies (Ji et al., 2019; Zhang et al., 2019). In general, responses of leaf growth to FR may vary between species and genotypes (Casal and Smith, 1989). Also in tomato, both positive (Cao et al., 2018; Zhang et al., 2019) and negative (Ji et al., 2019; Kim et al., 2019) effects of FR on leaf dry mass have been reported. Similarly, we observed that the response of leaf dry mass to FR varied among genotypes, ranging from negative to positive response when grown with FR, with a negative response being more frequent. FR stimulates the dry mass to be distributed more to the above ground, thus increasing the shoot:root ratio (Kasperbauer, 1987; Lee et al., 2016; Cao et al., 2018). In line with these results, we observed that all genotypes responded positively to increasing FR in shoot:root ratio, which may be a combined result of higher shoot (mainly stem) dry mass and a lower root dry mass. In this study, we noticed that the increase in shoot:root ratio for the strongly responding genotypes was likely due to an increase in shoot dry mass that was stronger than the increase in root dry mass. For moderately and weakly responding genotypes, this was a result of an increase in shoot dry mass combined with a decrease in root dry mass. Interestingly, FR decreased the chlorophyll index, which indicates that FR reduces chlorophyll content and suggests that photosynthetic capacity may be reduced. Similarly, decrease in chlorophyll content was also reported both in young tomato and fruiting tomato plants (Cao et al., 2018; Kalaitzoglou et al., 2019; Kim et al., 2019) as well as other crops (Tucker, 1981; Casal and Aphalo, 1989; Li and Kubota, 2009). Furthermore, despite a trend of increased TDM due to FR, the genotypic variation in the response was very noticeable when comparing the magnitude of this FR effect.
Genotypes Achieved a Stronger Increase in Dry Mass Production by the Increase in Net Assimilation Rate
We categorized the genotypes into three groups (i.e., strongly, moderately, and weakly responding groups) based on their relative response in TDM to FR (Table 1) to conduct a growth component analysis based on the breakdown of RGR (Hunt et al., 2002). RGR is the product of NAR and LAR. The strongly responding genotypes substantially increased their RGR under additional FR, followed by the moderately responding genotypes, while the weakly responding genotypes showed no significant changes in their RGR under FR (Figure 4). The increase in RGR of the strongly responding genotypes under FR was the result of an increase in NAR, but not in LAR, as it decreased with FR. FR was reported by Ji et al. (2019) and Kalaitzoglou et al. (2019) to increased SLA. Here, we found that the weakly responding genotypes showed a stronger increase in SLA than did other genotypes. LMF, the other component of LAR, was significantly decreased for all groups, and the response did not differ between groups and was only dependent on the amount of FR. The dry mass partitioning between organs is regulated by the relative sink strength of the organs (Marcelis, 1996). The decreased LMF may be due to the strong enhancement of stem sink strength under FR, causing less dry mass to be partitioned to the leaves. For both the strongly and weakly responding groups, their responses to FR were in accordance with the known SAS responses. Our result suggests that when grown under additional FR, tomato plants are not likely to be able to increase NAR and LAR simultaneously, and that the genotypes with a strong increase in NAR under FR allowed them to achieve a stronger increase in RGR than did other genotypes.
Possible Mechanism of Far-Red Enhancement in Net Assimilation Rate
One explanation for the FR-increased NAR may be that the morphology of plants grown with FR contributed to better vertical distribution of light. FR increases the internode length in tomato, which may lead to a more open plant architecture. Indeed, up to 10% of increase in canopy photosynthesis was achieved in a model simulation by increasing internode length in tomato (Sarlikioti et al., 2011). Also, NAR represents largely the net carbon gain from photosynthesis (Poorter and Remkes, 1990). FR enhances the quantum yield of PAR (400–700 nm) in various species (Zhen and van Iersel, 2017; Zhen and Bugbee, 2020). Such an improvement in photosynthesis agrees with our finding that FR increases NAR. However, their studies focused on short-term light treatments. Experiments with plants grown or adapted to additional FR showed varying results. For example, Kalaitzoglou et al. (2019) found that a 4-week growth period with additional FR resulted in a higher net leaf photosynthesis rate (A) when 50 μmol m–2 s–1 of FR was added to 150 μmol m–2 s–1 PAR. Cao et al. (2018), however, reported no significant differences in A using a comparable spectrum. In addition, no significant FR effect on A was reported for tomato plants grown with prolonged exposure to additional FR until fruiting stage (Ji et al., 2019; Zhang et al., 2019). This may indicate that the short-term FR enhancement in photosynthesis cannot fully explain the increase in NAR either, especially when considering the decrease in chlorophyll index (Figure 2; Li and Kubota, 2009; Cao et al., 2018; Kalaitzoglou et al., 2019) and a decreased photosynthetic capacity (Ji et al., 2019). FR may also reduce the photosynthetic rate via the phyB-mediated downregulation of genes such as FAMA and TMM in Arabidopsis, leading to the reduction of stomata development (Boccalandro et al., 2009). This reduction, however, may be compensated by the increase in water-use efficiency. To date, there is still insufficient evidence to fully dissect the effect of FR on the NAR due to the complex interaction between the underlying morphological and physiological components. We do, however, speculate that the effect of FR (positive, neutral, or negative) on net photosynthesis rate, light interception, and light distribution varies and that it is the combined effect that determines the NAR.
Conclusion
Genotypes responded similarly with respect to plant height, stem dry mass, and shoot:root ratio. However, the response of TDM varied among genotypes. Here, we demonstrated that it was the differences in genotype’s responses in NAR and LAR that explain the genotypic variation in response to total dry mass. Genotypes with a strong increase in RGR with increasing FR showed a strong increase in NAR rather than LAR. The weakly responding genotypes, however, showed a substantial increase in LAR but not NAR. The genotypic differences in the increase in LAR were mainly due to the genotypic differences in the increase in SLA, while the responses of LMF to FR were conserved between genotypes.
Data Availability Statement
The raw data supporting the conclusions of this article will be made available by the authors, without undue reservation.
Author Contributions
YJ wrote the manuscript. YJ and TO conducted the experiment and conducted the analysis. LM and EH initiated this work and obtained funding for this research, provided guidance in the experimental design and data analysis, and provided critical comments on the manuscript. HS and RV provided critical comments to the overall structure of the manuscript. All authors reviewed and approved the final manuscript.
Funding
This research is part of the “LED it be 50%” program and was supported by Glastuinbouw Nederland, BASF Vegetable Seeds, Rijk Zwaan, Signify, WUR Greenhouse Horticulture, and the Netherlands Organization for Scientific Research (NWO), which is partly funded by the Ministry of Economic Affairs.
Conflict of Interest
The authors declare that the research was conducted in the absence of any commercial or financial relationships that could be construed as a potential conflict of interest.
Acknowledgments
We thank E. de Beer, E. Nieland, and E. Onac of Signify for the support in the design of the LED lighting system. We thank A. Maassen, S. Geurts, G. Versteeg, W. van der Slikke, T. Stoker, G. Stunnenberg, and C. Tebarts for their technical support.
Supplementary Material
The Supplementary Material for this article can be found online at: https://www.frontiersin.org/articles/10.3389/fpls.2020.614714/full#supplementary-material
References
Aflitos, S., Schijlen, E., De Jong, H., De Ridder, D., Smit, S., Finkers, R., et al. (2014). Exploring genetic variation in the tomato (Solanum Section Lycopersicon) clade by whole-genome sequencing. Plant J. 80, 136–148. doi: 10.1111/tpj.12616
Boccalandro, H. E., Rugnone, M. L., Moreno, J. E., Ploschuk, E. L., Serna, L., Yanovsky, M. J., et al. (2009). Phytochrome B enhances photosynthesis at the expense of water-use efficiency in Arabidopsis. Plant Physiol. 150, 1083–1092. doi: 10.1104/pp.109.135509
Cao, K., Yu, J., Xu, D., Ai, K., Bao, E., and Zou, Z. (2018). Exposure to lower red to far-red light ratios improve tomato tolerance to salt stress. BMC Plant Biol. 18:92. doi: 10.1186/s12870-018-1310-9
Casal, J. J., and Aphalo, P. J. (1989). Phytochrome control of chlorophyll content in mature attached leaves of petunia axillaris. Ann. Bot. 63, 595–598. doi: 10.1093/oxfordjournals.aob.a087785
Casal, J. J., and Smith, H. (1989). The function, action and adaptive significance of phytochrome in light-grown plants. Plant Cell Environ. 12, 855–862. doi: 10.1111/j.1365-3040.1989.tb01966.x
Chen, M., Tao, Y., Lim, J., Shaw, A., and Chory, J. (2005). Regulation of phytochrome B nuclear localization through light-dependent unmasking of nuclear-localization signals. Curr. Biol. 15, 637–642. doi: 10.1016/j.cub.2005.02.028
Demotes-Mainard, S., Péron, T., Corot, A., Bertheloot, J., Le Gourrierec, J., Pelleschi-Travier, S., et al. (2016). Plant responses to red and far-red lights, applications in horticulture. Environ. Exp. Bot. 121, 4–21. doi: 10.1016/j.envexpbot.2015.05.010
Devlin, P. F. (1998). Phytochrome E influences internode elongation and flowering time in Arabidopsis. Plant Cell Online 10, 1479–1488. doi: 10.1105/tpc.10.9.1479
Emerson, R., Chalmers, R., and Cederstrand, C. (1957). Some factors influencing the long-wave limit of photosynthesis. Proc. Natl. Acad. Sci. U.S.A. 43, 133–143. doi: 10.1073/pnas.43.1.133
Emerson, R., and Rabinowitch, E. (1960). Red drop and role of auxiliary pigments in photosynthesis. Plant Physiol. 35, 477–485. doi: 10.1104/pp.35.4.477
Franklin, K. A., and Quail, P. H. (2010). Phytochrome functions in Arabidopsis development. J. Exp. Bot. 61, 11–24. doi: 10.1093/jxb/erp304
Govindjee, R., and Govindjee Hoch, G. (1964). Emerson enhancement effect in chloroplast reactions. Plant Physiol. 39, 10–14. doi: 10.1104/pp.39.1.10
Higashide, T., and Heuvelink, E. (2019). Physiological and morphological changes over the past 50 years in yield components in tomato. J. Am. Soc. Hortic. Sci. 134, 460–465. doi: 10.21273/jashs.134.4.460
Huber, H., and Wiggerman, L. (1997). Shade avoidance in the clonal herb Trifolium fragiferum: a field study with experimentally manipulated vegetation height. Plant Ecol. 130, 53–62. doi: 10.1023/A:1009702611270
Hunt, R., Causton, D. R., Shipley, B., and Askew, A. P. (2002). A modern tool for classical plant growth analysis. Ann. Bot. 90, 485–488. doi: 10.1093/aob/mcf214
Ji, Y., Nuñez Ocaña, D., Choe, D., Larsen, D. H., Marcelis, L. F. M., and Heuvelink, E. (2020). Far-red radiation stimulates dry mass partitioning to fruits by increasing fruit sink strength in tomato. New Phytol. 228, 1914–1925. doi: 10.1111/nph.16805
Ji, Y., Ouzounis, T., Courbier, S., Kaiser, E., Nguyen, P. T., Schouten, H. J., et al. (2019). Far-red radiation increases dry mass partitioning to fruits but reduces Botrytis cinerea resistance in tomato. Environ. Exp. Bot. 168:103889. doi: 10.1016/j.envexpbot.2019.103889
Jolliffe, P. A., and Courtney, W. H. (1984). Plant growth analysis: additive and multiplicative components of growth. Ann. Bot. 54, 243–254. doi: 10.1093/oxfordjournals.aob.a086788
Kalaitzoglou, P., van Ieperen, W., Harbinson, J., van der Meer, M., Martinakos, S., Weerheim, K., et al. (2019). Effects of continuous or end-of-day far-red light on tomato plant growth, morphology, light absorption, and fruit production. Front. Plant Sci. 10:322. doi: 10.3389/fpls.2019.00322
Kasperbauer, M. J. (1971). Spectral distribution of light in a tobacco canopy and effects of end-of-day light quality on growth and development. Plant Physiol. 47, 775–778. doi: 10.1104/pp.47.6.775
Kasperbauer, M. J. (1987). Far-Red light reflection from green leaves and effects on phytochrome-mediated assimilate partitioning under field conditions. Plant Physiol. 85, 350–354. doi: 10.1104/pp.85.2.350
Kim, H. J., Lin, M. Y., and Mitchell, C. A. (2019). Light spectral and thermal properties govern biomass allocation in tomato through morphological and physiological changes. Environ. Exp. Bot. 157, 228–240. doi: 10.1016/j.envexpbot.2018.10.019
Kono, M., Kawaguchi, H., Mizusawa, N., Yamori, W., Suzuki, Y., and Terashima, I. (2020). Far-Red light accelerates photosynthesis in the low-light phases of fluctuating light. Plant Cell Physiol. 61, 192–202. doi: 10.1093/pcp/pcz191
Lee, M. J., Son, K. H., and Oh, M. M. (2016). Increase in biomass and bioactive compounds in lettuce under various ratios of red to far-red LED light supplemented with blue LED light. Hortic. Environ. Biotechnol. 57, 139–147. doi: 10.1007/s13580-016-0133-6
Li, Q., and Kubota, C. (2009). Effects of supplemental light quality on growth and phytochemicals of baby leaf lettuce. Environ. Exp. Bot. 67, 59–64. doi: 10.1016/j.envexpbot.2009.06.011
Marcelis, L. F. M. (1996). Sink strength as a determinant of dry matter partitioning in the whole plant. J. Exp. Bot. 47, 1281–1291. doi: 10.1093/jxb/47.Special_Issue.1281
Michaud, O., Fiorucci, A.-S., Xenarios, I., and Fankhauser, C. (2017). Local auxin production underlies a spatially restricted neighbor-detection response in Arabidopsis. Proc. Natl. Acad. Sci.U.S.A. 114, 7444–7449. doi: 10.1073/pnas.1702276114
Ouzounis, T., Heuvelink, E., Ji, Y., Schouten, H. J., Visser, R. G. F., and Marcelis, L. F. M. (2016). Blue and red LED lighting effects on plant biomass, stomatal conductance, and metabolite content in nine tomato genotypes. Acta Hortic. 1134, 251–258. doi: 10.17660/ActaHortic.2016.1134.34
Park, Y., and Runkle, E. S. (2017). Far-red radiation promotes growth of seedlings by increasing leaf expansion and whole-plant net assimilation. Environ. Exp. Bot. 136, 41–49. doi: 10.1016/j.envexpbot.2016.12.013
Poorter, H., and Remkes, C. (1990). Leaf area ratio and net assimilation rate of 24 wild species differing in relative growth rate. Oecologia 83, 553–559.
Sager, J. C., Smith, W. O., Edwards, J. L., and Cyr, K. L. (1988). Photosynthetic efficiency and phytochrome photoequilibria determination using spectral data. Trans. Am. Soc. Agric. Eng. 31, 1882–1889. doi: 10.13031/2013.30952
Sarlikioti, V., de Visser, P. H. B., Buck-Sorlin, G. H., and Marcelis, L. F. M. (2011). How plant architecture affects light absorption and photosynthesis in tomato: towards an ideotype for plant architecture using a functional–structural plant model. Ann. Bot. 108, 1065–1073. doi: 10.1093/aob/mcr221
Shibuya, T., Kishigami, S., Endo, R., and Matsuda, R. (2019). Interaction between red to far-red ratio of light and vapor-pressure deficit on extension growth of cucumber seedlings. Sci. Hortic. (Amsterdam) 248, 98–104. doi: 10.1016/j.scienta.2018.12.049
Tucker, D. J. (1981). Phytochrome regulation of leaf senescence in cucumber and tomato. Plant Sci. Lett. 23, 103–108. doi: 10.1016/0304-4211(81)90031-6
Yang, D., Seaton, D. D., Krahmer, J., and Halliday, K. J. (2016). Photoreceptor effects on plant biomass, resource allocation, and metabolic state. Proc. Natl. Acad. Sci.U.S.A. 113, 7667–7672. doi: 10.1073/pnas.1601309113
Zhang, Y., Zhang, Y., Yang, Q., and Li, T. (2019). Overhead supplemental far-red light stimulates tomato growth under intra-canopy lighting with LEDs. J. Integr. Agric. 18, 62–69. doi: 10.1016/S2095-3119(18)62130-6
Zhen, S., and Bugbee, B. (2020). Far-red photons have equivalent efficiency to traditional photosynthetic photons: Implications for redefining photosynthetically active radiation. Plant Cell Environ. 43, 1259–1272. doi: 10.1111/pce.13730
Keywords: far red, genotypic variation, growth analysis, LED lighting, Solanum lycopersicum
Citation: Ji Y, Ouzounis T, Schouten HJ, Visser RGF, Marcelis LFM and Heuvelink E (2021) Dissecting the Genotypic Variation of Growth Responses to Far-Red Radiation in Tomato. Front. Plant Sci. 11:614714. doi: 10.3389/fpls.2020.614714
Received: 06 October 2020; Accepted: 11 December 2020;
Published: 13 January 2021.
Edited by:
María Serrano, Miguel Hernández University of Elche, SpainReviewed by:
Bodie Pennisi, University of Georgia, United StatesMohammad R. Sabzalian, Isfahan University of Technology, Iran
Gerhard Buck-Sorlin, Agrocampus Ouest, France
Copyright © 2021 Ji, Ouzounis, Schouten, Visser, Marcelis and Heuvelink. This is an open-access article distributed under the terms of the Creative Commons Attribution License (CC BY). The use, distribution or reproduction in other forums is permitted, provided the original author(s) and the copyright owner(s) are credited and that the original publication in this journal is cited, in accordance with accepted academic practice. No use, distribution or reproduction is permitted which does not comply with these terms.
*Correspondence: Leo F. M. Marcelis, bGVvLm1hcmNlbGlzQHd1ci5ubA==
 Yongran Ji
 Theoharis Ouzounis
 Henk J. Schouten
 Richard G. F. Visser
 Leo F. M. Marcelis
 Ep Heuvelink