 Kosaku Masuda
 Tatsuya Yamada1
 Hirokazu Fukuda
95% of researchers rate our articles as excellent or good
Learn more about the work of our research integrity team to safeguard the quality of each article we publish.
Find out more
ORIGINAL RESEARCH article
Front. Plant Sci. , 11 February 2021
Sec. Plant Physiology
Volume 11 - 2020 | https://doi.org/10.3389/fpls.2020.614360
This article is part of the Research Topic Plant Responses to the Dark Scenario View all 11 articles
Plant growth responses to cues such as light, temperature, and humidity enable the entrainment of the circadian rhythms with diurnal cycles. For example, the temperature variations between day and night affect plant growth and accompany the time lag to light cycle. Despite its importance, there has been no systematic investigation into time lags, and the mechanisms behind the entrainment of the circadian rhythms with multiple cycles remain unknown. Here, we investigated systemically the effects of the time lag on the circadian rhythm and growth in Arabidopsis thaliana. To investigate the entrainment status of the circadian clock, the rhythm of the clock gene CIRCADIAN CLOCK ASSOCIATION 1 (CCA1) was measured with a luciferase reporter assay. As a result, the rhythm was significantly modulated by the time lag with +10°C heating for 4 h every day but not −10°C cooling. A model based on coupled cellular oscillators successfully described these rhythm modulations. In addition, seedling growth depended on the time lag of the heating cycle but not that of the cooling cycle. Based on the relationship between the CCA1 rhythms and growth, we established an estimation method for the effects of the time lag. Our results found that plant growth relates to the CCA1 rhythm and provides a method by which to estimate the appropriate combination of light–dark and temperature cycles.
Organisms on earth have been found to have circadian clocks that are adapted to 24 h periods for environmental cycles. This includes plants, whose circadian clocks have important roles in various physiological processes, such as photosynthesis and flowering (Dodd et al., 2014; Creux and Harmer, 2019). The plant circadian clock responds to environmental changes and is entrained by the diurnal light–dark cycle (Webb et al., 2019). Entrainment to the light–dark cycle provides some advantages to plants, namely, circadian resonance, in which plants grow larger in an environment with periods that are similar to the intrinsic period of the circadian clock (Dodd et al., 2005; Higashi et al., 2015; Resco de Dios et al., 2016).
In nature and horticultural practices, the light–dark cycle is usually accompanied by a temperature cycle, which is associated with a day temperature that is higher than the night temperature. The temperature cycle is another strong entrainment cue (zeitgeber) for the plant circadian clock. In horticultural studies, the phase differences between light and temperature cycles have been found to have crucial effects on plant growth. Most plants exhibit optimal growth with the in-phase regime, in which the day temperature is higher than the night temperature (which we have termed +DIF) (Xiong et al., 2011, Xiao et al., 2018). The antiphase regime, that is, when the night temperature is higher than the day temperature (which we have termed −DIF), suppresses the elongation growth of the stems and the leaves of various plant species (Thingnaes et al., 2003; Xiong et al., 2011). Therefore, +DIF conditions are preferable for plant growth. However, time lags between light and temperature cycles can frequently occur due to unsettled weather. Furthermore, in horticultural facilities, the time lag is also artificially generated by supplemental lighting at night or cooling during the day (Anpo et al., 2018; Kozai et al., 2019). The spatial unevenness under lighting or air conditioning and the thermal conductivity of air and soil/water might also generate a spatial time lag in DIF. As such time lags might affect plant production yields, the elucidation of their effects is required to improve horticultural practices. However, there has been no systematic investigation into the time lag of temperature cycles and the entrainment behavior of circadian rhythms under dual-zeitgeber cycles.
Variations in the circadian rhythm due to environmental stimuli have been addressed using the phase response curve (PRC) (Johnson et al., 2003). The PRC describes the extent of phase shift as a function of the phase with a stimulus. This provides significant information for entrainment, for example, the entrainment range and stable locking phase for environmental cycles (Johnson et al., 2003; Granada et al., 2009). In previous studies, PRCs for darkness and temperature stimuli have been reported (Michael et al., 2003; Fukuda et al., 2008; Thines and Harmon, 2010). If the application duration of the stimulus is sufficiently short (e.g., heating for 4 h), the effect of the stimulus will be relatively weak on the circadian rhythm (Masuda et al., 2021). Consequently, the rhythm can be modulated to various forms by using weak stimuli. This modulation can be estimated numerically using a phase oscillator model (Fukuda et al., 2013). In contrast, if the duration of the applied stimulus is long, the effects are too strong to modulate the circadian rhythm into various forms. Therefore, to elucidate the rhythm modulation using dual zeitgebers, it is appropriate that the duration of the temperature stimuli be short.
In this study, the promoter activity rhythms of CIRCADIAN CLOCK ASSOCIATED1 (CCA1) were measured to investigate the effects of time lags on the circadian rhythm. CCA1 is one of the core clock genes of the plant circadian clock and is closely related to stress responses (Lai et al., 2012). In addition, the PRC of the CCA1 rhythms for various stimuli have been measured in previous studies (Fukuda et al., 2008; Ohara et al., 2015; Masuda et al., 2017, 2021). We analyzed the CCA1 rhythm in Arabidopsis thaliana under long-day conditions (L/D = 16/8 h) with periodic temperature stimuli (±10°C for 4 h). To elucidate the modulation of the CCA1 rhythms using this time lag, we simulated numerically the rhythm using a phase oscillator model. In addition, we also measured the fresh weight of the seedlings and their leaf area to evaluate the effects of time lag on seedling growth.
To investigate the CCA1 rhythms in each individual, we utilized transgenic A. thaliana CCA1::LUC, which carries luciferase reporters driven by the promoters of the clock gene CCA1 (Nakamichi et al., 2004). Plants were grown on gellan gum-solidified Murashige–Skoog medium (MS Plant Salt Mixture, Wako Chemical Co.) at the standard concentration with 2% (w/v) sucrose in 40-mm-diameter dishes (one individual per dish) under L/D = 12/12 h and 100 μmol m–2 s–1 fluorescent white light at 22 ± 0.5°C for 7 days. The plants were treated with 500 μl of 1 mM luciferin (D-Luciferin Firefly, potassium salt, BIOSYNTH AG, in water) 24 h before the start of bioluminescence monitoring. Bioluminescence measurements were carried out using an automatic luminescence measuring system known as Kondotron with 20 plants under light-emitting diode (LED) illumination with a red LED (60 μmol m–2 s–1 light conditions, λp = 660 nm) and blue LED (15 μmol m–2 s–1 under light conditions, λp = 470 nm) at 22 ± 0.5°C for 7 days (Kondo et al., 1993; Fukuda et al., 2008). The photoperiod was set to L/D = 16/8 h, and the first dark period was started 16 h after the beginning of the measurements as an in-phase initial condition. Periodic temperature stimuli (+10 or −10°C from 22°C for 4 h within a 24 h period) were applied with four time lags (Δt = 2, 8, 14, and 20 h after turning on the light, referred to as “light on”), as shown in Figure 1A. In addition, as an antiphase initial condition, the first dark period was started 4 h after the measurements began, where the CCA1 rhythm started with an inversed phase to the light–dark cycle. As controls, experiments were also performed using L/D = 16/8 h conditions under both in-phase and antiphase initial conditions at 22°C without temperature cycles. The heating and the control of the in-phase initial conditions were carried out once. The cooling and the control of the antiphase initial conditions were repeated two times. After measuring the bioluminescence, we measured plant size using both fresh weight of the areal part and projected leaf area (PLA) (Figure 1B), to evaluate the effects on productivity for commercial agriculture (Kozai et al., 2019).
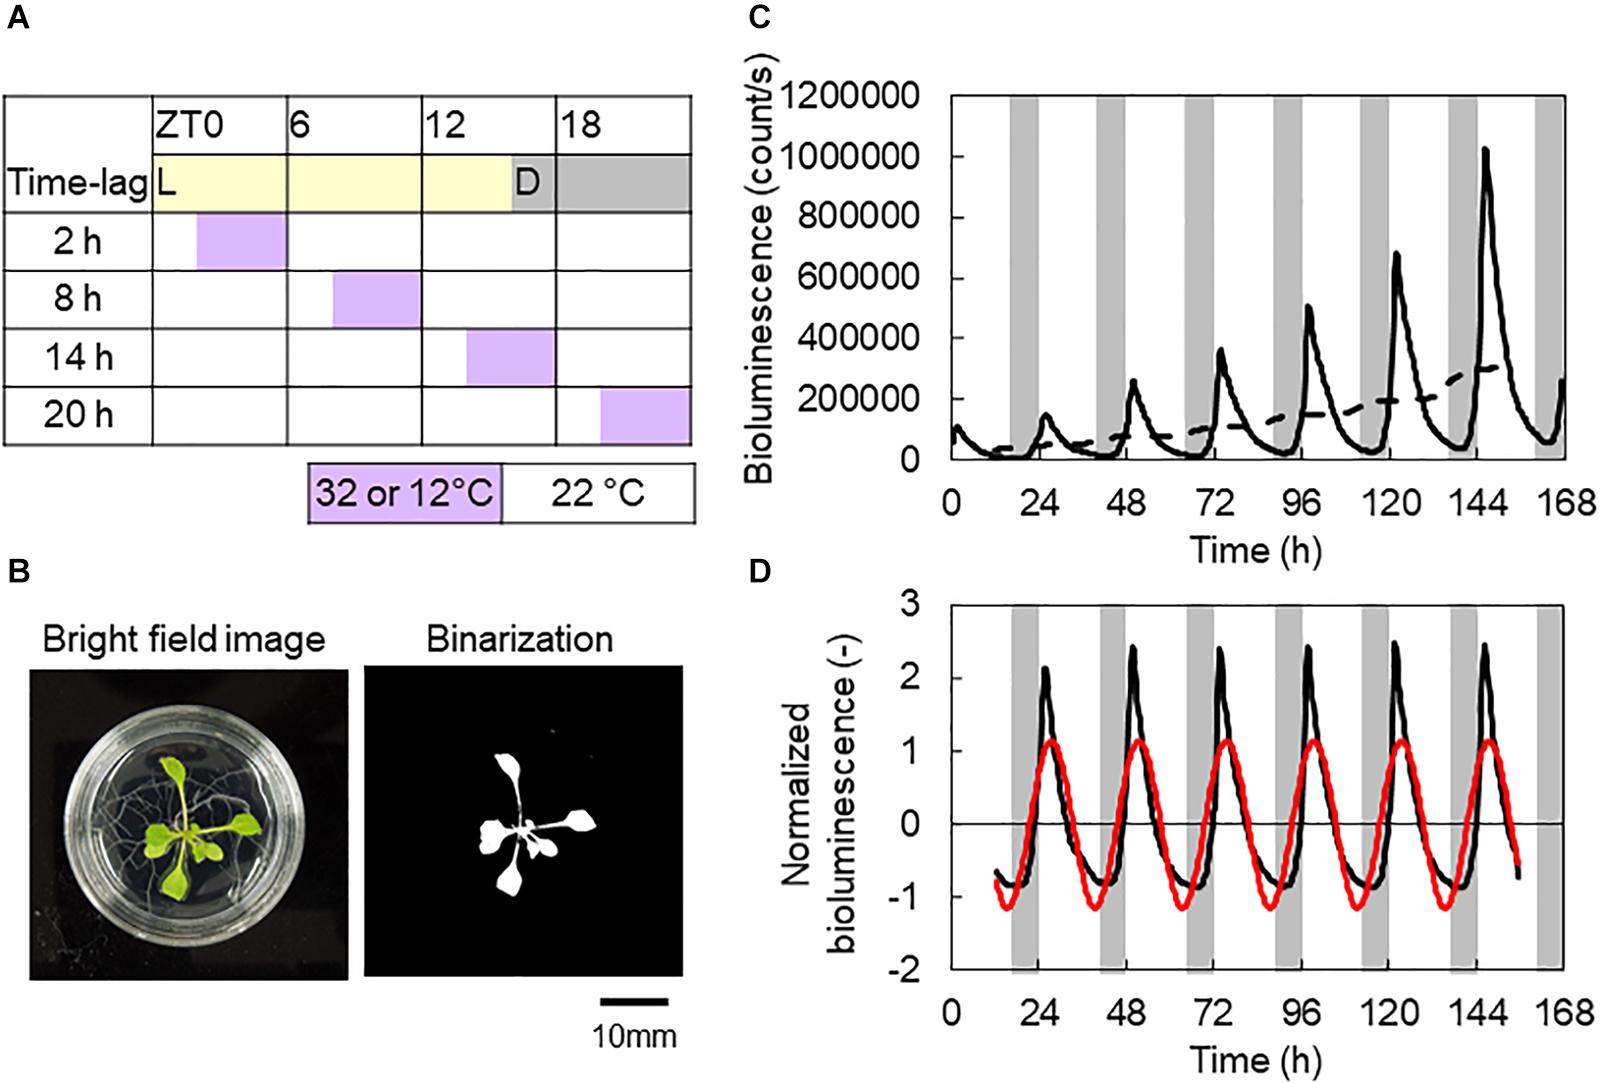
Figure 1. Experimental conditions and representative analysis data. (A) Time table of L/D = 16/8 h and 4 h ± 10°C conditions. (B) Bright-field and binarization images of an Arabidopsis thaliana seedling. Projected leaf area (PLA) measured by banalization of the areal part. (C) Bioluminescence of a CCA1::LUC seedling. Solid and broken lines are raw data and its moving average, respectively. (D) Normalized bioluminescence (black line) and the first Fourier series (red line). Data were from control conditions with in-phase initial conditions (B–D).
Bioluminescence of the CCA1 rhythm was initially normalized as follows:
where li is the ith time point of bioluminescence and is the moving averaged bioluminescence (Figure 1C). w is the half window size of the moving average. The measurement intervals were 20 min, so w was set to 36 for the 24 h window averaging. Li is the normalized bioluminescence (Figure 1D).
Then, to determine the amplitude and phase of the CCA1 rhythm, we obtained the first Fourier series, A cos θ(t), of Li (red cosine curve in Figure 1D). The first Fourier component was obtained with the following equations:
where T = 24 h and the measurement interval Δs = 1/3 h. h is the number of the time course data. Using a1 and b1, the amplitude A and phase θ(t) were determined as follows:
where θ1 indicates the phase delay in the CCA1 rhythm in response to the light–dark cycles, that is, the locking phase, which appeared at light-on [θ(0) = −θ1]. We used the Tukey–Kramer test for multiple comparisons for A at a significance level of 0.05. We also used the Watson–Williams test with Bonferroni correction for multiple comparisons for θ1 at a significance level of 0.05 (Watson and Williams, 1956). The mean of locking phase (which is termed the circular mean) is defined as , where θ1,j is the locking phase (rad) of the jth individual.
Since the plant circadian clock has an enormous number of cellular oscillators, the individual-level circadian rhythms represent synchronization among the oscillators (Fukuda et al., 2013). In addition, for the dual-zeitgeber cycles, each oscillator is modulated through the multiple phase responses. Therefore, the population dynamics of the cellular oscillators and their synchronization states are described as follows:
where ϕj and ωj are the phase and natural frequency of the jth oscillator, respectively. K represents the coupling strength, and N is the number of oscillators. ωj takes a normal distribution with a standard deviation σω and a mean value ω0. pD(t) and pT(t) indicate the presence of stimulus for 8 h dark and 4 h +10°C or 4 h −10°C stimuli, respectively [p(t) = 1 for stimulus on and p(t) = 0 for stimulus off]. They are described as follows:
where m is an integer. ZD(ϕ) and ZT(ϕ) are the phase sensitivity functions for dark and temperature stimuli, respectively (Masuda et al., 2021). They are described using the same formula, as follows: Z(ϕ) = a sin(ϕ − α). We used the previously obtained values of a and α for 8 h darkness and 4 h ± 10°C stimuli (Masuda et al., 2021). In addition, the collective rhythm X of the oscillators is denoted as , where R(t) and Φ(t) correspond to the amplitude and phase of the individual-level rhythms, respectively. In this study, parameters were set as N = 1,000, K = 0.01, ω0 = 2π/23 h–1 rad, and σω = 0.2ω0.
In Figure 2A, the normalized bioluminescence of CCA1::LUC under L/D = 16/8 h with 4 h +10°C cycles is shown. At Δt = 8 h (+10°C in days), the rhythm was amplified (Figure 2C) from the basic amplitude, which was 1.20 when the temperature cycle was absent. In contrast, at Δt = 20 h (+10°C in late night), the CCA1 rhythm was disturbed, and its amplitude was reduced. Figure 2B shows the CCA1 rhythm under the cooling conditions (L/D = 16/8 h with 4 h −10°C cycles). Only at Δt = 2 h (−10°C in early days) was the CCA1 rhythm disturbed and reduced (Figure 2D). When the amount of amplitude change is compared (the maximum value minus minimum value), the effect of the −10°C condition was 53% smaller than that of the +10°C condition.
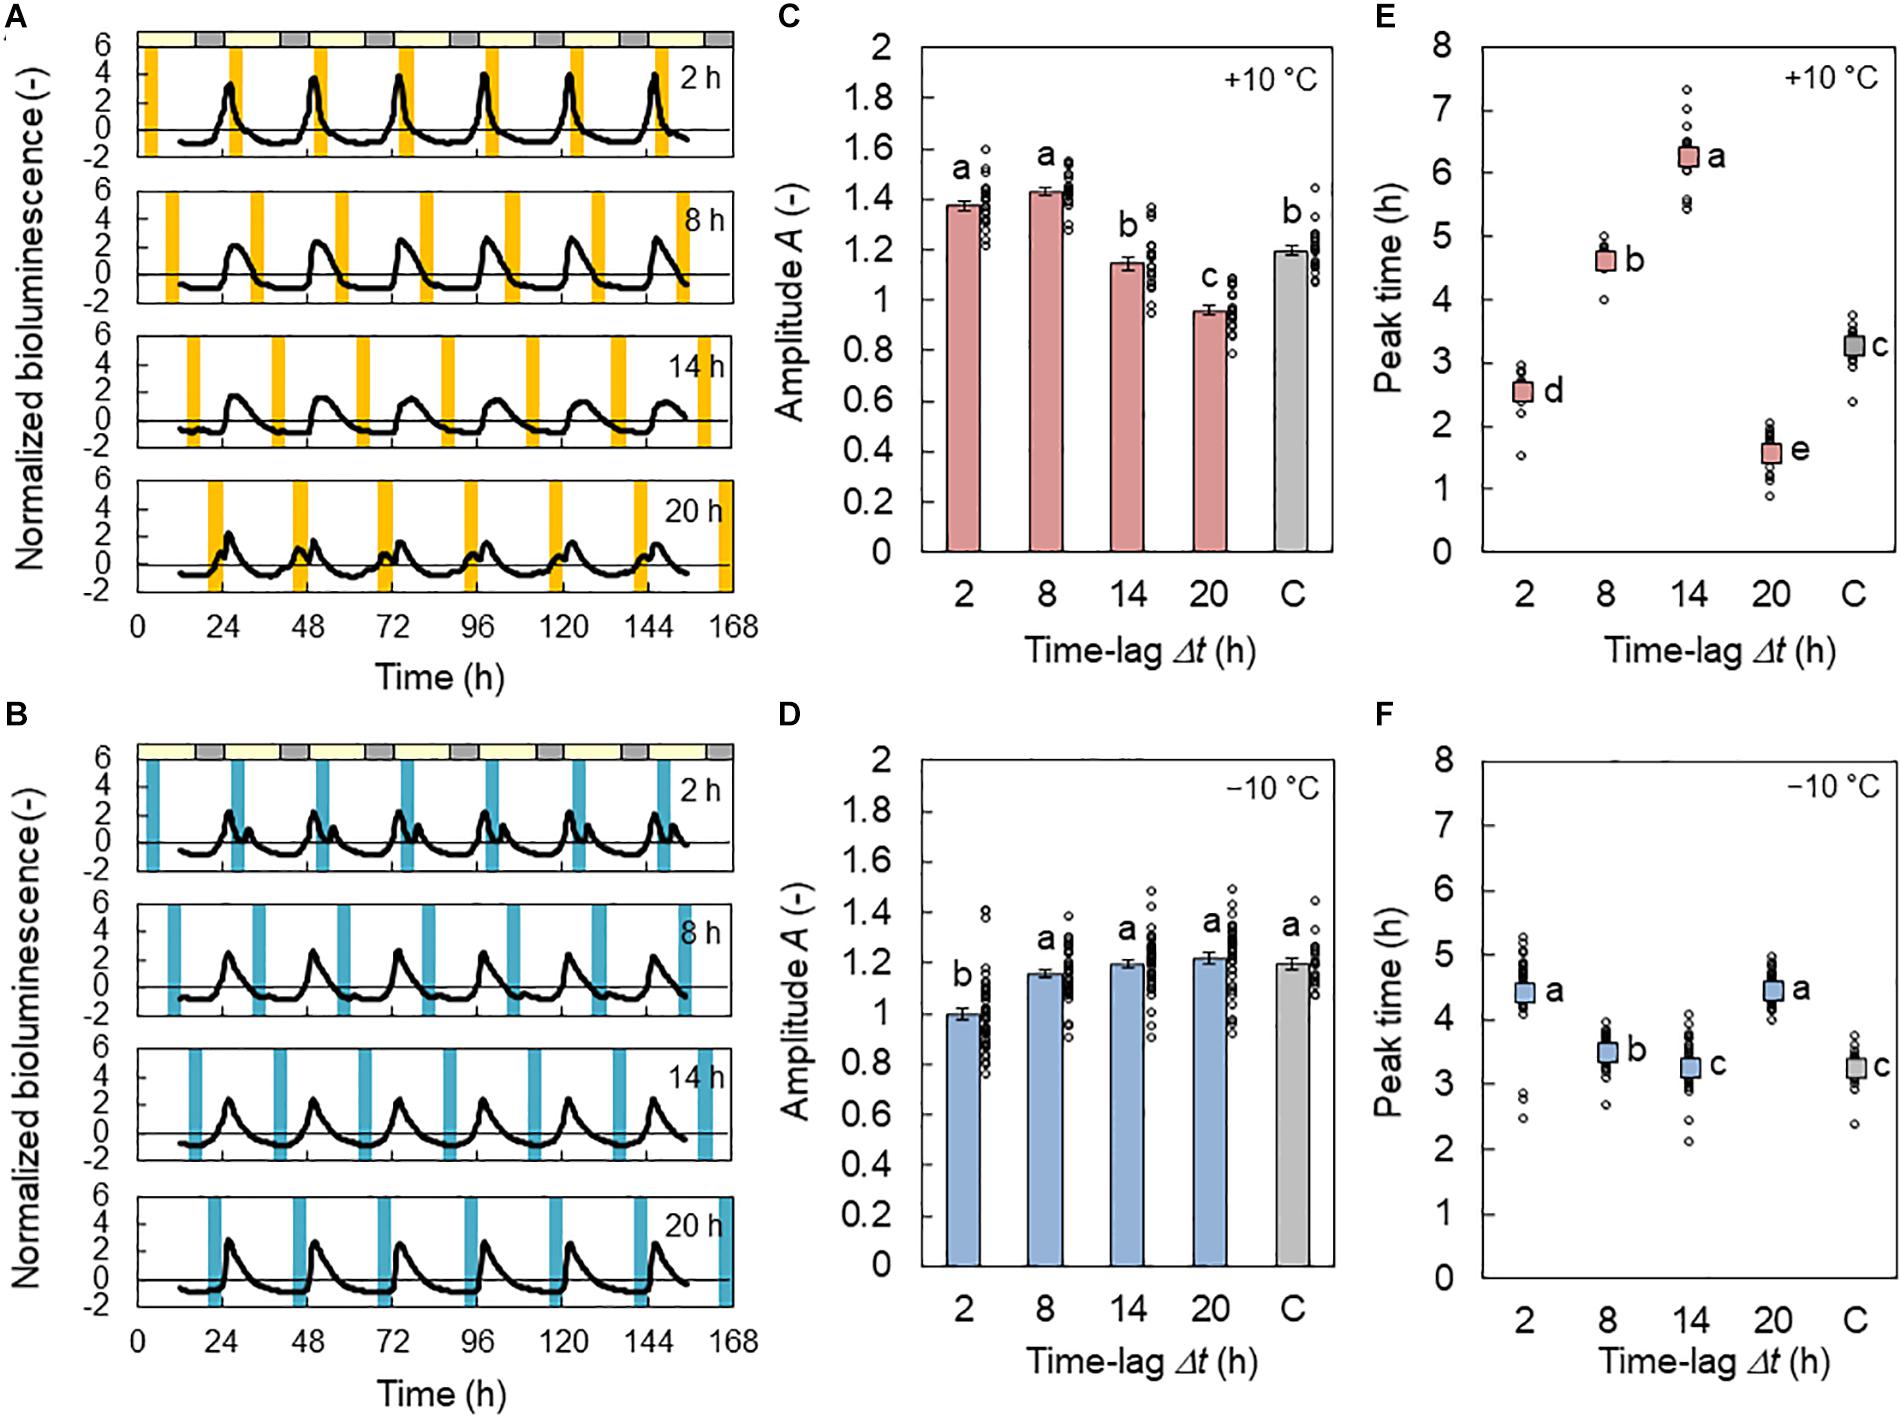
Figure 2. Effect of time lag on the CCA1 rhythm in conditions of L/D = 16/8 h and 4 h ± 10°C cycles for the in-phase initial conditions. (A,B) Normalized bioluminescence of CCA1::LUC in +10°C (A) and −10°C (B) conditions. (C,D) Amplitude A of the bioluminescence oscillation in +10°C (C) and −10°C (D) conditions (mean ± SEM, n = 20 individuals in +10°C, 40 in −10°C, and 20 in the control condition). The control condition is labeled C. The circles indicate the individual data points. Different letters indicate significant differences for each panel (Tukey–Kramer test, p < 0.05). (E,F) Peak time in +10°C (E) and −10°C (F) conditions (circular mean, n = 20 individuals in +10°C, 40 in −10°C, and 20 in the control condition). The circles indicate the individual data. Different letters indicate significant differences for each panel (Watson–Williams test with Bonferroni correction, p < 0.05).
The peak times for the CCA1 rhythms are shown in Figures 2E,F. For the +10°C condition, at Δt = 2, 8, and 14 h, the peak appeared 2.5, 4.6, and 6.2 h after light on, respectively. Thus, the increment of Δt increased the phase delay of the CCA1 rhythm. In contrast, at Δt = 20 h, the peak appeared after 1.6 h; that is, the phase delay substantially decreased. For the −10°C condition, at Δt = 2, 8, and 14 h, the peak appeared at 4.4, 3.5, and 3.3 h after light on, respectively. Thus, the increment of Δt provides a slight phase advance for the CCA1 rhythm. However, at Δt = 20 h, the peak appeared at 4.4 h; that is, the phase delay was increased. The amount of phase change between the maximum and minimum values of the peak times at −10°C was also 75% smaller than that at +10°C. Under the antiphase initial conditions, the changes in A and peak time were similar to those under the in-phase initial conditions (Supplementary Figure S1), but a small effect of initial conditions was observed due to a transient in the first LD cycle.
We performed the numerical simulation using a phase oscillator model with PRCs (Eq. 7). Figure 3A shows the relationship between experimental and computational amplitudes A, and there was a high correlation (correlation coefficient r = 0.74, p < 0.01). However, experimental A was dispersed in the low-amplitude state (A < 0.6), indicating that amplitude estimation was difficult. Figure 3B, however, shows the relationship between the experimental and computational locking phase θ1, and there was a very high correlation (r = 0.96, p < 0.01).

Figure 3. Relationship between the amplitude and locking phase of the CCA1 rhythms in the experiments and simulations. (A) Correlation between amplitudes A in the experiment and simulation (mean ± SD in experiment). (B) Correlation between the locking phase θ1 in the experiment and the simulation (circular mean in experiment). The black lines indicate regression lines. (C) Relationship between A (mean ± SD) and θ1 (circular mean). The symbols indicate the experimental data points. The colored lines indicate the relationship between A and θ1 in the simulation. The solid lines indicate the in-phase conditions and the broken lines indicate the antiphase conditions. The simulation values of A and θ1 were calibrated using the regression lines in (A) and (B) as Acalibrated = 1.15A + 0.38 and θ1,calibrated = 0.63θ1 + 0.03.
The relationship between A and θ1 in the experiment and simulation is shown in Figure 3C, where the simulation values of A and θ1 were calibrated using the regression lines in Figures 3A,B. Under the +10°C condition, the value of A showed a peak around θ1 = 0.15 rad/2π, while under the −10°C conditions, A varied on a small loop. This indicates that the modification range at −10°C was smaller than that at +10°C.
In Figures 4A,B, the fresh weights of the areal part of plants from the +10 and −10°C conditions are shown, respectively. The weight was larger at Δt = 8 h and smaller at Δt = 14 h under the +10°C condition. In contrast, there was no significant difference between the time lags under the −10°C condition. Figures 4D,E show the PLA under the +10 and −10°C conditions, respectively. Similar results were observed between the fresh weight and PLA. By the comparison of the control conditions, it was found that the +10°C cycle tended to enhance growth while the −10°C cycle suppressed growth.
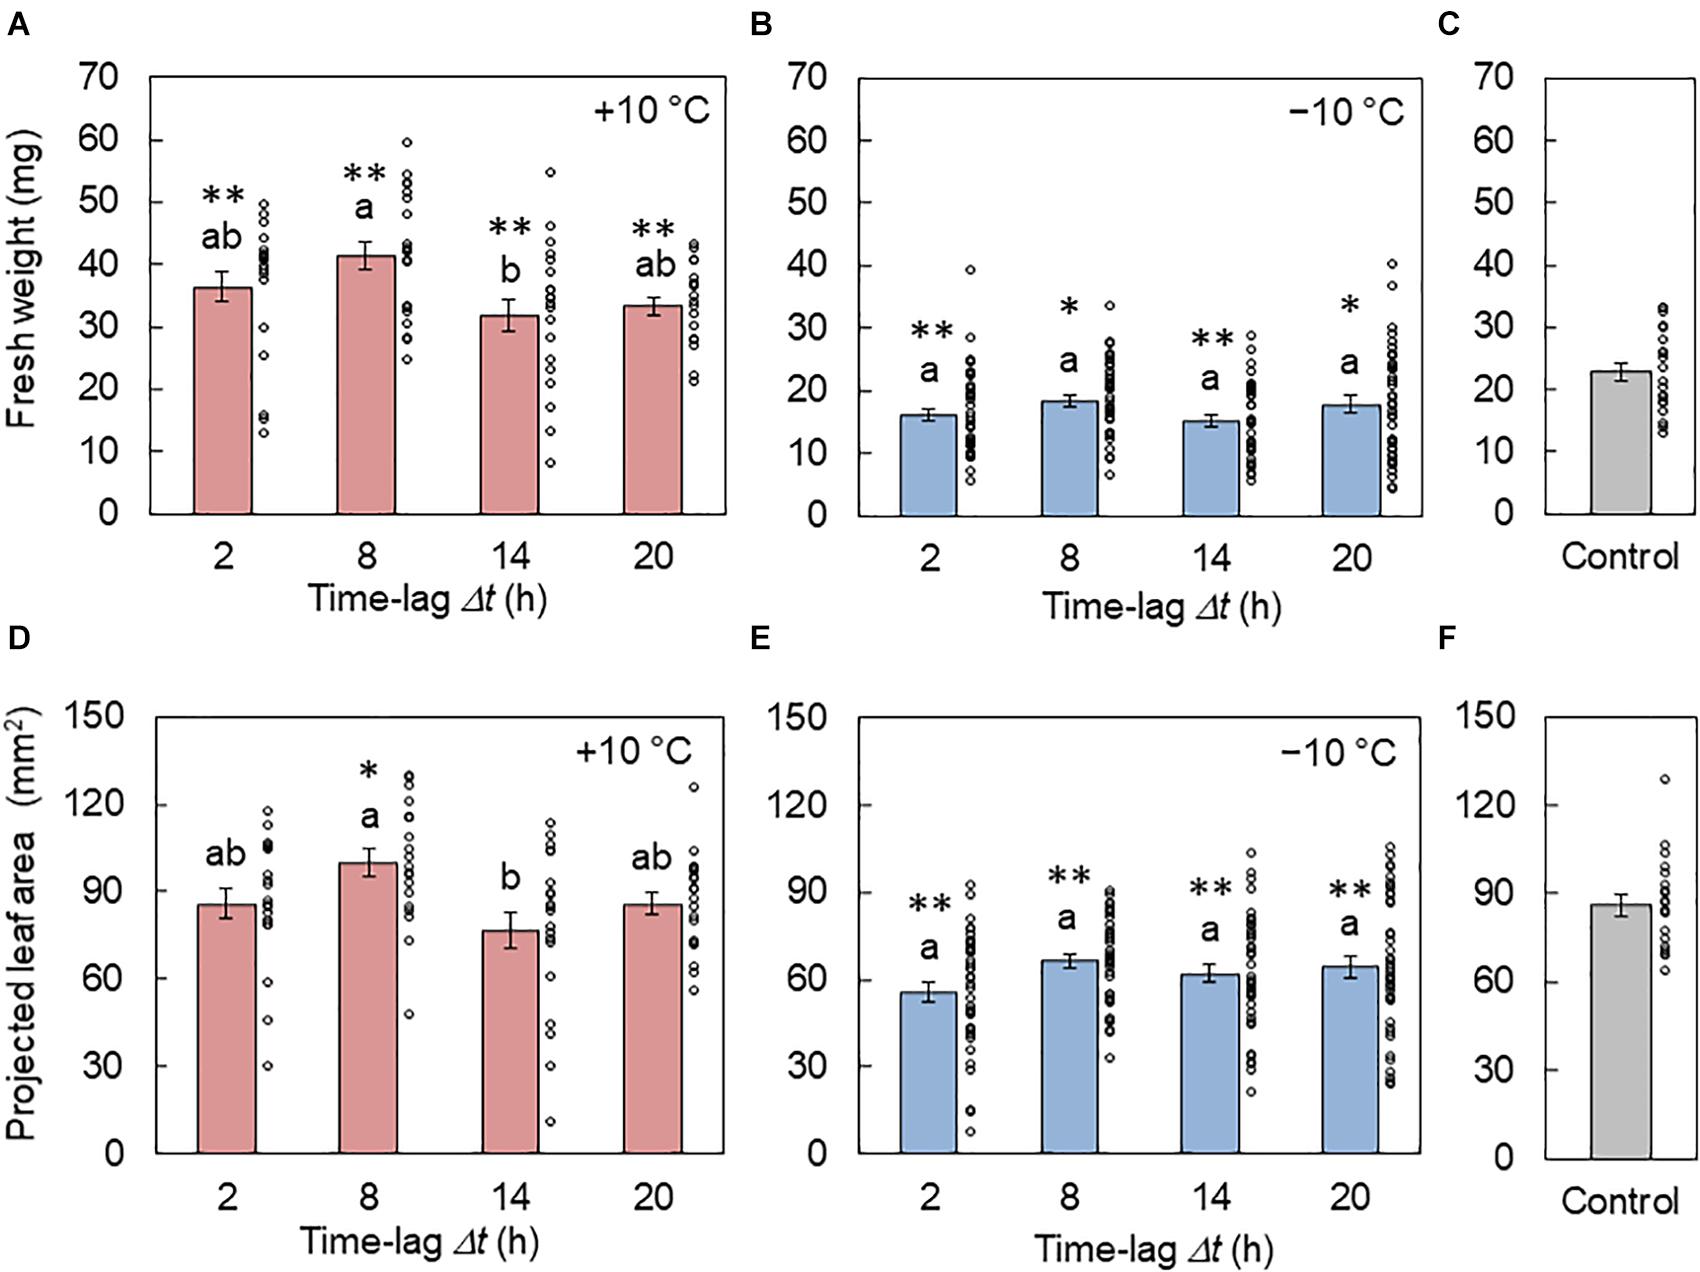
Figure 4. Effect of the time lag on plant growth in conditions of L/D= 16/8 h and 4 h ± 10°C cycles. (A–C) Fresh weights of the areal part from the +10°C (A), −10°C (B), and control (C) conditions (mean ± SEM, n = 20 individuals in (A) and (C) and 40 in (B)). (D–F) Projected leaf areas from the +10°C (D), −10°C (E), and control (F) conditions (mean ± SEM, n = 20 individuals in (D) and (F) and 40 in (E). The circles indicate the individual data points. Two conditions that do not have the same letter indicate significant differences for each panel (Tukey–Kramer test, p < 0.05). Asterisks indicate significant differences with the control condition (Welch’s t-test, *p < 0.05, **p < 0.01).
Figure 5 shows the relationship between the fresh weight and the CCA1 rhythm under the control conditions. The fresh weight increased with the increasing amplitude of A with a correlation (r = 0.60, p < 0.01). In contrast, the locking phase θ1 showed almost the same value; the mean values of phase were 0.14 and 0.16 rad/2π (peak time 3.3 and 3.7 h) for the in-phase and antiphase initial conditions, respectively. Therefore, the fresh weight showed no correlation for θ1 (r = −0.20, p > 0.05).
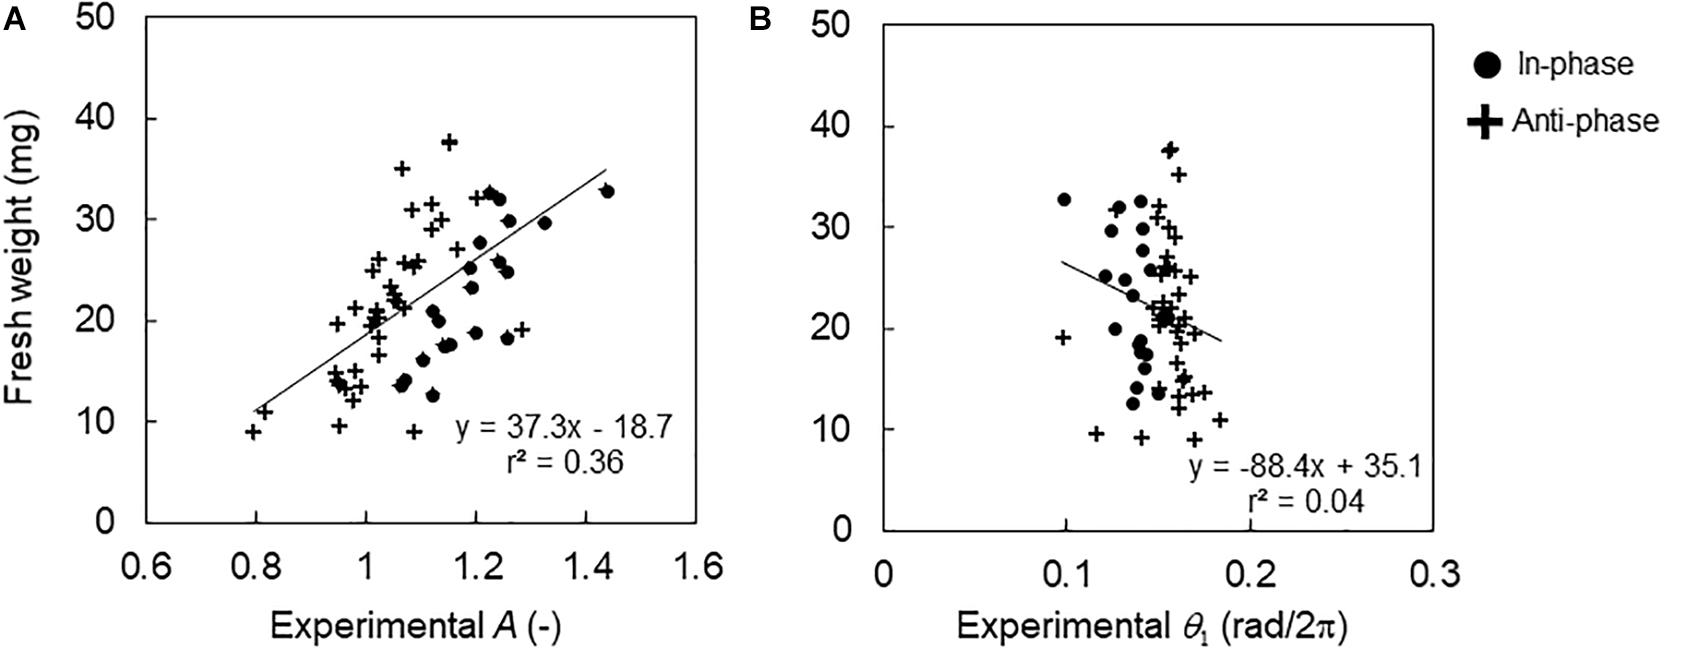
Figure 5. Relationship between fresh weight and CCA1 rhythms in the control conditions. (A) Relationship between fresh weight and amplitude A in individuals. (B) Relationship between fresh weight and locking phase θ1 in the individuals. The black lines indicate regression lines.
In Figures 6A,B, the relationship between fresh weight and the CCA1 rhythm in the +10°C conditions is shown. The fresh weight showed a linear relationship for the amplitude of A (Figure 6A) but a mirrored linear relationship for the locking phase θ1 (Figure 6B). Thus, we introduced the absolute value of phase difference |Δθ1| defined as , which indicates the amount of phase shift forced by a +10°C cycle (Figure 6B). is the average of θ1 under the control conditions. Notably, the fresh weight showed very high correlations with both A and |Δθ1|. However, under the −10°C condition, the fresh weight showed no correlations with either A or |Δθ1| (Figures 6C,D).
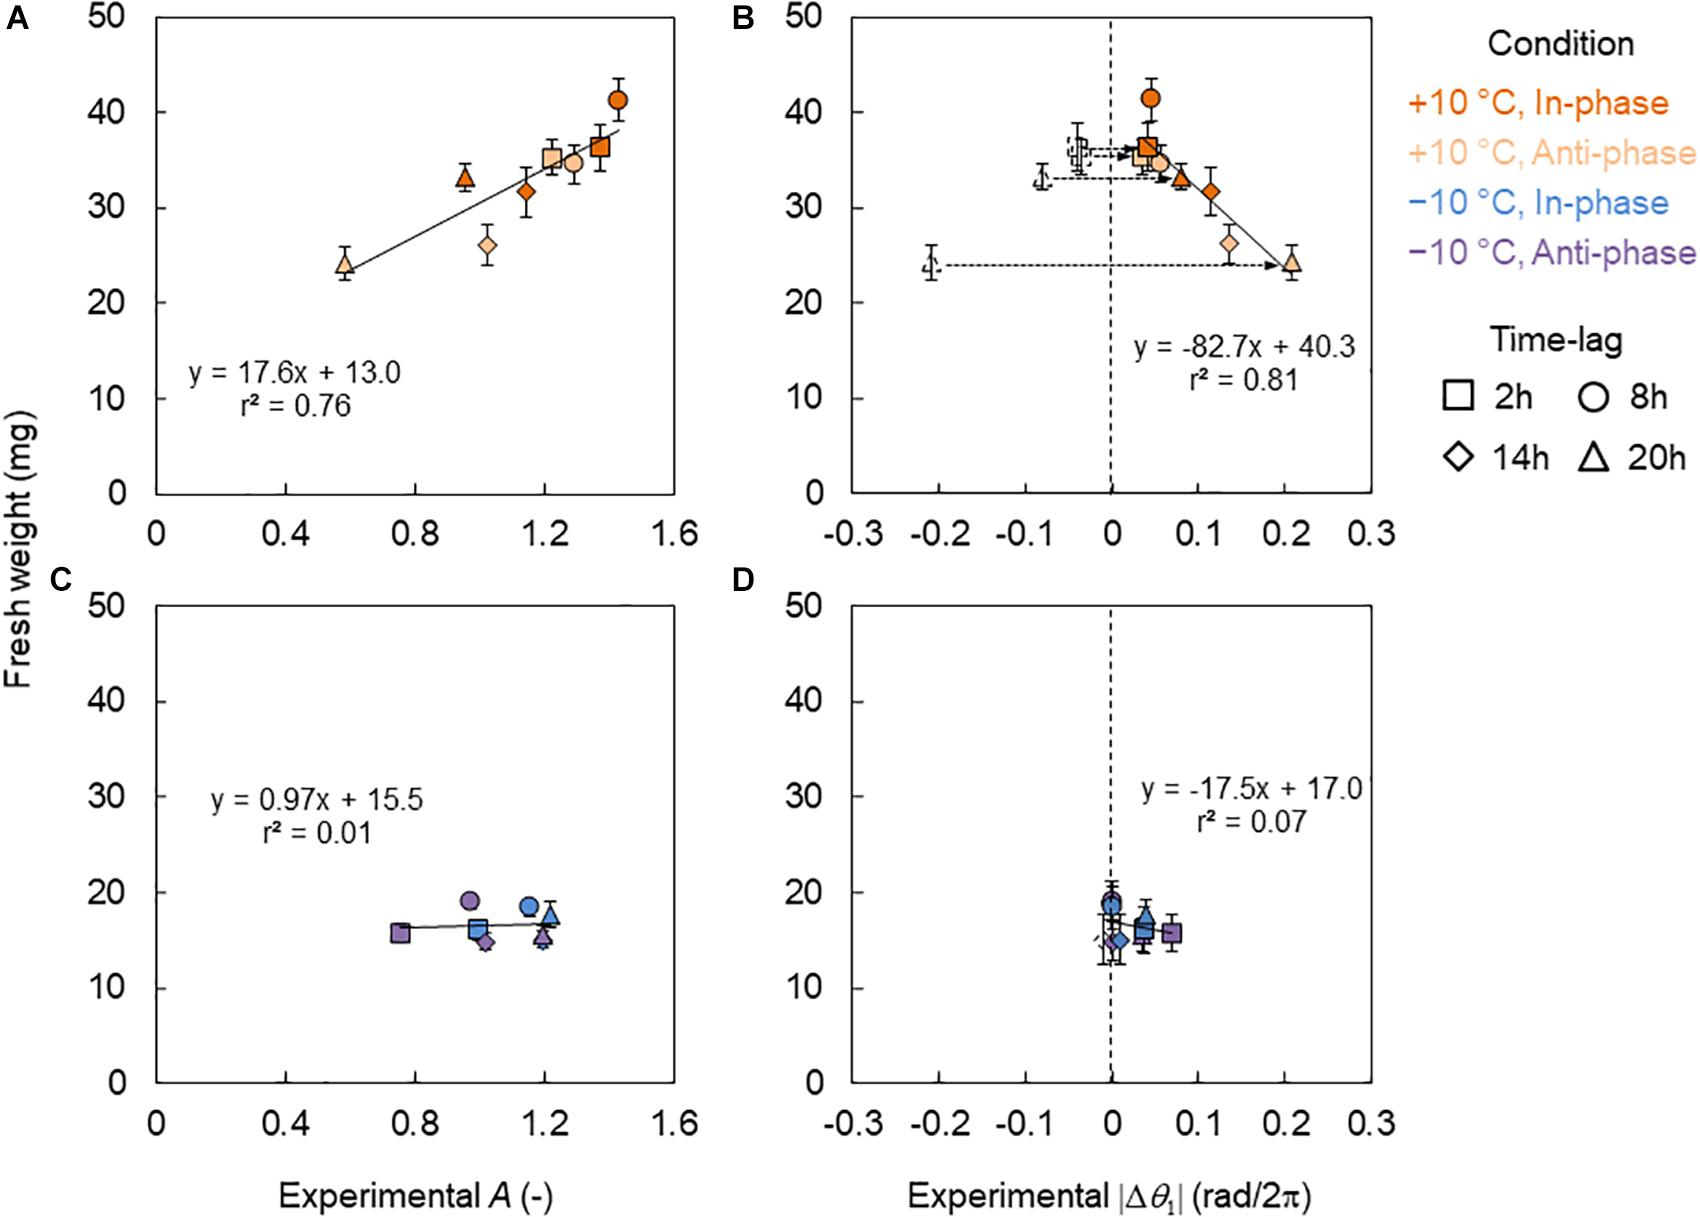
Figure 6. Relationship between fresh weights and CCA1 rhythms in the conditions of L/D = 16/8 h and 4 h ± 10°C cycles. (A,B) Relationship between fresh weight and amplitude A (A) and difference of the locking phase |Δθ1| (B) in +10°C. (C,D) Relationship between fresh weight and A (C) and |Δθ1| (D) in the −10°C. The blank symbols indicate data with negative values. Dotted arrows indicate the transform from negative to positive values. The colored symbols indicate data with positive values and the absolute value of the negatives in (B,D). The solid lines indicate regression lines. (B,D) The regression lines are for the colored symbols.
Due to the strong correlation between the growth and theCCA1 rhythm (A and |Δθ1|) under the +10°C condition, a growth prediction based on the CCA1 rhythm could be demonstrated. In this study, three kinds of prediction model for fresh weight were considered: W1 = f1(A), W2 = f2(|Δθ1|), and W3 = f3(A, |Δθ1|), where W1,2,3 means the predicted fresh weight in each model. First, the functions f1(A) and f2(|Δθ1|) were obtained experimentally as linear functions from the relationships in Figures 6A,B, respectively. The function f3(A, |Δθ1|) was also obtained by a linear optimal combination of A and |Δθ1|, that is, f3(A, |Δθ1|) = aA + b|Δθ1| + c, using the least square method. We then calculated the A and |Δθ1| for each Δt in the phase oscillator model (Eq. 7) and the regression lines in Figures 3A,B as a calibration. Finally, A(Δt) and |Δθ1(Δt)| were obtained and substituted into W1 = f1[A(Δt)], W2 = f2[|Δθ1(Δt)|], or W3 = f3[A(Δt), |Δθ1(Δt)|], and then we obtained the predicted fresh weight for each Δt. The accuracy rates of the models were high (r > 0.79) as shown in Figure 7. However, it should be noted that our prediction model cannot be used for the −10°C condition, as there was no correlation between growth and the CCA1 rhythm.
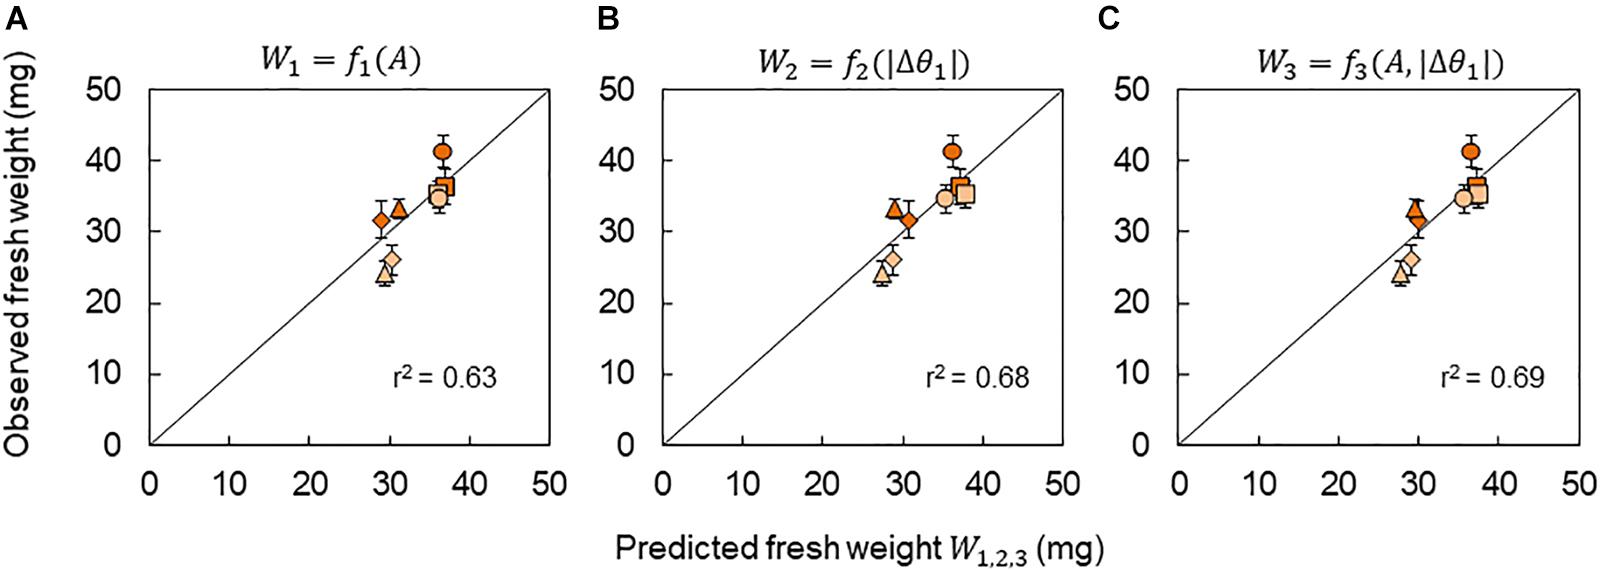
Figure 7. Prediction of fresh weight based on the CCA1 rhythms. Correlation between observed fresh weight and predicted fresh weight using models W1 = f1(A) (A), W2 = f2(|Δθ1|) (B), and W3 = f3(A, |Δθ1|) (C). The value of r2 indicates the coefficient of determination for the line with a slope of 1. Symbols indicate the same conditions as shown in Figure 6.
In this study, we investigated the modulation of the CCA1 rhythms and seedling growth using temperature cycles (4 h ± 10°C) with time lags Δt. The amplitude A and locking phase θ1 varied, depending on Δt. Under the −10°C condition, there was a decrease in the modulation of A and θ1 by 53 and 75%, respectively, compared with those under the +10°C condition (Figure 2). In addition, the growth depended on Δt only under the +10°C condition, and not under −10°C (Figure 4). Notably, under the +10°C condition, growth showed a high correlation with the CCA1 rhythms (Figure 6).
In our model, light and temperature stimuli affected the CCA1 rhythms via their PRCs. Consequently, their multiple effects can be estimated based on the combined PRC Γ(θ). Figure 8A shows the description of Γ(θ). PRCs for 8 h dark, 4 h +10°C, and 4 h −10°C were obtained in our pervious study (Masuda et al., 2021). Here, we introduced the combined PRC Γ(θ), described as Γ(θ) = GD(θ + θD) + GT(θ + Δψ), where GD(θ) and GT(θ) are the PRCs for the 8 h dark and temperature (4 h +10°C or 4 h −10°C) stimuli, respectively. θD is a constant that denotes the start time of the dark in relation to the timing of light on, that is, (rad) in this study. Δψ is the phase delay of the temperature stimuli from light on; Δψ = 0 rad indicates the temperature stimulus applied at the light-on time. Δψ was transferred to time lag Δt as Δt = Δψ/2π × 24 (h) in this study. By considering the Γ(θ), the differences in rhythm modulations between +10°C and −10°C were determined and shown in Figure 3C. They were explained as follows: the shape of Γ(θ) changes drastically depending on Δt in +10°C (Figure 8B), but it was almost unchanged at −10°C (Figure 8C). Therefore, in the −10°C condition, the CCA1 rhythm was determined to be almost independent of the time lag. In addition, the complex shape of Γ(θ), such as Δt = 14 and 20 h under +10°C, disturbs the synchrony of cellular oscillators and then suppresses substantially the amplitude of the collective rhythm (around evening in Supplementary Figure S2A).
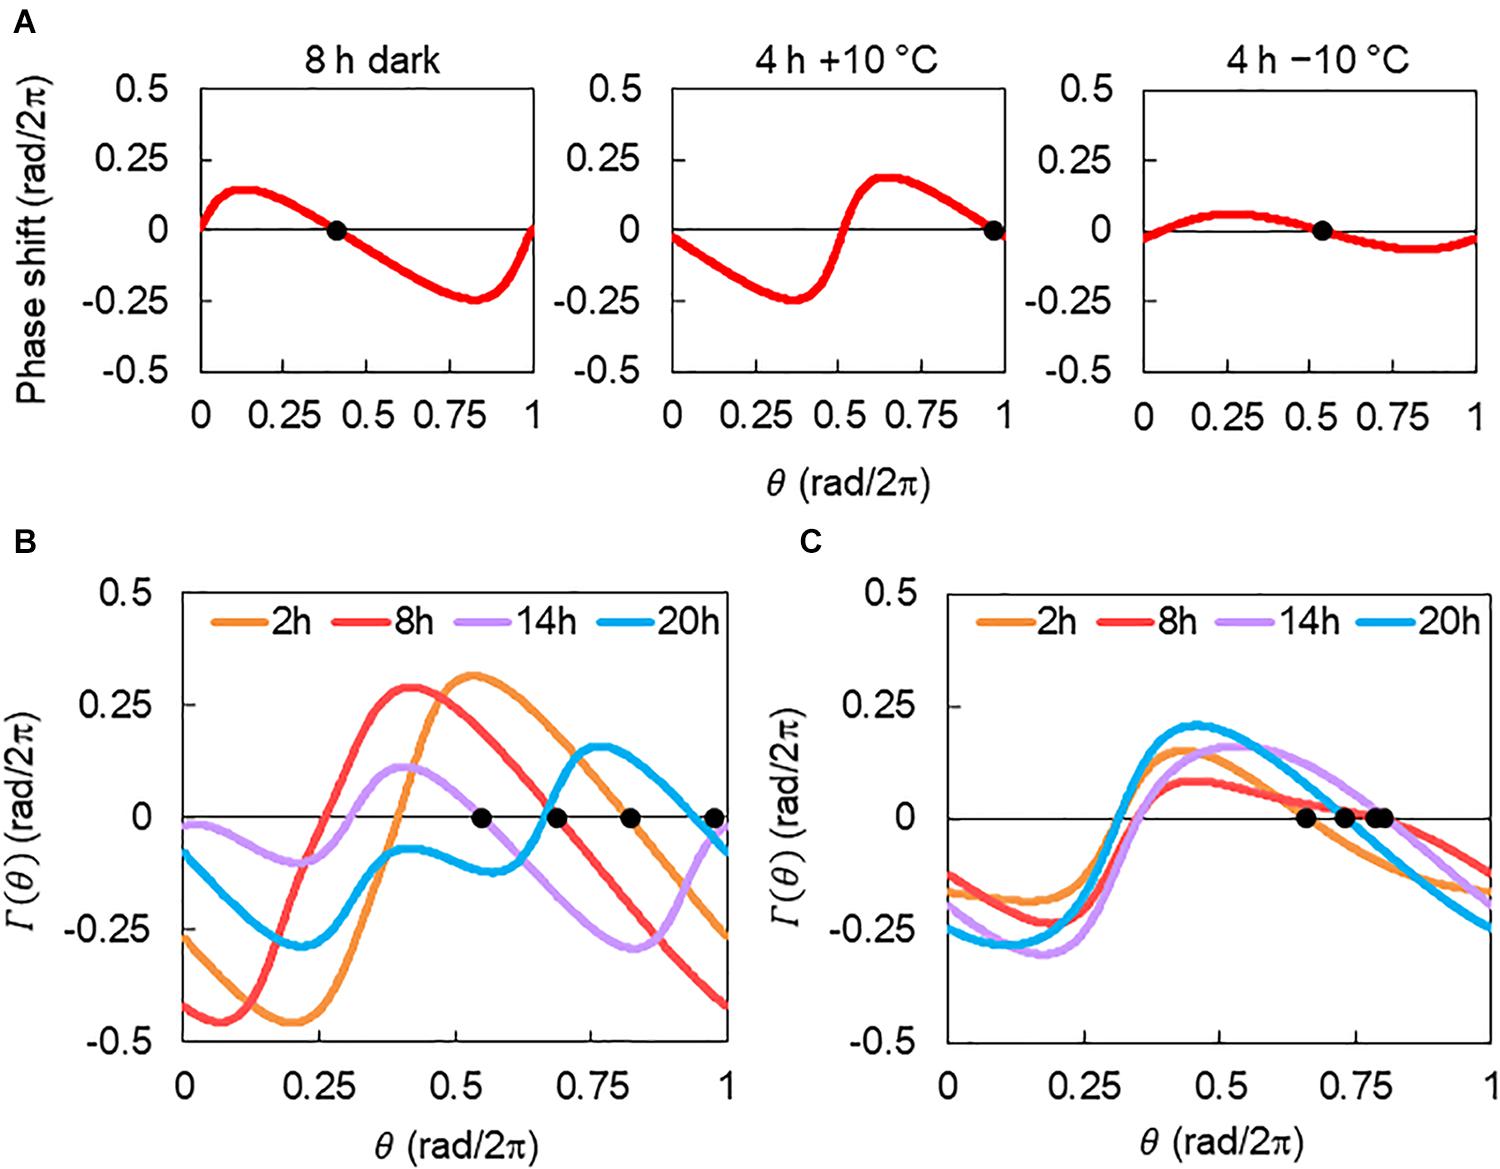
Figure 8. Description of combined phase response curve (PRC). (A) PRCs for 8 h dark and 4 h ± 10°C stimuli. PRCs were reconstructed with a = 0.20 and α = 0.13 for 8 h darkness, a = 0.39 and α = 0.58 for 4 h +10°C, and a = 0.10 and α = 0.13 for 4 h −10°C stimuli (Masuda et al., 2021). Black dots indicate the stable points. (B) The combined PRC Γ(θ) of 8 h dark and 4 h +10°C condition. (C) Γ(θ) of 8 h dark and 4 h −10°C condition. Each curve corresponds to Γ(θ) for Δt = 2, 8, 14, or 20 h. Black dots indicate the stable point of each Γ(θ).
During plant growth, Δt also resulted in a significant effect at the +10°C but not −10°C condition (Figure 4). In addition, the growth showed a correlation with the CCA1 rhythms at +10°C, but no correlation at −10°C (Figure 6). As a possible explanation, the variable range for the −10°C was very narrow (on a small loop in Figure 3C), so the growth might not be affected by the rhythm modulations. Moreover, using Δt, the degree of DIF was regulated continuously from +DIF to −DIF. Such continuous regulation of DIF provides continuous modulation of the CCA1 rhythm (Figure 3C). Based on our results, the effects of DIF regulation on growth were predictable (Figure 7). This prediction method in conjunction with specific growing conditions and/or crop species might be important for practical application in horticulture (Kläring and Schmidt, 2017; Liu et al., 2019). However, as a limitation of this, other situations such as the 12/12 h temperature cycles were not addressed in this study, and further studies are required to determine the growth regulation of DIF.
In this study, we demonstrated growth prediction using the CCA1 rhythm with a phase oscillator model. The synchronization of the cellular oscillators plays an important role in the modification of circadian rhythms. Although it is difficult to measure such population dynamics directly, our model was utilized for the basic estimation of the optimal time lag. However, although the present study showed a correlation between growth and the CCA1 rhythms, it did not clarify a causal mechanism between them. The measurement of other clock genes is required to fully elucidate the role of the circadian clock. Moreover, the entrainment of the plant circadian clock also involves complex interactions for endogenous factors (e.g., sugar metabolism and hormone signaling) as well as environmental stimulus (Webb et al., 2019). Further modeling with signaling details and other environmental stimuli is thus required in the future.
The raw data supporting the conclusions of this article will be made available by the authors, without undue reservation.
KM, TY, and HF designed the research. KM, TY, and YK performed the experiments. KM and TY analyzed the data. KM and HF wrote the manuscript. All authors discussed the results and implications and commented on the manuscript.
This study was partially supported by Grants-in-Aid for Scientific Research (No. 18J20079 to KM; Nos. 20H00423, 20H05424, and 20H05540 to HF) provided by the Ministry of Education, Science, Sports, and Culture.
The authors declare that the research was conducted in the absence of any commercial or financial relationships that could be construed as a potential conflict of interest.
We are grateful to Prof. Takao Kondo for providing the bioluminescence monitoring device and Prof. Norihito Nakamichi for supplying the CCA1::LUC plants. We would like to thank Editage (www.editage.com) for English language editing.
The Supplementary Material for this article can be found online at: https://www.frontiersin.org/articles/10.3389/fpls.2020.614360/full#supplementary-material
Anpo, M., Fukuda, H., and Wada, T. (2018). Plant Factory Using Artificial Light: Adapting to Environmental Disruption and Clues to Agricultural Innovation. San Diego, CA: Elsevier.
Creux, N., and Harmer, S. (2019). Circadian rhythms in plants. Cold Spring Harb. Perspect. Biol. 11:a034611. doi: 10.1101/cshperspect.a034611
Dodd, A. N., Kusakina, J., Hall, A., Gould, P. D., and Hanaoka, M. (2014). The circadian regulation of photosynthesis. Photosynth. Res. 119, 181–190. doi: 10.1007/s11120-013-9811-8
Dodd, A. N., Salathia, N., Hall, A., Kevei, E., Toth, R., Nagy, F., et al. (2005). Plant circadian clocks increase photosynthesis, growth, survival, and competitive advantage. Science 309, 630–633. doi: 10.1126/science.1115581
Fukuda, H., Murase, H., and Tokuda, I. (2013). Controlling circadian rhythms by dark-pulse perturbations in Arabidopsis thaliana. Sci. Rep. 3:1533. doi: 10.1038/srep01533
Fukuda, H., Uchida, Y., and Nakamichi, N. (2008). Effect of a dark pulse under continuous red light on the Arabidopsis thaliana circadian rhythm. Environ. Control Biol. 46, 123–128. doi: 10.2525/ecb.46.123
Granada, A., Hennig, R. M., Ronacher, B., Kramer, A., and Herzel, H. (2009). Phase response curves elucidating the dynamics of coupled oscillators. Methods Enzymol. 454, 1–27. doi: 10.1016/S0076-6879(08)03801-9
Higashi, T., Nishikawa, S., Okamura, N., and Fukuda, H. (2015). Evaluation of growth under non-24 h period lighting conditions in Lactuca sativa L. Environ. Control Biol. 53, 7–12. doi: 10.2525/ecb.53.7
Johnson, C. H., Elliott, J. A., and Foster, R. (2003). Entrainment of circadian programs. Chronobiol. Int. 20, 741–774. doi: 10.1081/CBI-120024211
Kläring, H. P., and Schmidt, A. (2017). Diurnal temperature variations significantly affect cucumber fruit growth. HortScience 52, 60–64. doi: 10.21273/HORTSCI11215-16
Kondo, T., Strayer, C. A., Kulkarni, R. D., Taylor, W., Ishiura, M., Golden, S. S., et al. (1993). Circadian rhythms in prokaryotes: luciferase as a reporter of circadian gene expression in cyanobacteria. Proc. Natl. Acad. Sci. U.S.A. 90, 5672–5676. doi: 10.1073/pnas.90.12.5672
Kozai, T., Niu, G., and Takagaki, M. (2019). Plant Factory: an Indoor Vertical Farming System for Efficient Quality Food Production. San Diego, CA: Elsevier Science & Technology.
Lai, A. G., Doherty, C. J., Mueller-Roeber, B., Kay, S. A., Schippers, J. H., and Dijkwel, P. P. (2012). CIRCADIAN CLOCK-ASSOCIATED 1 regulates ROS homeostasis and oxidative stress responses. Proc. Natl. Acad. Sci. U.S.A. 109, 17129–17134. doi: 10.1073/pnas.1209148109
Liu, Y., Ren, X., and Jeong, B. R. (2019). Manipulating the difference between the day and night temperatures can enhance the quality of Astragalus membranaceus and Codonopsis lanceolate plug seedlings. Agronomy 9:654. doi: 10.3390/agronomy9100654
Masuda, K., Kitaoka, R., Ukai, K., Tokuda, I. T., and Fukuda, H. (2017). Multicellularity enriches the entrainment of Arabidopsis circadian clock. Sci. Adv. 3:e1700808. doi: 10.1126/sciadv.1700808
Masuda, K., Tokuda, I. T., Nakamichi, N., and Fukuda, H. (2021). The singularity response reveals entrainment properties of the plant circadian clock. Nat. Commun. 12:864. doi: 10.1038/s41467-021-21167-7
Michael, T. P., Salome, P. A., and McClung, C. R. (2003). Two Arabidopsis circadian oscillators can be distinguished by differential temperature sensitivity. Proc. Natl. Acad. Sci. U.S.A. 100, 6878–6883. doi: 10.1073/pnas.1131995100
Nakamichi, N., Ito, S., Oyama, T., Yamashino, T., Kondo, T., and Mizuno, T. (2004). Characterization of plant circadian rhythms by employing Arabidopsis cultured cells with bioluminescence reporters. Plant Cell Physiol. 45, 57–67. doi: 10.1093/pcp/pch003
Ohara, T., Fukuda, H., and Tokuda, I. T. (2015). Phase response of the Arabidopsis thaliana circadian clock to light pulses of different wavelengths. J. Biol. Rhythms 30, 95–103. doi: 10.1177/0748730415576426
Resco de Dios, V., Loik, M. E., Smith, R., Aspinwall, M. J., and Tissue, D. T. (2016). Genetic variation in circadian regulation of nocturnal stomatal conductance enhances carbon assimilation and growth. Plant Cell Environ. 39, 3–11. doi: 10.1111/pce.12598
Thines, B., and Harmon, F. G. (2010). Ambient temperature response establishes ELF3 as a required component of the core Arabidopsis circadian clock. Proc. Natl. Acad. Sci. U. S. A. 107, 3257–3262. doi: 10.1073/pnas.0911006107
Thingnaes, E., Torre, S., Ernstsen, A., and Moe, R. (2003). Day and night temperature responses in Arabidopsis: effects on gibberellin and auxin content, cell size, morphology and flowering time. Ann. Bot. 92, 601–612. doi: 10.1093/aob/mcg176
Watson, G. S., and Williams, E. J. (1956). On the construction of significance tests on the circle and the sphere. Biometrika 43, 344–352. doi: 10.2307/2332913
Webb, A. A., Seki, M., Satake, A., and Caldana, C. (2019). Continuous dynamic adjustment of the plant circadian oscillator. Nat. Commun. 10:550. doi: 10.1038/s41467-019-08398-5
Xiao, F., Yang, Z., Han, W., Li, Y., Qiu, Y., Sun, Q., et al. (2018). Effects of day and night temperature on photosynthesis, antioxidant enzyme activities, and endogenous hormones in tomato leaves during the flowering stage. J. Hortic. Sci. Biotechnol. 93, 306–315. doi: 10.1080/14620316.2017.1369171
Keywords: circadian clock, dark cycle, entrainment, phase response curve, singularity response, synchronization
Citation: Masuda K, Yamada T, Kagawa Y and Fukuda H (2021) Time Lag Between Light and Heat Diurnal Cycles Modulates CIRCADIAN CLOCK ASSOCIATION 1 Rhythm and Growth in Arabidopsis thaliana. Front. Plant Sci. 11:614360. doi: 10.3389/fpls.2020.614360
Received: 05 October 2020; Accepted: 24 December 2020;
Published: 11 February 2021.
Edited by:
Péter Poór, University of Szeged, HungaryCopyright © 2021 Masuda, Yamada, Kagawa and Fukuda. This is an open-access article distributed under the terms of the Creative Commons Attribution License (CC BY). The use, distribution or reproduction in other forums is permitted, provided the original author(s) and the copyright owner(s) are credited and that the original publication in this journal is cited, in accordance with accepted academic practice. No use, distribution or reproduction is permitted which does not comply with these terms.
*Correspondence: Hirokazu Fukuda, ZnVrdWRhQG1lLm9zYWthZnUtdS5hYy5qcA==
Disclaimer: All claims expressed in this article are solely those of the authors and do not necessarily represent those of their affiliated organizations, or those of the publisher, the editors and the reviewers. Any product that may be evaluated in this article or claim that may be made by its manufacturer is not guaranteed or endorsed by the publisher.
Research integrity at Frontiers
Learn more about the work of our research integrity team to safeguard the quality of each article we publish.