- 1Key Laboratory of Crop Gene Resources and Germplasm Enhancement, Institute of Crop Sciences, Chinese Academy of Agricultural Sciences (CAAS), Beijing, China
- 2State Key Laboratory of Plant Physiology and Biochemistry, College of Biological Sciences, China Agricultural University, Beijing, China
Kernel weight is a key determinant of yield in wheat (Triticum aestivum L.). Starch consists of amylose and amylopectin and is the major constituent of mature grain. Therefore, starch metabolism in the endosperm during grain filling can influence kernel weight. In this study, we sequenced 87 genes involved in starch metabolism from 300 wheat accessions and detected 8,141 polymorphic sites. We also characterized yield-related traits across different years in these accessions. Although the starch contents fluctuated, thousand kernel weight (TKW) showed little variation. Polymorphisms in six genes were significantly associated with TKW. These genes were located on chromosomes 2A, 2B, 4A, and 7A; none were associated with starch content or amylose content. Variations of 15 genes on chromosomes 1A and 7A formed haplotype blocks in 26 accessions. Notably, accessions with higher TKWs had more of the favorable haplotypes. We thus conclude that these haplotypes contribute additive effects to TKW.
Introduction
Wheat (Triticum aestivum L.) yield depends on three main components: spike number per area, grain number per spike, and thousand kernel weight (TKW). Because starch accounts for about 65–80% of the grain endosperm (Barron et al., 2007), starch metabolism can significantly affect TKW, yield, and quality (Keeling and Myers, 2010). Starch and sucrose metabolism involves several key enzymes: sucrose synthase (SUS), fructokinase (FRK), phosphoglucose isomerase (PGI), phosphoglucomutase (PGM), UDP-glucose pyrophosphorylase (UGPase), ADP-glucose pyrophosphorylase (AGPase), starch synthase (SS), granule-bound starch synthase (GBSS), starch branching enzyme (SBE), and debranching enzyme (DBE) (Jeon et al., 2010). Several transporters related to substrate and energy flow, such as ADP-glucose transporter (BT1), ATP/ADP transporter (AATP), glucose phosphate transporter (GPT), and triose-phosphate transporter (TPT), are rate-limiting for starch synthesis (Möhlmann et al., 1998; Bowsher et al., 2007). Enzymes involved in energy metabolism and starch degradation, including adenylate kinase (AK), beta-amylase (BMY), glucan, water dikinase (GWD), and phosphoglucan, water dikinase (PWD), also play important roles in grain filling (Stitt and Zeeman, 2012).
Starch consists of amylose starch and amylopectin starch (Hannah and James, 2008; Jeon et al., 2010), and functional changes in starch metabolism genes dramatically influence starch content, amylose content, and other agronomic traits. For instance, SUS is a key enzyme in the starch and sucrose synthesis pathway, and its overexpression can increase starch content in potato (Solanum tuberosum L.) and maize (Zea mays L.) (Baroja-Fernández et al., 2009; Li et al., 2013). ADP-glucose, a substrate of the SS isozymes, is mainly synthesized by AGPase. The activity of AGPase is correlated with starch content and grain weight (Smidansky et al., 2002; Kang et al., 2013; Tang et al., 2016). Amylose in the grain is mainly synthesized by GBSSI, and mutations in GBSSI can reduce amylose contents in rice (Oryza sativa L.), maize, barley (Hordeum vulgare L.), and wheat (Tsai, 1974; Sano, 1984; Nakamura et al., 1995; Patron et al., 2002; Perez et al., 2019). Notably, three wheat lines carrying null mutations in GBSSI, SSIIa, and SBEIIa produce starch with amylose contents of 0%, 46%, and 79%, respectively, compared with 34% in wild type (WT) (Botticella et al., 2018). In addition, mutations in BT1 can affect starch content and the structure of starch granules (Li et al., 2017; Wang et al., 2019). Overexpression of plastidic AATP in potato can increase the accumulation of ADP-glucose and increase starch content by 16% to 36% compared with WT (Tjaden et al., 1998; Geigenberger et al., 2001). Decreasing the expression of GWD via RNAi can increase grain number per plant and TKW in wheat (Ral et al., 2012). Therefore, altering starch metabolism genes represents a promising approach by which to alter wheat grain components.
Although these genes have been widely studied, systematic studies on their functional variation are lacking, especially for wheat accessions. Here, we sequenced 87 genes involved in starch metabolism, using high-throughput sequencing. We identified over 8,000 variants in 300 wheat accessions and tested them for association with thousand kernel weight (TKW), starch content (SC), and amylose content (AC), to identify useful polymorphisms among the natural populations. Notably, variants of 15 genes located on chromosomes 1A and 7A formed haplotype blocks in one subgroup. Multiple variations of genes were associated with TKW, starch weight per grain (SW), and amylose weight per grain (AW). The favorable haplotypes had positive additive effects on TKW. These results provide insights relevant to the analysis of gene function, and the variations we detected might be valuable in wheat production.
Materials and Methods
Plant Materials
Three hundred wheat accessions were used in the study: 115 Chinese landraces (CLs) and 55 modern Chinese cultivars (MCCs) from the mini-core collection (Hao et al., 2011), 127 foreign cultivars (FCs), and three tetraploid wheat cultivars (Supplementary Table S1). All accessions were provided by the Institute of Crop Sciences, CAAS. These accessions were grown in the order of MCCs, CLs and FCs in the same block at Xinxiang Experiment Station in Henan Province, China, in 2017 and 2018. Each accession was planted in four rows, at a planting density of 40 seeds per row. The length of each row was 2 m, and the rows were 25 cm apart. The two native cultivars Zhengmai 9023 (ZGNKE087A) and Yanzhan 1 (ZGNKE088A) were used as the check cultivars and were planted after every 50 accessions (200 rows). The thousand kernel weight (TKW) was measured for eight plants from the middle row of each of the CL and MCC accessions. The TKWs of FCs and tetraploid wheat were not measured in this study, because these accessions flowered too late.
Starch and Amylose Content Assay
Mature grains (100 g) of CL and MCC accessions were processed into flour with a Quadrumat Senior mill (Brabender, Germany). The flour for each accession was then processed to quantify starch content by the AOAC Method 996.11 (McCleary et al., 1997), using the Total Starch (AA/AMG) Assay Kit (K-TSTA-50A, Megazyme, Ireland), and the amylose content was assessed using the Amylose/Amylopectin Assay Kit (K-AMYL, Megazyme, Ireland). Starch weight per grain was calculated as (TKW/1000) × flour yield × starch content. Amylose weight per grain was calculated as starch weight per grain × amylose content.
Genotype Detection
All accessions were genotyped by the MolBreeding Biotechnology Co., Ltd. (Shijiazhuang, China). The genome-specific primers were designed by the GenoPlexs method (MolBreeding). The PCR reaction contained 50 ng DNA, 10 μL GenoPlexs 2 × G Master Mix and 8 μL primer mixture. PCR was carried out using an ABI 9700 machine with the following settings: denaturation at 95°C for 5 min, followed by 19 cycles of 95°C for 30 s, annealing at 60°C for 8 min, and extension at 72°C for 5 min. The DNA concentrations were measured by Qubit Fluorometric Quantitation (Thermo Fisher, Shanghai), and the DNA library was sequenced by BGI (Shenzhen, China). FastQC was used for quality control of the data1. Sequences were aligned with GATK2 to detect polymorphic sites relative to the reference genome of Chinese Spring (IWGSCv1.0)3.
Genetic Structure, Association Analysis, and Statistical Analysis
The genetic structure of the cultivar set was evaluated by Structure 2.3.4 (Pritchard et al., 2000) using 8,141 SNP markers sequenced in this study. The number of subgroups was determined by the ΔK model (Evanno et al., 2005). Principal coordinate analysis (PCA) was performed to reveal relationships among different groups using TASSEL 5 (Bradbury et al., 2007), and three groups were identified by plotting the first two axes. Association analysis was carried out using the MLM (mixed linear model) module (Q + K) of TASSEL 5. A K matrix was generated by the Kinship module of TASSEL 5. SNP loci with minor allele frequencies lower than 0.05 or a missing ratio higher than 0.1 were not considered, and the threshold P of association signals was set as the 0.05/SNP marker number (0.05/1,102 = 4.537 × 10⁻⁵); namely, -log10 P > 4.343. The agronomic traits and genetic effects of favorable haplotypes in different groups were tested via ANOVA in SPSS 21.0. Pearson’s correlation coefficient was calculated between pairs of variables using the data per accession. Correlations were tested for significance using the F-test at a significance level of 1% (P < 0.01).
Evolutionary Studies
Diversity analysis of different genomes was carried out using DnaSP version 6 (Rozas et al., 2017). FST tests for the 87 genes were carried out with Arlequin 3.5.1.2 (Excoffier and Lischer, 2010). The sequences of the genes from Chinese Spring (CS) were used as a comparison.
Results
Polymorphisms Within Genes Involved in Starch Metabolism
For each of the 300 accessions, 87 genes (Supplementary Table S1) involved in starch metabolism were amplified using 285 pairs of genome-specific primers (Supplementary Table S2) and were then sequenced by high-throughput sequencing (Supplementary Table S3). The amplified sequences aligned to 1,090,267 bp in the CS reference genome4. For each gene, the amplified region contained the entire coding region, from 2.5 kb upstream of the start codon to 500 bp downstream of the stop codon. In total, 8,141 polymorphic sites were detected from the amplified regions among all accessions (Supplementary Table S4): 2,858 in the A genome, 2,843 in the B genome, and 2,440 in the D genome. The nucleotide diversities (π) of genes from the A, B, and D genomes were 0.002918, 0.002439, and 0.001149, respectively (Supplementary Figure S1A). The diversity of the D genome was the lowest: the mean minor allele frequency (MAF) of the D genome was only 0.027 (Supplementary Table S4), which suggested that most variations in the D genome were rare alleles. These polymorphic sites were mainly located in the introns and 5’ UTRs (Supplementary Figure S1B). The A genome contained the highest density of polymorphic sites (7.4 per kb) within coding regions compared with the other two genomes (6.5 and 6.2 per kb; Supplementary Figure S1C). Within the coding regions of the 87 genes, approximately half of the variations were synonymous mutations (SS; Supplementary Figure S1D); the others included 402 non-synonymous mutations (NS) and 73 insertion/deletions (InDels). These NSs and InDels could be useful for functional analyses of these 87 starch metabolism-related genes.
Genetic Structure of Accessions
On the basis of the polymorphic sites identified above, the accessions were separated into Groups 1, 2 and 3 (Figure 1). Accessions of Group 1 consisted of 20 Chinese landraces (CLs) and six foreign cultivars (FCs). Accessions of Group 2 consisted of 81 CLs, 18 modern Chinese cultivars (MCCs), and 10 FCs. Accessions of Group 3 consisted of 14 CLs, 37 MCCs, and 114 FCs. Therefore, Groups 1 and 2 were mainly landraces, and Group 3 contained mainly modern cultivars. Notably, principal coordinate analysis (PCA) suggested that Groups 1 and 2 possessed very different genetic backgrounds (Figure 1).
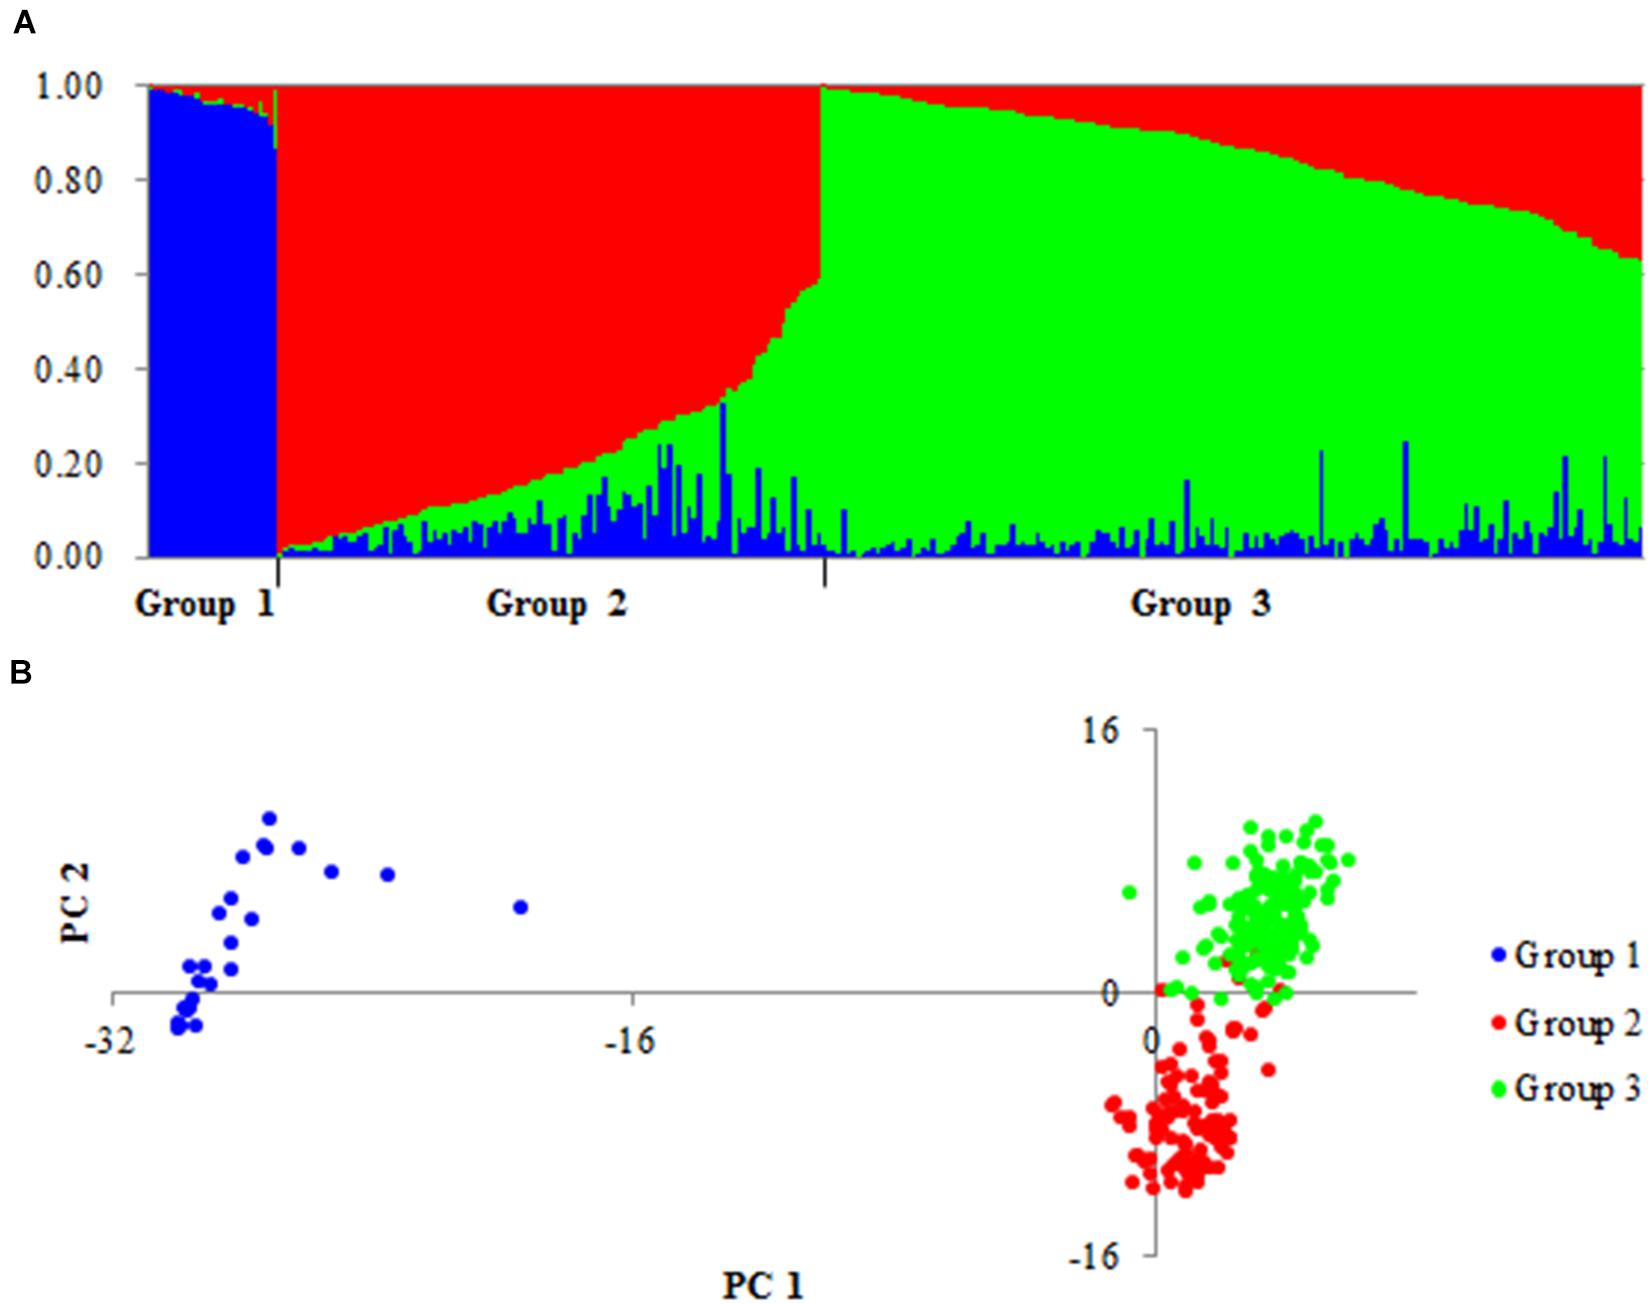
Figure 1. Population structure of 300 accessions based on 8,141 variations. (A) Genetic structure of three groups produced by structures 2.3.4. (B) PCA plots of all accessions based on the same number of markers.
To validate the large difference between Groups 1 and 2, the genetic differentiation (FST) of different groups was detected for all genes in the three groups. Large differences in FST between Groups 1 and 2/3 were detected in 15 genes: 2 genes on chromosome 1A (SSIII-1A and SSIV-1A) and 13 genes on 7A (Figure 2). In Group 1, the SNPs of 15 genes formed haplotype blocks that were genetically distinct from other random haplotypes in Groups 2/3 (Supplementary Figure S2). Given this huge genetic difference, accessions of Group 1 might be useful for the genetic modification of modern cultivars.
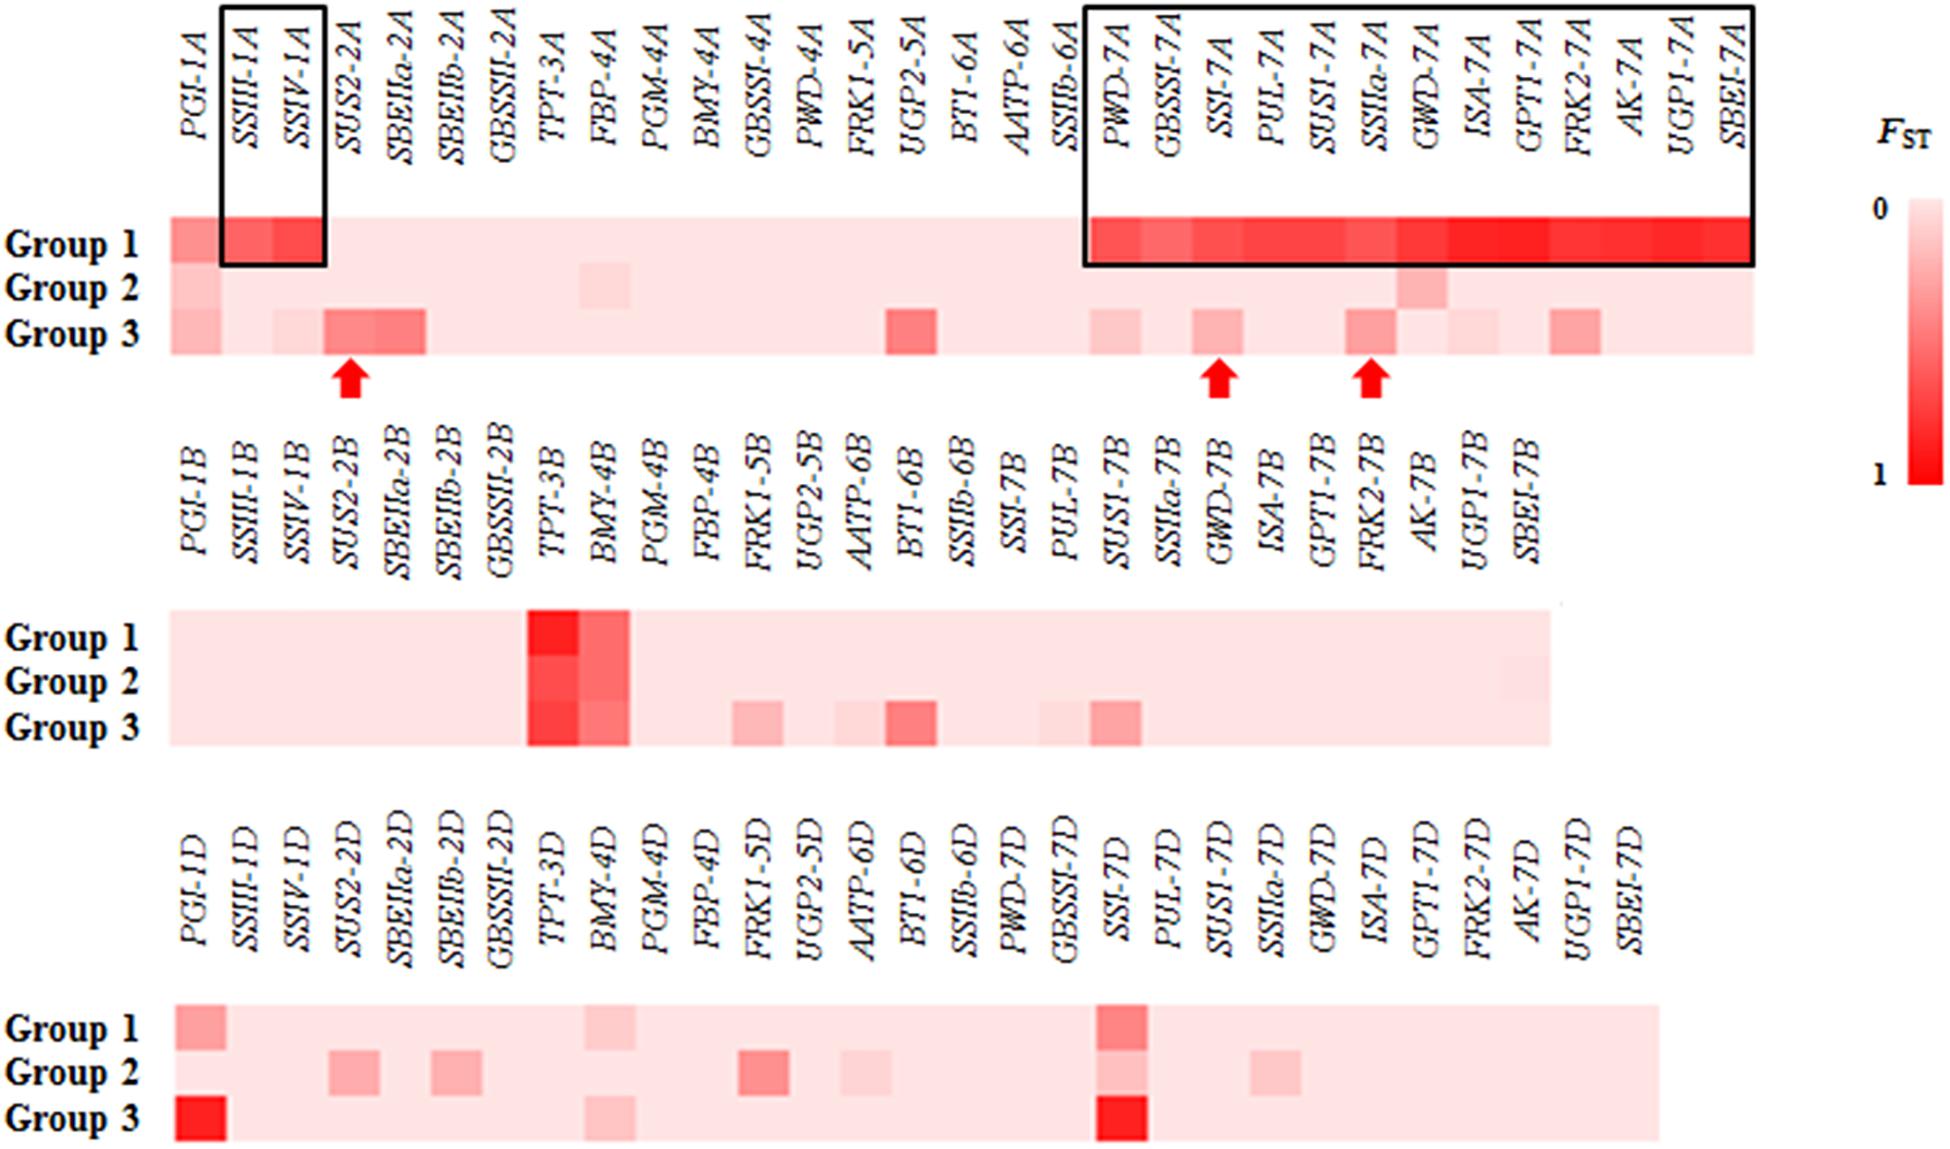
Figure 2. The FST for all of the genes in different groups. Large differences in FST between Group 1 and Group 2/3 were detected at 15 genes (black rectangle). Red arrow: gene associated with thousand kernel weight (TKW) had a different FST in Group 3.
Comparison and Correlation of Six Traits in Three Groups
Thousand kernel weight (TKW), starch content (SC) and amylose content (AC), starch weight per grain (SW), amylose weight per grain (AW), and heading date (HD) of Chinese accessions from the three groups were measured in 2017 and 2018 (Figure 3). The traits of FC and tetraploid wheat were not measured in this study because these accessions flowered too late. The mean TKW, SW, and AW of Group 3 were significantly higher than those of Groups 1/2 in 2017 and 2018 (P < 0.001), but SC did not differ significantly among the three groups. A significant difference in AC was detected only between Groups 2 and 3 in 2018 (P < 0.05). Significant differences in HD existed between Groups 1/2 and 3 (P < 0.05), but the greatest difference in HD between Groups 1 and 3 was only 4.4 days, in 2017.
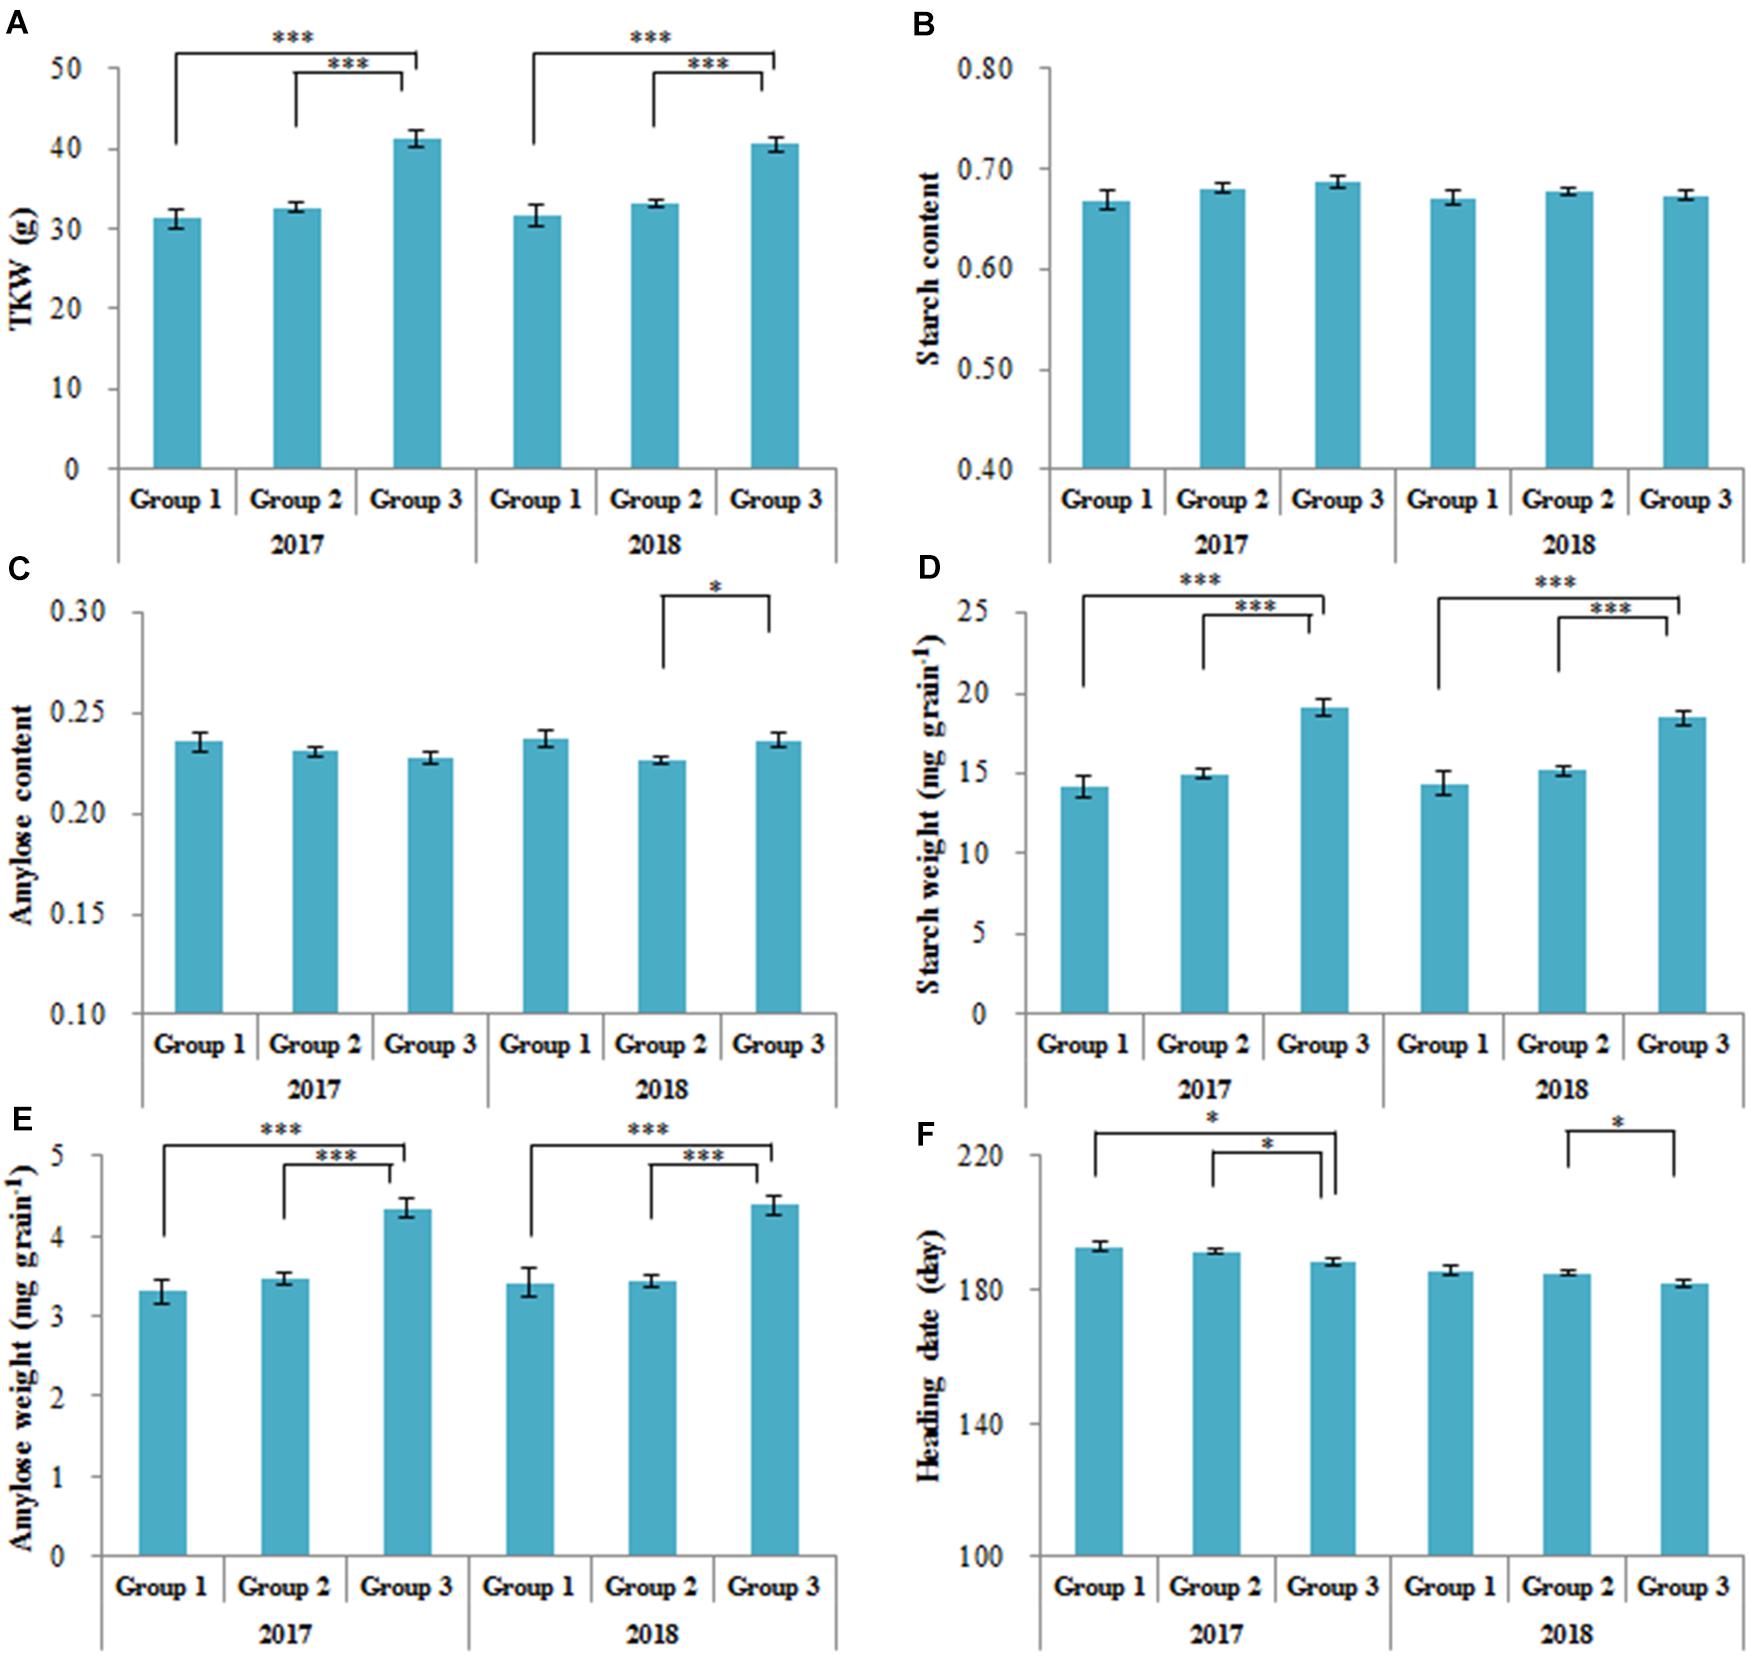
Figure 3. Agronomic traits of three groups (as in Figure 1) in 2017 and 2018. (A) Thousand kernel weight (TKW); (B) starch content; (C) amylose content; (D) starch weight per grain; (E) amylose weight per grain; (F) heading date. ∗P < 0.05; ∗∗∗P < 0.001.
The TKW of accessions fluctuated slightly across different years (Figure 4A). The SC-2017 (SC17) did not correlate with SC-2018 (SC18), although AC-2017 (AC17) correlated with AC-2018 (AC18) in the accessions (R2 = 0.0956). The SW, AW, and HD exhibited the same trends as TKW in 2017 and 2018. The TKW was correlated with SW and AW, but TKW was correlated not with SC, AC (Figures 4B,C), or HD18. These results suggest that TKW, SW, AW, and HD fluctuated little across different years, but SC varied in an irregular manner.
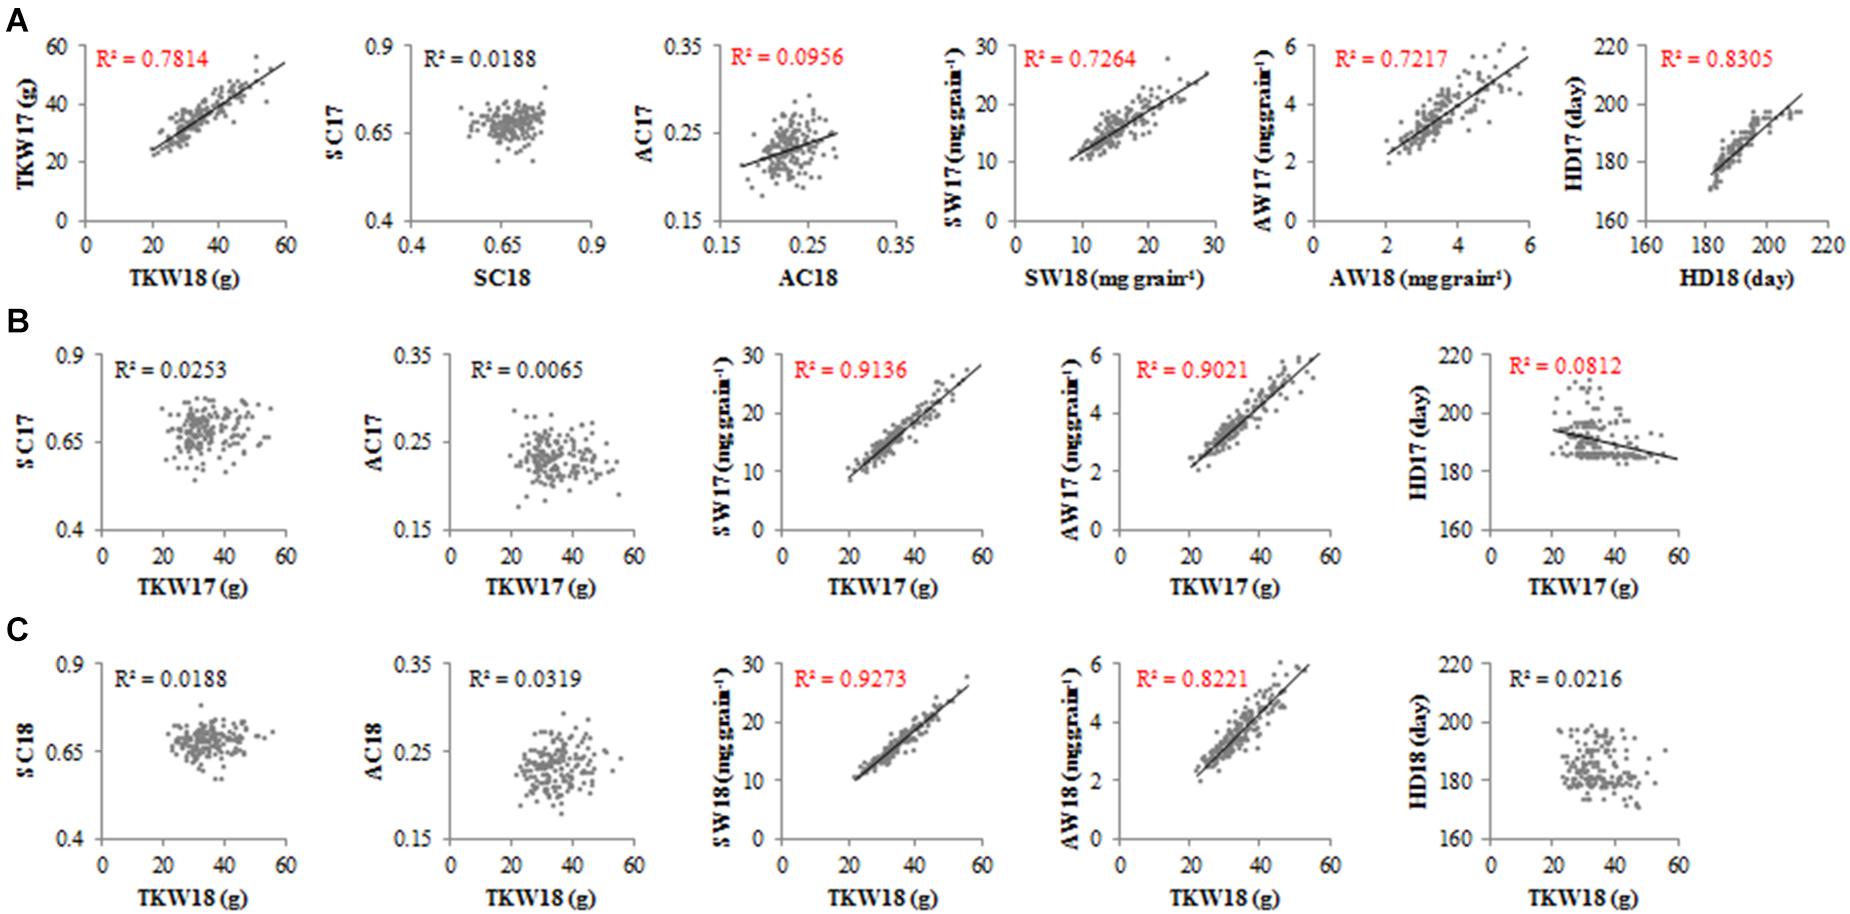
Figure 4. Correlation between traits for all accessions in 2017 and 2018. TKW, thousand kernel weight; SC, starch content; AC, amylose content; SW, starch weight per grain; AW, amylose weight per grain; HD, heading date. (A) Correlation between the same traits in 2017 and 2018. (B) Correlation between TKW and other traits in 2017. (C) Correlation between TKW and other traits in 2018.
Association Analysis With TKW, SW, and AW
To clarify whether the detected genetic variations influenced TKW, 1,102 variations were selected to test for their association with TKW (MAF > 0.05 and missing ratio < 10%). The significance threshold was given as P < 0.05/1102; namely, -log10 P > 4.343. Six genes (SUS2-2A, SBEIIb-2A, SBEIIb-2B, BMY-4A, SSI-7A, and SSIIa-7A) were associated with TKW in 2017 and 2018 (Figures 5A,B). Association signals were mainly distributed on the A genome (chromosomes 2A, 4A, and 7A). Because SW and AW had high correlation coefficients with TKW, the genes associated with SW and AW were similar to those associated with TKW (Figures 5C–F).
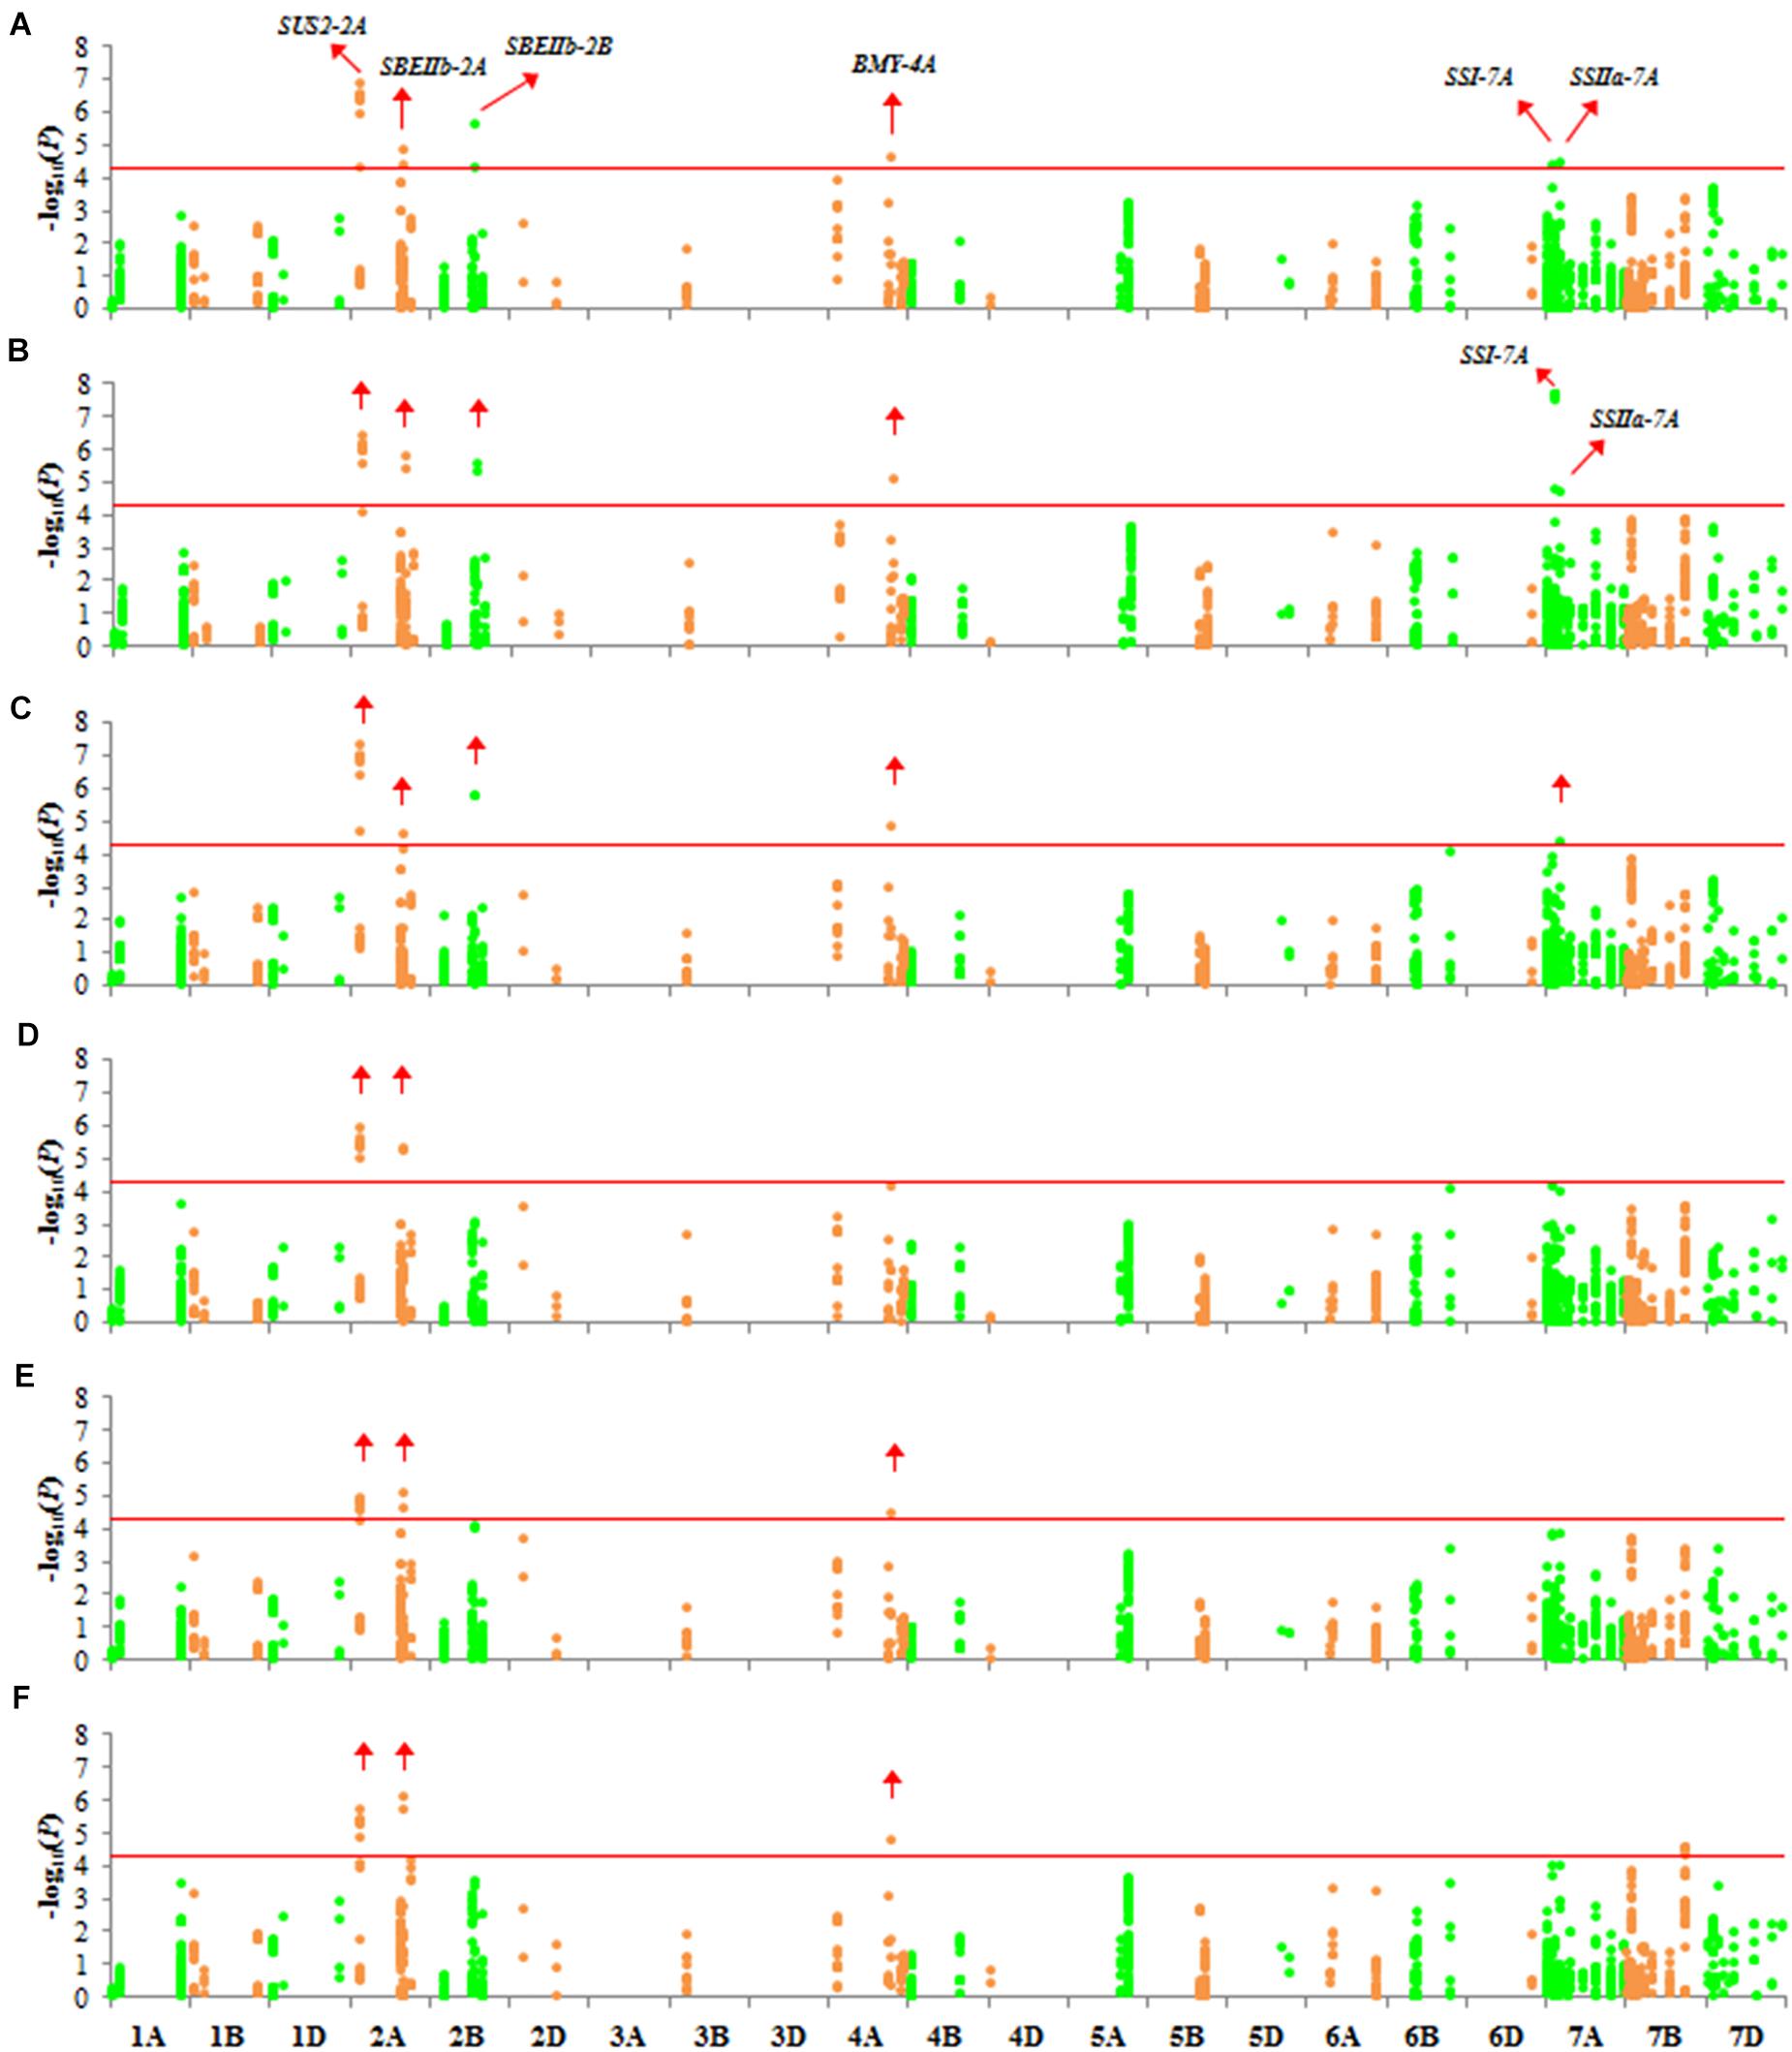
Figure 5. Manhattan plots for TKW, SW, and AW with 1,102 markers with MLM (Q + K) at P < 4.537 × 10⁻⁵. The red horizontal line corresponds to the threshold value for significant association. Green and orange colors represent different chromosomes. Significantly associated genes are labeled with red arrows. (A) TKW in 2017; (B) TKW in 2018; (C) SW in 2017; (D) SW in 2018; (E) AW in 2017; (F) AW in 2018.
Because significant differences in TKW were observed between Group 1/2 and Group 3, we examined differences in FST of Group 3. Three genes associated with TKW had a different FST in Group 3 (Figure 2, red arrows). Among these genes, we detected three non-synonymous mutations, located in the second exon of SUS2-2A (GGG → GAG, chr2A: 121145639), and in the second (AAC → AAG, chr7A: 77440026) and eleventh (AAC → AGC, chr7A: 77435977) exons of SSI-7A.
Association Analysis With SC and AC
We detected no variation associated with SC or AC (Figure 6). However, association signals (-log10 P) of loci on two genes, SUS2-2B and SBEIIa-2A, were above 4 with AC (Figures 6C,D). SBEIIa-2A plays a role in the amyloplast. However, these association signals were either in introns or in the UTRs, and therefore, these genes influence AC requires further verification.
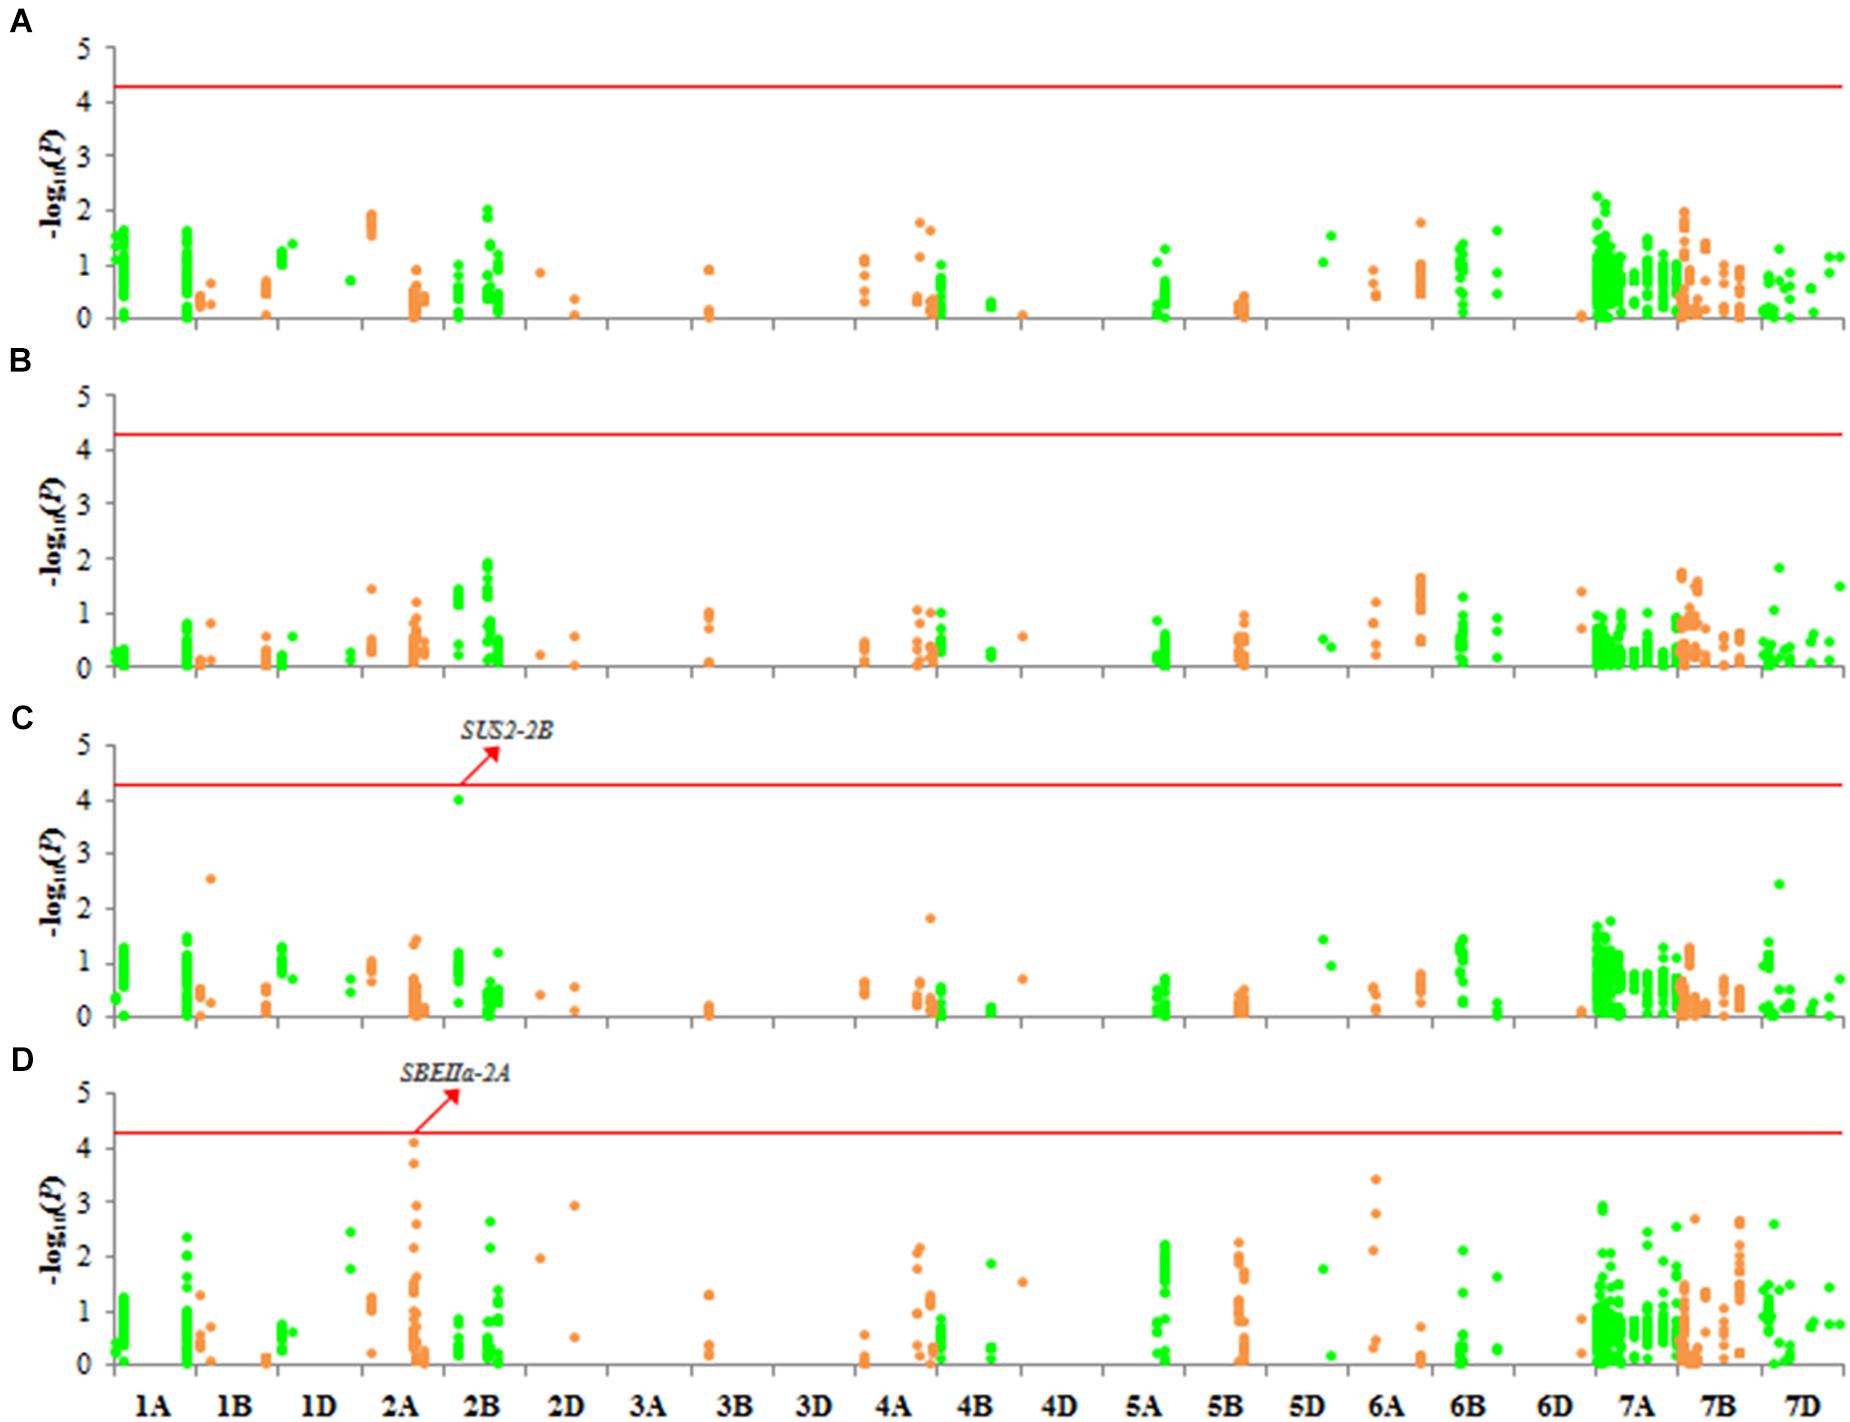
Figure 6. Manhattan plots for SC and AC with 1,102 markers with MLM (Q + K) at P < 4.537 × 10⁻⁵. (A) SC in 2017; (B) SC in 2018; (C) AC in 2017; (D) AC in 2018.
Six Genes Have an Additive Effect on TKW
We detected six genes associated with TKW. Variations in these genes mainly comprised two haplotypes: CS types and non-CS types. For the six genes, non-CS types were favorable haplotypes associated with a higher TKW. Among the three groups, the haplotype frequencies of these genes differed markedly (Supplementary Table S3). The materials were classified into three groups based on the number of favorable haplotypes (NFH), namely N1 (NFH 0), N2 (NFH 1–3), and N3 (NFH 4–6). The mean NFH values in the three groups were 1.1, 0.9, and 4.8, respectively. In Chinese accessions, the frequencies of favorable haplotypes varied widely in Group 3 compared with those in Group 1/2 (Figure 7A), which suggested that favorable haplotypes underwent selection in the breeding process. Accessions of N3 had the highest TKW among all accessions (Figure 7B). Notably, the greater the NFH in an accession, the greater the TKW; this pattern suggests that the favorable haplotypes of these genes had additive effects on TKW.
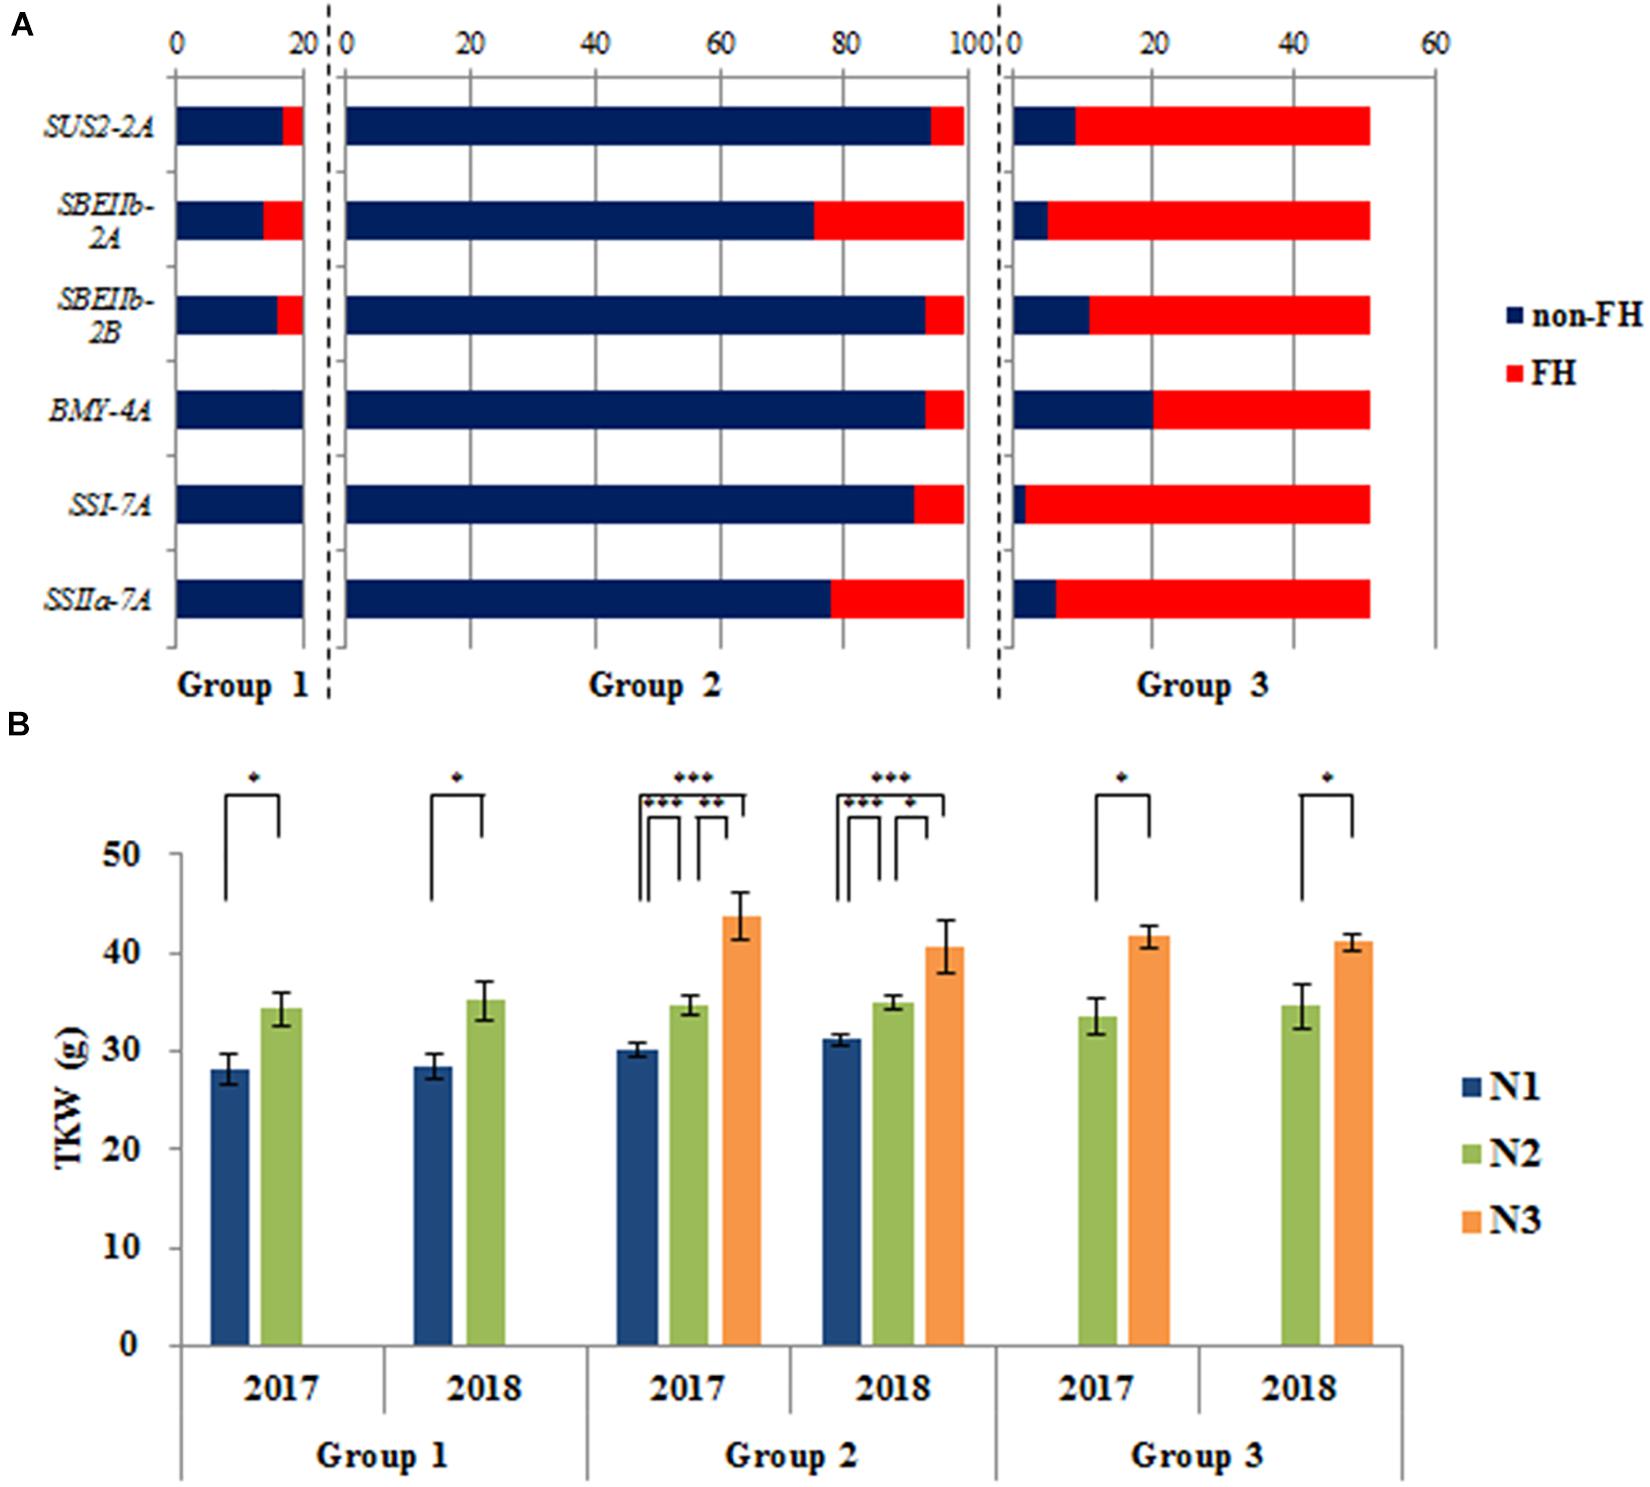
Figure 7. The additive effects of six genes on TKW. (A) Components of favorable haplotypes (FH) of six genes in three groups in Chinese accessions; (B) TKW of different numbers of favorable haplotypes (NFHs) in three groups in Chinese accessions. N1 (NFH 0), N2 (NFH 1–3), and N3 (NFH 4–6). *P < 0.05; **P < 0.01; ***P < 0.001.
Discussion
Previous research on single genes involved in starch metabolism has often failed to explain substantial changes in phenotype (Weichert et al., 2010; Cakir et al., 2016). In this study, we sequenced 87 genes involved in starch metabolism from 300 wheat accessions and measured six traits (TKW, SC, AC, SW, AW, and HD) of CL and MCC in 2017 and 2018. We detected no significant correlation between starch content (SC) over different years (Figure 4). These results are similar to the findings of Fahy et al. (2018), who reported no significant correlation between the SC of mature or developing grains in 2013 and 2014. We conclude that SC varies irregularly and may be easily influenced by environmental factors.
Studies of SC or amylose content (AC) in cereal crops have mainly relied on functional mutational analysis and QTL mapping. In rice, an A-to-G change that results in an Asp165/Gly165 substitution at GBSSI led to a low AC in a Yunnan rice landrace (Liu et al., 2009). Several mutations in TaAGP.L-B1 and TaSSIVb-D genes resulted in different expression patterns of TaGBSSII (upregulated), TaAGPSS, TaSSI, and TaSBEII (downregulated) and led to a reduction in starch and amylopectin contents (Zhang S. L. et al., 2019). In a wheat double haploid (DH) population derived from Huapei 3 and Yumai 57, the two QTLs QTsc4A.1 and QAms4A.1 were associated with SC and AC at five stages under three treatments in two seasons, and they also were expressed from 12 to 22 DAF (Tian et al., 2015). In the natural population examined here, we identified only two genes (SUS2-2B and SBEIIa-2A) that may be associated with AC (Figure 6); their function in affecting the amylose content requires further study. In addition, 15 genes located on chromosomes 1A and 7A had very different variations in Group 1 (Figure 2 and Supplementary Figure S2). PCA similarly revealed that accessions of Group 1 had different genetic backgrounds (Figure 1), which suggested they might origin from different tetraploid ancestors. Several of these 15 genes, including SSIII-1A, SSIV-1A, GBSSI-7A, SSI-7A, SSIIa-7A, ISA-7A and SBEI-7A, encoded enzymes that are functional in the amyloplast. Group 1 was not associated with SC or AC, but this might due to the small size of Group 1 (only 20 Chinese landraces were measured in the study). A DH or recombinant inbred (RIL) population derived from accessions in Groups 1 and 2/3 could be used to analyze these specific variations further.
In this study, six genes associated with TKW were mainly associated with SW and AW, which suggests that optimizing starch metabolism might improve TKW in wheat. Different haplotypes containing key mutations could lead to trait changes (Deng et al., 2018). Three non-synonymous mutations in SUS2-2A and SSI-7A, which form different haplotypes, could be developed into functional markers for high TKW. However, functional mutations in natural populations are limited. Several transcription factors affect starch biosynthesis in rice and maize (Peng et al., 2014; Huang et al., 2016; Zhang et al., 2016; Wu et al., 2019; Zhang Z. Y. et al., 2019; Deng et al., 2020). However, only a few transcription factors have been reported to affect starch biosynthesis in wheat and include, for example, TabZIP28 and TaRSR1 (Liu et al., 2016; Song et al., 2020). Novel transcription factor mining might represent a useful direction by which to improve starch synthesis in wheat.
We previously studied the artificial selection of genes that influence TKW, such as TaSUS1 and TaSUS2 (Hou et al., 2014), TaAGPL and TaAGPS1 (Hou et al., 2017), TaCWI (Jiang et al., 2015), TaBT1 (Wang et al., 2019), TaGW2 (Qin et al., 2014), TaGS5 (Ma et al., 2016), and qKW-6A (Chen et al., 2019). In this study, six important genes associated with TKW were analyzed to uncover further the frequency changes of haplotypes and their additive effects on TKW (Figure 7). The favorable haplotypes were probably selected from landraces to produce modern cultivars. Because the effects of favorable haplotypes are mainly additive, these variations could help guide the design of functional markers to assist in breeding for high yield.
Conclusion
We sequenced 87 genes involved in starch metabolism in 300 wheat accessions and identified SNPs associated with TKW, SC, AC, SW, and AW. The TKW, SW, and AW fluctuated little across different years, but SC varied irregularly. Six genes were associated with TKW, SW, and AW, which could be exploited for high TKW. The favorable haplotypes had positive additive effects on TKW.
Data Availability Statement
The datasets presented in this study can be found in online repositories. The names of the repository/repositories and accession number(s) can be found in the article/ Supplementary Material.
Author Contributions
JH performed the experiments and data analysis and prepared the manuscript. YL contributed to collecting and measuring phenotypic data in 2017 and 2018. CH, TL, and HL provided experimental material. XZ, the corresponding author, conceived the original research and revised the manuscript. All authors contributed to the article and approved the submitted version.
Funding
This work was supported by grants from the National Key Research and Development Program of China (2017YFD0102003 and 2016YFD0100302), the International Cooperation Program of Ministry of Agriculture (2016-X16), the CAAS-Fundamental Research Funds for Central Non-Profit of Institute of Crop Sciences (Y2017PT39), and the CAAS-Innovation Program.
Conflict of Interest
The authors declare that the research was conducted in the absence of any commercial or financial relationships that could be construed as a potential conflict of interest.
Acknowledgments
We thank Dr. Yan Zhang, Dr. Zhonghu He, and Miss Jinmei Wang (Institute of Crop Sciences, Chinese Academy of Agricultural Sciences) for help in flour milling.
Supplementary Material
The Supplementary Material for this article can be found online at: https://www.frontiersin.org/articles/10.3389/fpls.2020.562008/full#supplementary-material
Supplementary Figure 1 | Polymorphic sites of all the 87 genes. (A) Nucleotide diversity (π) of the A, B, and D genome; (B) numbers of polymorphic sites at different regions of all genes; (C) density of polymorphic sites at the coding regions on the A, B, and D genome; (D) numbers of three types of mutations: SS, synonymous mutations; NS, non-synonymous mutations; InDels, insertions/deletions.
Supplementary Figure 2 | Haplotypes of 15 genes located on chromosomes 1A and 7A. Horizontal lines represent variations within each gene (light blue, CS type; orange, non-CS type); vertical lines represent accessions in each group. Chromosomes 1A and 7A (left, short arm; right, long arm) are at the top. 1, SSIII-1A; 2, SSIV-1A; 3, PWD-7A; 4, GBSSI-7A; 5, SSI-7A; 6, PUL-7A; 7, SUS1-7A; 8, SSIIa-7A; 9, GWD-7A; 10, ISA-7A; 11, GPT1-7A; 12, FRK2-7A; 13, AK-7A; 14, UGP1-7A; 15, SBEI-7A.
Supplementary Table 1 | Genes used in this study and their chromosome locations.
Supplementary Table 2 | Primers used in this study. Primers were designed according to the CS v1 reference sequence.
Supplementary Table 3 | Accessions and their agronomic traits in 2017 and 2018.
Supplementary Table 4 | Polymorphic sites detected in all accessions.
Footnotes
- ^ www.bioinformatics.babraham.ac.uk/projects/fastqc
- ^ software.broadinstitute.org/gatk
- ^ http://www.wheatgenome.org/
- ^ https://wheat-urgi.versailles.inra.fr/Seq-Repository
References
Baroja-Fernández, E., Muñoz, F. J., Montero, M., Etxeberria, E., Sesma, M. T., Ovecka, M., et al. (2009). Enhancing sucrose synthase activity in transgenic potato (Solanum tuberosum L.) tubers results in increased levels of starch, ADP glucose and UDP glucose and total yield. Plant Cell Physiol. 50, 1651–1662. doi: 10.1093/pcp/pcp108
Barron, C., Surget, A., and Rouau, X. (2007). Relative amounts of tissues in mature wheat (Triticum aestivum L.) grain and their carbohydrate and phenolic acid composition. J. Cereal Sci. 45, 88–96. doi: 10.1016/j.jcs.2006.07.004
Botticella, E., Sestili, F., Sparla, F., Moscatello, S., Marri, L., and Cuesta-Seijo, J. A. (2018). Combining mutations at genes encoding key enzymes involved in starch synthesis affects the amylose content, carbohydrate allocation and hardness in the wheat grain. Plant Biotechnol. J. 16, 1723–1734. doi: 10.1111/pbi.12908
Bowsher, C. G., Scrase-Field, E. F., Esposito, S., Emes, M. J., and Tetlow, I. J. (2007). Characterization of ADP-glucose transport across the cereal endosperm amyloplast envelope. J. Exp. Bot. 58, 1321–1332. doi: 10.1093/jxb/erl297
Bradbury, P. J., Zhang, Z., Kroon, D. E., Casstevens, T. M., Ramdoss, Y., and Buckler, E. S. (2007). TASSEL: software for association mapping of complex traits in diverse samples. Bioinformatics 23, 2633–2635. doi: 10.1093/bioinformatics/btm308
Cakir, B., Shiraishi, S., Tuncel, A., Matsusaka, H., Satoh, R., Singh, S., et al. (2016). Analysis of the rice ADP-glucose transporter (OsBT1) indicates the presence of regulatory processes in the amyloplast stroma that control ADP-Glucose flux into starch. Plant Physiol. 170, 1271–1283. doi: 10.1104/pp.15.01911
Chen, W. G., Sun, D. Z., Yan, X., Li, R. Z., Wang, S. G., Shi, Y. G., et al. (2019). QTL analysis of wheat kernel traits, and genetic effects of qKW-6A on kernel width. Euphytica 215:11. doi: 10.1007/s10681-018-2333-x
Deng, Y., Liu, H. B., Zhou, Y., Zhang, Q. L., Li, X. H., and Wang, S. P. (2018). Exploring the mechanism and efficient use of a durable gene-mediated resistance to bacterial blight disease in rice. Mol. Breed. 38:18. doi: 10.1007/s11032-018-0778-1
Deng, Y. T., Wang, J. C., Zhang, Z. Y., and Wu, Y. R. (2020). Transactivation of Sus1 and Sus2 by Opaque2 is an essential supplement to sucrose synthase-mediated endosperm filling in maize. Plant Biotechnol. J. 18, 1897–1907. doi: 10.1111/pbi.13349
Evanno, G., Regnaut, S., and Goudet, J. (2005). Detecting the number of clusters of individuals using the software STRUCTURE: a simulation study. Mol. Ecol. 14, 2611–2620. doi: 10.1111/j.1365-294X.2005.02553.x
Excoffier, L., and Lischer, H. E. L. (2010). Arlequin suite ver 3.5: a new series of programs to perform population genetics analyses under Linux and Windows. Mol. Ecol. Resour. 10, 564–567. doi: 10.1111/j.1755-0998.2010.02847.x
Fahy, B., Siddiqui, H., David, L. C., Powers, S. J., Borrill, P., Uauy, C., et al. (2018). Final grain weight in wheat is not strongly influenced by sugar levels or activities of key starch synthesising enzymes during grain filling. J. Exp. Bot. 69, 5461–5475. doi: 10.1093/jxb/ery314
Geigenberger, P., Stamme, C., Tjaden, J., Schulz, A., Quick, P. W., Betsche, T., et al. (2001). Tuber physiology and properties of starch from tubers of transgenic potato plants with altered plastidic adenylate transporter activity. Plant Physiol. 125, 1667–1678. doi: 10.1104/pp.125.4.1667
Hannah, L. C., and James, M. (2008). The complexities of starch biosynthesis in cereal endosperms. Curr. Opin. Biotechnol. 19, 160–165. doi: 10.1016/j.copbio.2008.02.013
Hao, C. Y., Wang, L. F., Ge, H. M., Dong, Y. C., and Zhang, X. Y. (2011). Genetic diversity and linkage disequilibrium in Chinese bread wheat (Triticum aestivum L.) revealed by SSR markers. PLoS One 6:e17279. doi: 10.1371/journal.pone.0017279
Hou, J., Jiang, Q., Hao, C., Wang, Y., Zhang, H., and Zhang, X. (2014). Global selection on sucrose synthase haplotypes during a century of wheat breeding. Plant Physiol. 164, 1918–1929. doi: 10.1104/pp.113.232454
Hou, J., Li, T., Wang, Y., Hao, C., Liu, H., and Zhang, X. (2017). ADP-glucose pyrophosphorylase genes, associated with kernel weight, underwent selection during wheat domestication and breeding. Plant Biotechnol. J. 15, 1533–1543. doi: 10.1111/pbi.12735
Huang, H. H., Xie, S. D., Xiao, Q. L., Wei, B., Zheng, L. J., Wang, Y. B., et al. (2016). Sucrose and ABA regulate starch biosynthesis in maize through a novel transcription factor, ZmEREB156. Sci. Rep. 6, 27590. doi: 10.1038/srep27590
Jeon, J. S., Ryoo, N., Hahn, T. R., Walia, H., and Nakamura, Y. (2010). Starch biosynthesis in cereal endosperm. Plant Physiol. Biochem. 48, 383–392. doi: 10.1016/j.plaphy.2010.03.006
Jiang, Y., Jiang, Q., Hao, C., Hou, J., Wang, L., Zhang, H., et al. (2015). A yield-associated gene TaCWI, in wheat: its function, selection and evolution in global breeding revealed by haplotype analysis. Theor. Appl. Genet. 128, 131–143. doi: 10.1007/s00122-014-2417-5
Kang, G., Liu, G., Peng, X., Wei, L., Wang, C., Zhu, Y., et al. (2013). Increasing the starch content and grain weight of common wheat by overexpression of the cytosolic AGPase large subunit gene. Plant Physiol. Biochem. 73, 93–98. doi: 10.1016/j.plaphy.2013.09.003
Keeling, P. L., and Myers, A. M. (2010). Biochemistry and genetics of starch synthesis. Annu. Rev. Food Sci. Technol. 1, 271–303. doi: 10.1146/annurev.food.102308.124214
Li, J., Baroja-Fernández, E., Bahaji, A., Muñoz, F. J., Ovecka, M., Montero, M., et al. (2013). Enhancing sucrose synthase activity results in increased levels of starch and ADP-glucose in maize (Zea mays L.) seed endosperms. Plant Cell Physiol. 54, 282–294. doi: 10.1093/pcp/pcs180
Li, S., Wei, X., Ren, Y., Qiu, J., Jiao, G., Guo, X., et al. (2017). OsBT1 encodes an ADP-glucose transporter involved in starch synthesis and compound granule formation in rice endosperm. Sci. Rep. 7:40124. doi: 10.1038/srep40124
Liu, G. Y., Wu, Y. F., Xu, M. J., Gao, T., Wang, P. F., Wang, L. N., et al. (2016). Virus-induced gene silencing identifies an important role of the TaRSR1 transcription factor in starch synthesis in bread wheat. Int. J. Mol. Sci. 17:1557. doi: 10.3390/ijms17101557
Liu, L. L., Ma, X. D., Liu, S. J., Zhu, C. L., Jiang, L., Wang, Y. H., et al. (2009). Identification and characterization of a novel Waxy allele from a Yunnan rice landrace. Plant Mol. Biol. 71, 609–626. doi: 10.1007/s11103-009-9544-9544
Ma, L., Li, T., Hao, C., Wang, Y., Chen, X., and Zhang, X. (2016). TaGS5-3A, a grain size gene selected during wheat improvement for larger kernel and yield. Plant Biotechnol. J. 14, 1269–1280. doi: 10.1111/pbi.12492
McCleary, B. V., Gibson, T. S., and Mugford, D. C. (1997). Measurement of total starch in cereal products by amyloglucosidase-alpha-amylase method: collaborative study. J. AOAC Intern. 80, 571–579.
Möhlmann, T., Tjaden, J., Schwöppe, C., Winkler, H. H., Kampfenkel, K., and Neuhaus, H. E. (1998). Occurrence of two plastidic ATP/ADP transporters in Arabidopsis thaliana L. molecular characterisation and comparative structural analysis of similar ATP/ADP translocators from plastids and Rickettsia prowazekii. Eur. J. Biochem. 252, 353–359. doi: 10.1046/j.1432-1327.1998.2520353.x
Nakamura, T., Yamamori, M., Hirano, H., Hidaka, S., and Nagamine, T. (1995). Production of waxy (amylose-free) wheats. Mol. Gen. Genet. 248, 253–259. doi: 10.1007/bf02191591
Patron, N. J., Smith, A. M., Fahy, B. F., Hylton, C. M., Naldrett, M. J., Rossnagel, B. G., et al. (2002). The altered pattern of amylose accumulation in the endosperm of low-amylose barley cultivars is attributable to a single mutant allele of granule-bound starch synthase I with a deletion in the 5’-non-coding region. Plant Physiol. 130, 190–198. doi: 10.1104/pp.005454
Peng, C., Wang, Y. H., Liu, F., Ren, Y. L., Zhou, K. N., Lv, J., et al. (2014). FLOURY ENDOSPERM 6 encodes a CBM48 domain-containing protein involved in compound granule formation and starch synthesis in rice endosperm. Plant J. 77, 917–930. doi: 10.1111/tpj.12444
Perez, L., Soto, E., Farre, G., Juanos, J., Villorbina, G., Bassie, L., et al. (2019). CRISPR/Cas9 mutations in the rice Waxy/GBSSI gene induce allele-specific and zygosity-dependent feedback effects on endosperm starch biosynthesis. Plant Cell Rep. 38, 417–433. doi: 10.1007/s00299-019-02388-z
Pritchard, J. K., Stephens, M., Rosenberg, N. A., and Donnelly, P. (2000). Association mapping in structured populations. Am. J. Hum. Genet. 67, 170–181. doi: 10.1086/302959
Qin, L., Hao, C., Hou, J., Wang, Y., Li, T., Wang, L., et al. (2014). Homologous haplotypes, expression, genetic effects and geographic distribution of the wheat yield gene TaGW2. BMC Plant Biol. 14:107. doi: 10.1186/1471-2229-14-107
Ral, J. P., Bowerman, A. F., Li, Z., Sirault, X., Furbank, R., Pritchard, J. R., et al. (2012). Down-regulation of glucan, water-dikinase activity in wheat endosperm increases vegetative biomass and yield. Plant Biotechnol. J. 10, 871–882. doi: 10.1111/j.1467-7652.2012.00711.x
Rozas, J., Ferrer-Mata, A., Sánchez-DelBarrio, J. C., Guirao-Rico, S., Librado, P., Ramos-Onsins, S. E., et al. (2017). DnaSP v6: DNA sequence polymorphism analysis of large datasets. Mol. Biol. Evol. 34, 3299–3302. doi: 10.1093/molbev/msx248
Sano, Y. (1984). Differential regulation of waxy gene expression in rice endosperm. Theor. Appl. Genet. 68, 467–473. doi: 10.1007/BF00254822
Smidansky, E. D., Clancy, M., Meyer, F. D., Lanning, S. P., Blake, N. K., Talbert, L. E., et al. (2002). Enhanced ADP-glucose pyrophosphorylase activity in wheat endosperm increases seed yield. Proc. Natl. Acad. Sci. U.S.A. 99, 1724–1729. doi: 10.1073/pnas.022635299
Song, Y. H., Luo, G. B., Shen, L. S., Yu, K., Yang, W. L., Li, X., et al. (2020). TubZIP28, a novel bZIP family transcription factor from Triticum urartu and TabZIP28, its homolog from Triticum aestivum enhance starch synthesis in wheat. New Phytol. 226, 1384–1398. doi: 10.1111/nph.16435
Stitt, M., and Zeeman, S. C. (2012). Starch turnover: pathways, regulation and role in growth. Curr. Opin. Plant Biol. 15, 282–292. doi: 10.1016/j.pbi.2012.03.016
Tang, X. J., Peng, C., Zhang, J., Cai, Y., You, X. M., Kong, F., et al. (2016). ADP-glucose pyrophosphorylase large subunit 2 is essential for storage substance accumulation and subunit interactions in rice endosperm. Plant Sci. 249, 70–83. doi: 10.1016/j.plantsci.2016.05.010
Tian, B., Deng, Z. Y., Xie, Q. G., and Tian, J. C. (2015). Genetic dissection of the developmental behaviour of total starch content and its components in wheat grain. Crop Past. Sci. 66, 445–455. doi: 10.1071/CP14059
Tjaden, J., Möhlmann, T., Kampfenkel, K., Henrichs, G., and Neuhaus, H. E. (1998). Altered plastidic ATP/ADP-transporter activity influences potato (Solanum tuberosum L.) tuber morphology, yield and composition of tuber starch. Plant J. 16, 531–540. doi: 10.1046/j.1365-313x.1998.00317.x
Tsai, C. Y. (1974). The function of waxy locus in starch synthesis in maize endosperm. Biochem. Genet. 11, 83–96. doi: 10.1007/bf00485766
Wang, Y., Hou, J., Liu, H., Li, T., Wang, K., Hao, C., et al. (2019). TaBT1, affecting starch synthesis and thousand kernel weight, underwent strong selection during wheat improvement. J. Exp. Bot. 70, 1497–1511. doi: 10.1093/jxb/erz032
Weichert, N., Saalbach, I., Weichert, H., Kohl, S., Erban, A., Kopka, J., et al. (2010). Increasing sucrose uptake capacity of wheat grains stimulates storage protein synthesis. Plant Physiol. 152, 698–710. doi: 10.1104/pp.109.150854
Wu, M. M., Ren, Y. L., Cai, M. H., Wang, Y. L., Zhu, S. S., Zhu, J. P., et al. (2019). Rice FLOURY ENDOSPERM 10 encodes a pentatricopeptide repeat protein that is essential for the trans-splicing of mitochondrial nad1 intron 1 and endosperm development. New Phytol. 223, 736–750. doi: 10.1111/nph.15814
Zhang, L., Ren, Y. L., Lu, B. Y., Yang, C. Y., Feng, Z. M., Liu, Z., et al. (2016). FLOURY ENDOSPERM 7 encodes a regulator of starch synthesis and amyloplast development essential for peripheral endosperm development in rice. J. Exp. Bot. 67, 633–647. doi: 10.1093/jxb/erv469
Zhang, S. L., Guo, H. J., Irshad, A., Xie, Y. D., Zhao, L. S., Xiong, H. C., et al. (2019). The synergistic effects of TaAGP.L-B1 and TaSSIVb-D mutations in wheat lead to alterations of gene expression patterns and starch content in grain development. PLoS One 14:e0223783. doi: 10.1371/journal.pone.0223783
Keywords: wheat, starch metabolism, association study, kernel weight, starch content, amylose content, haplotype
Citation: Hou J, Liu Y, Hao C, Li T, Liu H and Zhang X (2020) Starch Metabolism in Wheat: Gene Variation and Association Analysis Reveal Additive Effects on Kernel Weight. Front. Plant Sci. 11:562008. doi: 10.3389/fpls.2020.562008
Received: 14 May 2020; Accepted: 15 September 2020;
Published: 06 October 2020.
Edited by:
Abraham J. Escobar-Gutiérrez, Institut National de Recherche pour l’agriculture, l’alimentation et l’environnement (INRAE), FranceReviewed by:
Xiaoli Jin, Zhejiang University, ChinaJacques Le Gouis, INRAE Clermont-Auvergne-Rhône-Alpes, France
Copyright © 2020 Hou, Liu, Hao, Li, Liu and Zhang. This is an open-access article distributed under the terms of the Creative Commons Attribution License (CC BY). The use, distribution or reproduction in other forums is permitted, provided the original author(s) and the copyright owner(s) are credited and that the original publication in this journal is cited, in accordance with accepted academic practice. No use, distribution or reproduction is permitted which does not comply with these terms.
*Correspondence: Xueyong Zhang, emhhbmd4dWV5b25nQGNhYXMuY24=
†These authors have contributed equally to this work
 Jian Hou
 Yunchuan Liu
 Chenyang Hao
 Tian Li
 Hongxia Liu
 Xueyong Zhang