
94% of researchers rate our articles as excellent or good
Learn more about the work of our research integrity team to safeguard the quality of each article we publish.
Find out more
ORIGINAL RESEARCH article
Front. Plant Sci., 26 June 2020
Sec. Technical Advances in Plant Science
Volume 11 - 2020 | https://doi.org/10.3389/fpls.2020.00927
This article is part of the Research TopicState-of-the-art Technology and Applications in Crop PhenomicsView all 20 articles
 Mengjiao Yang1†
 Muhammad Adeel Hassan1†
 Kaijie Xu2
 Chengyan Zheng1
 Awais Rasheed1,3,4
 Yong Zhang1
 Xiuliang Jin5
 Xianchun Xia1
 Yonggui Xiao1*
 Zhonghu He1,4*
Unmanned aerial vehicle (UAV) based remote sensing is a promising approach for non-destructive and high-throughput assessment of crop water and nitrogen (N) efficiencies. In this study, UAV was used to evaluate two field trials using four water (T0 = 0 mm, T1 = 80 mm, T2 = 120 mm, and T3 = 160 mm), and four N (T0 = 0, T1 = 120 kg ha–1, T2 = 180 kg ha–1, and T3 = 240 kg ha–1) treatments, respectively, conducted on three wheat genotypes at two locations. Ground-based destructive data of water and N indictors such as biomass and N contents were also measured to validate the aerial surveillance results. Multispectral traits including red normalized difference vegetation index (RNDVI), green normalized difference vegetation index (GNDVI), normalized difference red-edge index (NDRE), red-edge chlorophyll index (RECI) and normalized green red difference index (NGRDI) were recorded using UAV as reliable replacement of destructive measurements by showing high r values up to 0.90. NGRDI was identified as the most efficient non-destructive indicator through strong prediction values ranged from R2 = 0.69 to 0.89 for water use efficiencies (WUE) calculated from biomass (WUE.BM), and R2 = 0.80 to 0.86 from grain yield (WUE.GY). RNDVI was better in predicting the phenotypic variations for N use efficiency calculated from nitrogen contents of plant samples (NUE.NC) with high R2 values ranging from 0.72 to 0.94, while NDRE was consistent in predicting both NUE.NC and NUE.GY by 0.73 to 0.84 with low root mean square errors. UAV-based remote sensing demonstrates that treatment T2 in both water 120 mm and N 180 kg ha–1 supply trials was most appropriate dosages for optimum uptake of water and N with high GY. Among three cultivars, Zhongmai 895 was highly efficient in WUE and NUE across the water and N treatments. Conclusively, UAV can be used to predict time-series WUE and NUE across the season for selection of elite genotypes, and to monitor crop efficiency under varying N and water dosages.
Low water and nutrient uptake efficiency of crops is one of the most detrimental limitation in agriculture productivity (Chuan et al., 2016; Lesk et al., 2016). Efficient irrigation and nitrogen (N) supply according to the plant requirement is a key regulator for resource-efficient crop yield (Christopher et al., 2016; Chuan et al., 2016; Nehe et al., 2018; Thorp et al., 2018). Amelioration in uptake efficiency can be adjusted by manipulation of dosage of water and N-fertilizer (Ali and Talukder, 2008) or by improving input use efficiency in crop cultivars (Hawkesford, 2017). Genetic improvement of genotypes for water and N uptake, defined as the ratio of crop yield and water or N consumption capacity of plants is an important goal in crop breeding (Passioura, 2012). Nowadays, the use of N fertilizer increased from 9.2 Mt of pure N in 1960 to 108 Mt of pure N in 2015 worldwide (FAO, 2018). Over-dosage and low N utilization efficiency of crops have caused major resources concerns and substantial greenhouse gas emissions (Guo et al., 2010; Zhang et al., 2015). In China, the agricultural system generally relies on the high-to-excessive N inputs and the total average application of N for winter wheat has increased more than 500 kg N/ha, while the nitrogen-use efficiency (NUE) in wheat system remains lowest as compared with other crops like maize and rice (Cui et al., 2018). Moreover, the traditional irrigation of winter wheat is up to 310 mm and the water use efficiency (WUE) is lower than that of the world (Sun et al., 2011). Establishing substantial regulations and breeding new varieties for high water and N acquisition could provide an effective approach to improve WUE, NUE, and yield potential (Hu and Xiong, 2014; Zhang et al., 2017).
Assessment of resource efficiencies could be detected through physiological indicators such as biomass, water status, N contents and chlorophyll level of plants (Ali and Talukder, 2008; Potgieter et al., 2017). Previously, several studies have been conducted to assess NUE and WUE through destructive approaches for selection and genetic improvement in wheat (Zhang et al., 2007; Haile et al., 2012; Hawkesford, 2017). But destructive methods are considered as bottleneck for rapid and precise estimations of biomass, N and water status at multiple time points in case of large number of genotypes (Cobb et al., 2013; Potgieter et al., 2017). Therefore, use of advance phenotyping technology can increase the precision in data collection and future decision on crop improvement (Araus and Cairns, 2014; Rasheed et al., 2020). Ground-based and aerial-based non-destructive phenotyping systems have been validated as complementary platforms for several traits like green cover, biomass, water stress severity, chlorophyll level, and photosynthesis rate (Araus and Kefauver, 2018; Hassan et al., 2018a). The unmanned aerial vehicle (UAV) platform is capable of covering larger area in a shorter period of time. This can minimize the measurement error caused by changes in environmental factors, and is independent of field condition which can disturb the movement of ground-based systems (Potgieter et al., 2017; Yang et al., 2017). UAV-based remote estimation of canopy water and N-status can provide implication on detection of physiological status for establishing decisions and immediate adopt measures for appropriate irrigation and N-fertilizer applications (Yi et al., 2013; Li et al., 2018). Previously, UAV-based multispectral and RGB imagery have been validated for detection of biomass, plant density, leaf area, senescence rate and photosynthetic activity in wheat, barley, and sorghum (Bendig et al., 2014; Sankaran et al., 2015; Jin et al., 2017; Potgieter et al., 2017; Hassan et al., 2018a, 2019).
Physiological traits such as chlorophyll content, nitrogen concentration, and water status are often hard to be assessed by the human eye but can be detected through variations in reflectance of light spectrum (Haboudane et al., 2002; Mutanga and Skidmore, 2004; Zhang and Zhou, 2019). UAV-based remote sensing has given a great opportunity to assess plants growth by capturing different bands (Blue, NIR, Red, Green, and Red-edge) of light spectrum. Under optimum conditions, healthy plants look green because they absorb red bands and reflect green band of light spectrum (Hatfield et al., 2008). Strong relationship of these combination of light has been reported with photosynthesis, stress and nutrient status in plants (Hatfield et al., 2008; Shafian et al., 2018). For example, normalized difference vegetation index (NDVI), red edge chlorophyll index (CIRed-edge), normalized difference red-edge (NDRE) have been used to differentiate genotypes for stay-green, water stress, growth under N-fertilizer and chlorophyll level (Potgieter et al., 2017; Li et al., 2018; Zheng et al., 2018; Zhang and Zhou, 2019). Grain yield has also been predicted through UAV-based sensors in wheat and sorghum (Han et al., 2018; Hassan et al., 2018b). Therefore, multispectral vegetation indices can be used to assess the status of water and nitrogen and their fluctuations under diverse environmental conditions. The aims of this study were to (1) assess UAV-based multispectral platform determining water and N use efficiencies, (2) evaluate the water and N-fertilizer application strategy using UAV, and (3) identify the genotypes for high water and N efficiency.
Three cultivars Zhongmai 895, Aikang 58, and Zhoumai 18 were used to evaluate the accuracy of UAV-based multispectral imagery to predict effectiveness of water and N-fertilizer dosage as well as the potential of genotypes for their uptake efficiencies. These cultivars were released in the Yellow and Huai River Valleys Winter Wheat Region of China over the last decades. The study panel have been known as most prominent varieties for drought resistance and yield potential across the cultivated area by performing differently in stay-green during extreme drought and high temperatures.
Two field trials (water and nitrogen) were conducted at two sites i.e., Anyang (37.3943°N, 126.9568°E) and Xinxiang (35.3037°N, 113.9268°E) in Henan province during 2016–2018. Both trials were consisted of two types of experimental plots (a) destructive sampling plots following CIMMYT manual and (b) non-destructive phenotyping plots using UAV platform across the treatments (Figure 1). Randomized complete blocks with three replications each for destructive and UAV based phenotyping were used to minimize the probability of experimental error. Each experimental plot consisted of 6 rows of 9 m in length, 1.5 m in width, and with 0.2 m inter-row spacing. Seeds were planted with a seedling rate of 270 seedlings/m2 at both sites. In water use efficiency trial, each replication comprised four water levels, viz. zero (control) T0 = 0, T1 = 60 mm, T2 = 120 mm, and T3 = 180 mm at both sites (Figure 1). Nutrients level for water treatments was maintained at the optimal level. While N use efficiency experiment was also consisted of four levels of N for each three replications viz. zero (control) T0 = 0, T1 = 120 kg ha–1, T2 = 180 kg ha–1, and T3 = 240 kg ha–1. Harvesting was done through combine harvester after full maturity to estimate grain yield.
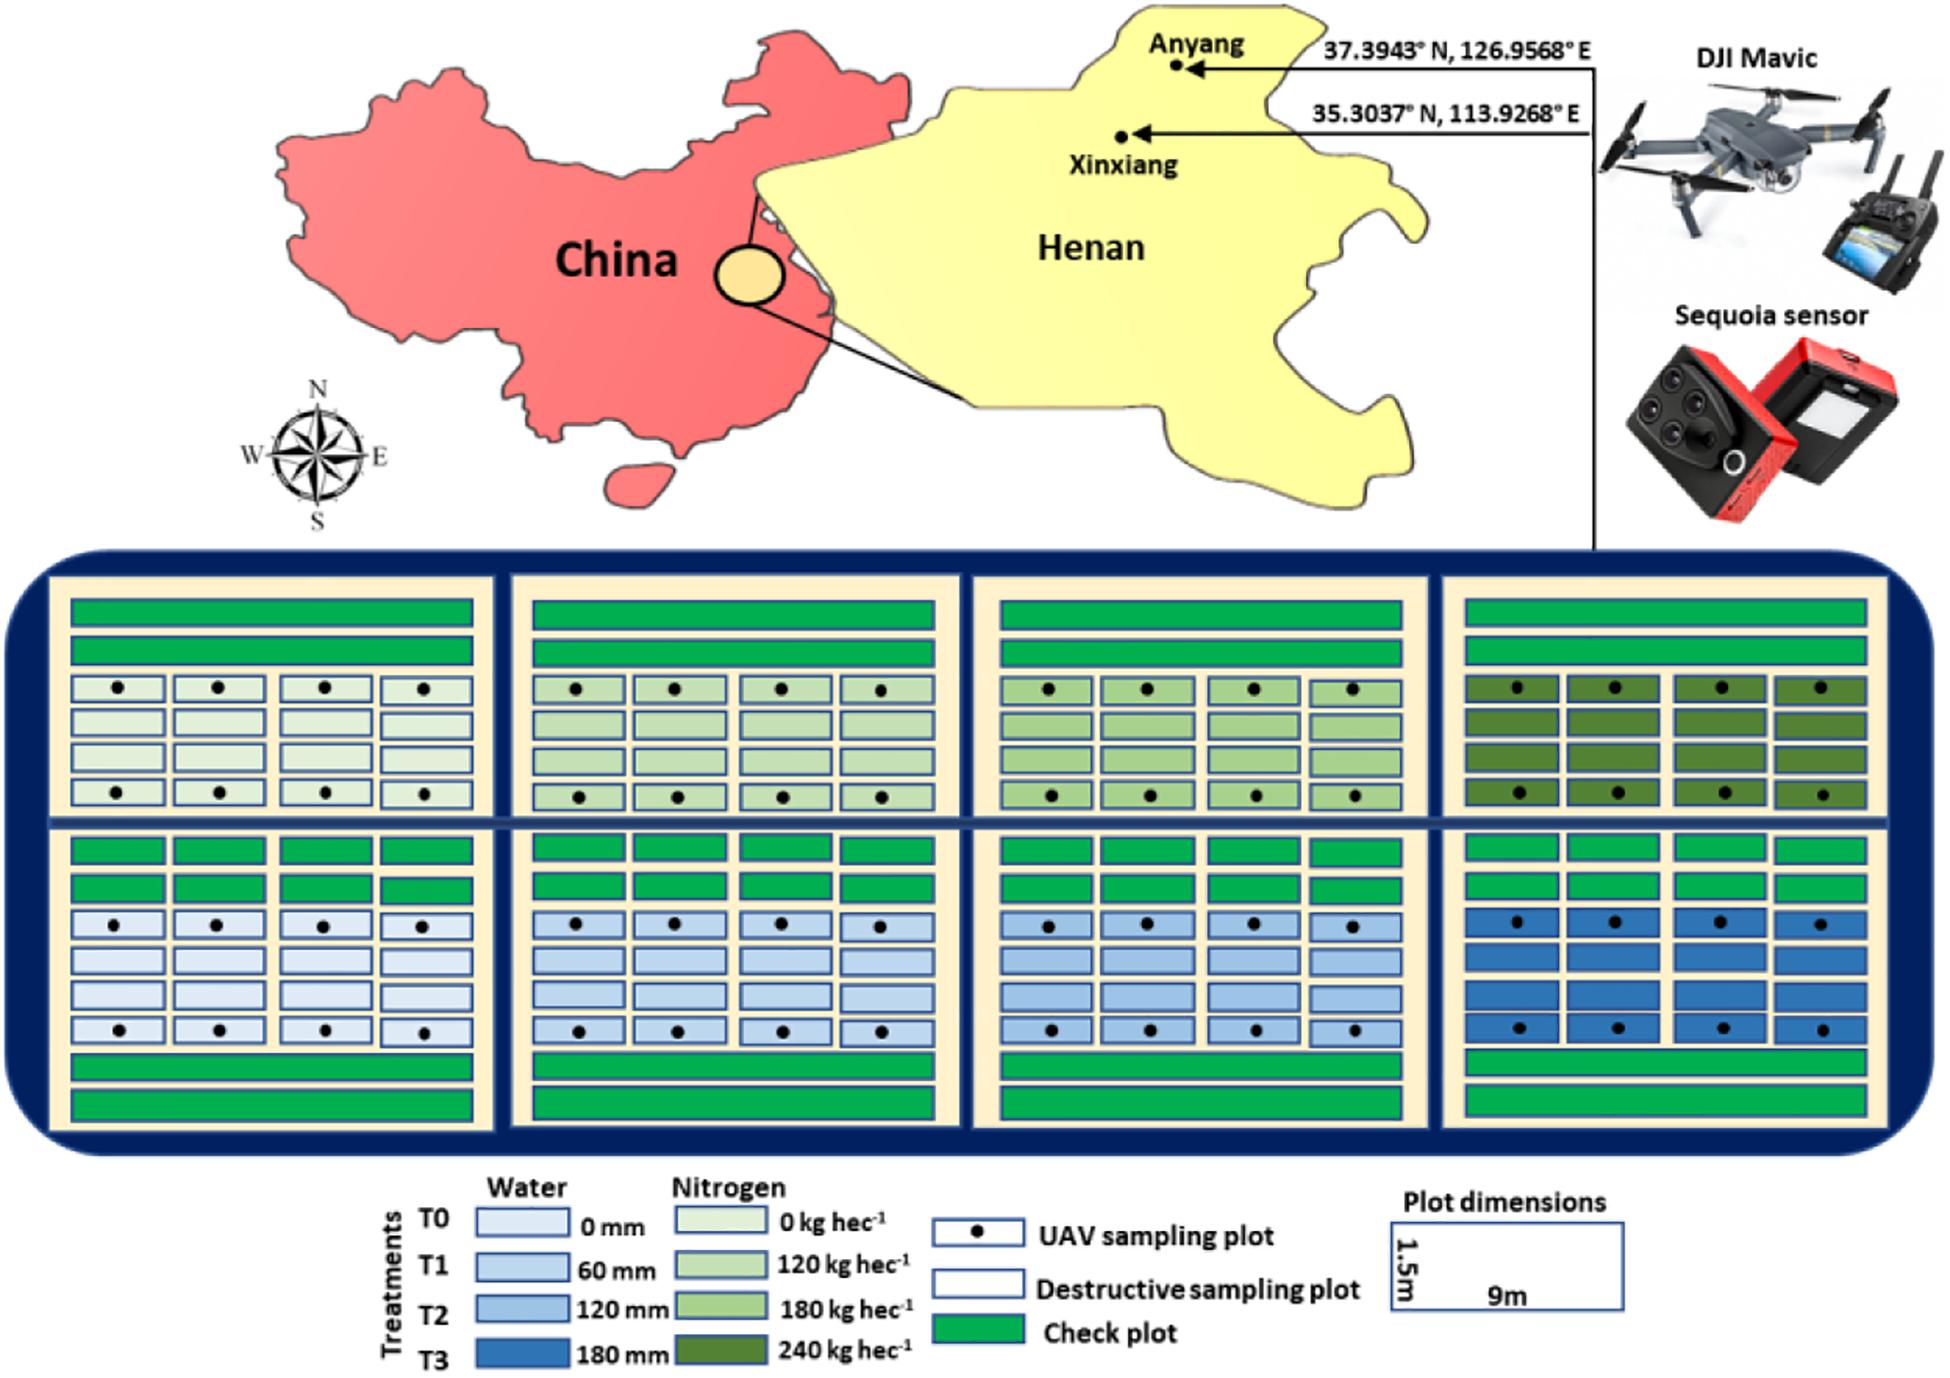
Figure 1. Trial locations, experimental design and UAV platform for phenotyping of water and N use efficiencies.
A Mavic Pro (SZ DJI Technology Co., Shenzhen, China) carrying sequoia 4.0 multi-spectral sensor (Micasense Parrot, Seattle, WA, United States)1 was used for multispectral imagery over the trials. Mavic pro can fly with slow speed and low altitude for 18 min. Multispectral sensor consists of 4 spectral bands (green, red, red-edge and nir) and a sunshine sensor connected with multi-spectral sensor was installed on the top of UAV to measure environmental irradiation and post-calibrate reflectance. A standardization of band values before and after flight was done through a calibration board with known reflectance. Altizure DJI version 3.6.02 was used to design the flight mission over the trials. All the flights were conducted at 30 m altitude with 2.5 m/s speed, maintaining 85% forward and side overlaps among images. Average ground sample distance of sensor was recorded 2.5 cm. UAV-based multispectral data were collected at heading, flowering and three times at early, mid and late grain filling stages. Data captured at early to late grain filling were averaged to get overall status of genotypes at maturity stage (Table 1).
All images captured from Sequoia contained accurate geo-referencing due to its built-in GPS device. GPS information was accurate enough to generate dense point cloud for good quality orthomosaic. Pix4D mapper (Version 1.4, PIX4d, Lausanne, Switzerland)3 was used for orthomosaic generation. The key steps of the orthomosaic generation using Pix4D mapper comprised camera alignment, geo-referencing, building point clouds and orthomosaic generation as previously reported (Hassan et al., 2018a, b). QGIS was used for image segmentation to extract the useful information of each plot. For this, polygon shapes were generated with a specific plot ID defining the particular germplasm (Haghighattalab et al., 2016). Spectral values were analyzed using combined orthomosaic TIFF images contain four different bands and polygon shape files in IDL (Version 8.6, Harris, Geospatial Solutions, Inc. Reston, CO, Australia, United States). Reflectance calibration was done using calibrated reflectance panel with known reflectance values provided by Micasense (Micasense Parrot, Seattle, WA, United States). Multispectral images of reflectance panel were captured before and after each flight to calibrate the reflectance maps of each stage.
Five multispectral traits i.e., red normalized difference vegetation index (RNDVI), green normalized difference vegetation index (GNDVI), normalized difference red-edge (NDRE), red-edge chlorophyll index (RECI), and normalized green red difference index (NGRDI) were also calculated which mainly surrogate to canopy physiological traits including green biomass, chlorophyll level and photosynthesis (Table 1). These indices were calculated from reflectance captured during multi-spectral imagery through Sequoia 4.0 sensor. The calculated multispectral traits were evaluated for non-destructive assessment of water and nitrogen use efficiency by considering cost-effective replacement of traditional destructive indicator such as biomass, N-contents and chlorophyll level under different water and N supply.
The volumetric soil water content of the planting zone was measured for every 10 cm section of soil, down to 160 cm using a CNC503D neutron moisture meter (Super Energy. Nuclear Technology Ltd., Beijing, China). The water content of the soil surface of around 20 cm was also measured using the oven-drying method to minimize the error probability in calculating the WUE. Soil was oven-dried at 105°C until a consistent weight, and then pre-and post-drying weights were compared to determine the water content. This measurement was repeated after all irrigation treatments and major precipitation events. Both methods (volumetric measurements and oven-drying) were used to measure total soil moisture as described by Ma et al. (2016).
For soil N content, soil sampling was done from each subplot at the depth of 0–20, 20–40, 40–60, 60–80, and 80–100 cm for the estimation of before sowing soil N contents. Samples were digested, and modified Kjeldahl method was used to determine total N contents in soil samples as described in Bremner and Mulvaney (1982). For plant N contents at flowering and maturity, samples from each subplot was taken by cutting 20 fertile shoots at ground level. Then, shoots were divided into leaves, straw, sheath at flowering and grains at maturity. Total N content was calculated from above mention methodology. Dry biomass was calculated at heading, flowering and maturity stages by destructive method, while yield related traits including spike number (SN), thousand grain weight (TGW), and grain yield (GY) were calculated as described in Gao et al. (2017).
Water use efficiency (WUE) from grain yield and dry biomass were calculated using following formulas by Zhang et al. (2007),
and
Where, GY is grain yield, Y (kg ⋅ ha–1) is genotypes grain yield, BM (kg ⋅ ha–1) is dry biomass at maturity and ET (mm) is the evapotranspiration during the winter wheat growing seasons. ET was estimated as follows (Eberbach and Pala, 2005).
Where, I (mm) is the irrigation water amount; P (mm) is precipitation, which was measured at the on-site weather station using a standard rain gauge given in Supplementary Table S1; R (mm) is the surface runoff, which was assumed as non-significant since concrete slabs were placed around each plot; D (mm) is the downward flux below the crop root zone, which was defined as insignificant since soil moisture measurements indicated that drainage at the sites were negligible; and ΔS (mm) is the change in water storage in the soil profile that is exploited by crop roots (initial soil water content minus soil water content at the end of the growing season).
NUE efficiency was measured using following formulas as demonstrated in Haile et al. (2012),
and
Whereas, GDWf is grain dry weight in fertilized treatment, GDWc is grain dry weight under control treatment while Ns means total N supply in a particular treatment. Ntf indicates total N content in above ground plant sample in fertilized treatment and Ntc means N concentration in plant sample in control treatment.
Pearson correlation and linear regression between the traits were calculated to check relationship and prediction. Significance variation test at P < 0.05 and performance of genotypes for traits under different water and N treatments were determined by analysis of variance (ANOVA) using R package (R Core Team, 2016). While repeatability of UAV based data was also calculated to ensure the accuracy by following the formula reported in Sehgal et al. (2015).
All multispectral traits i.e., red normalized difference vegetation index (RNDVI), green normalized difference vegetation index (GNDVI), normalized difference red-edge (NDRE), red-edge chlorophyll index (RECI), and normalized green red difference index (NGRDI) mainly surrogate to green biomass, water content and chlorophyll level of plants were positively correlated with manually measured indicators of water status i.e., biomass, temporally at heading (r = 0.17 to 0.87), flowering (r = 0.15 to 0.77) and maturity (r = 0.15 to 0.90) in control and all water-supply treatments (Figure 2). Weak to strong correlations between UAV-based multispectral traits with thousand grain weight (TGW) (r = 0.14 to 0.84), and moderate to high with grain yield (GY) (r = 0.27 to 0.65) were observed across the treatments at mid to late grain filling stage. Plant height showed positive correlations (r = 0.17 to 0.81) with RNDVI, GNDVI, NDRE, and RECI in T0, T1 and T2. Water use efficiency calculated from GY (WUE.GY) was strongly correlated with RNDVI (r = 0.51 to 0.65), GNDVI (r = 0.47 to 0.64), NDRE (r = 0.53 to 0.65), RECI (r = 0.40 to 0.66), and NGRDI (r = 0.56 to 0.64). While water use efficiency estimated from biomass (WUE.BM) also exhibited similar trend in correlation with RNDVI (r = 0.36 to 0.67), GNDVI (r = 0.34 to 0.69), NDRE (r = 0.38 to 0.76), RECI (r = 0.15 to 0.56), and NGRDI (r = 0.46 to 0.90) across the water-supply treatments. Correlations between multispectral traits and WUE.BM were slightly lower in T3 compared to T1 and T2 treatments. UAV-based multispectral traits were also positively associated with both NUE at heading (r = 0.10 to 0.82) and flowering (r = 0.25 to 0.85) (Figure 2). Weak but positive correlations were also observed between ground based WUE indicator (biomass) and WUE.GY ranging from r = 0.23 to 0.50 at mid to late grain filling stage across the water-supply treatments.
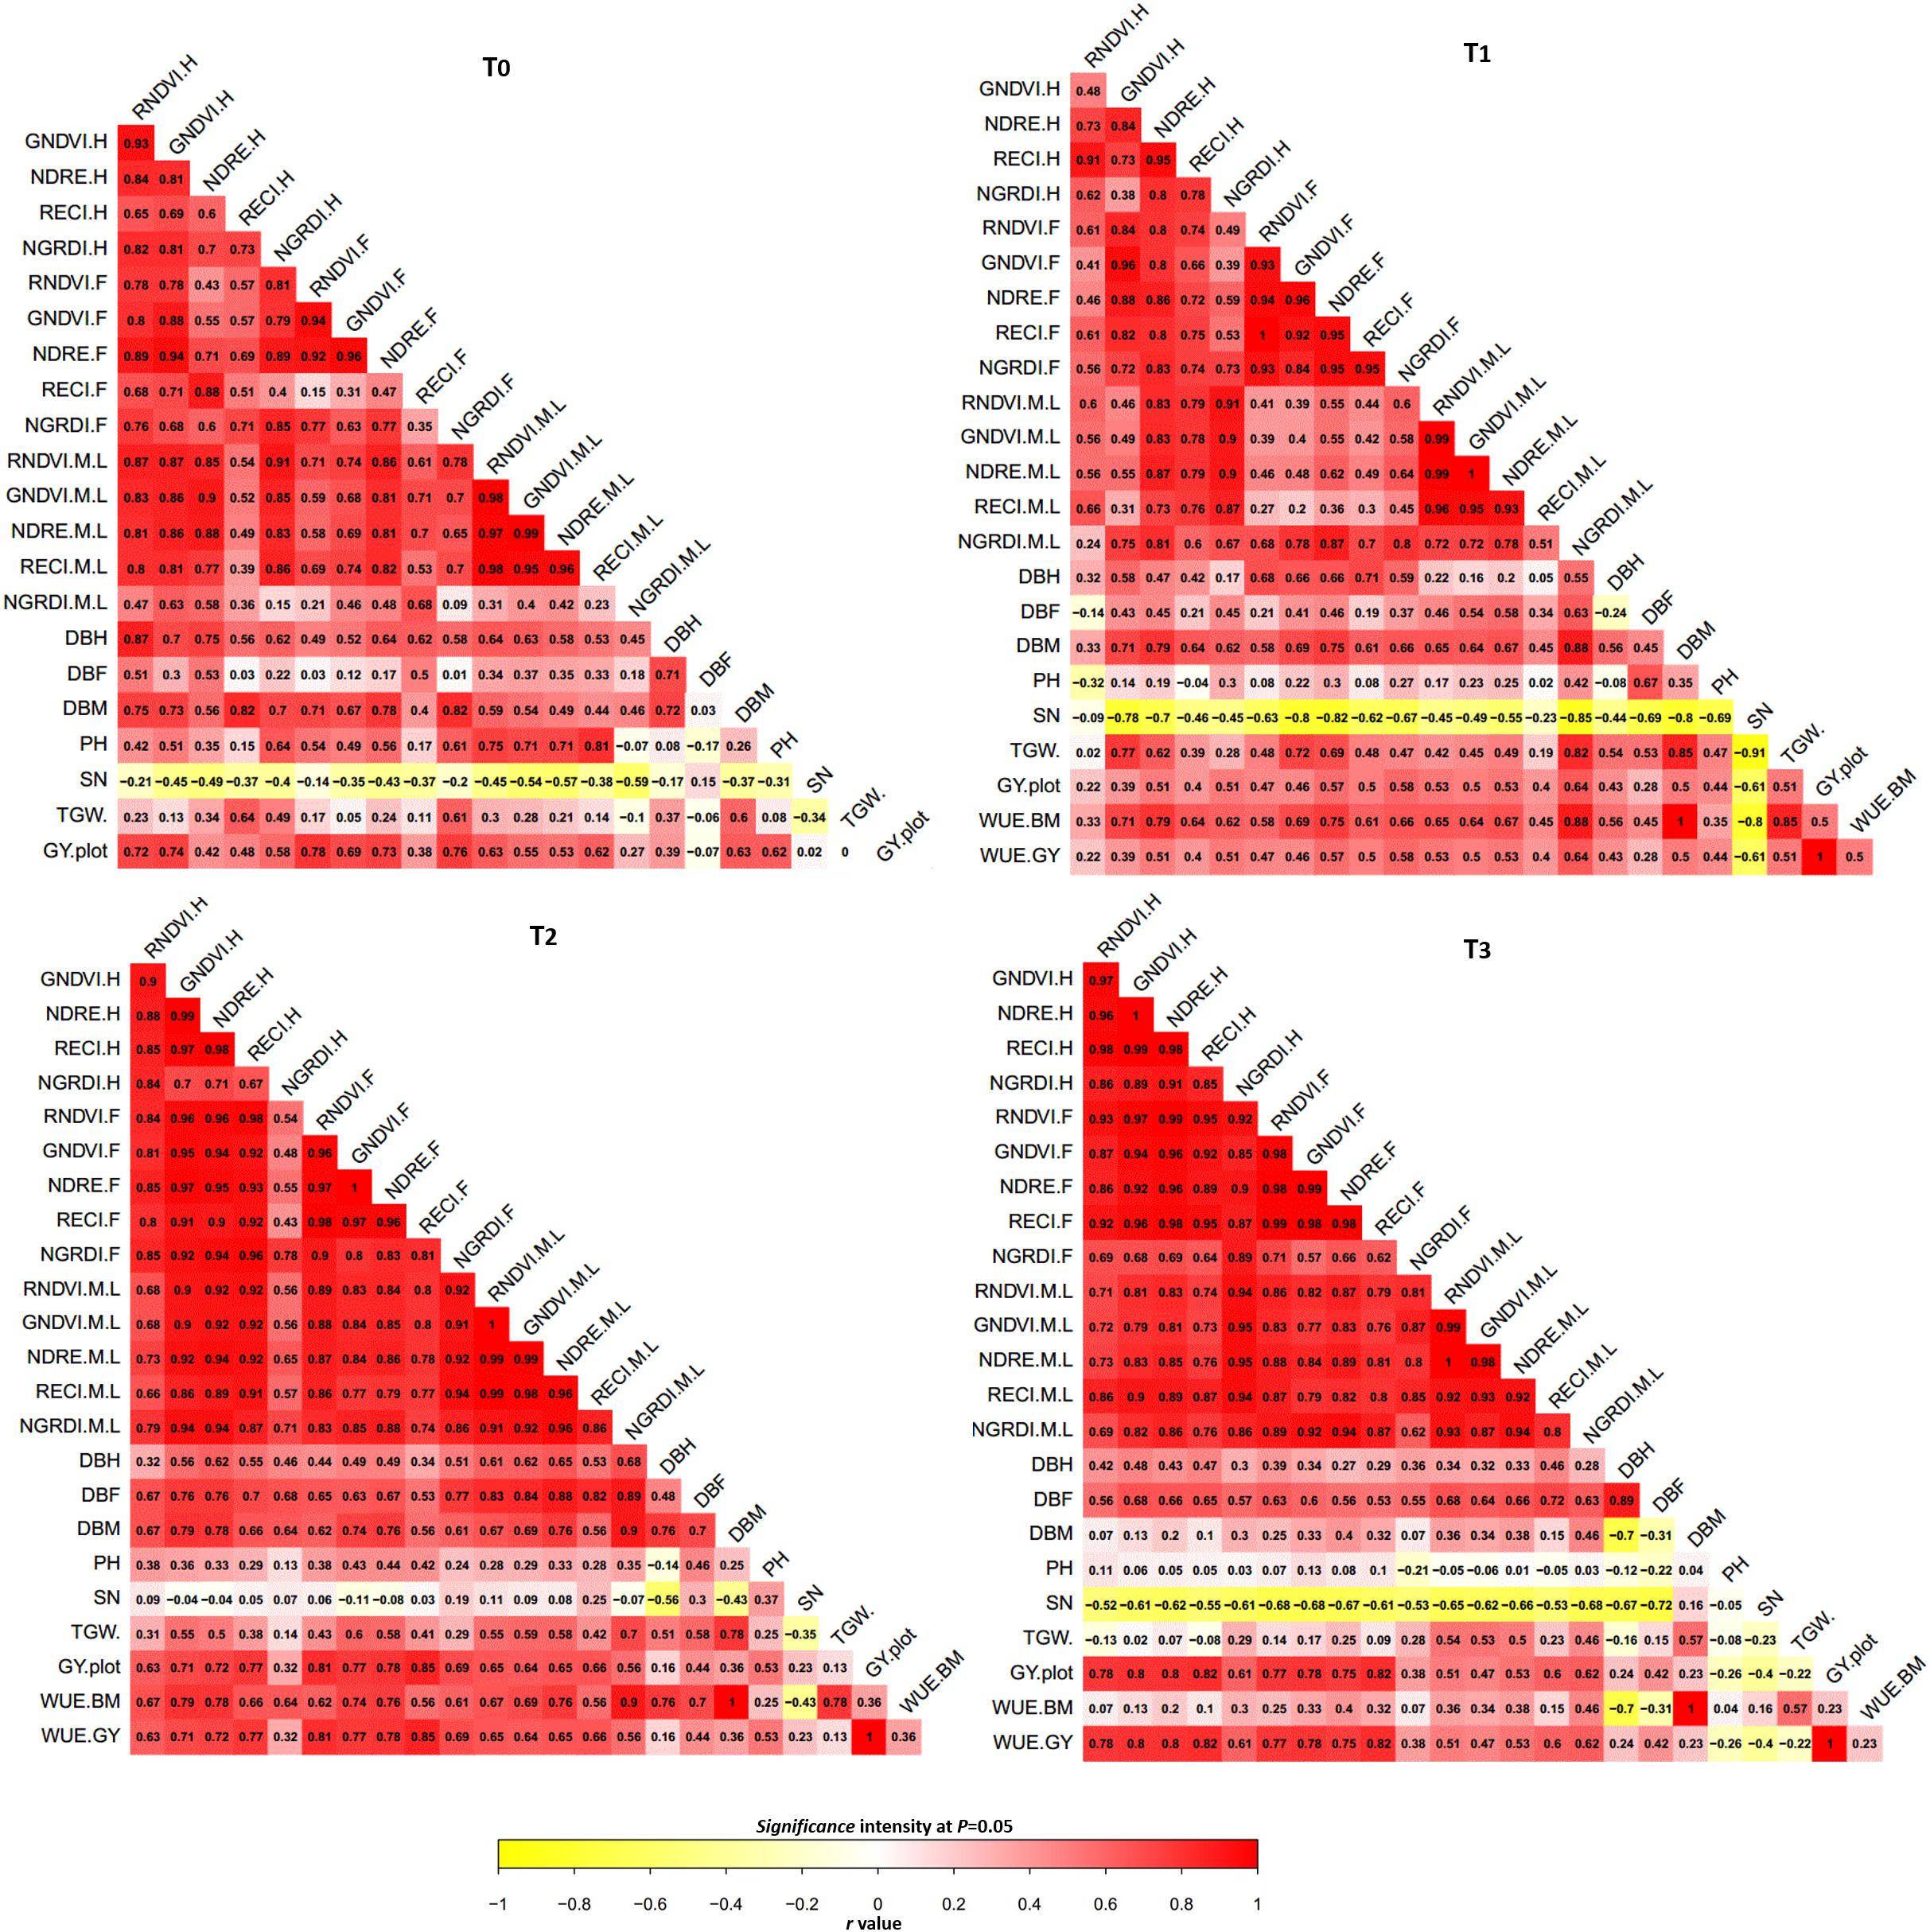
Figure 2. Correlation map between traits under four water treatments across the two experimental sites. Red and yellow colors indicating intensity of r values from positive to negative. T, treatment; H, heading; F, flowering; M.LGF, mid to late grain filling; GNDVI, green normalized difference vegetation index; NDRE, Normalized difference red-edge; RECI, red-edge chlorophyll index; NGRDI, normalized green red difference index; TGW, thousand grain weight; DBH, dry biomass at heading; DBF, dry biomass at flowering; DBM, dry biomass at maturity; SN, spike number per; GY.plot, grain yield per plot; WUE.GY and BM, water use efficiency calculated from grain yield and biomass.
Significant variations (P < 0.05) among the genotypes and in multispectral traits at mid to late grain filling stage were calculated, with high repeatability ranging from 0.78 to 0.89 (Table 2). In our results, similar trend in variation among WUE and multispectral traits at mid to late grain filling stage were observed that was influencing the GY. Variation results were also validated through ground based destructive measurements (Table 2).
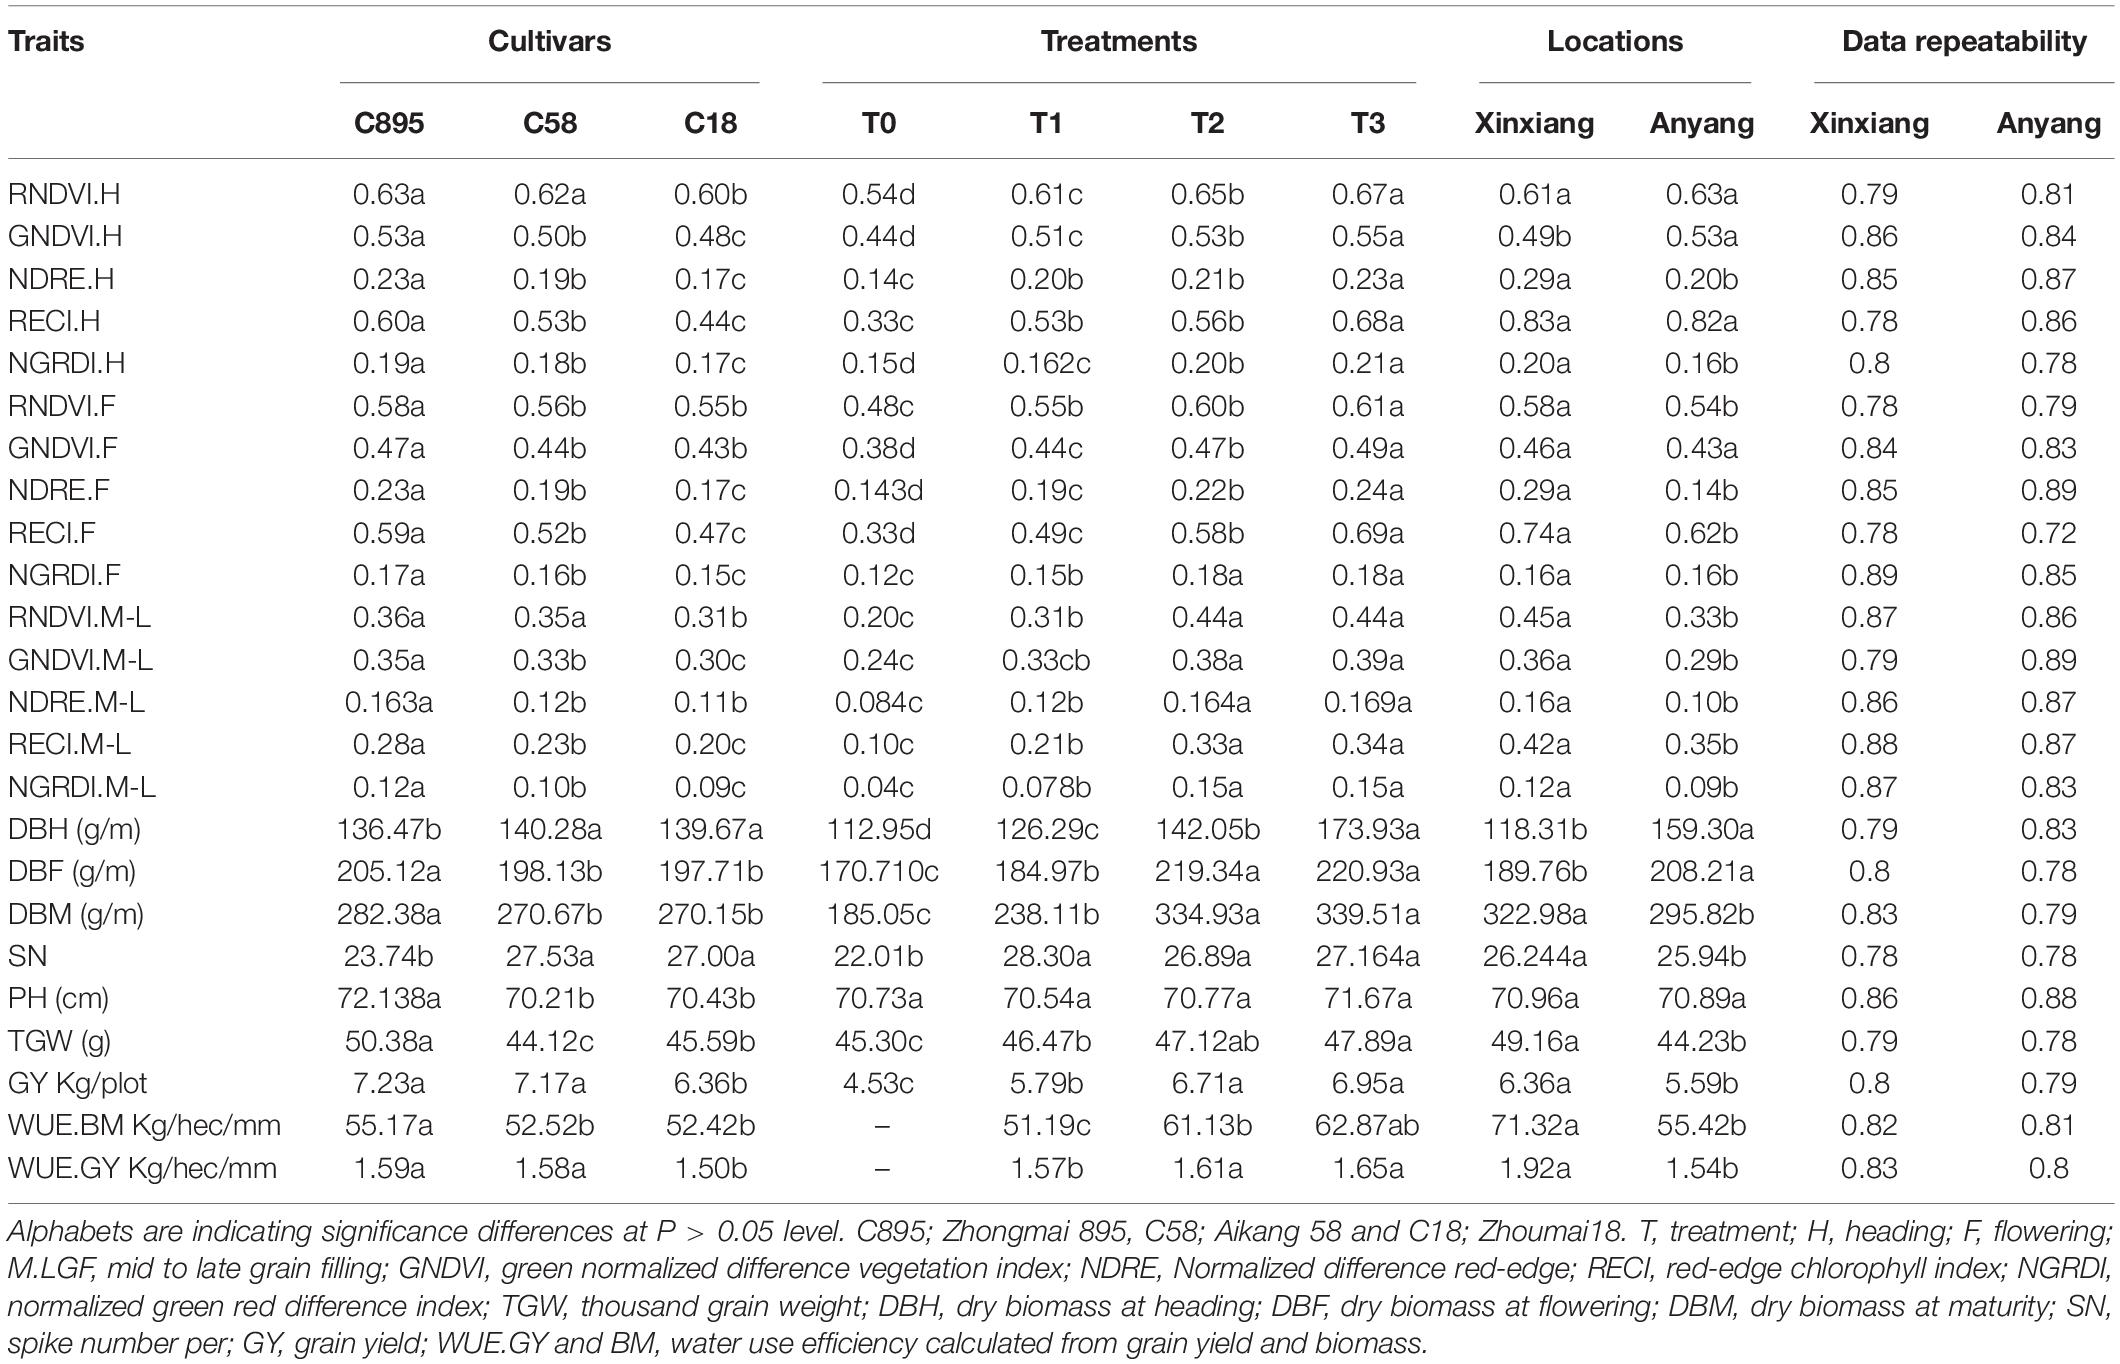
Table 2. Significance test and repeatability of traits for three cultivars under four water treatments and two locations.
Linear regression model was fitted to forecast both WUE.BM and WUE.GY through UAV-based multispectral traits (Figure 3). Results showed high R2 values for RNDVI (R2 = 0.65 to 0.83), GNDVI (R2 = 0.60 to 0.84), NDRE (R2 = 0.58 to 0.80), RECI (R2 = 0.60 to 0.80) and NGRDI (R2 = 0.69 to 0.89) in predicting both WUE at mid to late grain filling stage, while average root mean square errors (RMSE) ranged from 0.002 to 0.04. NGRDI traits was found better with higher coefficients of determination values in predicting both WUE.BM (R2 = 0.69 in T1, R2 = 0.75 in T2 and R2 = 0.89 in T3) and WUE.GY (R2 = 0.86 in T1, R2 = 0.83 in T2 and R2 = 0.80 in T3) with low average RMSE 0.02 and 0.03. Whereas, UAV-based traits also predicted significant differences (P < 0.05) between the water treatments and locations. In Figure 4, fluctuation in dynamic trend of multispectral traits values in all four treatments high for Zhongmai 895 compare to other two genotypes. Dynamic curves showed low level in multispectral traits at mid to late grain filling stage under control treatment. Zhongmai 895 also performed high in both WUE under water-supply treatments, but there was no significant difference in WUE and GY between T2 and T3 (Table 2).
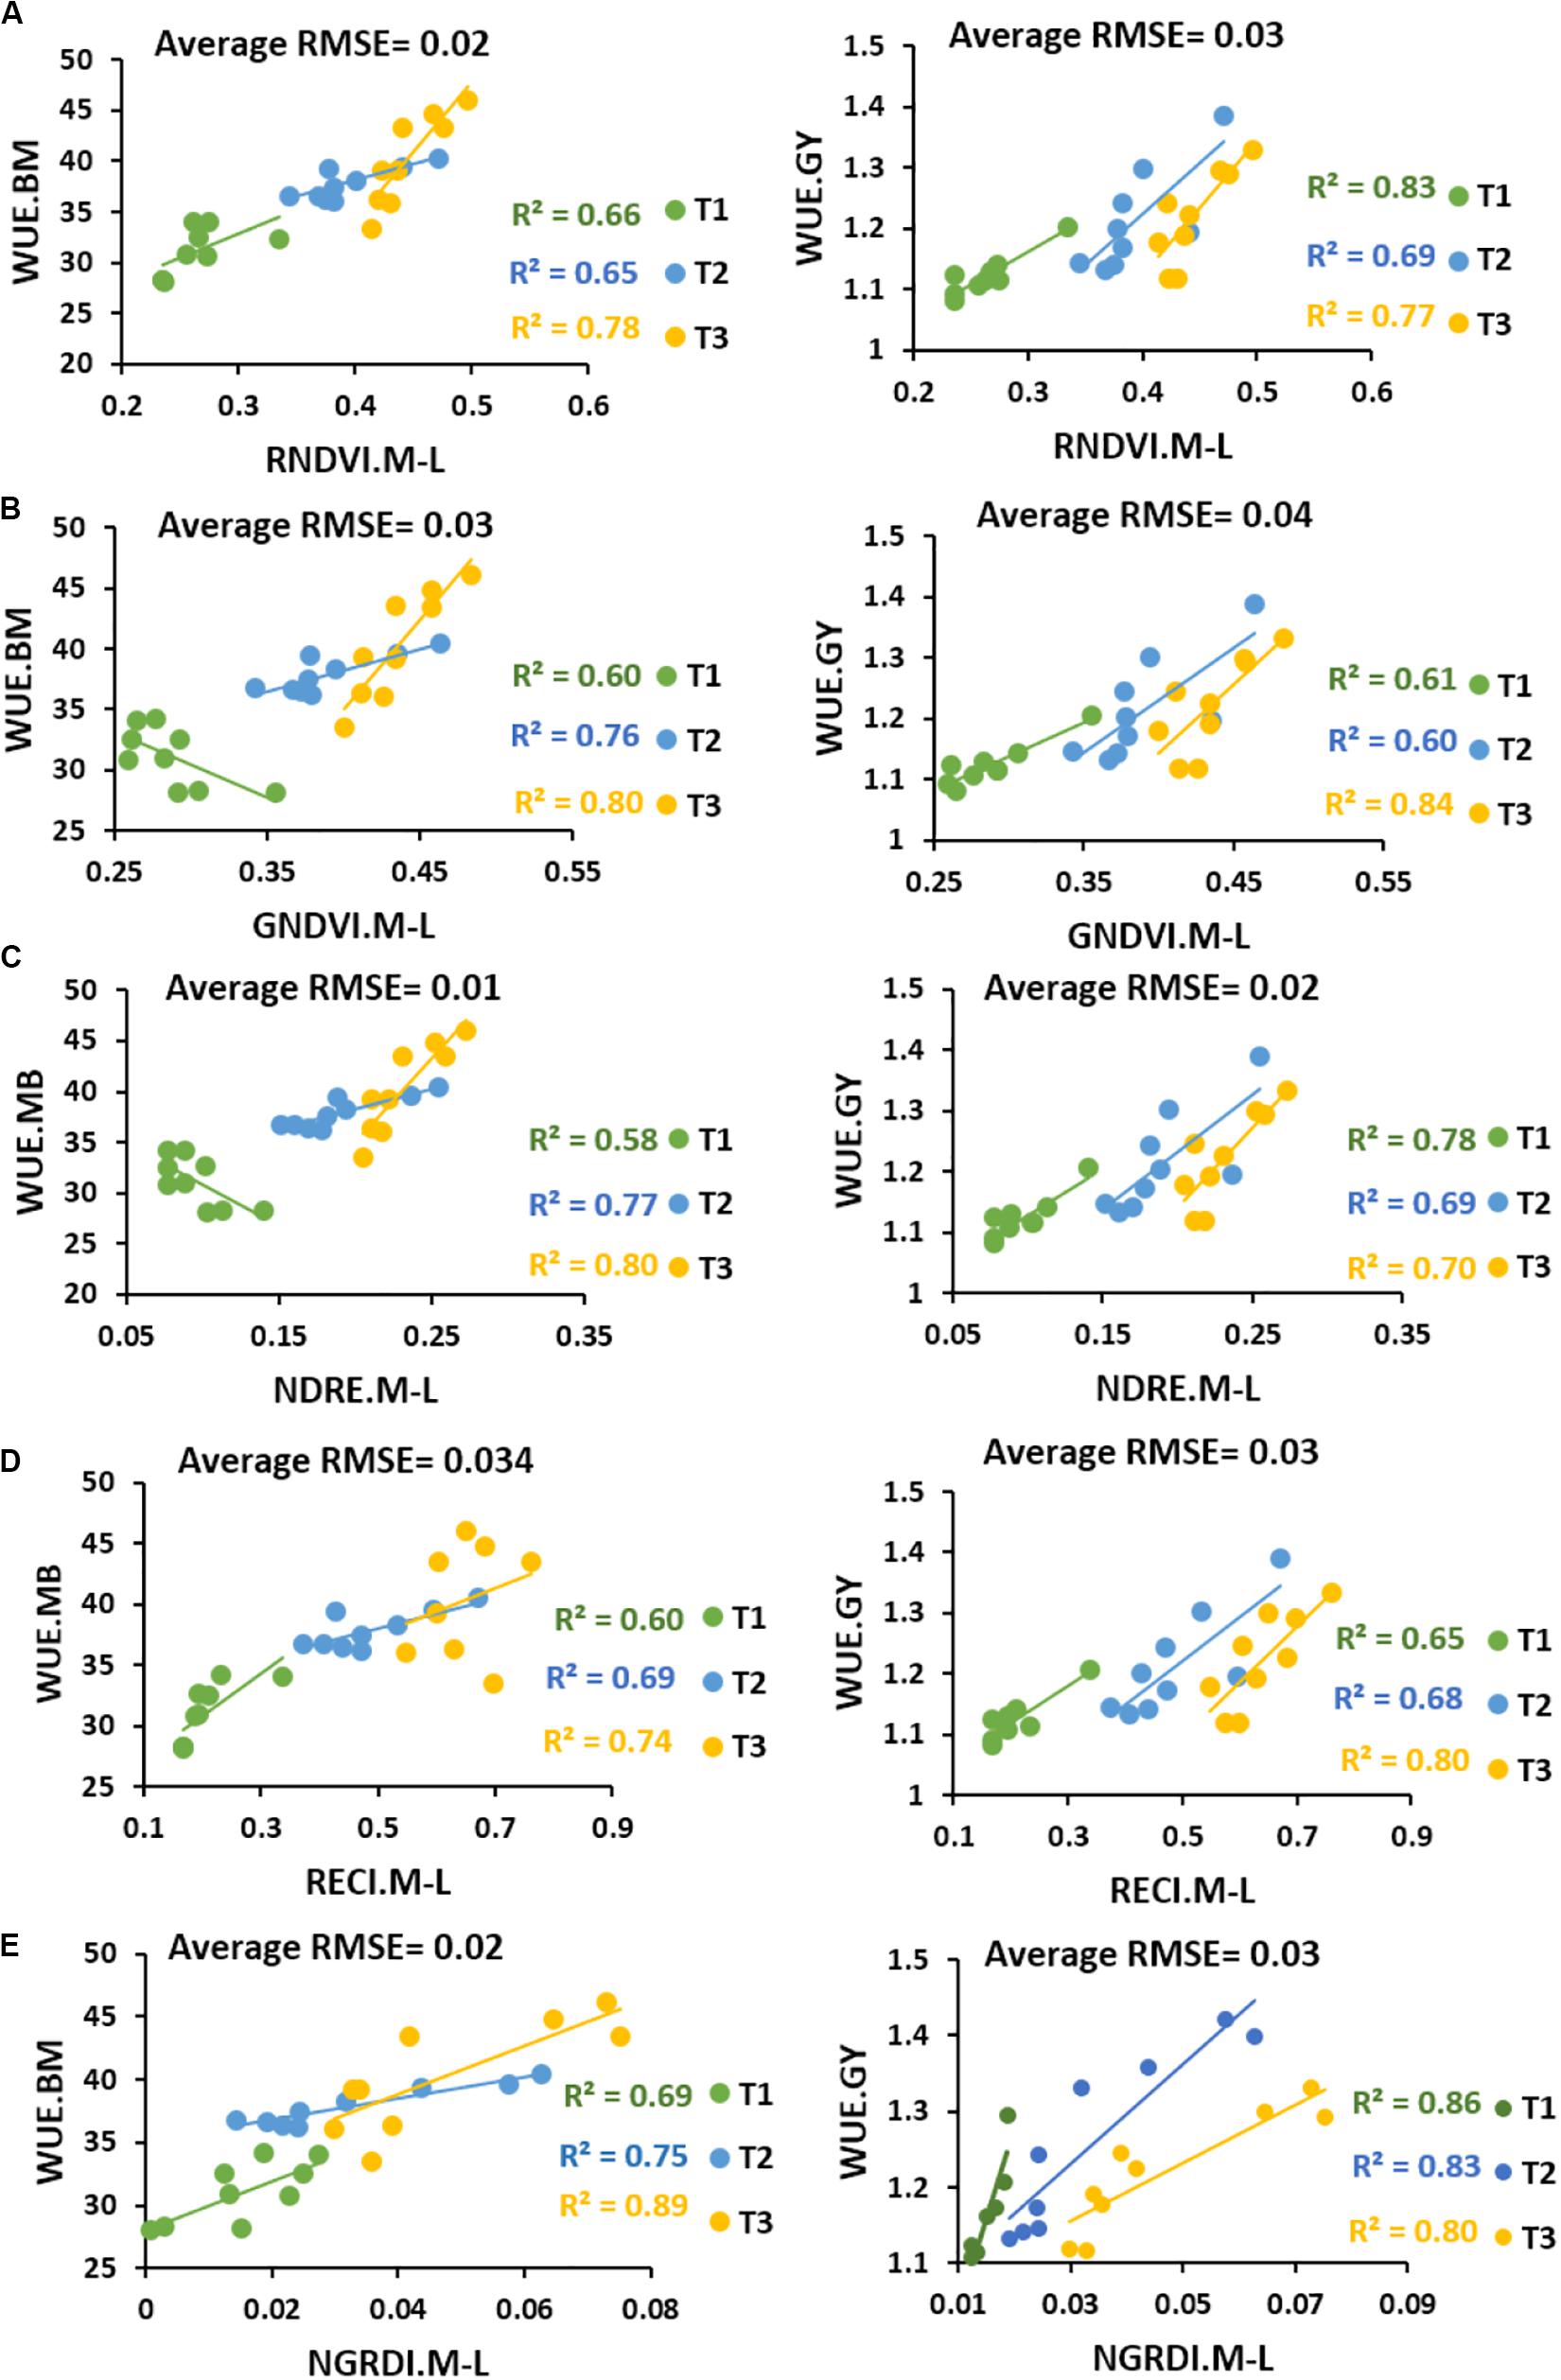
Figure 3. Coefficients of determination results between multispectral traits (A) RNDVI, (B) GNDVI, (C) NDRE, (D) RECI, and (E) NGRDI and WUE calculated from biomass (WUE.BM) and estimated from grain yield (WUE.GY) under water-supply treatments.
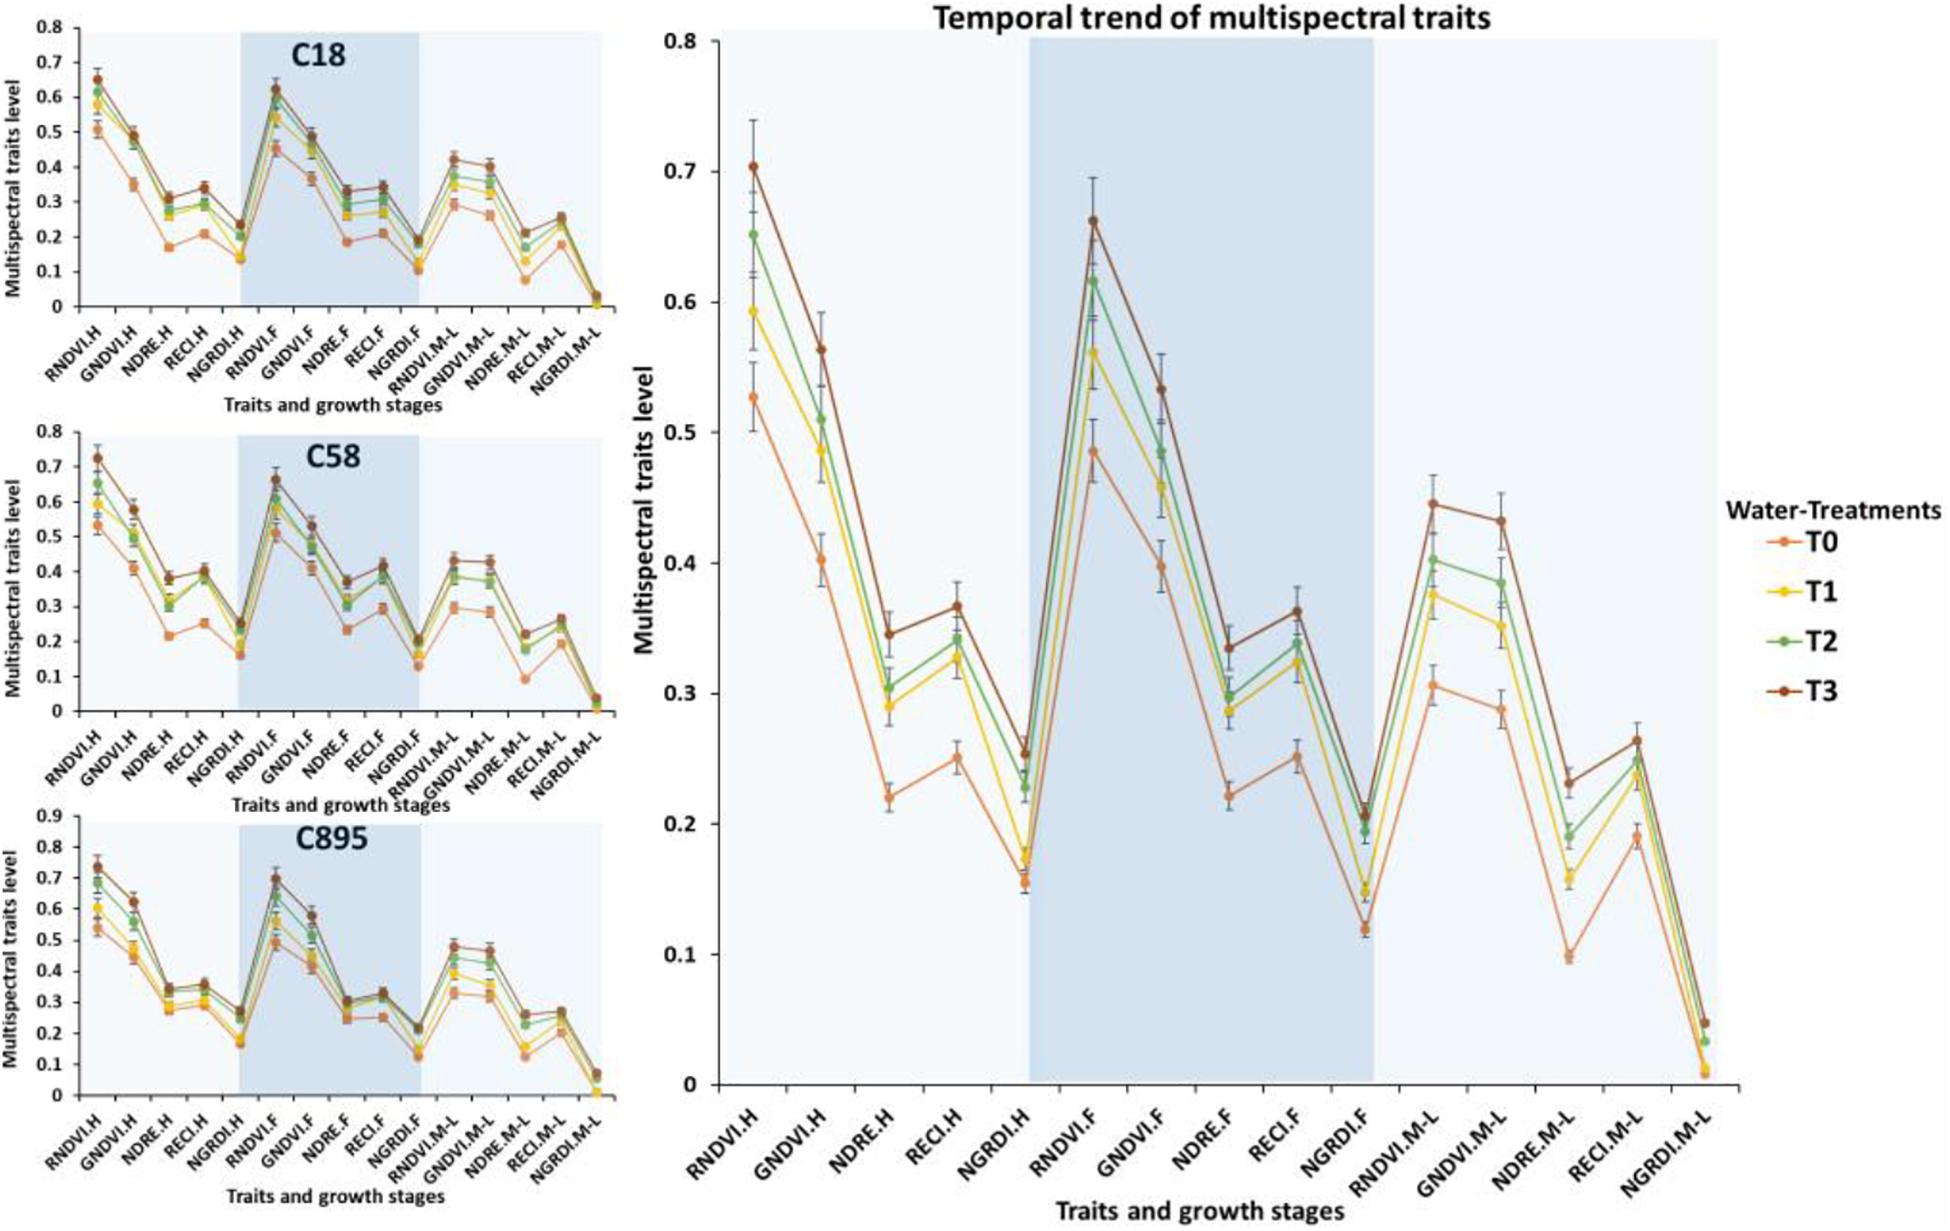
Figure 4. Seasonal trend in multispectral traits and comparison of genotypes under water treatments. Error bars are showing standard deviation. *C895, Zhongmai 895; C58, Aikang 58; C18, Zhoumai18.
In Figure 5, UAV-based five multispectral traits were positively correlated with N-contents ranging from r = 0.27 to 0.84 at flowering and r = 0.27 to 0.97 at maturity in in all N-supply treatments. NGRDI showed quite low correlations with N-contents at both flowering and maturity in T2 and T3 compared with T0 and T1 where r-values were high ranging from 0.81 to 0.89 (Figure 5). A consistently moderate to high correlations of multispectral traits with TGW ranging from r = 0.23 to 0.86 and GY r = 0.49 to 0.86 were noticed at the maturity stage. There were negative to positive correlations (r = −0.26 to 0.46) between plant height, multispectral traits and N-contents across the treatments. NUE.NC calculated from nitrogen contents of plant samples at maturity was correlated with all five remotely sensed multispectral traits at r = 0.23 to 0.97, while GY based nitrogen use efficiency (NUE.GY) at r = 0.47 to 0.87 across the treatments. Similar correlations trend ranging from r = 0.23 to 0.90 were also observed between ground based NUE indicator (N-contents) and NUE.NC in T2 and T3, and with NUE.GY ranging from r = 0.27 to 0.99 at maturity stage across the treatments (Figure 5). Significantly low to strong correlations were also detected between NUE and UAV-based multispectral traits at heading (r = 0.38 to 0.82) and flowering (r = 0.14 to 0.89).
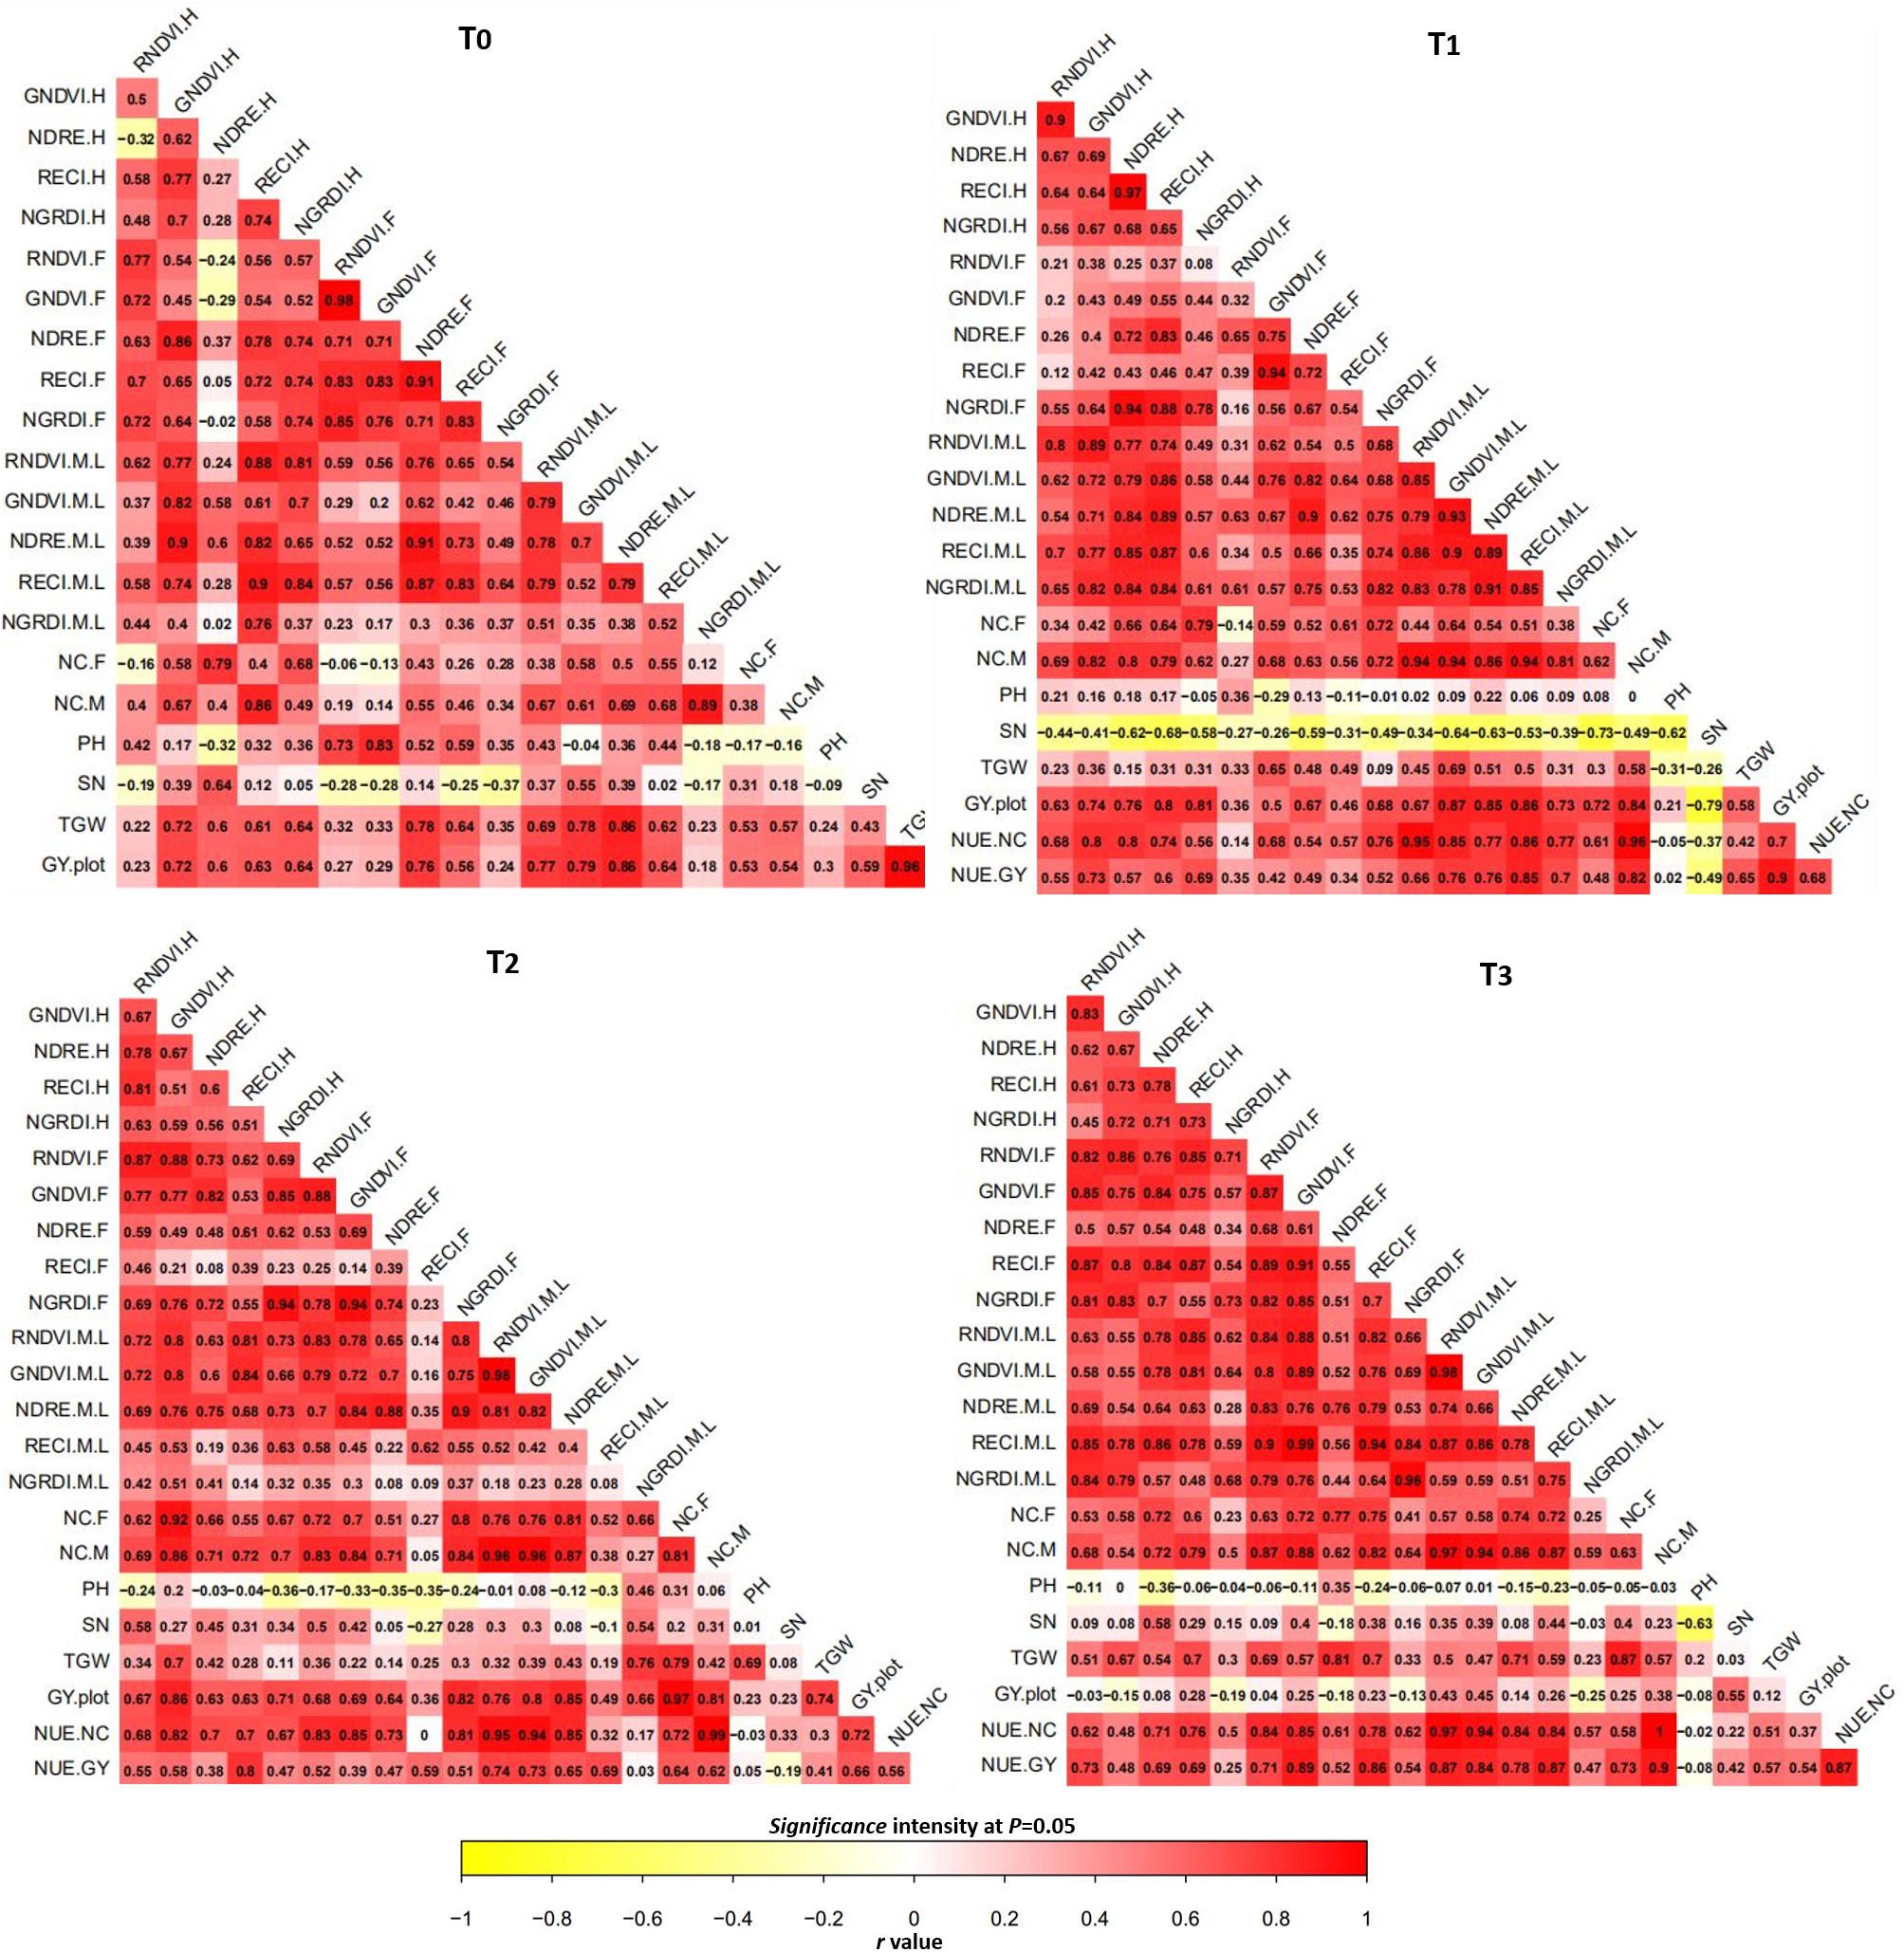
Figure 5. Correlation map between traits under four nitrogen treatments across the two experimental sites. Red and yellow colors indicating intensity of r values from positive to negative. T, treatment; H, heading; F, flowering; M.LGF, mid to late grain filling; GNDVI, green normalized difference vegetation index; NDRE, Normalized difference red-edge; RECI, red-edge chlorophyll index; NGRDI, normalized green red difference index; TGW, thousand grain weight; DBH, dry biomass at heading; DBF, dry biomass at flowering; DBM, dry biomass at maturity; SN, spike number per; GY.plot, grain yield per plot; NUE.GY and NC, water use efficiency calculated from grain yield and nitrogen contents.
High coefficients of determination were identified between UAV-based traits and NUE calculated from nitrogen content of plant samples (NUE.NC) and GY (NUE.GY) with low RMSE ranging from 0.004 to 0.04 across the N-supply treatments (Figure 6). Strong R2 values of RNDVI (R2 = 0.64 to 0.94), GNDVI (R2 = 0.64 to 0.89), NDRE (R2 = 0.73 to 84), RECI (R2 = 0.66 to 0.86 and NGRDI (R2 = 0.65 to 0.90) with NUE.NC and NUE.GY predicted significant variations (P < 0.05) among genotypes at mid to late grain filling stage with high repeatability ranging from 0.80 to 0.91 (Table 3). RNDVI was high in predicting NUE.NC in T1 (R2 = 0.72), T2 (R2 = 0.89), and T3 (R2 = 0.94), while NDRE was also found consistent in forecasting both NUE.NC with high R2 = 0.75 in T1, R2 = 0.73 in T2, R2 = 0.74 in T3 and NUE.GY by R2 = 0.84 in T1, R2 = 0.75 in T2 and T3 with RMSE of 0.004 to 0.005.
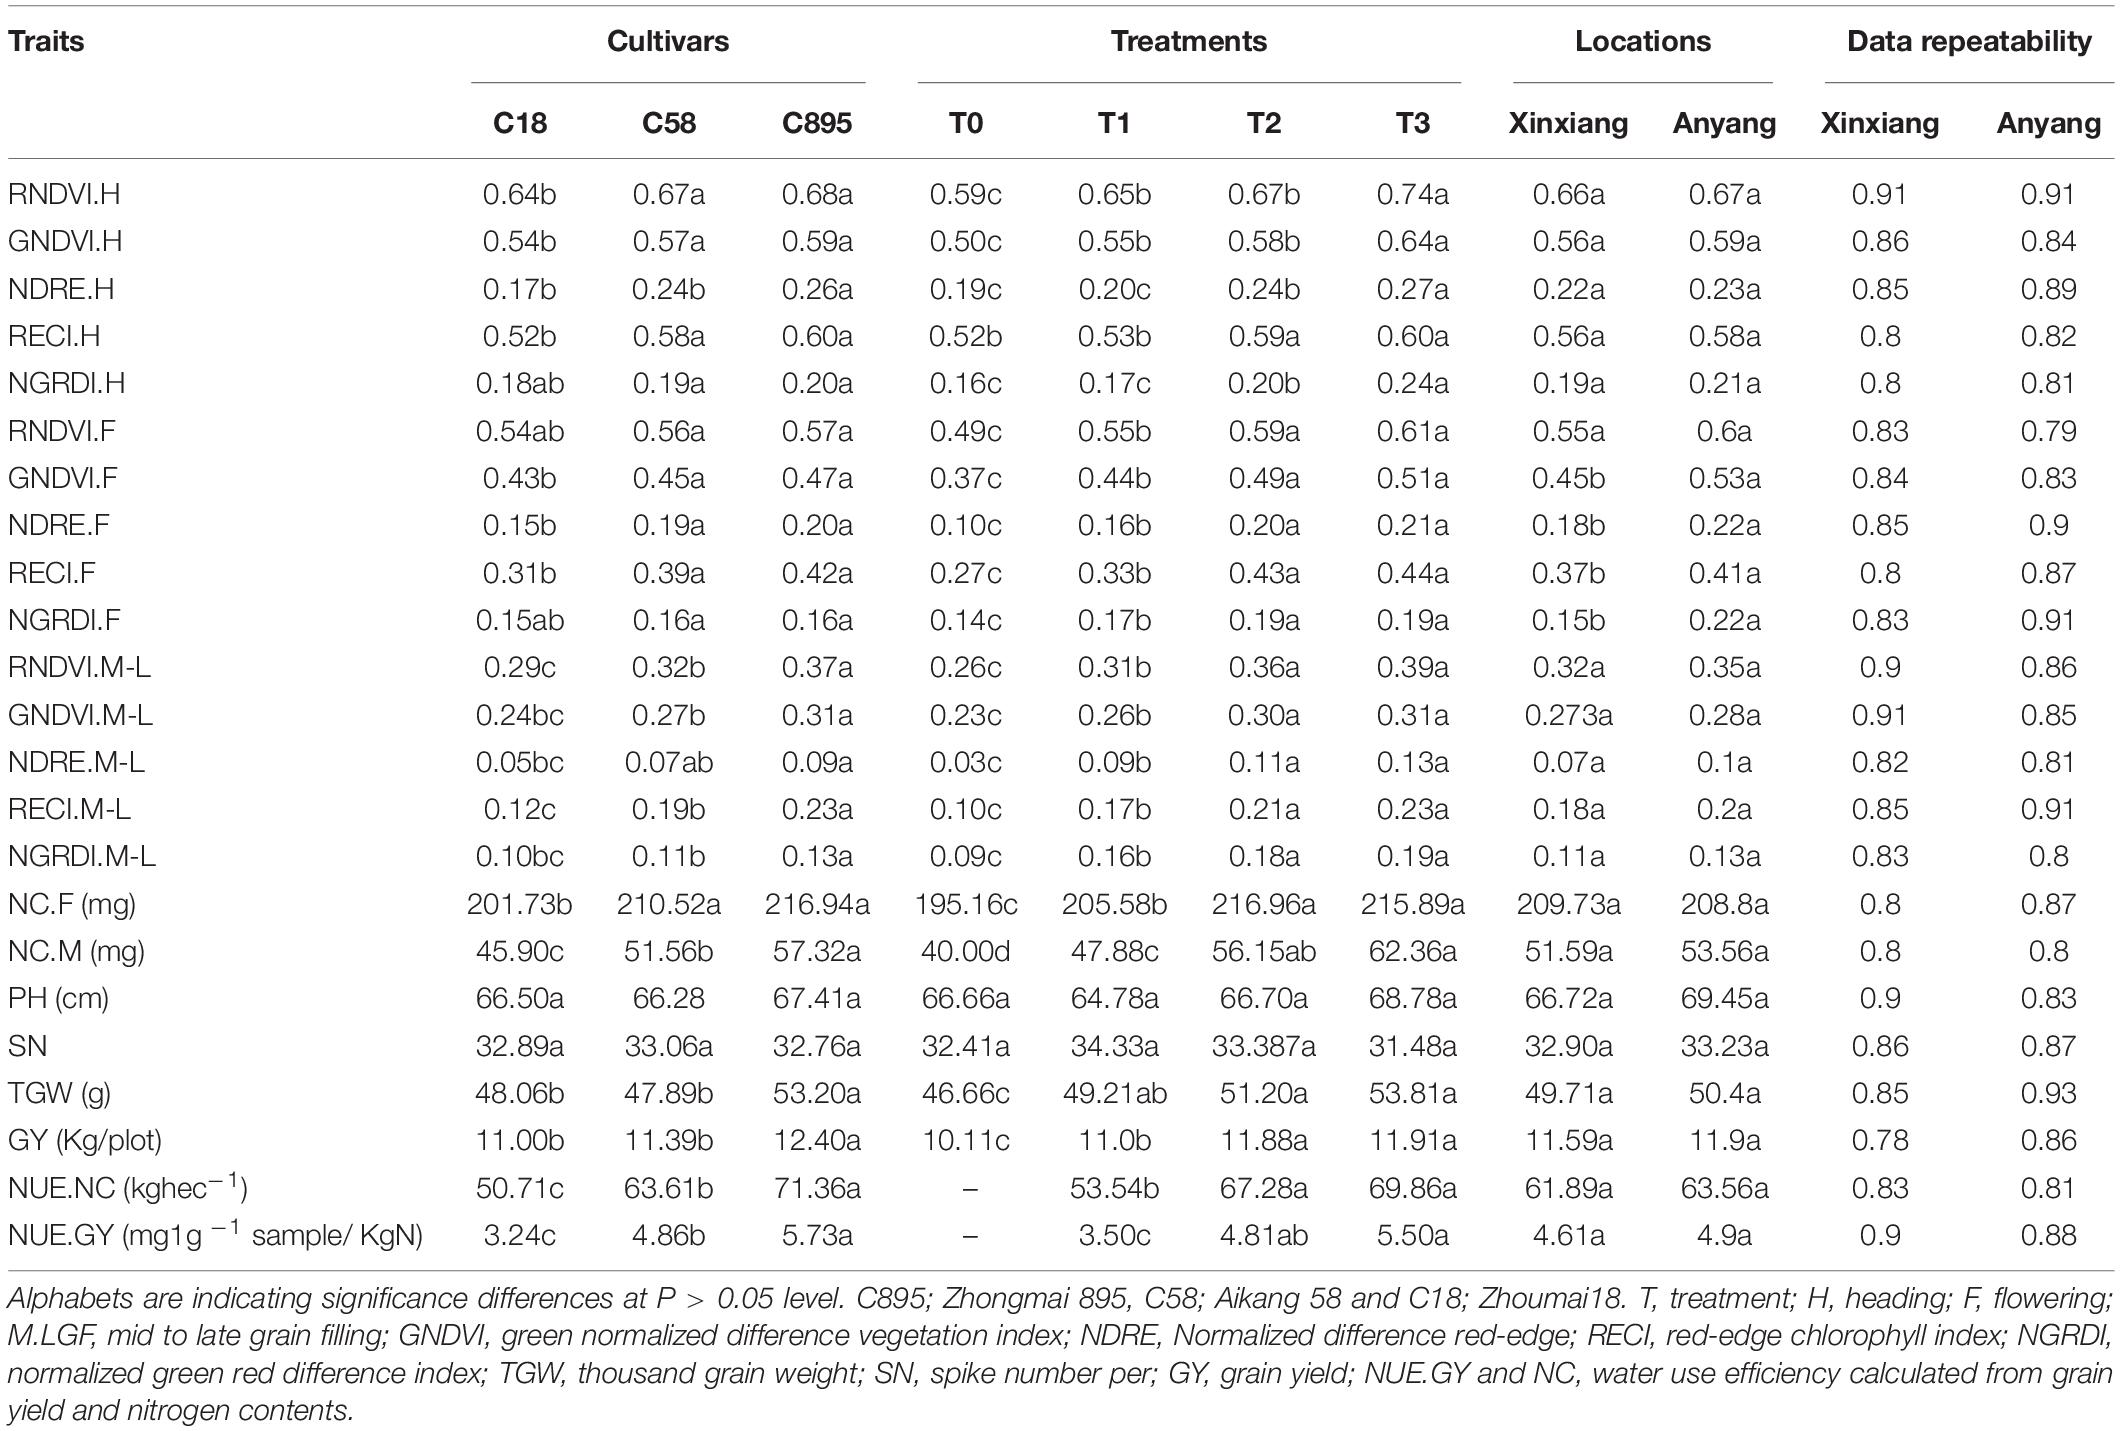
Table 3. Significance test and repeatability of traits for three cultivars under four N treatments and two locations.
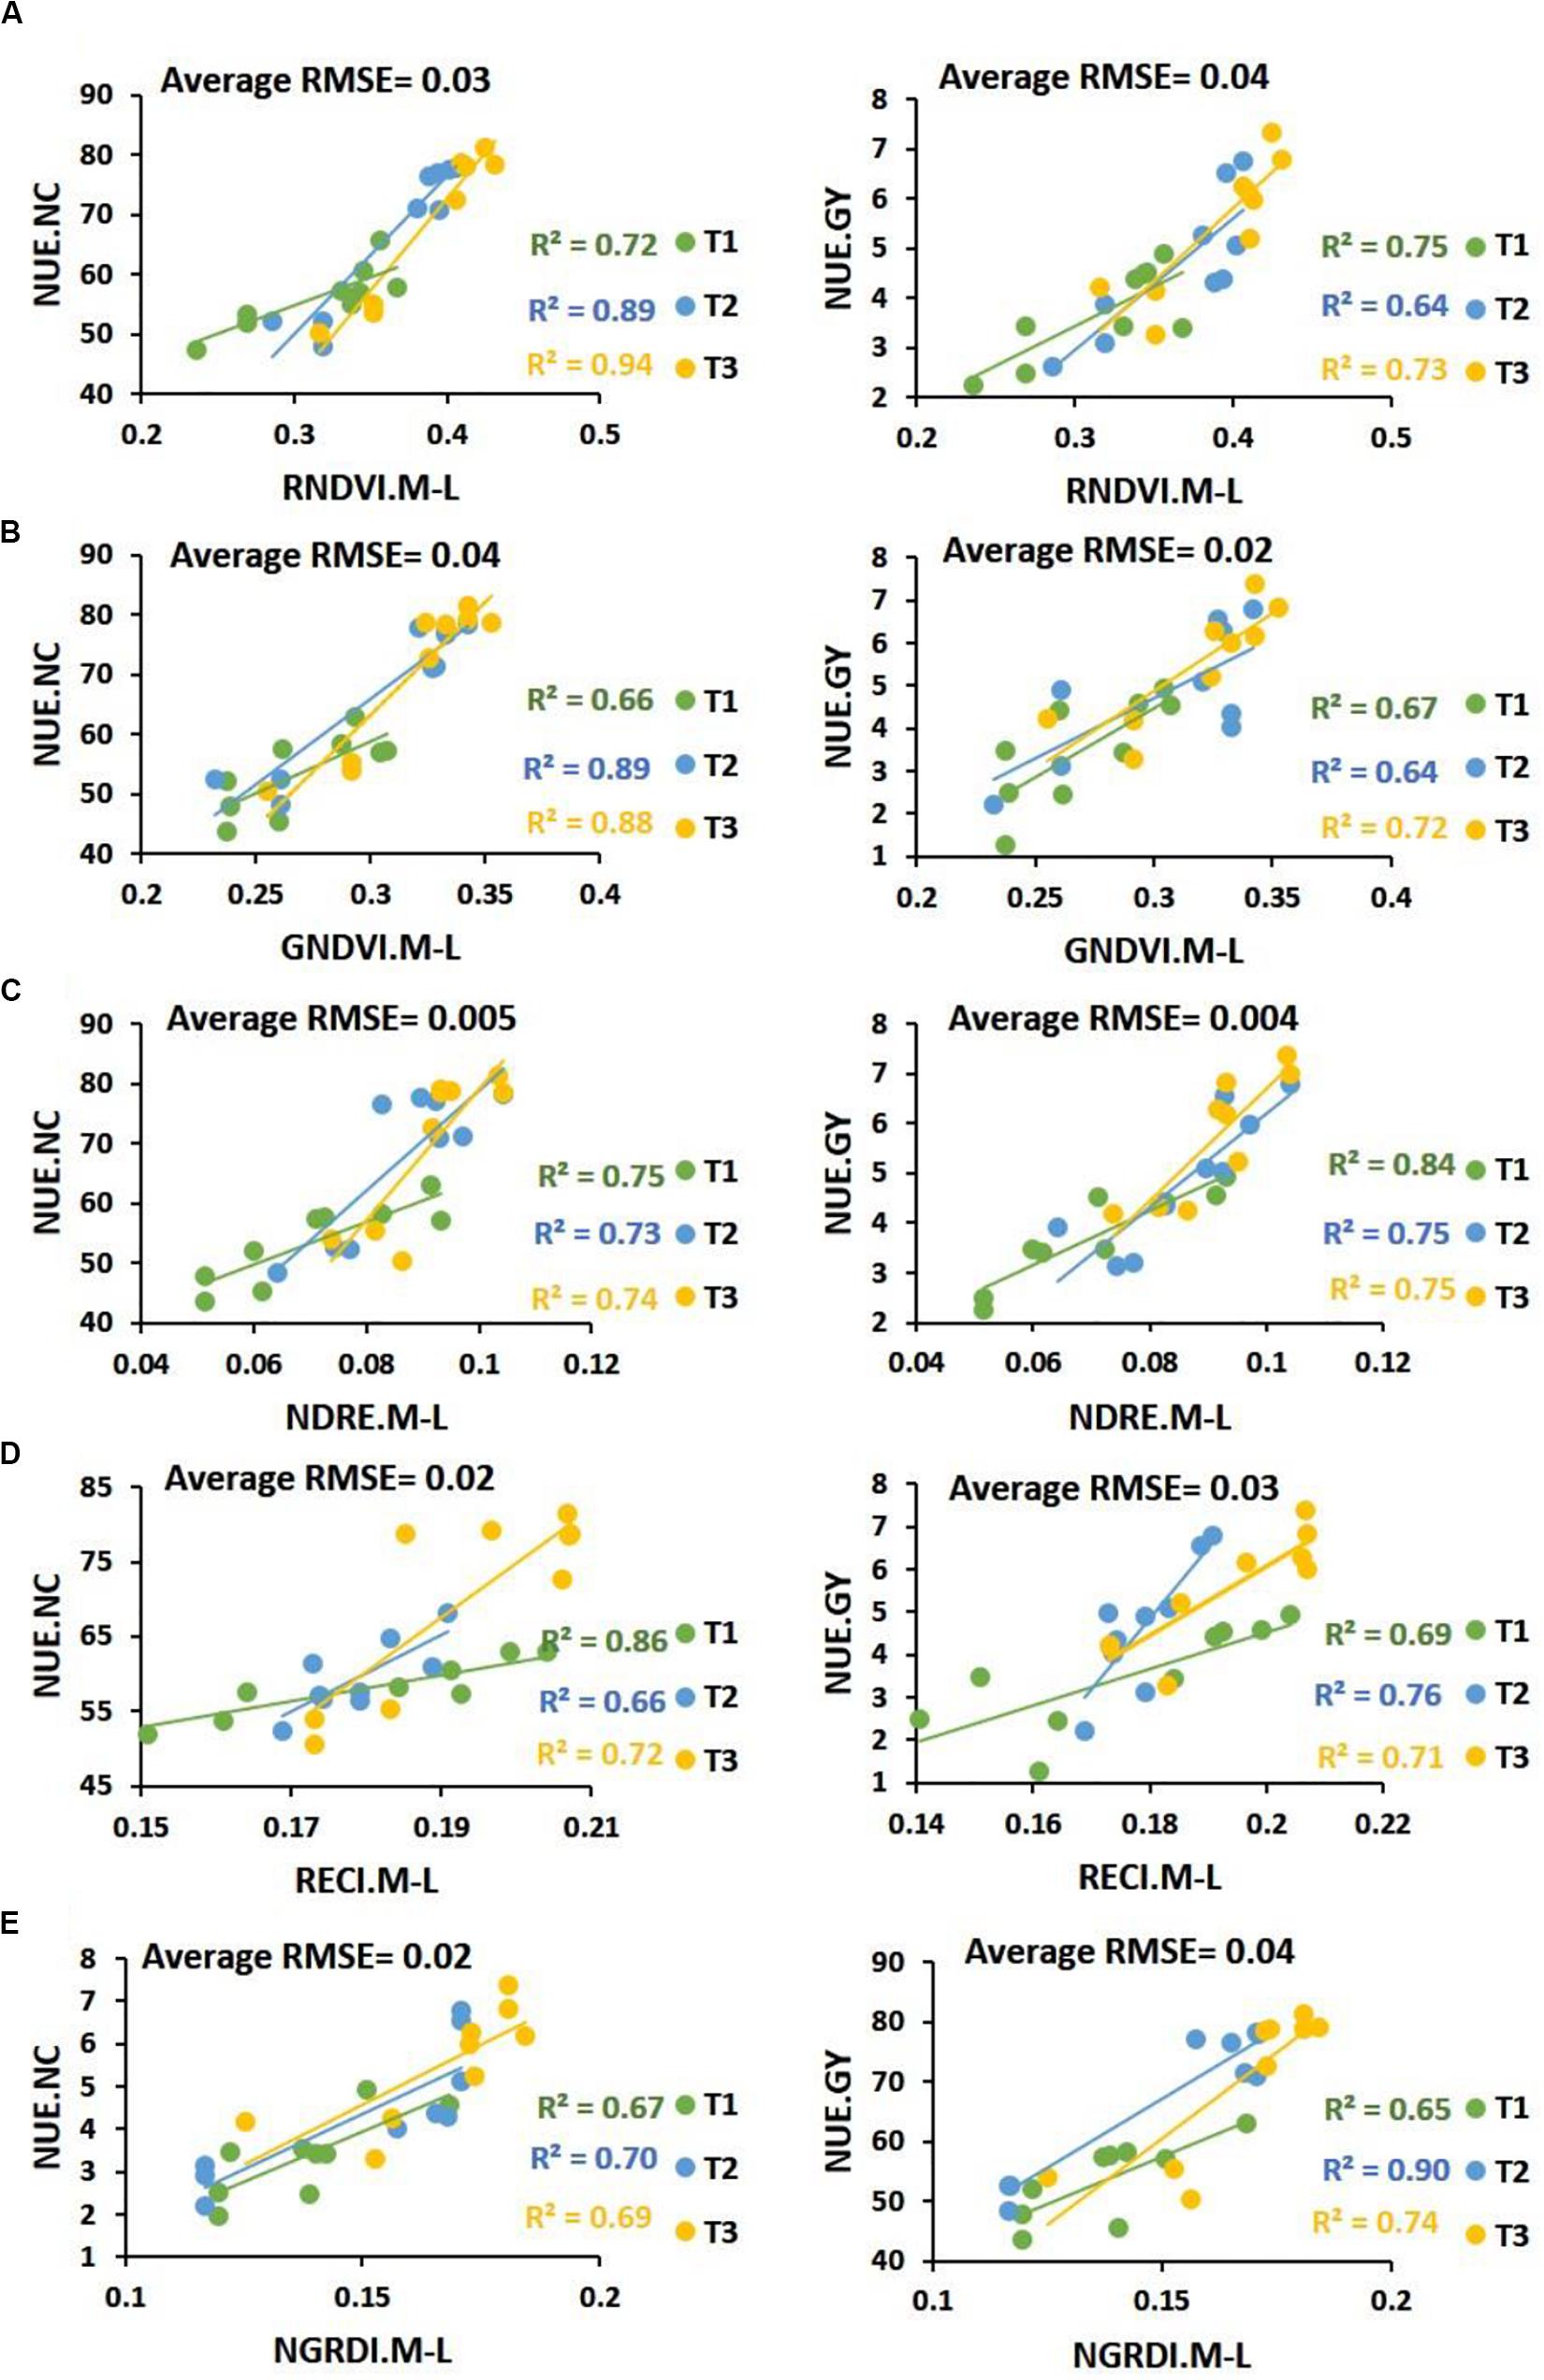
Figure 6. Coefficient of determination results between multispectral traits (A) RNDVI, (B) GNDVI, (C) NDRE, (D) RECI, and (E) NGRDI and NUE calculated from plant nitrogen contents NUE.NC and estimated from grain yield NUE.GY under N-supply treatments.
Traditionally validated indicators of N-status such as N-contents in plant body significantly varied among the three genotypes (P < 0.05) at mid to late grain filling stage in all N-supply treatments (Table 3). Similar trend was observed for UAV-based remotely sensed traits, illustrating the variations in NUE and fluctuations in GY among the genotypes and differences between the treatments. Multispectral traits were found significantly higher at flowering and mid to late grain filling stage in Zhongmai 895 compared to other genotypes across the treatments (Table 3 and Figure 7). T2 was the most resourceful in both water and N-supply treatment for resource-effective GY. High curves points for multispectral traits indicated greater N-content, chlorophyll level under water and N-supply, which mean high NUE. Whereas, declining curves of UAV-based traits showed their low level in control treatment at mid to late grain filling stage.
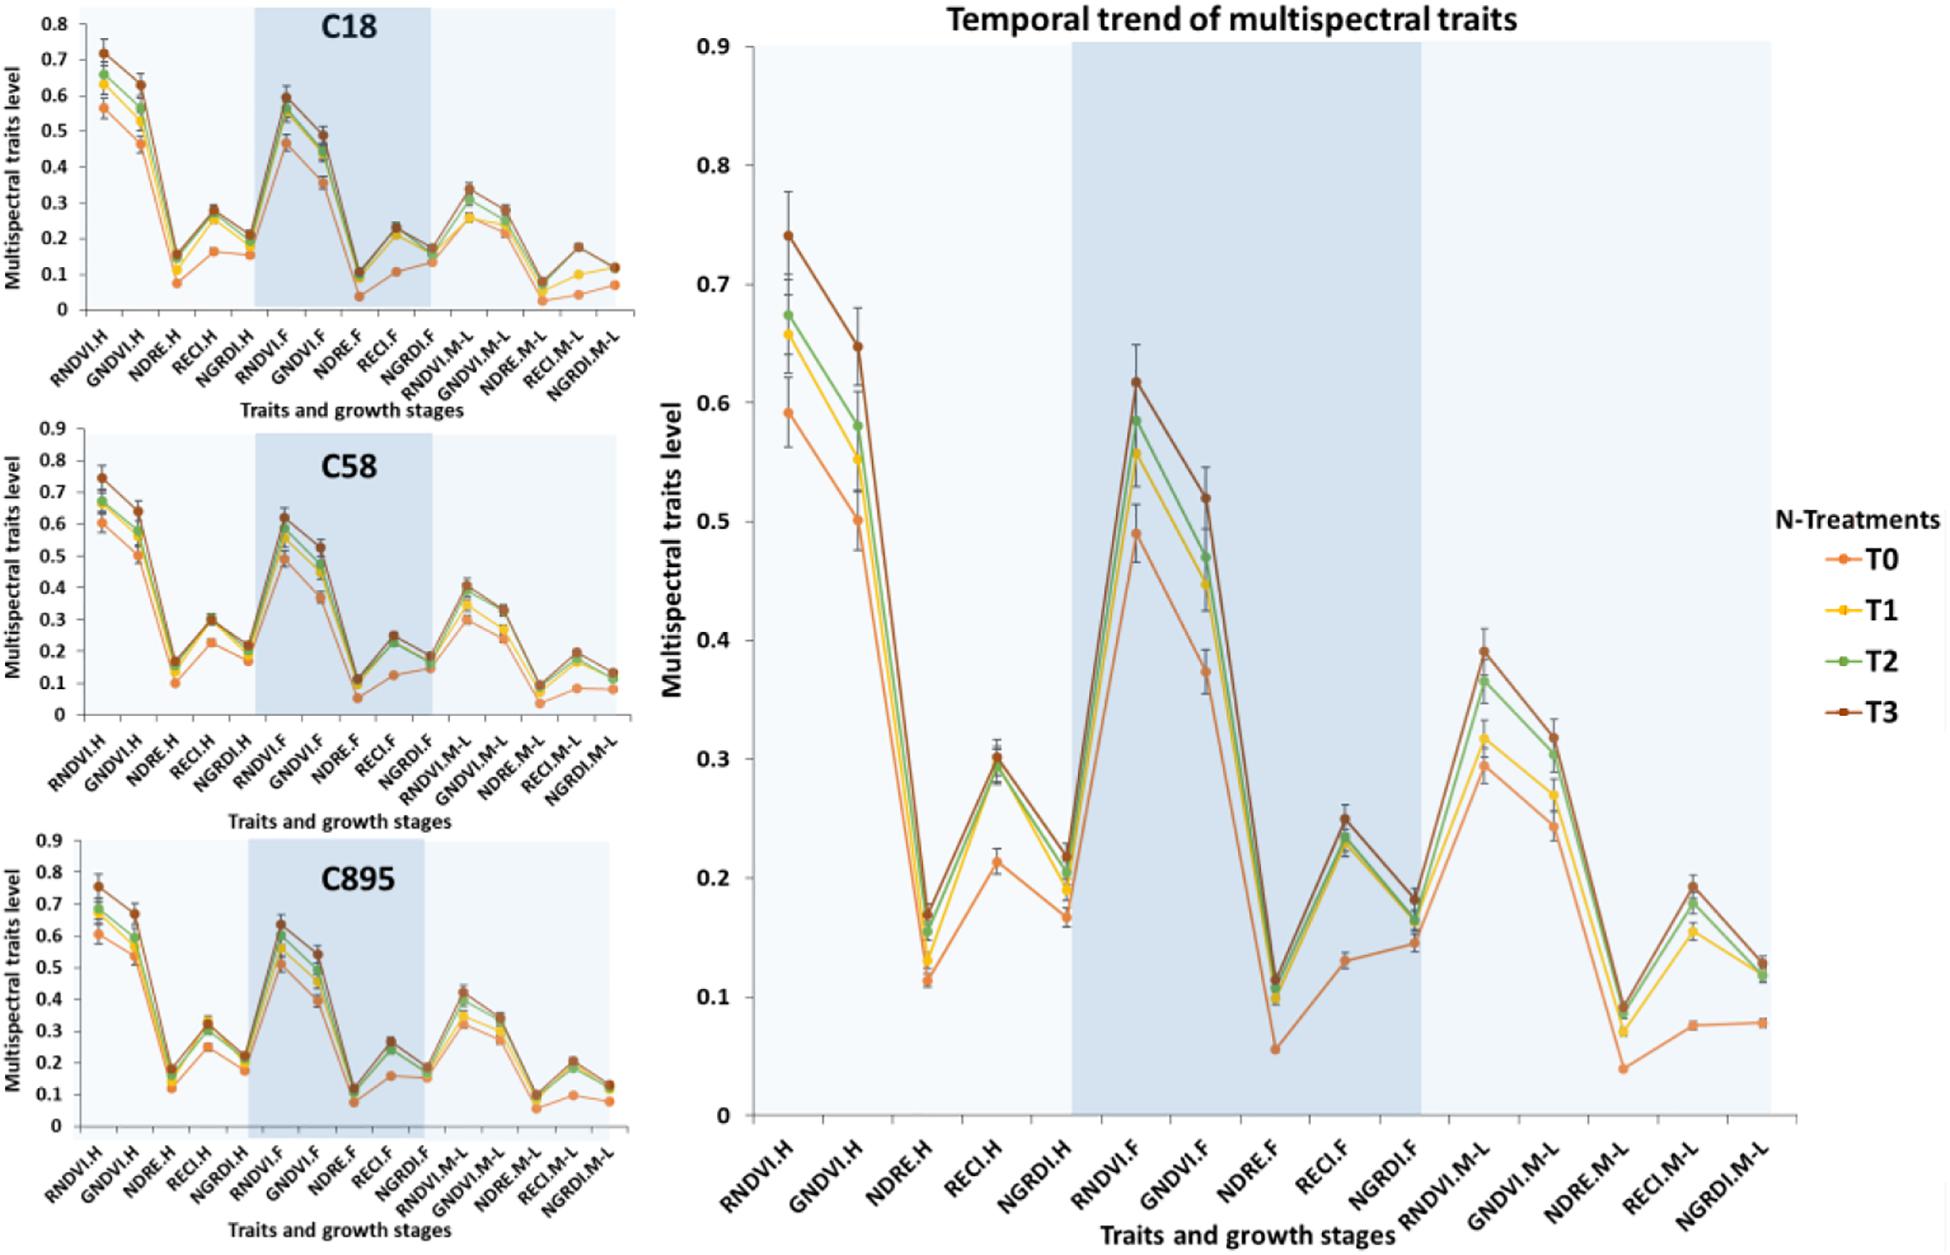
Figure 7. Seasonal fluctuation trend in multispectral traits and comparison of genotypes under N treatments. Error bars are showing standard deviation. *C895, Zhongmai 895; C58, Aikang 58; C18, Zhoumai18.
Results showed that Zhongmai 895 was elite in NUE.GY compared to Aikang 58 and Zhoumai 18, but in NUE.NC both Zhongmai 895 and Aikang 58 were equally high under T1 and T2 (Figure 8). Whereas, GY of Zhongmai 895 was also higher across the water and N supply treatments compared to control treatment where no yield difference was observed among the three genotypes.
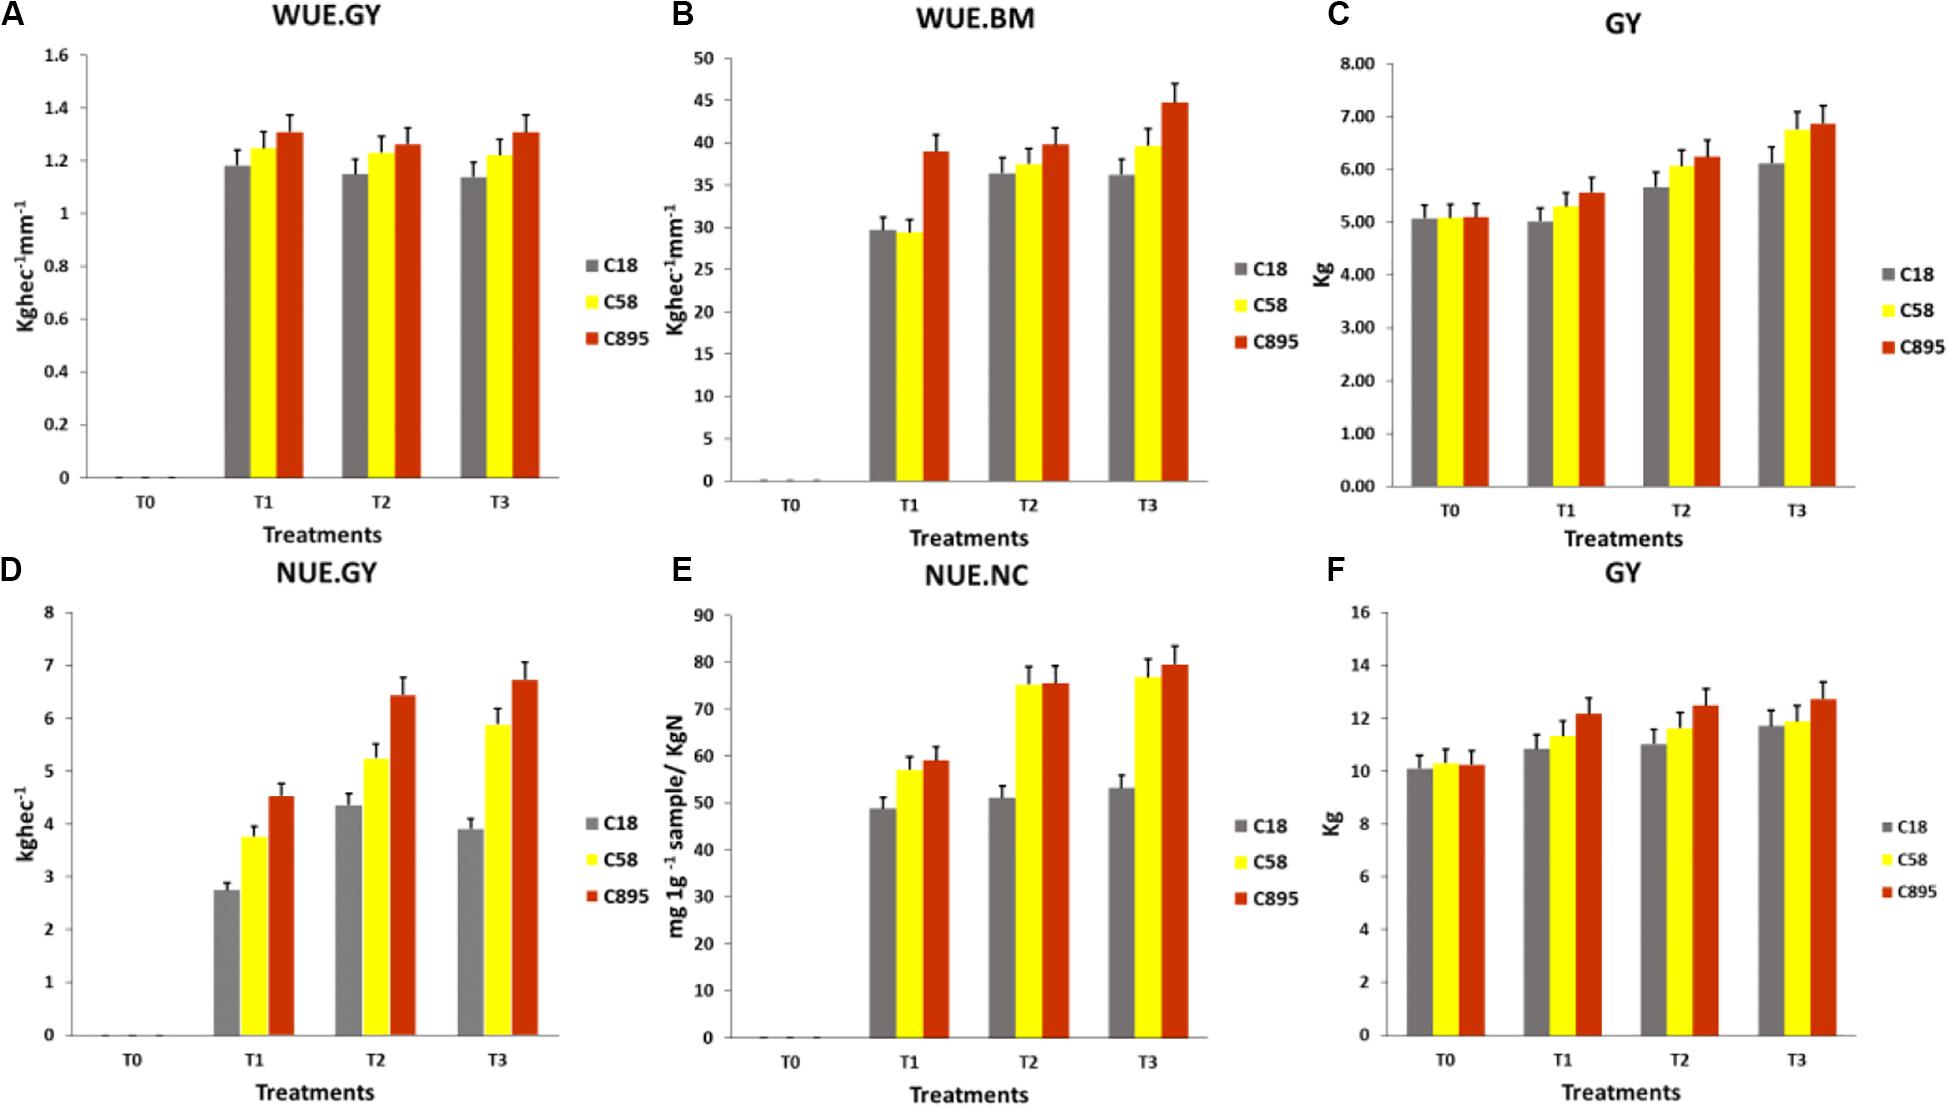
Figure 8. Comparison of genotypes for (A) WUE.GY, (B) WUE.BM, (C) GY under water treatments and (D) NUE.GY, (E) NUE.NC, (F) GY under N-supply treatments. *C895, Zhongmai 895; C58, Aikang 58; C18, Zhoumai18.
Manual phenotyping is time consuming, expensive and error prone, and should be replaced by advanced, rapid and accurate technology to assess dynamic biomass and N status to describe WUE and NUE (Zhang and Zhou, 2019). Therefore, it is important to establish usefulness of UAV-based remote sensing over the traditional phenotyping approaches. Previously, some studies have predicted physiological status such as senescence rate and grain yield effectively through UAV-based multispectral data in wheat (Duan et al., 2017; Hassan et al., 2018a, b). In our study, strong correlations of UAV-based multispectral traits with traditionally measured indicators of water (biomass) and N status (N contents) in all treatments had validated the UAV-based data for accurate assessments of WUE and NUE (Figures 2, 5). Whereas, higher correlations of UAV-based multispectral traits with WUE and NUE compared to ground-based destructive data had proven its superiority. Similar trend in correlations of multispectral traits, WUE and NUE with GY also indicated the practicality of UAV for selection in wheat breeding. Moreover, high prediction results of UAV-based multispectral traits ranging from R2 = 0.58 to 0.94 with low RMSE for WUE and NUE using linear regression model, had also exhibited that UAV remote sensing could be capable in detecting within season water and N utilization efficiencies of plant efficiently (Figures 3, 6). Therefore, addition of UAV-based non-destructive phenotyping platform to large breeding programs could be better replacement of traditional approaches and helpful to reduce the cost of labor and time in assessing biomass, N contents and resource efficiencies in wheat.
Visible sign of efficient supply of water and N-fertilizer are high greenness, chlorophyll and N level in plant body. Spectral bands have strong relationship with physiological indicators of nutrient’s status such as green cover, chlorophyll, N contents (Li et al., 2018) and can demonstrate the water stress severity and N status in plants (Wang et al., 2013; Zheng et al., 2018). But due to different features of spectral bands, some limitations have been reported in precise physiological information at particular growth stages (Hatfield et al., 2008). For example, it is reported that red band is more reliable at pre-maturation stages due to saturation issues in detecting high chlorophyll level after canopy closure. Therefore, it makes difficult to sense minor variations in spectral indicators of plants physiology. Near infrared (NIR) band is strongest in detecting long range of variations in green biomass and N-status. While reflectance in the green and the red-edge bands ranges are also sensitive to the whole range of variations in chlorophyll and green biomass (Hatfield et al., 2008; Li et al., 2018).
In water trial, multispectral traits derived from NIR, red and green bands (RNDVI, GNDVI and NGRDI) had shown strong relationship with temporally measured biomass, WUE and GY. Especially NGRDI has shown low to high correlations (r = 0.27 to 0.90) with WUE and determined the significant (P < 0.05) variations among three wheat genotypes at mid to late grain filling stage in water-supply treatments (T1, T2, and T3) (Figure 2 and Table 2). Whereas, high repeatability of UAV-based multispectral traits indicated that these traits could be reliable for prediction of WUE (Table 2). Similar correlation results of RNDVI and NGRDI have also been reported for efficient prediction of biomass and GY under different water and N conditions (Duan et al., 2017; Hassan et al., 2018b). Low correlations with GY in control treatment (T0) might be due to saturation in red band after early canopy closure under drought severity, while low greenness could also cause low reflectance of green band. Under normal condition, healthy plant showed high reflectance of NIR band, and low red and re-edge bands. Whereas, green, red and red-edge bands showed high reflectance as compare to NIR under water stress. NGDRI was derived from subtracting red from the green band, which means calculating the fraction of reflected red band from the visible green band. This fractional information about the red band could provide deep information about minor proportion of yellowing in plants (Mutanga and Skidmore, 2004; Hatfield et al., 2008). Therefore, NGDRI could be useful to detect greenness and health of plants under normal growing condition. Whereas, GNDVI derived from NIR and green band was highly correlated (up to r = 0.70) with biomass, at heading to flowering stages compared to mid to late grain filling stage, indicating that this trait could predict the water status at pre-maturation stages effectively. Moderate to strong correlations ranging from r = 0.33 to 0.82 of NDRE and RECI traits derived from NIR and red-edge band with green biomass at particular stage and WUE were also recorded efficient to detect variations among the genotypes across the treatments (Figure 2 and Table 2). Red-edge band has been reported to detect water stress severity because it could cover wider range of chlorophyll level as compare to red band (Sharma et al., 2015). Therefore, despite of similar trend in correlation results, NDRE and RECI could be more reliable traits compared to RNDVI and GNDVI to predict the biomass, WUE and variations among the genotypes at mid to late grain filling stage due to known advantage of red-edge band over red band (Mutanga and Skidmore, 2004).
In N-supply experiment, moderate to strong correlations of all multispectral traits with biomass, N-contents, NUE and GY across the growth stages indicated that UAV-based phenotyping can also be useful in selection of N-efficient genotypes and the assessment of crop cultivation method. Despite the previous finding that biomass varied greatly at early growth stages which can mask the effect of N-supply (Haboudane et al., 2002), our results had shown moderate to strong correlations ranging from r = 0.27 to 0.84 and r = 0.27 to 0.97 between multispectral traits and N-contents, respectively, at heading and flowering stages. Moreover, Haboudane et al. (2002) had reported weak capability of UAV-based spectral indices in assessing N-status after heading because of structural constraints of canopy that cause saturation in reflectance of bands (Haboudane et al., 2002). But in our results, UAV-based multispectral traits showed high ability to detect N-status and NUE at mid to late grain filling stage with high r values [up to 0.97 (Figure 5)]. Interestingly, RNDVI, GNDVI, NDRE, and RECI performed equally in estimating N-contents and NUE at mid to late grain filling stages. RNDVI and NDRE showed high correlations (up to 0.97) with both NUE.NC and NUE.GY at mid to late grain filling stage, because it has strong connection in detecting N-status while reflectance of NIR band has been reported higher under application N-fertilizer. Significant variations at (P < 0.05) among the genotypes for N-contents and NUE were also successfully assessed through variation in UAV-based multispectral traits effectively with high repeatability across the growth stages and N treatments (Table 3). Whereas, similar correlation trends among destructive measurements of N-content and multispectral traits for NUE, TGW, and GY indicated that UAV based non-destructive sensing could be a cost-effective replacement.
In conclusion, NGDRI was more water-sensitive under water efficient conditions, while NDRE and RECI were drought sensitive under water-deficient conditions. Whereas, RNDVI, GNDVI, NDRE, and RECI showed equally better sensitivity to assess NUE across the growth cycle. Especially, RNDVI and NDRE were consistent in forecasting variations for both NUE.NC and NUE.GY.
Destructive assessment regarding efficiency of water and N-fertilizer application for different genotypes and evaluation of cultivation approaches have remained a bottleneck for resourceful improvement of crop yield (Boschetti et al., 2014; Zheng et al., 2018). It is due to laborious and error prone work across the season in case large number of genotypes which might mislead the agriculturist during selection. Previously, few studies have been conducted in detecting water and nutrient status of plant using non-destructive remote sensing from both ground and aerial platforms (Haile et al., 2012; Li et al., 2018; Zheng et al., 2018; Zhang and Zhou, 2019). But there is no report on practical application of aerial platform to predict the WUE and NUE for evaluating variations in genotypes under different water and N-supply levels. This study had predicted significant variations successfully among the genotypes for water and N uptake efficiencies and their impact on grain yield through UAV-based multispectral traits with high regression values of R2 = 0.58 to 0.89 and R2 = 0.64 to 0.94, respectively, with low root mean square error (Figures 3, 6). These results had proven the usefulness of non-destructive aerial phenotyping compared to ground-based assessments with high repeatability. Water and N-fertilizer demand of different genotypes at particular growth stages is varied. Therefore, prediction of slight fluctuation in water and N-status and its impact on biomass development, chlorophyll level through generating UAV-based multispectral dataset could be helpful in accurate selection. In our results, genotype Zhongmai 895 performed significantly better in WUE and NUE for enhancement of GY at mid to late grain filling stages as compared to other two genotypes across the treatments of both experiments (Tables 2, 3). While at this stage, there was also high level of multispectral traits for Zhongmai 895 which indicated the usefulness of UAV-based phenotyping to predict WUE and NUE (Figures 4, 7). Superiority of Zhongmai 895 for NUE can also be validated by recently study Yang et al. (2020), which has reported seedling vigor of Zhongmai 895 cultivar under high N condition. Therefore, these remotely sensed traits could be a rapid and cost-effective replacement of traditional traits for precise selection of genotypes.
Resourceful application of water and N-fertilizer is vital to limit huge losses in important resources. For this, development of elite cultivars and efficient supply of water and N-fertilizer could be effective for required high yield from particular genotypes (Guo et al., 2010). In china, availability of irrigation water is decreasing (Zhang et al., 2007), while N resources are also predicted to decrease in coming years (Chuan et al., 2016; Zhang et al., 2016). Whereas, most of the cultivated lands in China is already been reported highly nitrogenous (Chuan et al., 2016). Therefore, appropriate application of water and N could help to cope with these challenges. It is difficult to phenotype large sample size through destructive measurement repeatedly under various water and N-fertilizer regimes. A non-destructive approach in assessing exact requirement for growth of particular genotypes is important factor regarding potential achievement in crop improvement. Our UAV-based results had shown that T1 and T2 were resourceful for WUE and T2 for NUE compared to T3 (Figure 8). There was no significant difference between T2 and T3 in terms of both UAV and ground-based indicator of water and N status as well as in WUE and NUE for GY. But genotypes had shown significant differences in WUE and NUE under T3 in both water and N-supply treatments. It means up-take efficiency of water and N had increased up to T2 for significant enhancement of GY, but T3 was not resourceful in both experiments. Zhongmai 895 was the most resource-efficient genotype across the water and N-supply treatments (Figure 8 and Tables 2, 3). Our result suggested that UAV-based multispectral data could be vital for establishing cultivation strategies for crops.
In this study, we established that UAV-based remotely sensed multispectral traits could predict the variations among the genotypes for WUE, NUE and their impact on GY. We found that NGDRI was an efficient multispectral trait to detect water status under irrigated conditions, while NDRE and RECI under drought stress. Whereas, RNDVI, GNDVI, NDRE, and RECI were equally better to sense the crop growth in different irrigation regimes in rapid manner. The RNDVI, GNDVI, NDRE, and RECI were equally sensitive for NUE prediction. Especially, RNDVI showed better prediction for NUE.NC, and NDRE was constant in assessing both NUE.NC and NUE.GY. Our results also suggested that T2 in irrigation (120 mm) and N-fertilization (180 kg ha–1) trials was the most resource-efficient treatment for all three genotypes, while Zhongmai 895 was elite in WUE and NUE. In future, the inherent mechanism of crop water and N uptake as well as crop morphological and structural properties, coupled with UAV-based remote sensing, will be used to increase the selection accuracy in large breeding programs.
The datasets generated for this study are available on request to the corresponding author.
MY and MH managed the UAV flights for aerial imagery, analyzed the data, and supervised and wrote the manuscript. ZH for supervised the research. MY and KX conducted the ground-based field measurements. YX, YZ, and CZ managed and directed the trial. YX, AR, XX, and XJ gave comments and suggestions during preparation of the manuscript. All authors contributed to the article and approved the submitted version.
This work was funded by the National Natural Science Foundation of China (3171101265 and 31671691), the National Key Project (2016YFD0101804), the Fundamental Research Funds for the Institute Planning in Chinese Academy of Agricultural Sciences (S2018QY02), and CAAS Science and Technology Innovation Program.
The authors declare that the research was conducted in the absence of any commercial or financial relationships that could be construed as a potential conflict of interest.
The Supplementary Material for this article can be found online at: https://www.frontiersin.org/articles/10.3389/fpls.2020.00927/full#supplementary-material
TABLE S1 | Total precipitation across the growing season.
Ali, M. H., and Talukder, M. S. U. (2008). Increasing water productivity in crop production—A synthesis. Agric. Water Manag. 95, 1201–1213. doi: 10.1016/j.agwat.2008.06.008
Araus, J. L., and Cairns, J. E. (2014). Field high-throughput phenotyping: the new crop breeding frontier. Trends Plant Sci. 19, 52–61. doi: 10.1016/j.tplants.2013.09.008
Araus, J. L., and Kefauver, S. C. (2018). Breeding to adapt agriculture to climate change: affordable phenotyping solutions. Curr. Opin. Plant Biol. 45, 237–247.
Bendig, J., Bolten, A., Bennertz, S., Broscheit, J., Eichfuss, S., and Bareth, G. (2014). Estimating biomass of barley using crop surface models (CSMs) derived from UAV-based RGB imaging. Remote Sens. 6:10395. doi: 10.3390/rs61110395
Boschetti, M., Nutini, F., Manfron, G., Brivio, P. A., and Nelson, A. (2014). Comparative analysis of normalised difference spectral indices derived from MODIS for detecting surface water in flooded rice cropping systems. PLoS One 9:e88741. doi: 10.1371/journal.pone.0088741
Bremner, J. M., and Mulvaney, C. (1982). “Nitrogen-Total,” in Methods of Soil Analysis. Part 2. Chemical and Microbiological Properties, eds A. L. Page, R. H. Miller, and D. R. Keeney (Madison: American Society of Agronomy, Soil Science Society of America), 595–624.
Christopher, J. T., Christopher, M. J., Borrell, A. K., Fletcher, S., and Chenu, K. (2016). Stay-green traits to improve wheat adaptation in well-watered and water-limited environments. J. Exp. Bot. 67, 5159–5172. doi: 10.1093/jxb/erw276
Chuan, L., He, P., Zhao, T., Zheng, H., and Xu, X. (2016). Agronomic characteristics related to grain yield and nutrient use efficiency for wheat production in China. PLoS One 11:e0162802. doi: 10.1371/journal.pone.0162802
Cobb, J. N., DeClerck, G., Greenberg, A., Clark, R., and McCouch, S. (2013). Next-generation phenotyping: requirements and strategies for enhancing our understanding of genotype–phenotype relationships and its relevance to crop improvement. Theoret. Appl. Genet. 126, 867–887. doi: 10.1007/s00122-013-2066-0
Cui, Z., Zhang, H., Chen, X., Zhang, C., Ma, W., Huang, C., et al. (2018). Pursuing sustainable productivity with millions of smallholder farmers. Nature 555, 363–366.
Duan, T., Chapman, S., Guo, Y., and Zheng, B. (2017). Dynamic monitoring of NDVI in wheat agronomy and breeding trials using an unmanned aerial vehicle. Field Crops Res. 210, 71–80. doi: 10.1016/j.fcr.2017.05.025
Eberbach, P., and Pala, M. (2005). Crop row spacing and its influence on the partitioning of evapotranspiration by winter-grown wheat in Northern Syria. Plant Soil 268, 195–208. doi: 10.1007/s11104-004-0271-y
FAO (2018). Food and Agriculture Organization. Rome: FAO. Available online at: http://www.fao.org/faostat/en/#home
Gao, F., Ma, D., Yin, G., Rasheed, A., Dong, Y., Xiao, Y., et al. (2017). Genetic progress in grain yield and physiological traits in Chinese Wheat Cultivars of Southern Yellow and Huai Valley since 1950. Crop Sci. 57, 760–773. doi: 10.2135/cropsci2016.05.0362
Guo, J. H., Liu, X. J., Zhang, Y., Shen, J. L., Han, W. X., Zhang, W. F., et al. (2010). Significant acidification in major Chinese crop lands. Science 327, 1008–1010. doi: 10.1126/science.1182570
Haboudane, D., Miller, J. R., Tremblay, N., Zarco-Tejada, P. J., and Dextraze, L. (2002). Integrated narrow-band vegetation indices for prediction of crop chlorophyll content for application to precision agriculture. Remote Sens. Environ. 81, 416–426. doi: 10.1016/s0034-4257(02)00018-4
Haghighattalab, A., González Pérez, L., Mondal, S., Singh, D., Schinstock, D., Rutkoski, J., et al. (2016). Application of unmanned aerial systems for high throughput phenotyping of large wheat breeding nurseries. Plant Methods 12:35.
Haile, D., Nigussie, D., and Ayana, A. (2012). Nitrogen use efficiency of bread wheat: Effects of nitrogen rate and time of application. J. Soil Sci. Plant Nutr. 12, 389–410.
Han, L., Yang, G., Yang, H., Xu, B., Li, Z., and Yang, X. (2018). Clustering field-based maize phenotyping of plant height growth and canopy spectral dynamics using a UAV remote sensing approach. Front. Plant Sci. 9:1638. doi: 10.3389/fpls.2018.01638
Hassan, M. A., Yang, M., Fu, L., Rasheed, A., Zheng, B., Xia, X., et al. (2019). Accuracy assessment of plant height using an unmanned aerial vehicle for quantitative genomic analysis in bread wheat. Plant Methods 15:37.
Hassan, M. A., Yang, M., Rasheed, A., Jin, X., Xia, X., Xiao, Y., et al. (2018a). Time-series multispectral indices from unmanned aerial vehicle imagery reveal senescence rate in bread wheat. Remote Sens. 10:809. doi: 10.3390/rs10060809
Hassan, M. A., Yang, M., Rasheed, A., Yang, G., Reynolds, M., Xia, X., et al. (2018b). A rapid monitoring of NDVI across the wheat growth cycle for grain yield prediction using a multi-spectral UAV platform. Plant Sci. 282, 95–103. doi: 10.1016/j.plantsci.2018.10.022
Hatfield, J. L., Gitelson, A. A., Schepers, J. S., and Walthall, C. L. (2008). Application of spectral remote sensing for agronomic decisions. Agron. J. 100, S–117–S–131.
Hawkesford, M. J. (2017). Genetic variation in traits for nitrogen use efficiency in wheat. J. Exp. Bot. 68, 2627–2632. doi: 10.1093/jxb/erx079
Hu, H., and Xiong, L. (2014). Genetic engineering and breeding of drought resistant crops. Annu. Rev. Plant Biol. 65, 715–741. doi: 10.1146/annurev-arplant-050213-040000
Jin, X., Liu, S., Baret, F., Hemerlé, M., and Comar, A. (2017). Estimates of plant density of wheat crops at emergence from very low altitude UAV imagery. Remote Sens. Environ. 198, 105–114. doi: 10.1016/j.rse.2017.06.007
Lesk, C., Rowhani, P., and Ramankutty, N. (2016). Influence of extreme weather disasters on global crop production. Nature 529, 84–87. doi: 10.1038/nature16467
Li, J., Shi, Y., Veeranampalayam-Sivakumar, A.-N., and Schachtman, D. P. (2018). Elucidating sorghum biomass, nitrogen and chlorophyll contents with spectral and morphological traits derived from unmanned aircraft system. Front. Plant Sci. 9:1406. doi: 10.3389/fpls.2018.01406
Ma, Y., Qu, L., Wang, W., Yang, X., and Lei, T. (2016). Measuring soil water content through volume/mass replacement using a constant volume container. Geoderma 271, 42–49. doi: 10.1016/j.geoderma.2016.02.003
Mutanga, O., and Skidmore, A. K. (2004). Narrow band vegetation indices overcome the saturation problem in biomass estimation. Int. J. Remote Sens. 25, 3999–4014. doi: 10.1080/01431160310001654923
Nehe, A. S., Misra, S., Murchie, E. H., Chinnathambi, K., and Foulkes, M. J. (2018). Genetic variation in N-use efficiency and associated traits in Indian wheat cultivars. Field Crops Res. 225, 152–162. doi: 10.1016/j.fcr.2018.06.002
Passioura, J. B. (2012). Phenotyping for drought tolerance in grain crops: when is it useful to breeders? Funct. Plant Biol. 39, 851–859.
Potgieter, A. B., George-Jaeggli, B., Chapman, S. C., Laws, K., Suárez Cadavid, L. A., Wixted, J., et al. (2017). Multi-spectral imaging from an unmanned aerial vehicle enables the assessment of seasonal leaf area dynamics of sorghum breeding lines. Front. Plant Sci. 8:1532. doi: 10.3389/fpls.2017.01532
R Core Team (2016). R: A Language and Environment for Statistical Computing. Vienna: R Foundation for Statistical Computing.
Rasheed, A., Takumi, S., Hassan, M. A., Imtiaz, M., Ali, M., Morgunov, A. I., et al. (2020). Appraisal of wheat genomics for gene discovery and breeding applications: a special emphasis on advances in Asia. Theoret. Appl. Genet. 133, 1503–1520. doi: 10.1007/s00122-019-03523-w
Sankaran, S., Khot, L. R., and Carter, A. H. (2015). Field-based crop phenotyping: multispectral aerial imaging for evaluation of winter wheat emergence and spring stand. Comput. Electron. Agric. 118, 372–379. doi: 10.1016/j.compag.2015.09.001
Sehgal, D., Skot, L., Singh, R., Srivastava, R. K., Das, S. P., Taunk, J., et al. (2015). Exploring potential of pearl millet germplasm association panel for association mapping of drought tolerance traits. PLoS One 10:e0122165. doi: 10.1371/journal.pone.0122165
Shafian, S., Rajan, N., Schnell, R., Bagavathiannan, M., Valasek, J., Shi, Y., et al. (2018). Unmanned aerial systems-based remote sensing for monitoring sorghum growth and development. PLoS One 13:e0196605. doi: 10.1371/journal.pone.0196605
Sharma, L. K., Bu, H., Denton, A., and Franzen, D. W. (2015). Active-Optical sensors using red NDVI compared to red edge NDVI for prediction of corn grain yield in North Dakota. U.S.A. Sensors 15, 27832–27853. doi: 10.3390/s151127832
Sun, Q. P., Kröbel, R., Müller, T., Römheld, V., Cui, Z. L., Zhang, F. S., et al. (2011). Optimization of yield and water-use of different cropping systems for sustainable groundwater use in North China Plain. Agric. Water Manag. 98, 808–814. doi: 10.1016/j.agwat.2010.12.007
Thorp, K., Thompson, A., Harders, S., French, A., and Ward, R. (2018). High throughput phenotyping of crop water use efficiency via multispectral drone imagery and a daily soil water balance model. Remote Sens. 10:1682. doi: 10.3390/rs10111682
Wang, L., Hunt, E. R. Jr., Qu, J. J., Hao, X., and Daughtry, C. S. (2013). Remote sensing of fuel moisture content from ratios of narrow-band vegetation water and dry-matter indices. Remote Sens. Environ. 129, 103–110. doi: 10.1016/j.rse.2012.10.027
Yang, G., Liu, J., Zhao, C., Li, Z., Huang, Y., Yu, H., et al. (2017). Unmanned aerial vehicle remote sensing for field-based crop phenotyping: current status and perspectives. Front. Plant Sci. 8:1111. doi: 10.3389/fpls.2017.01111
Yang, M., Wang, C., Hassan, M. A., Wu, Y., Xia, X., Shi, S., et al. (2020). QTL mapping of seedling biomass and root traits under different nitrogen conditions in bread wheat (Triticum aestivum L.). J. Integrat. Agric. 19, 2–14.
Yi, Q., Bao, A., Wang, Q., and Zhao, J. (2013). Estimation of leaf water content in cotton by means of hyperspectral indices. Comput. Electron. Agric. 90, 144–151. doi: 10.1016/j.compag.2012.09.011
Zhang, F., and Zhou, G. (2019). Estimation of vegetation water content using hyperspectral vegetation indices: a comparison of crop water indicators in response to water stress treatments for summer maize. BMC Ecol. 19:18. doi: 10.1186/s12898-019-0233-0
Zhang, J., Sun, J., Duan, A., Wang, J., Shen, X., and Liu, X. (2007). Effects of different planting patterns on water use and yield performance of winter wheat in the Huang-Huai-Hai plain of China. Agric. Water Manag. 92, 41–47. doi: 10.1016/j.agwat.2007.04.007
Zhang, W., Cao, G., Li, X., Zhang, H., Wang, C., Liu, Q., et al. (2016). Closing yield gaps in China by empowering smallholder farmers. Nature 537, 671–674. doi: 10.1038/nature19368
Zhang, X., Bol, R., Rahn, C., Xiao, G., Meng, F., and Wu, W. (2017). Agricultural sustainable intensification improved nitrogen use efficiency and maintained high crop yield during 1980–2014 in Northern China. Sci. Total Environ. 596-597, 61–68. doi: 10.1016/j.scitotenv.2017.04.064
Zhang, X., Davidson, E. A., Mauzerall, D. L., Searchinger, T. D., Dumas, P., and Shen, Y. (2015). Managing nitrogen for sustainable development. Nature 528, 51–59.
Keywords: nitrogen content, phenotyping, vegetation indices, UAV, utilization efficiency, water contents, wheat
Citation: Yang M, Hassan MA, Xu K, Zheng C, Rasheed A, Zhang Y, Jin X, Xia X, Xiao Y and He Z (2020) Assessment of Water and Nitrogen Use Efficiencies Through UAV-Based Multispectral Phenotyping in Winter Wheat. Front. Plant Sci. 11:927. doi: 10.3389/fpls.2020.00927
Received: 25 February 2020; Accepted: 05 June 2020;
Published: 26 June 2020.
Edited by:
Wanneng Yang, Huazhong Agricultural University, ChinaReviewed by:
Guijun Yang, Beijing Research Center for Information Technology in Agriculture, ChinaCopyright © 2020 Yang, Hassan, Xu, Zheng, Rasheed, Zhang, Jin, Xia, Xiao and He. This is an open-access article distributed under the terms of the Creative Commons Attribution License (CC BY). The use, distribution or reproduction in other forums is permitted, provided the original author(s) and the copyright owner(s) are credited and that the original publication in this journal is cited, in accordance with accepted academic practice. No use, distribution or reproduction is permitted which does not comply with these terms.
*Correspondence: Yonggui Xiao, eGlhb3lvbmdndWlAY2Fhcy5jbg==; Zhonghu He, emhoZWNhYXNAMTYzLmNvbQ==
†These authors have contributed equally to this work
Disclaimer: All claims expressed in this article are solely those of the authors and do not necessarily represent those of their affiliated organizations, or those of the publisher, the editors and the reviewers. Any product that may be evaluated in this article or claim that may be made by its manufacturer is not guaranteed or endorsed by the publisher.
Research integrity at Frontiers

Learn more about the work of our research integrity team to safeguard the quality of each article we publish.