 Jia-Yu Xue
 Yue Wang1
 Shanshan Dong
 Zhu-Qing Shao
94% of researchers rate our articles as excellent or good
Learn more about the work of our research integrity team to safeguard the quality of each article we publish.
Find out more
ORIGINAL RESEARCH article
Front. Plant Sci., 12 June 2020
Sec. Plant Systematics and Evolution
Volume 11 - 2020 | https://doi.org/10.3389/fpls.2020.00805
The sequences and genomic structures of plant mitochondrial (mt) genomes provide unique material for phylogenetic studies. The nature of uniparental inheritance renders an advantage when utilizing mt genomes for determining the parental sources of hybridized taxa. In this study, a concatenated matrix of mt genes was used to infer the phylogenetic relationships of six cultivated Brassica taxa and explore the maternal origins of three allotetraploids. The well-resolved sister relationships between two pairs of diploid and allotetraploid taxa suggest that Brassica carinata (car) possessed a maternal origin from Brassica nigra, while Brassica juncea (jun) was maternally derived from Brassica rapa (cam). Another allotetraploid taxon, Brassica napus (cv. Wester) may have been maternally derived from the common ancestor of B. rapa and Brassica oleracea (ole), and/or have undergone (an) extra hybridization event(s) along its evolutionary history. The characteristics of Brassica mt genomic structures also supported the phylogenetic results. Sinapis arvensis was nested inside the Brassica species, sister to the B. nigra–B. carinata lineage, and possessed an mt genome structure that mostly resembled B. nigra. Collectively, the evidence supported a systematic revision that placed S. arvensis within Brassica. Finally, ancestral mt genomes at each evolutionary node of Brassica were reconstructed, and the detailed and dynamic evolution of Brassica mt genomes was successfully reproduced. The mt genome of B. nigra structurally resembled that of the Brassica ancestor the most, with only one reversion of a block, and the Brassica oleracea underwent the most drastic changes. These findings suggested that repeat-mediated recombinations were largely responsible for the observed structural variations in the evolutionary history of Brassica mt genomes.
Green plants possess three independent genetic systems that are encoded by the genomes in nuclei, chloroplasts, and mitochondrion. Of the three genomes, the nuclear (nu) genome is biparentally inherited between generations, while the chloroplast (cp) and mitochondrial (mt) genomes, referred to as organellar genomes, are uniparentally inherited. Specifically, plant organellar genomes are overwhelmingly maternally inherited, except in some gymnosperm lineages where these genomes are paternally inherited, including Pinaceae, Cupressaceae, and Taxodiaceae (Mogensen, 1996; Jansen and Ruhlman, 2012; Worth et al., 2014). Distinct evolutionary histories between the nu and organellar genomes occasionally lead to incongruent phylogenetic results (Qiu et al., 2006; Jansen et al., 2007; Moore et al., 2007; Qiu et al., 2010; Li et al., 2019; One Thousand Plant Transcriptomes Initiative, 2019) which could identify the underlying hybridization events hidden within evolutionary history (Bastide et al., 2018; Lecaudey et al., 2018). Therefore, uniparental-origin characteristics render a natural advantage in the parental identification of organellar genomes. Compared with cp genomes, plant mt genomes have a more dynamically organized genomic structure in terms of gene content and order, which could be affected by block reversions and translocation events, gene (intron) gains and losses, alien DNA insertions, and pseudogenization, and could be used as alternative evidence for inferring evolutionary histories (Li et al., 2009; Wang et al., 2009; Xue et al., 2010; Liu et al., 2012a, b; Dong et al., 2018a, b). In contrast, the cp genome has a much more conserved structure and cannot be applied for such analyses (Jansen and Ruhlman, 2012).
Brassicaceae is comprised of over 330 genera and 3,800 species that are distributed worldwide (Bailey et al., 2006; Huang et al., 2016). Among the genera, Brassica is the most important genus as it is comprised of many important vegetables and oil crops (e.g., cabbage, broccoli, cauliflower, kale, and rapeseed). These economically important plants almost all belong to six cultivated species, Brassica rapa, Brassica juncea, Brassica nigra, Brassica carinata, Brassica oleracea, and Brassica napus. Based on artificial inter-specific hybridization experiments, a well-known model, U’s triangle, was proposed to demonstrate the genetic relationships among these six species (Figure 1; Nagaharu, 1935). B. rapa (AA, 2n = 2x = 20), B. nigra (BB, 2n = 2x = 16), and B. oleracea (CC, 2n = 2x = 18) are three basic diploid species, and through natural hybridization and genome doubling, three allotetraploid species were derived, including B. juncea (AABB, 2n = 4x = 36), B. carinata (BBCC, 2n = 4x = 34), and B. napus (AACC, 2n = 4x = 38). This hypothesis has been increasingly accepted as the nu genomes of Brassica taxa have been successfully sequenced. Comparative genomic analyses can assign the subgenomes of the allotetraploids, B. juncea and B. napus, with their diploid parental taxa, and the results were in agreement with U’s triangle (Chalhoub et al., 2014; Yang et al., 2016a). Along with the supporting evidence from nu genomic comparisons, the genetic relationships of U’s triangle taxa are becoming a mainstream theory, while much of the evolutionary history among these species remains ambiguous, including the identification of particular paternal and maternal sources of each hybridized taxon and the detailed processes.
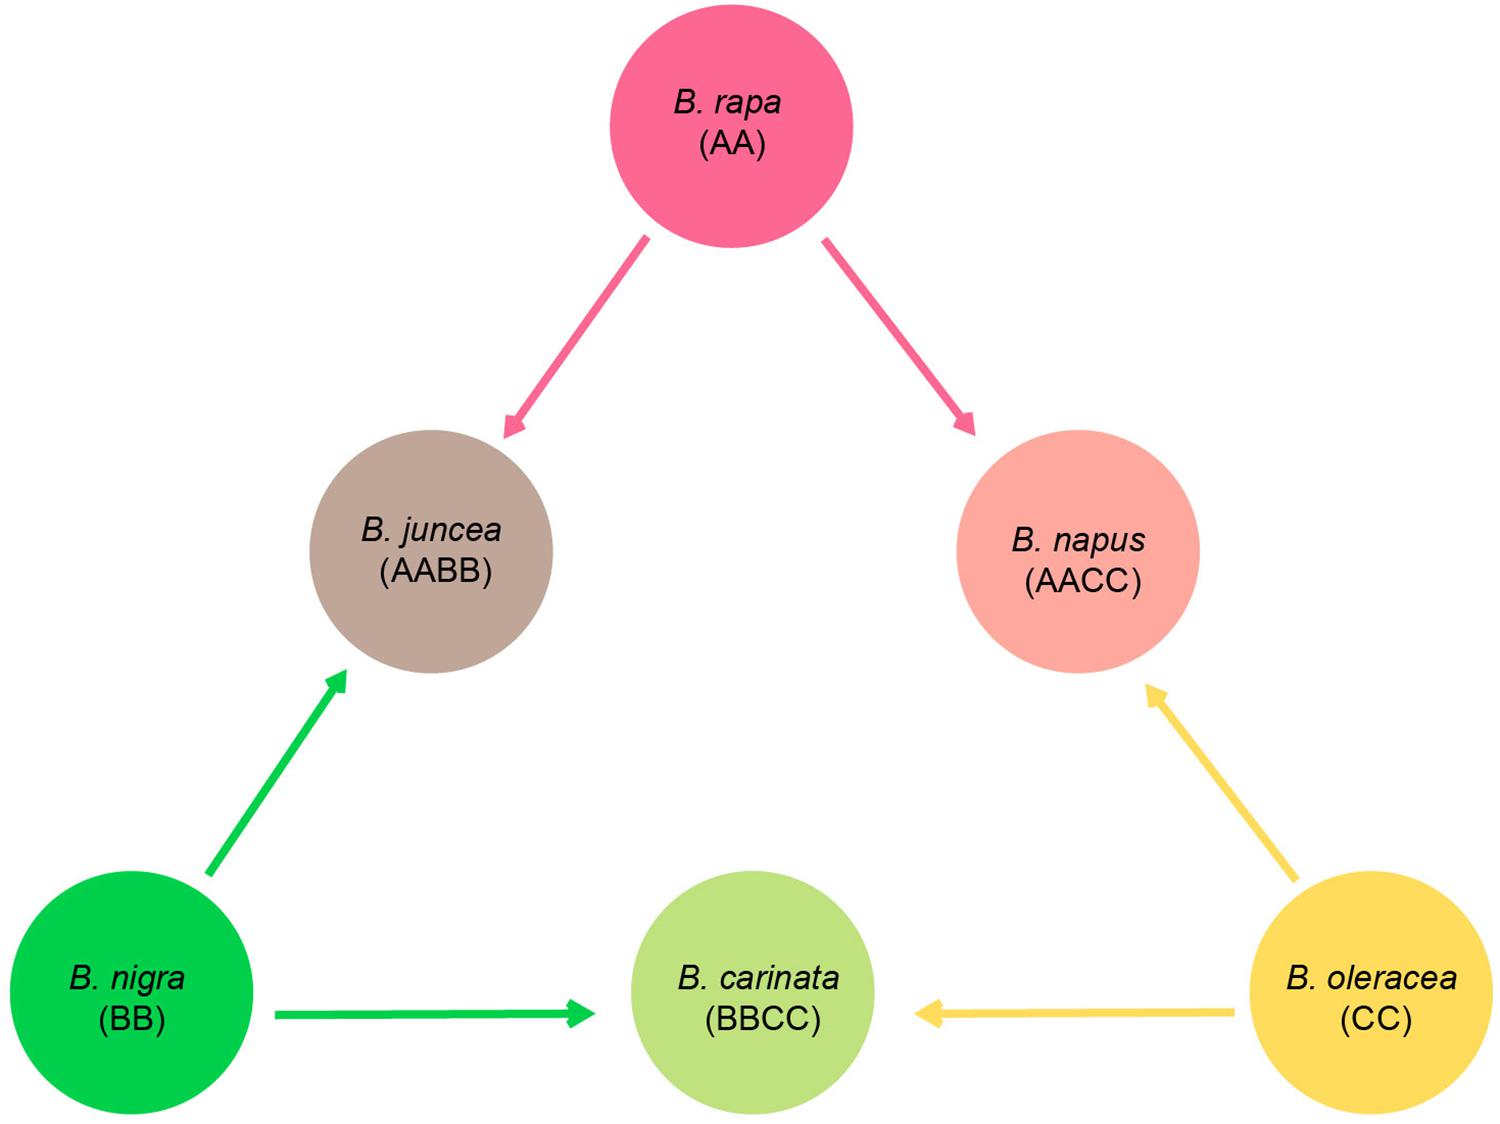
Figure 1. Diagram of U’s triangle showing the genetic relationships among six cultivated Brassica taxa (Nagaharu, 1935).
Organellar genomes have long been used as materials to address evolutionary questions regarding Brassica taxa, especially the three allotetraploid species. Previous studies using cp and mt genomic data overwhelmingly support the hypothesis that the maternal source of B. juncea comes from B. rapa (Li et al., 2017; Kim et al., 2018) but two studies based on a large number of B. juncea varieties, discovered multiple origins of the allotetraploid (Chen et al., 2013) and a few varieties with a maternal origin of B. nigra (Kaur et al., 2014). In fact, B. nigra has been suggested to be the maternal parent of another allotetraploid B. carinata (Yamagishi et al., 2014; Yang et al., 2016b; Li et al., 2017) but it’s not known if there is an undiscovered B. carinata variety with a maternal parent of B. oleracea. A more complicated scenario arises regarding the other allotetraploid, B. napus. In a study based on cp genomes, several Brassica morphotypes were analyzed. The results revealed that B. napus always clustered with B. rapa morphotypes, and thus, it was postulated that the maternal origin of B. napus was B. rapa. However, as B. rapa and B. napus morphotypes did not cluster into a monophyletic group, but were distantly separated by B. juncea and B. oleracea, the independent origins of B. rapa and B. napus were hypothesized, including complicated evolutionary processes involving extra hybridization events with wild taxa and subsequent continued back-crossings under natural conditions (Li et al., 2017). Although such convergent evolution of different morphotypes in East Asia and Europe sounds much too coincidental, multiple hybridization events throughout B. napus evolution were proposed in previous studies (Palmer et al., 1983; Allender and King, 2010). In another study that also adopted cp genomes, all B. napus clustered, being sister to the clade comprising B. rapa, B. juncea, and B. oleracea (Kim et al., 2018). An et al. (2019) collected 183 B. napus accessions, and the cp phylogenomic analysis indicated that some B. napus accessions clustered in the B. rapa clade or B. oleracea clade and vice versa. The results from mt genomes analyses are largely in accordance with that from cp genomes, which suggest that B. napus has two mitotypes, represented by pol and nap (Chen et al., 2013). Among the two mitotypes, pol should be maternally derived from B. rapa, indicated by the phylogeny and the genomic structures (Chang et al., 2011; Heng et al., 2017) but the other mitotype nap is phylogenetically sister to a clade comprising B. rapa, B. juncea, and B. oleracea, implying a more complicated evolutionary history and an unidentified maternal parent (Chang et al., 2011; Yang et al., 2016b).
Despite many efforts devoted to determining the maternal and paternal sources of the three hybridized Brassica species, their evolutionary origins seem to remain unclear. In this study, an mt phylogenomics approach was adopted to reconstruct the phylogeny of six Brassica taxa and determine the maternal parents of the allotetraploids. The results were mutually supported by the mt genomic structural characteristics. Furthermore, a paleogenomic algorithm was developed to reconstruct the ancestral mt genomes. Using this method, a detailed maternal evolutionary history of U’s triangle was presented for these Brassica species.
A concatenated matrix of 30 protein-coding genes from 12 Brassicales mt genomes were assembled and subsequently used for mt phylogenetic reconstruction (Supplementary Table S1). Among the sampled taxa, 10 belonged to Brassicaceae and two belonged to Bataceae and Caricaceae. Other Brassica taxa were used as the outgroups and references for the assessment of the phylogeny of U’s triangle taxa. After removing ambiguous positions, the concatenated nucleotide dataset comprised of 27,612 characters with 1,485 variable sites and 602 parsimony-informative sites.
The concatenated matrix yielded a phylogeny as follows: B. nigra is sister to B. carinata (car) and composed of a monophyletic group with Sinapis arvensis, and this clade is sister to the other comprising four Brassica taxa. Among the four taxa, B. napus (cv. Wester) shows the earliest divergence, successively followed by B. oleracea (ole), B. rapa (cam), and B. juncea (jun) (Figure 2). Since all of the allotetraploids are supposed to cluster with their maternal parents, it is clear that B. juncea has a maternal origin of B. rapa, and the maternal origin of B. carinata is B. nigra. The other allotetraploid, B. napus, was a recovered sister to the clade comprising B. oleracea, B. rapa, and B. juncea. Based on the phylogenetic position of B. napus, its maternal origin should be theoretically derived from the common ancestor of the three taxa, which was likely a wild Brassica species. However, the possibility that the B. napus mt genome has undergone a distinct evolutionary route due to particular selective pressures after the formation of this taxon could not be ruled out or may involve additional hybridization events. Interestingly, S. arvensis was recovered inside the Brassica genus, sister to the B. nigra and B. carinata lineage. A short evolutionary distance among the Brassica taxa can be observed, especially among B. rapa, B. juncea, B. oleracea, and B. napus. These close evolutionary relationships provide genetic possibilities for frequent hybridization events in this genus.
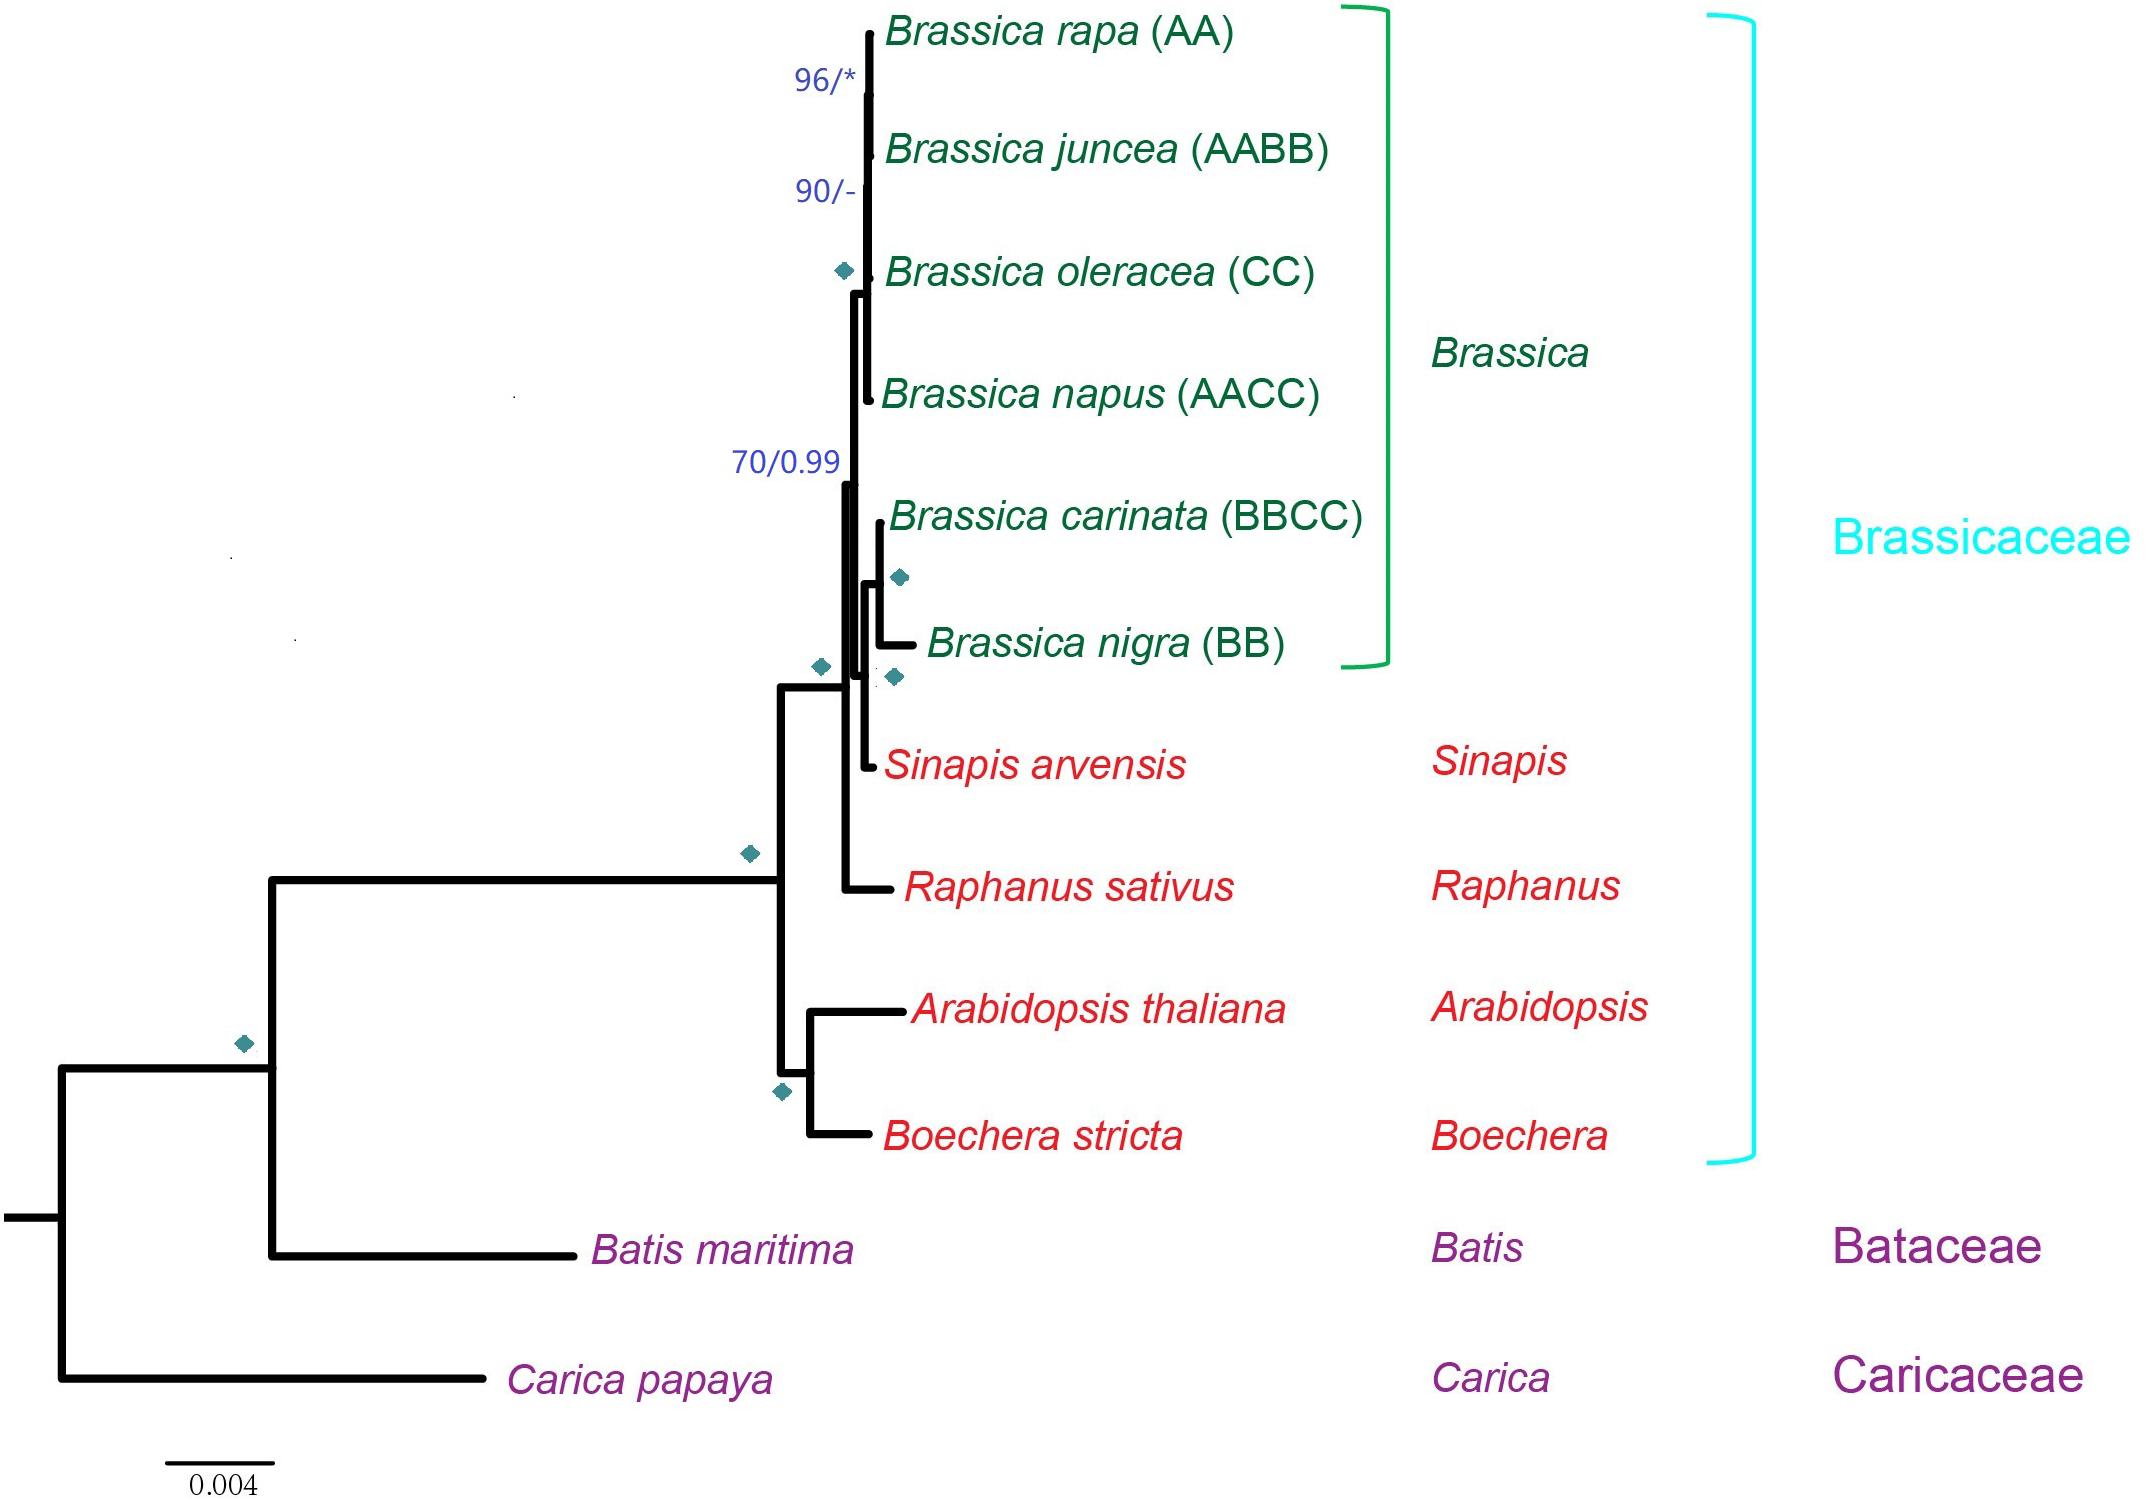
Figure 2. Phylogenetic tree inferred from concatenated nucleotide sequences of all mt protein-coding genes. ML BS support values and Bayesian posterior probabilities are labeled. Diamonds indicate both BS of 100% and PP of 1.00. Asterisks indicate either BS of 100% or PP of 1.00. BS support values <50% or Bayesian posterior probabilities <0.5 are indicated as “–”.
Apart from gene sequences, mt genomic organization is an effective resource for studying the evolutionary relationships among taxa. Since the mt phylogeny did not fully identify the maternal origins of all allotetraploids, the mt genomic structure characteristics were used as alternative evidence. The mt genomic organization of six Brassica taxa and two close relatives (S. arvensis and Raphanus sativus) were analyzed and compared. All of the mt genomes were artificially aligned in linear forms, starting with the rRNA gene rrn5 (Figure 3 and Supplementary Table S2).
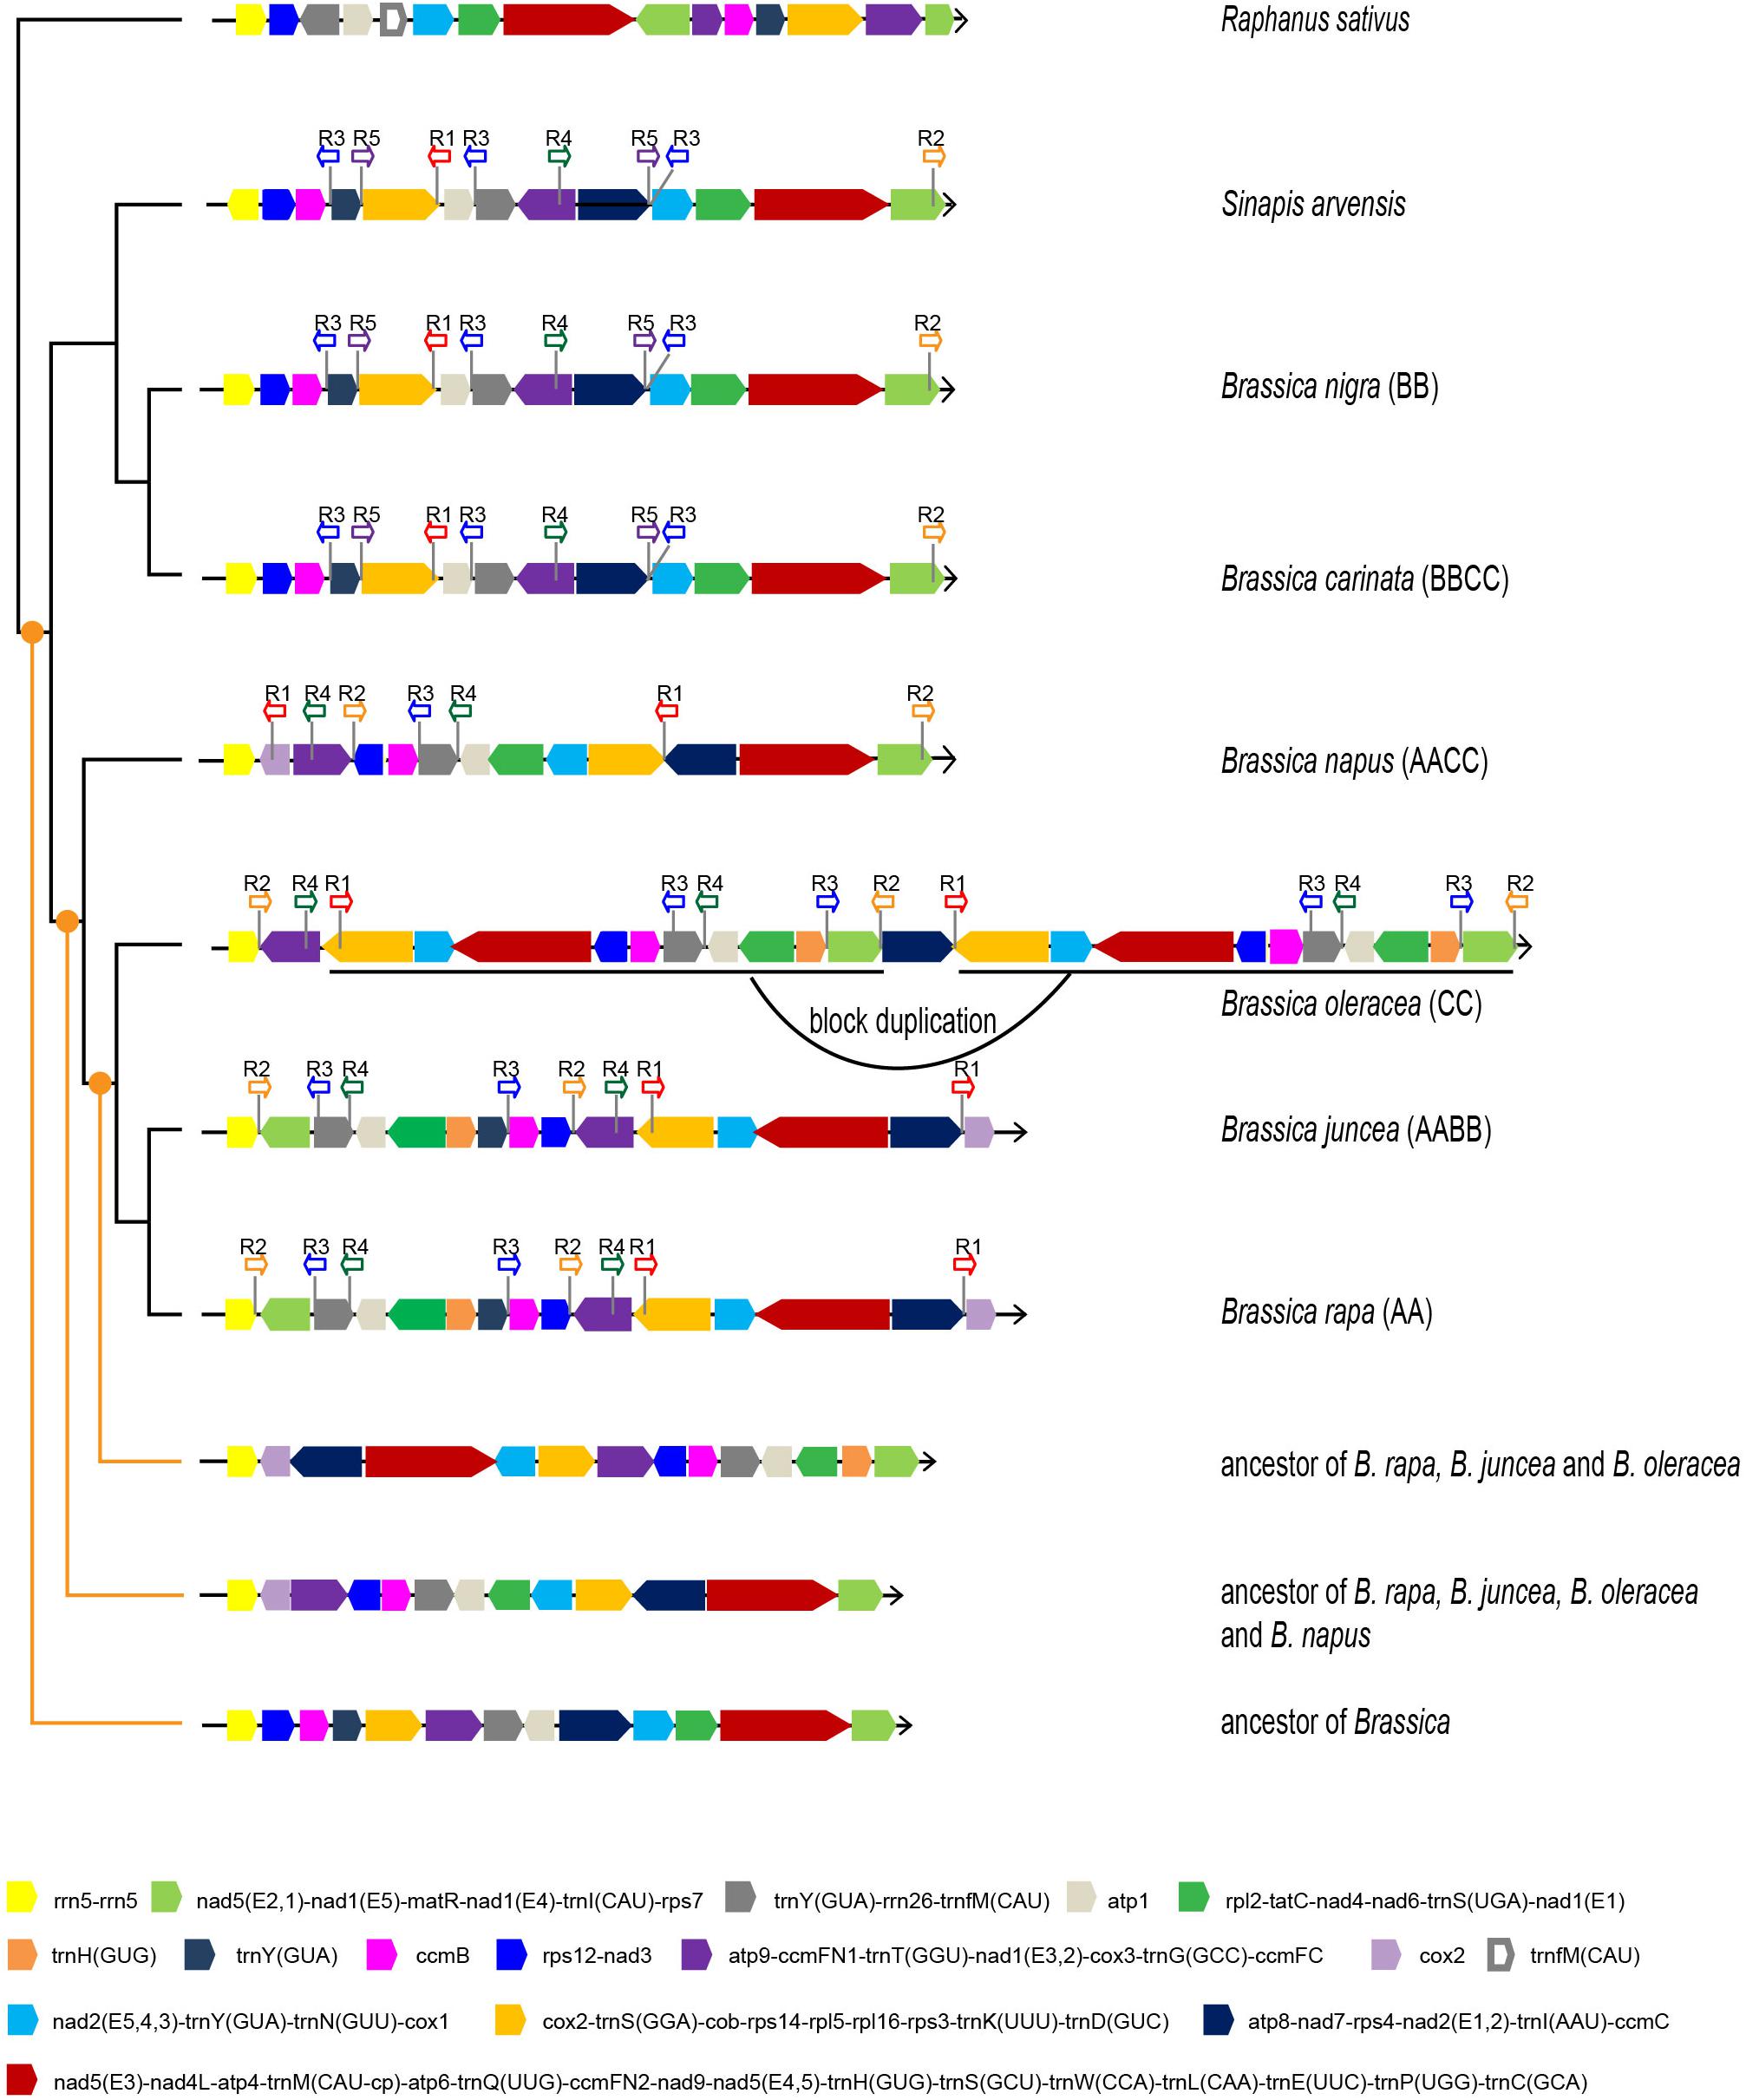
Figure 3. Mt genomic structures of six Brassica taxa, S. arvensis, and R. sativus. Different basic syntenic blocks are presented in different colors. Arrows indicate block directions. The locations and directions of repeat sequences are labeled. The inferred ancestral mt genomic structures are presented at three different evolutionary nodes.
The analysis recognized 15 basic syntenic blocks in the Brassica taxa, among which five contain a single gene, and the rest comprised of at least two genes. Consistent with the phylogenetic results, two pairs of taxa (B. rapa and B. juncea, and B. nigra and B. carinata) exhibit identical mt genomic organizations, indicating the maternal origins of B. juncea and B. carinata. The other taxa showed a structural disagreement with one another. B. oleracea experienced a 114-kb block duplication and it was thus inferred that the duplication is species-specific and should have occurred recently as almost no sequence divergence was observed between the duplicated blocks and the duplication was not shared with other taxa. The synteny of multiple basic blocks was observed between B. napus and other taxa, and the mt genome of B. napus resembled that of B. oleracea and B. rapa more than other taxa. B. napus shared a two two-block synteny with B. rapa (purple-blue and light gray-green) and shared a two two-block (light green-yellow and orange-blue black) and one four-block (blue-pink-gray-light gray) synteny with B. oleracea; these three taxa shared one two-block synteny (light blue-orange). Therefore, the result of mt genomic structure analysis agrees with the inference from the phylogenomic analyses that B. napus is likely to be maternally derived from the common ancestor of B. oleracea and B. rapa. Unless more new wild Brassica mt genomes are sequenced, these inferences remain to be verified.
Sinapis arvensis, the suspected systematically false-classified taxon, exhibited the exact same mt genomic structure as B. nigra and B. carinata, except the direction of one basic block (yellow) (Figure 3). Clearly, the results based on mt genomic organization agreed with the phylogenetic results based on gene sequences, which strengthen the reliability of the phylogenetic results.
With the well-resolved phylogeny and a newly developed algorithm, the mt genome structures of Brassica ancestors were inferred and used to reconstruct a detailed evolutionary process of Brassica mt genomes.
Firstly, the ancestral mt genomes at three different evolutionary nodes were reconstructed in this study (Figure 3). The common ancestor of all Brassica was inferred to have an mt genome resembling the early diverging B. nigra lineage. Although 15 basic blocks were identified in Brassica, the ancestor had only 13, and the other two were acquired later during evolution. From the parsimonious perspective, since the divergence with the common ancestor of Brassica, B. nigra has experienced only one reversion (dark gray-gray-purple), which could bring it absolutely collinear with the Brassica ancestor (Figure 4A). Differing from the B. nigra lineage, the other taxa seemed to experience more drastic genomic rearrangements. The common ancestor of B. napus, B. oleracea, B. rapa, and B. juncea underwent eight changes, including six reversions and two gene gains [cox1 and trnY(GUA)] by duplication after splitting from the B. nigra lineage. Afterward, since the rise of B. napus, its mt genome has remained conservative and stayed collinear with its ancestor, except losing a copy of the duplicated gene trnY(GUA), while the other three taxa continued their genomic arrangements. B. oleracea underwent five reversions, two gene gains, and one gene loss before divergence from the B. rapa lineage; and afterward, three reversions, two gene losses, and one duplication of the 114 kb block formed its current structure (a total of 22 changes since the divergence with the Brassica ancestor). Finally, the B. rapa lineage experienced two recent reversions and a total of 18 changes. With this algorithm, the structural evolution of all of the Brassica mt genomes was successfully inferred. Collectively, the six taxa have undergone 26 genomic changes, since the divergence of their last common ancestor. Additionally, the steps needed to bring any two mt genomes to be collinear with one another were also calculated (Figure 4B). For example, 11 steps were needed to make B. rapa and B. napus completely collinear, but 23 steps were needed to make B. oleracea and B. nigra collinear.
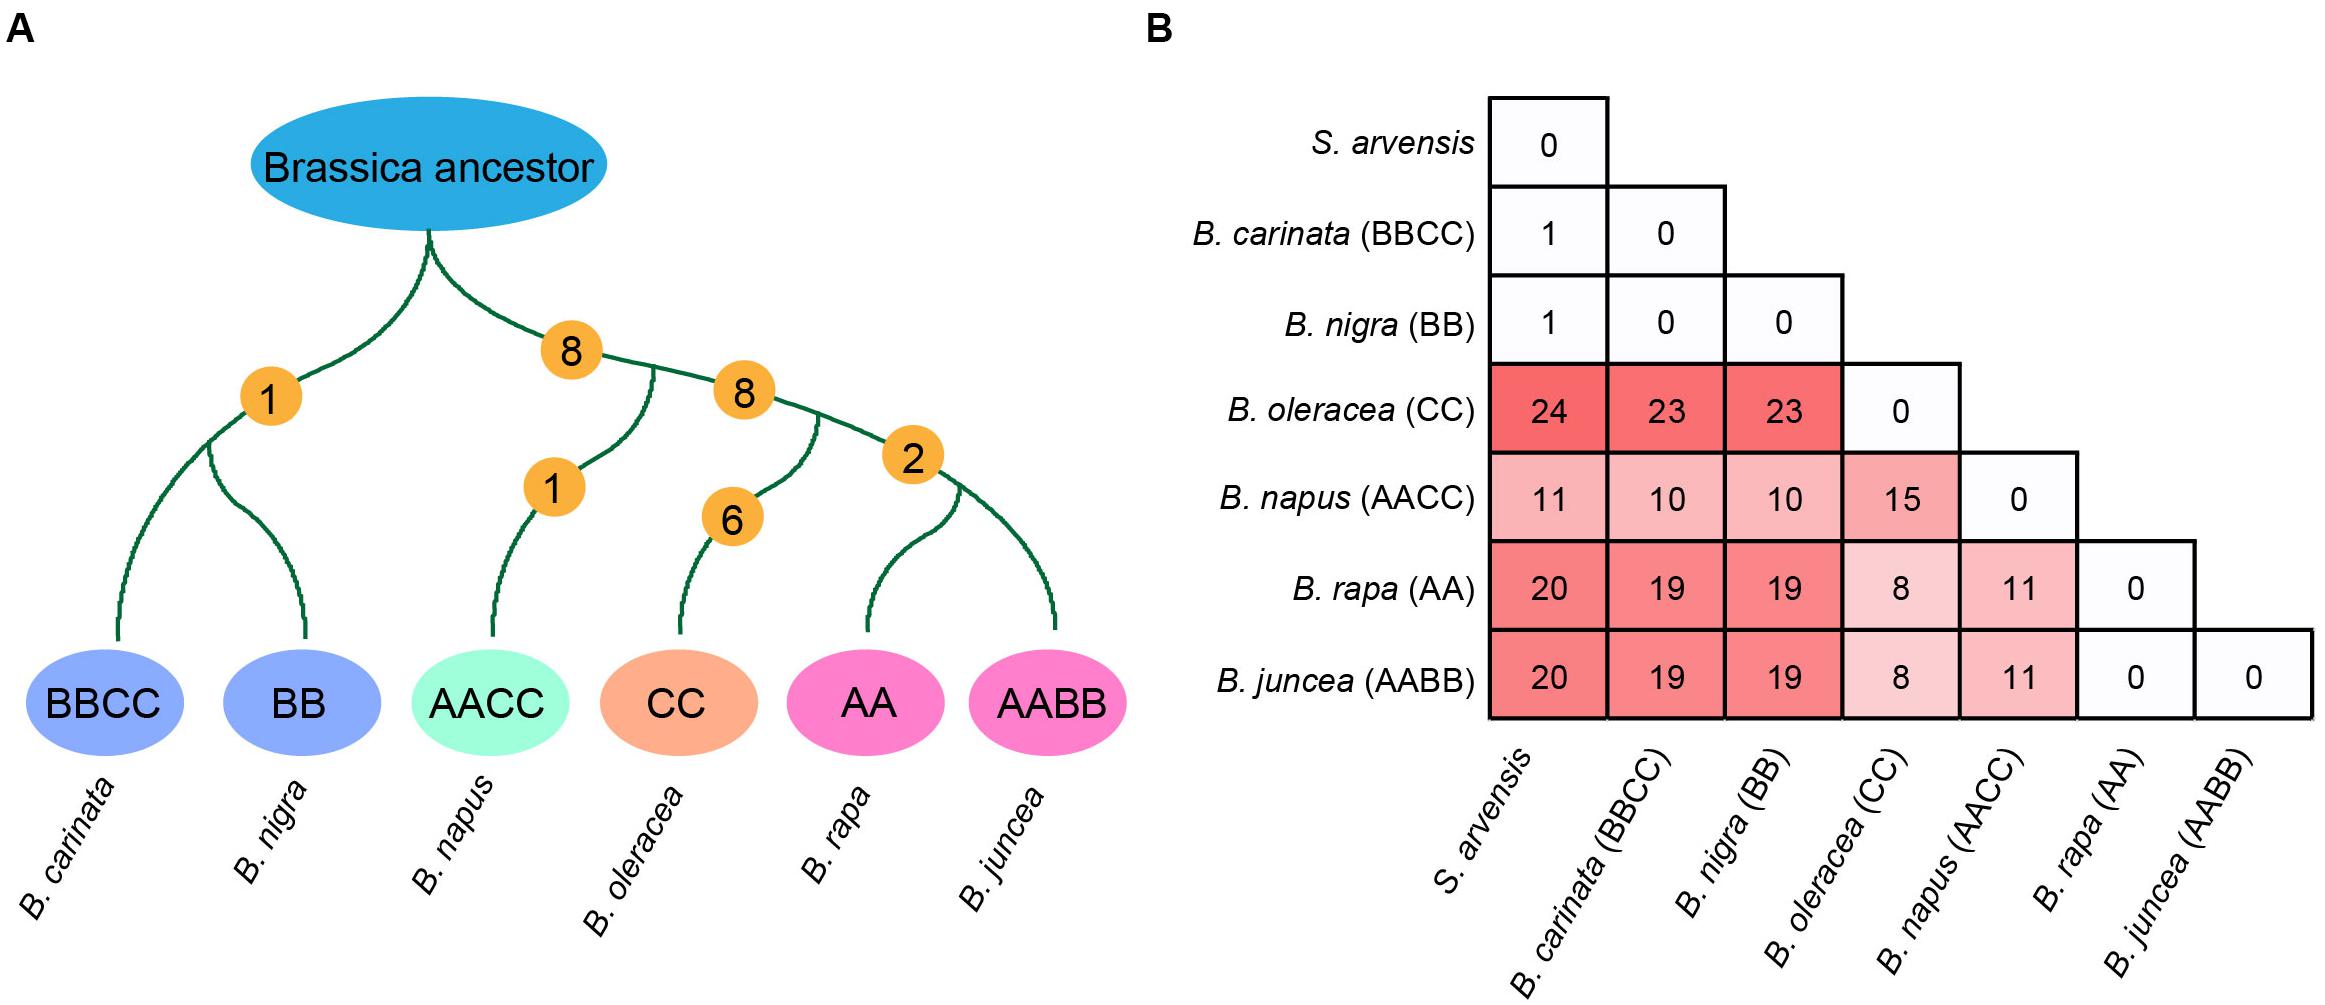
Figure 4. (A) Steps of structural changes from the Brassica common ancestor to each extant Brassica taxa. (B) Number of structural changes between all Brassica taxa and S. arvensis.
Repeat regions are considered to be closely associated with mt genomic rearrangements, causing reversions and translocations. Therefore, in order to test the reliability of inferred structural variations, repeat sequences (no shorter than 50 bp) in each of these Brassica mt genomes were searched (Supplementary Table S3). Then, comparative analyses were performed to determine the homologous relationships among different taxa and identify their locations in the mt genomes associated with specific blocks. These repeats were mainly identified within inter-genic spaces, of which, some contain partial gene sequences.
The search identified five different repeat regions (sequence length ≥200 bp in at least one taxon) and was shared by at least three taxa (Figure 3). Among the identified repeats, sequence lengths and copy numbers varied among different taxa. Through a BLAST search, their homology was easily recognized. For example, the repeat R3 in B. rapa has a length of 228 bp, but in B. nigra and B. oleracea, the lengths are 232 and 257 bp, respectively. B. oleracea and the B. nigra lineages have three copies of R3s, while the B. rapa lineage has only two copies and B. napus lineage has only one copy. Coincidently, these repeats are all located at the boundaries of previously recognized basic blocks, suggesting a close association with the repeat and rearrangement events.
Both mt gene sequences and structures are considered to be good materials for evolutionary studies, especially in phylogenetic and comparative genomics studies (Qiu et al., 2006, 2010; Xue et al., 2010; Liu et al., 2012a, b). The uniparental inheritance nature of the mt genome renders an extra function for distinguishing parental origins of hybridized taxa, recognizing the donor of mt. Although the sequence of cp genomes theoretically plays an equal important role, additional evidence from mt genomic structures could be used to verify such results or provide an alternative hypothesis.
In this study, the results derived from Brassica mt genomes largely agree with those of previous studies based on cp or mt genomes (Palmer et al., 1983; Allender and King, 2010; Yang et al., 2016b; Li et al., 2017; Kim et al., 2018) from which the maternal origins of two allotetraploids, B. juncea (jun) and B. carinata (car), were determined. Nevertheless, with regard to the maternal origin of B. napus (cv. Wester), some ambiguity remains. The phylogenetic analysis of this study placed B. napus as a sister to the clade comprising B. rapa (cam), B. juncea, and B. oleracea (ole). These evolutionary relationships are in accordance with our analysis toward mt genomic structural characteristics as B. napus exhibited structural features shared by both B. rapa and B. oleracea (Figure 3). Thus, subsequent hybridization events in B. napus appear to have occurred rather than species-specific variations without hybridization. As mt sequence variations and genomic structural variations underwent parallel routes of evolution, the convergent results are easily explained by another single mt donor, which appears likely to be the ancestor of B. rapa, B. juncea, and B. oleracea. However, whether one or multiple hybridization events occurred during the evolutionary history of Brassica could not be inferred as only one morphotype of B. napus was analyzed in this study. In future studies, more morphotypes should be analyzed to confirm these findings.
Brassica nigra and B. carinata are resolved as an early diverging lineage in Brassica, which are distantly related to other Brassica taxa, thereby explaining their lack of applicability in the artificial hybridization of new taxa with higher economic values. S. arvensis belongs to another genus Sinapis genus, but is phylogenetically recovered within Brassica, sister to the B. nigra lineage. Such a close relationship between Sinapis and B. nigra is not rarely seen in other studies. Other than our result, two studies using cp markers also recovered similar relationships (Warwick and Black, 1991; Arias and Pires, 2012). Interestingly, the mt genome structure of S. arvensis is almost absolutely collinear to that of the B. nigra lineage (Sang et al., 2020) except one block reversion and matches its position in the phylogenetic tree. The reason for the close relationship of S. arvensis and B. nigra, as we infer, can be explained by two hypotheses: one is that S. arvensis is truly an evolutionary close branch to B. nigra; the other may involve a hybridization event of S. arvensis, with B. nigra being the maternal parent. However, the nuclear chromosome number of S. arvensis (2n = 18) indicates that it is a diploid species that did not undergo hybridization events in its evolutionary history (Arumuganathan and Earle, 1991). Morphologically, S. arvensis resembles Brassica taxa in many characteristics, including simple and lyrate-pinnatifid leaves, yellow petals, oblong to linear heteroarthrocarpous siliques, and uniseriate seeds. The one obvious difference separating the Brassica and Sinapis genera is that the Brassica taxa have a prominent midvein, while Sinapis possess 3–5 veins. Additionally, there is a large overlap between the geographic distributions of these two species (Scholz, 1919; Cheo et al., 2001). Therefore, the phylogenetic results suggest that S. arvensis be placed within the Brassica genus; its mt genomic organization and morphological characteristics with B. nigra strongly support this new systematic classification. Because S. arvensis is not the outermost lineage in the phylogenetic tree, but is nested within a clade comprising B. nigra and B. carinata, the results suggest that Sinapis should be merged with Brassica. Yet, the taxonomic reassessment regarding the position of Sinapis requires additional data from nuclear genomes and more Sinapis species. Actually apart from Sinapis, species from other genera are also commonly placed into Brassica through phylogenetic reconstructions, like the radish (Raphanus sativus) by both cp and nuclear data (Palmer et al., 1983; Huang et al., 2016; Kim et al., 2018). But in mechanism the radish might be different from Sinapis, because our mt phylogenomic result does not support placing the radish inside Brassica, and the morphological differences between the radish and Brassica species are quite distinguishable. Therefore, cytoplasmic cp DNA transfer between species via introgression sounds more likely for radishes. To sum up, the non-monophyly of Brassica may attribute to the false systematic classification and high potential of hybridization among Brassicaceae taxa.
Evolution refers to a dynamic process spanning a specific period of time. Focusing on the comparison of extant taxa only obverse current similarities and differences, specific evolutionary events can be investigated and our understanding of the mechanisms that gave rise to their current status can be enhanced. This study introduces the concept of mt paleogenomics, which utilizes putative ancestral mt genomes in evolutionary studies. The gene-based reconstruction approach recognizes basic syntenic blocks shared by all surveyed taxa, and these blocks are subsequently used as elements for ancestral structure reconstruction. The ancestral mt genomes are determined by the collinearity of basic blocks between the phylogenetic in-group taxa and outgroup, or earliest-diverging taxa. Moreover, this strategy requires a well-resolved phylogeny. With this ancestral reconstruction approach, ancestral mt genomes of progenitors at multiple evolution nodes were inferred in this study.
The paleogenomics strategy has been applied to the reconstruction of ancestral nu genomes in several plant lineages (Murat et al., 2015, 2017). However, detailed evolutionary processes could not be correspondingly reproduced as nu genomes are too large, and their evolution involves many complicated events. mt genomes are much simpler than nu genomes, but more complicated than cp genomes due to a diversity of structural variations resulting from block reversions, translocations, trans-spliced introns, gene (intron) losses and gains, horizontal gene transfers, and alien DNA insertions. The moderate complexity of the mt genome renders its practicability for further investigating detailed events over evolutionary history and uncovering the associated underlying mechanisms.
It should be noted that successful paleogenomic reconstruction requires the adequate sampling of taxa with sequenced genomes, including properly selected outgroups and offspring lineages. A shortage of taxon-sampling may lead to a failed reconstruction of, if not all, a part of ancestral genomic regions. Fortunately, with the rapid development of sequencing technology, there will be more applications of this strategy in the future.
Among the factors influencing mt genome organization, reversions by repeat sequences play a dominant role in the diversity of plant lineages from early land plants bryophytes and lycophytes to relatively late-diverging gymnosperms and angiosperms. Of the 26 inferred structural variations in Brassica mt genomes, the majority (17) belonged to repeat-mediated reversions, almost two times as the total number of other events (9), which included four gene gains, four gene losses, and one block duplication.
In theory, inverted repeats could lead to a reversion of a genomic region located in between (Xue et al., 2010; Liu et al., 2012a). Thus, multiple groups of repeats scattered over mt genomes could give rise to complicated rearrangements and result in completely different genomic structures (Figure 5). Five groups of repeats with lengths ≥200 bp were recognized and shared by all of the Brassica mt genomes, and their locations were identified at the boundaries of basic blocks, suggesting a close association with a diversity of rearrangement events. Specifically, each Brassica taxa had a minimum of 23 pairs of repeats (length ≥50 bp, Supplementary Table S3) in their mt genomes, all of which were potential materials for triggering recombination, implying that more genomic changes had occurred in their evolutionary histories or could occur in the future. The repeat-mediated reversion is an early rising mechanism in plant mt genomes, dating back to ∼4.8 million years ago, the origin of land plants (Wang et al., 2009; Xue et al., 2010; Liu et al., 2011). In early land plants, such as mosses, reversions have remained relatively silent, but since the emergence of vascular plants, mt genomes have been more and more active with reversions (Li et al., 2009; Liu et al., 2011, 2012a). Thus, in this study, it is hypothesized that with the expansion of plant mt genomes, more repeats are generated, causing an increase in genomic plasticity. A particular example verifies this notion. Specifically, the mt genomes of mosses lack repeat sequences and have completely identical structures among different taxa, indicating extreme conservation and stability within this lineage (Liu et al., 2011, 2014).
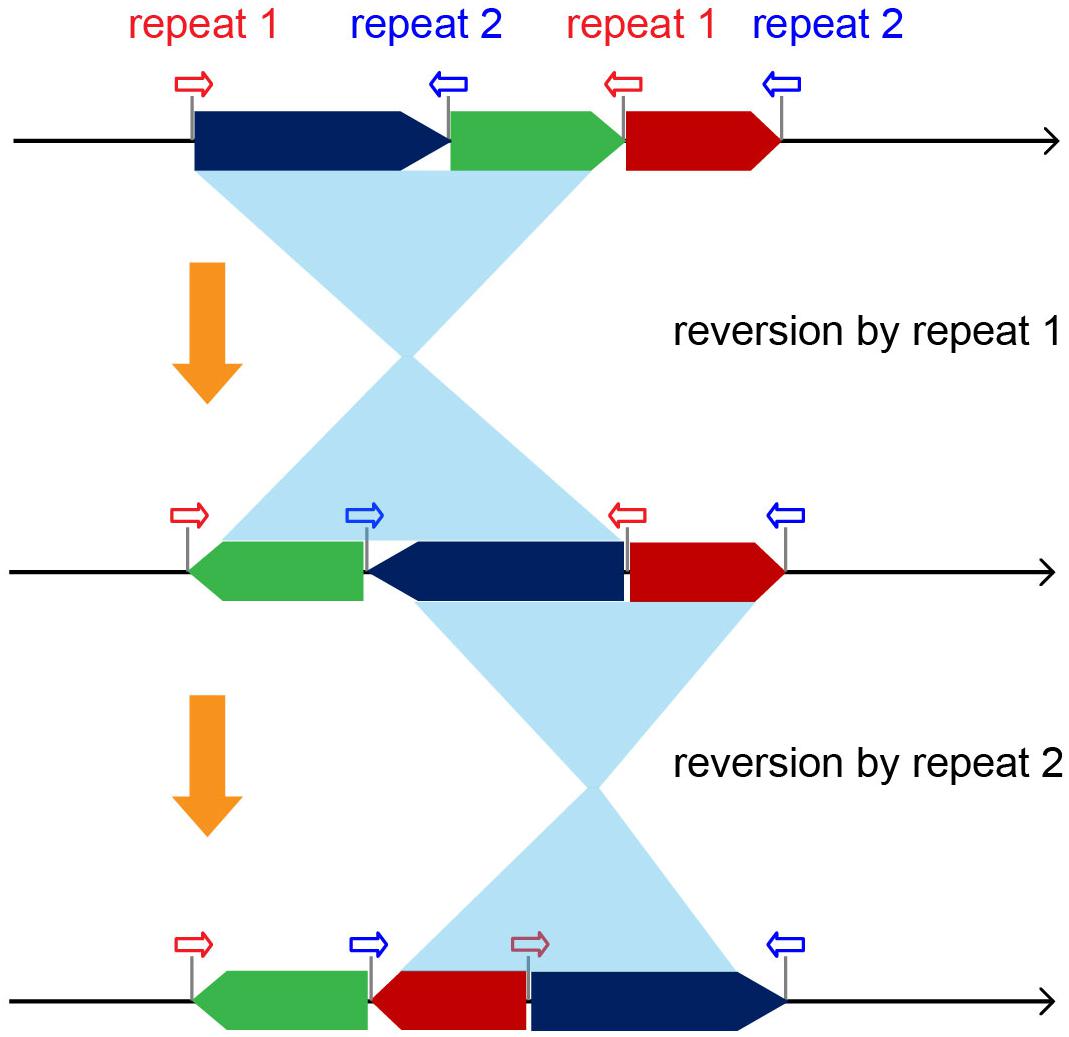
Figure 5. Diagram demonstrating the complicated mt genomic rearrangements caused by the repeat-driving reversions.
Angiosperms possess diverse mt genomic structures that were largely driven by repeat sequences. However, different repeats originated at different evolutionary nodes. For example, the Brassica R1 repeat is widely found in a number of rosids, one asterid taxon, and in the basal angiosperm Amborella. This repeat likely has an early angiosperm origin, but has been independently lost in some lineages, such as monocots and most asterids. The R2 repeat likely has a eudicot origin with homologs found in a wide range of eudicot lineages, but none in other angiosperm lineages. Additionally, some repeats are species-specific or limited to only a few close-related taxa, such as the 114 kb repeats in B. oleracea and 6.5 kb repeats in B. nigra and B. carinata. Therefore, these repeats are believed to have been recently derived. With such diverse repeat sequences, it is clear that repeat-mediated reversions have become a major force that has shaped plant mt genomes over time.
The 12 available mt genomes of Brassicales taxa were downloaded from the National Center for Biotechnology Information (NCBI) database. Voucher information and GenBank accession numbers of the analyzed samples are provided in Supplementary Table S1. These mt genomes were initially annotated by different research groups with different methods and styles of nomenclature, and these annotations were revised and the nomenclature was unified to facilitate next-stage data processing and analyses. Pseudogenes refer to genes that have lost functions and can be distinguished as follows: (1) the loss of a fragment of coding sequence; and (2) insertions, deletions, and mutations of nucleotides breaking the open reading frames. First, OGDRAW was used for automated annotation (Greiner et al., 2019). Then, the results of the two versions were compared. The discrepancy between the two annotated versions was manually examined to determine the final version.
Mt protein-coding genes were individually aligned using MAFFT to build amino acid alignments (Katoh et al., 2005). In all cases, poorly aligned regions were trimmed using GBLOCKS with the least stringent settings (Talavera and Castresana, 2007); nucleotide alignments were produced based on corresponding amino acid alignments after the removal of ambiguous positions. The above processes were automatically conducted using TranslatorX (Abascal et al., 2010). After removing stop codons, the 30 single-gene nucleotide alignments were concatenated into final alignments and converted into appropriate formats using Geneious v6.0.3 (Biomatters, New Zealand).
Collectively, 30 mt protein-coding genes shared by the six Brassica species were used for the phylogenetic analyses; pseudo and missing genes were treated as gaps in the analyses. The concatenated nucleotide dataset was analyzed by the maximum-likelihood (ML) method and Bayesian inference (BI). ML analyses were performed using the parallel version of RAxML v7.2.3 (Stamatakis, 2006). Bayesian analyses were inferred by Mr. Bayes using the GTR+G model with two runs of four chains (Ronquist et al., 2012). Posterior probabilities (PPs) of clade support were estimated by sampling trees from the posterior distribution after removal of the burn-in samples. Nonparametric bootstrap (BS) analyses were implemented by GTR+CAT approximation of 100 pseudoreplicates. PartitionFinder was used for selecting optimal data partition schemes and associated substitution models (Lanfear et al., 2012). Using prior gene regions and codon positions, seven partitions were selected as the best scheme for nucleotide data. Moreover, using prior gene regions, four partitions were selected as the best partitioning scheme. The optimal partitioning scheme was then used in subsequent phylogenetic analyses. Carica papaya was used as the outgroup.
The order of mt genes (exons separated by other genes due to trans-spliced introns were considered independent genes) of each taxon was extracted from the corresponding mt genome annotations. The rRNA gene rrn5 was selected as the starting point, and all of the genes were aligned accordingly. Gene directions were also considered. The gene-based paleogenomics approach first identified syntenic blocks shared by all surveyed taxa, and these blocks were used as basic units for subsequent ancestral structure reconstruction. This strategy required a well-resolved phylogeny prior to subsequent analyses.
Based on a recovered phylogeny, the determination of ancestral mt genomic structures followed specific algorithms. For the lineage derived from a common ancestor, the collinearity of basic blocks between any interior taxon of the lineage and the outgroup (Supplementary Figure S1, case 1), as well as the collinearity of basic blocks between one taxa in the earliest-diverging branch and others in later-diverging (interior) branches (Supplementary Figure S1, case 2), was considered the ancestral genomic structure. With this ancestor reconstruction approach, the ancestral mt genomes of progenitors were inferred at multiple evolution nodes.
All of the repeat regions (≥50 bp) and their relative directions were searched for in each mt genome using the REPuter software (Kurtz et al., 2001). Homology of the repeats was determined following a basic local alignment search tool (BLAST) search of the non-redundant (Nr) NCBI database (Altschul et al., 1990).
Publicly available datasets were analyzed in this study. The data can be found here: NC_012116, NC_024429, NC_037304, NC_008285, NC_016120, NC_016123, NC_016118, NC_016125, NC_031896, NC_029182, and NC_018551.
J-YX and YL designed the study. J-YX, YW, MC, YL, SD, and Z-QS analyzed the data. J-YX wrote the manuscript. Z-QS, YW, MC, and YL participated in the revision of the manuscript. All authors read and approved the final manuscript.
This work was supported by grants from the Jiangsu Key Laboratory for the Research and Utilization of Plant Resources (Institute of Botany, Jiangsu Province and Chinese Academy of Sciences, KSPKLB201835 to J-YX) and the National Natural Science Foundation of China (31470314 to YL).
The authors declare that the research was conducted in the absence of any commercial or financial relationships that could be construed as a potential conflict of interest.
The authors thank Xiwu Qi for his assistance in extracting protein-coding sequences and gene order information by PERL scripts. The authors also thank LetPub (www.letpub.com) for its linguistic assistance during the preparation of this manuscript.
The Supplementary Material for this article can be found online at: https://www.frontiersin.org/articles/10.3389/fpls.2020.00805/full#supplementary-material
FIGURE S1 | Algorithm of ancestral structure determination.
TABLE S1 | List of 12 Brassicales taxa with the mitochondrial genomes used in this study.
TABLE S2 | Gene composition and order of 12 Brassicales mt genomes. Genes in red are miss-annotated in previous annotation. “+” and “−” indicate the position of genes in the standard chain and complimentary chain, respectively.
TABLE S3 | List of repeats detected in the mitochondrial genomes of six Brassica taxa and S. arvensis. “F” indicates relatively forward direction between repeats; “I” indicates relatively inverted direction between repeats. The starting positions of repeats are recorded in the columns of copy number.
Abascal, F., Zardoya, R., and Telford, M. J. (2010). TranslatorX: multiple alignment of nucleotide sequences guided by amino acid translations. Nucleic Acids Res. 38, W7–W13. doi: 10.1093/nar/gkq291
Allender, C. J., and King, G. J. (2010). Origins of the amphiploid species Brassica napus L. investigated by chloroplast and nuclear molecular markers. BMC Plant Biol. 10:54. doi: 10.1186/1471-2229-10-54
Altschul, S. F., Gish, W., Miller, W., Myers, E. W., and Lipman, D. J. (1990). Basic local alignment search tool. J. Mol. Biol. 215, 403–410. doi: 10.1016/S0022-2836(05)80360-2
An, H., Qi, X., Gaynor, M. L., Hao, Y., Gebken, S. C., Mabry, M. E., et al. (2019). Transcriptome and organellar sequencing highlights the complex origin and diversification of allotetraploid Brassica napus. Nat. Commun. 10:2878. doi: 10.1038/s41467-019-10757-1
Arias, T., and Pires, J. C. (2012). A fully resolved chloroplast phylogeny of the brassica crops and wild relatives (Brassicaceae: Brassiceae): novel clades and potential taxonomic implications. Taxon 61, 980–988. doi: 10.1002/tax.615005
Arumuganathan, K., and Earle, E. D. (1991). Nuclear dna content of some important species. Plant Mol. Biol. Rep. 9, 208–218. doi: 10.1007/bf02672069
Bailey, C. D., Koch, M. A., Mayer, M., Mummenhoff, K., O’Kane, S. L., Warwick, S. I., et al. (2006). Toward a global phylogeny of the Brassicaceae. Mol. Biol. Evol. 23, 2142–2160. doi: 10.1093/molbev/msl087
Bastide, P., Solis-Lemus, C., Kriebel, R., William Sparks, K., and Ane, C. (2018). Phylogenetic comparative methods on phylogenetic networks with reticulations. Syst. Biol. 67, 800–820. doi: 10.1093/sysbio/syy033
Chalhoub, B., Denoeud, F., Liu, S., Parkin, I. A., Tang, H., Wang, X., et al. (2014). Plant genetics. early allopolyploid evolution in the post-neolithic Brassica napus oilseed genome. Science 345, 950–953. doi: 10.1126/science.1253435
Chang, S., Yang, T., Du, T., Huang, Y., Chen, J., Yan, J., et al. (2011). Mitochondrial genome sequencing helps show the evolutionary mechanism of mitochondrial genome formation in Brassica. BMC Genomics 12:497. doi: 10.1186/1471-2164-12-497
Chen, S., Wan, Z., Nelson, M. N., Chauhan, J. S., Redden, R., Burton, W. A., et al. (2013). Evidence from genome-wide simple sequence repeat markers for a polyphyletic origin and secondary centers of genetic diversity of Brassica juncea in China and India. J. Hered. 104, 416–427. doi: 10.1093/jhered/est015
Cheo, T. L., Lu, L., Yang, G., Al-Shehbaz, I., and Dorofeev, V. (2001). “Brassicaceae,” in Flora of China, eds Z. Y. Wu and P. H. Raven (Beijin: Science Press), 1–193.
Dong, S., Xue, J. Y., Zhang, S., Zhang, L., Wu, H., Chen, Z., et al. (2018a). Complete mitochondrial genome sequence of Anthoceros angustus: conservative evolution of the mitogenomes in hornworts. Bryol. 121, 014–022.
Dong, S., Zhao, C., Chen, F., Liu, Y., Zhang, S., Wu, H., et al. (2018b). The complete mitochondrial genome of the early flowering plant Nymphaea colorata is highly repetitive with low recombination. BMC Genomics 19:614. doi: 10.1186/s12864-018-4991-4
Greiner, S., Lehwark, P., and Bock, R. (2019). OrganellarGenomeDRAW (OGDRAW) version 1.3.1: expanded toolkit for the graphical visualization of organellar genomes. Nucleic Acids Res. 47, W59–W64. doi: 10.1093/nar/gkz238
Heng, S., Chen, F., Wei, C., Hu, K., Yang, Z., Wen, J., et al. (2017). Identification of different cytoplasms based on newly developed mitotype-specific markers for marker-assisted selection breeding in Brassica napus L. Plant Cell Rep. 36, 901–909. doi: 10.1007/s00299-017-2121-4
Huang, C. H., Sun, R., Hu, Y., Zeng, L., Zhang, N., Cai, L., et al. (2016). Resolution of Brassicaceae phylogeny using nuclear genes uncovers nested radiations and supports convergent morphological evolution. Mol. Biol. Evol. 33, 394–412. doi: 10.1093/molbev/msv226
Jansen, R. K., Cai, Z., Raubeson, L. A., Daniell, H., Depamphilis, C. W., Leebens-Mack, J., et al. (2007). Analysis of 81 genes from 64 plastid genomes resolves relationships in angiosperms and identifies genome-scale evolutionary patterns. Proc. Natl. Acad. Sci. U.S.A. 104, 19369–19374. doi: 10.1073/pnas.0709121104
Jansen, R. K., and Ruhlman, T. A. (2012). “Plastid genomes of seed plants,” in Genomics of Chloroplasts and Mitochondria, eds R. Bock and V. Knoop (Netherlands: Springer), 103–126. doi: 10.1007/978-94-007-2920-9_5
Katoh, K., Kuma, K., Toh, H., and Miyata, T. (2005). MAFFT version 5: improvement in accuracy of multiple sequence alignment. Nucleic Acids Res. 33, 511–518. doi: 10.1093/nar/gki198
Kaur, P., Banga, S., Kumar, N., Gupta, S., Akhatar, J., and Banga, S. S. (2014). Polyphyletic origin of Brassica juncea with B. rapa and B. nigra (Brassicaceae) participating as cytoplasm donor parents in independent hybridization events. Am. J. Bot. 101, 1157–1166. doi: 10.3732/ajb.1400232
Kim, C. K., Seol, Y. J., Perumal, S., Lee, J., Waminal, N. E., Jayakodi, M., et al. (2018). Re-exploration of U’s triangle brassica species based on chloroplast genomes and 45S nrDNA sequences. Sci. Rep. 8:7353. doi: 10.1038/s41598-018-25585-4
Kurtz, S., Choudhuri, J. V., Ohlebusch, E., Schleiermacher, C., Stoye, J., and Giegerich, R. (2001). REPuter: the manifold applications of repeat analysis on a genomic scale. Nucleic Acids Res. 29, 4633–4642. doi: 10.1093/nar/29.22.4633
Lanfear, R., Calcott, B., Ho, S. Y. W., and Guindon, S. (2012). PartitionFinder: combined selection of partitioning schemes and substitution models for phylogenetic analyses. Mol. Biol. Evol. 29, 1695–1701. doi: 10.1093/molbev/mss020
Lecaudey, L. A., Schliewen, U. K., Osinov, A. G., Taylor, E. B., Bernatchez, L., and Weiss, S. J. (2018). Inferring phylogenetic structure, hybridization and divergence times within Salmoninae (Teleostei: Salmonidae) using RAD-sequencing. Mol. Phylogenet. Evol. 124, 82–99. doi: 10.1016/j.ympev.2018.02.022
Li, H. T., Yi, T. S., Gao, L. M., Ma, P. F., Zhang, T., Yang, J. B., et al. (2019). Origin of angiosperms and the puzzle of the Jurassic gap. Nat. Plants 5, 461–470. doi: 10.1038/s41477-019-0421-0
Li, L., Wang, B., Liu, Y., and Qiu, Y. L. (2009). The complete mitochondrial genome sequence of the hornwort Megaceros aenigmaticus shows a mixed mode of conservative yet dynamic evolution in early land plant mitochondrial genomes. J. Mol. Evol. 68, 665–678. doi: 10.1007/s00239-009-9240-7
Li, P., Zhang, S., Li, F., Zhang, S., Zhang, H., and Wang, X. (2017). A phylogenetic analysis of chloroplast genomes elucidates the relationships of the six economically important brassica species comprising the triangle of U. Front. Plant Sci. 8:111. doi: 10.3389/fpls.2017.00111
Liu, Y., Medina, R., and Goffinet, B. (2014). 350 my of mitochondrial genome stasis in mosses, an early land plant lineage. Mol. Biol. Evol. 31, 2586–2591. doi: 10.1093/molbev/msu199
Liu, Y., Wang, B., Cui, P., Li, L., Xue, J. Y., Yu, J., et al. (2012a). The mitochondrial genome of the lycophyte Huperzia squarrosa: the most archaic form in vascular plants. PLoS One 7:e35168. doi: 10.1371/journal.pone.0035168
Liu, Y., Wang, B., Li, L., Qiu, Y.-L., and Xue, J. (2012b). “Conservative and dynamic evolution of mitochondrial genomes in early land plants,” in Genomics of Chloroplasts and Mitochondria, Vol. 35, eds R. Bock and V. Knoop (The Netherland: Springer), 159–174. doi: 10.1007/978-94-007-2920-9_7
Liu, Y., Xue, J. Y., Wang, B., Li, L., and Qiu, Y. L. (2011). The mitochondrial genomes of the early land plants Treubia lacunosa and Anomodon rugelii: dynamic and conservative evolution. PLoS One 6:e25836. doi: 10.1371/journal.pone.0025836
Mogensen, H. (1996). The hows and whys of cytoplasmic inheritance in seed plants. Am. J. Bot. 3, 383–404. doi: 10.1002/j.1537-2197.1996.tb12718.x
Moore, M. J., Bell, C. D., Soltis, P. S., and Soltis, D. E. (2007). Using plastid genome-scale data to resolve enigmatic relationships among basal angiosperms. Proc. Natl. Acad. Sci. U.S.A. 104, 19363–19368. doi: 10.1073/pnas.0708072104
Murat, F., Armero, A., Pont, C., Klopp, C., and Salse, J. (2017). Reconstructing the genome of the most recent common ancestor of flowering plants. Nat. Genet. 49, 490–496. doi: 10.1038/ng.3813
Murat, F., Louis, A., Maumus, F., Armero, A., Cooke, R., Quesneville, H., et al. (2015). Understanding Brassicaceae evolution through ancestral genome reconstruction. Genome Biol. 16:262. doi: 10.1186/s13059-015-0814-y
Nagaharu, U. (1935). Genome analysis in Brassica with special reference to the experimental formation of B. napus and peculiar mode of fertilization. Japan J. Bot. 7, 389–452.
One Thousand Plant Transcriptomes Initiative (2019). One thousand plant transcriptomes and the phylogenomics of green plants. Nature 574, 679–685. doi: 10.1038/s41586-019-1693-2
Palmer, J. D., Shields, C. R., Cohen, D. B., and Orton, T. J. (1983). Chloroplast DNA evolution and the origin of amphidiploid Brassica species. Theor. Appl. Genet. 65, 181–189. doi: 10.1007/BF00308062
Qiu, Y. L., Li, L. B., Hendry, T. A., Li, R. Q., Taylor, D. W., Issa, M. J., et al. (2006). Reconstructing the basal angiosperm phylogeny: evaluating information content of mitochondrial genes. Taxon 55, 837–856. doi: 10.2307/25065680
Qiu, Y. L., Li, L. B., Wang, B., Xue, J. Y., Hendry, T. A., Li, R. Q., et al. (2010). Angiosperm phylogeny inferred from sequences of four mitochondrial genes. J. Syst. Evol. 48, 391–425. doi: 10.1111/j.1759-6831.2010.00097.x
Ronquist, F., Teslenko, M., van der Mark, P., Ayres, D. L., Darling, A., Hohna, S., et al. (2012). MrBayes 3.2: efficient bayesian phylogenetic inference and model choice across a large model space. Syst. Biol. 61, 539–542. doi: 10.1093/sysbio/sys029
Sang, S., Cheng, H., Mei, D., Fu, L., Wang, H., Liu, J., et al. (2020). Complete organelle genomes of Sinapis arvensis and their evolutionary implications. Crop J. (in press). doi: 10.1016/j.cj.2019.12.001
Scholz, O. E. (1919). “Cruciferae — Brassiceae,” in Pflaazemeich, eds A. Engler and E. Gilg (Berlin: Gebrüder Borntraeger), 117–136.
Stamatakis, A. (2006). RAxML-VI-HPC: maximum likelihood-based phylogenetic analyses with thousands of taxa and mixed models. Bioinformatics 22, 2688–2690. doi: 10.1093/bioinformatics/btl446
Talavera, G., and Castresana, J. (2007). Improvement of phylogenies after removing divergent and ambiguously aligned blocks from protein sequence alignments. Syst. Biol. 56, 564–577. doi: 10.1080/10635150701472164
Wang, B., Xue, J., Li, L., Liu, Y., and Qiu, Y. L. (2009). The complete mitochondrial genome sequence of the liverwort Pleurozia purpurea reveals extremely conservative mitochondrial genome evolution in liverworts. Curr. Genet. 55, 601–609. doi: 10.1007/s00294-009-0273-7
Warwick, S. I., and Black, L. D. (1991). Molecular systematics of Brassica and allied genera (Subtribe Brassicinae, Brassiceae) -chloroplast genome and cytodeme congruence. Theor. Appl. Genet. 82, 81–92. doi: 10.1007/BF00231281
Worth, J. R., Yokogawa, M., and Isagi, Y. (2014). Outcrossing rates and organelle inheritance estimated from two natural populations of the Japanese endemic conifer Sciadopitys verticillata. J. Plant Res. 127, 617–626. doi: 10.1007/s10265-014-0646-y
Xue, J. Y., Liu, Y., Li, L., Wang, B., and Qiu, Y. L. (2010). The complete mitochondrial genome sequence of the hornwort Phaeoceros laevis: retention of many ancient pseudogenes and conservative evolution of mitochondrial genomes in hornworts. Curr. Genet. 56, 53–61. doi: 10.1007/s00294-009-0279-1
Yamagishi, H., Tanaka, Y., and Terachi, T. (2014). Complete mitochondrial genome sequence of black mustard (Brassica nigra; BB) and comparison with Brassica oleracea (CC) and Brassica carinata (BBCC). Genome 57, 577–582. doi: 10.1139/gen-2014-0165
Yang, J., Liu, D., Wang, X., Ji, C., Cheng, F., Liu, B., et al. (2016a). The genome sequence of allopolyploid Brassica juncea and analysis of differential homoeolog gene expression influencing selection. Nat. Genet. 48, 1225–1232. doi: 10.1038/ng.3657
Keywords: mitochondrial genome, phylogenomics, paleogenomics, Brassica, maternal inheritance, evolutionary history
Citation: Xue J-Y, Wang Y, Chen M, Dong S, Shao Z-Q and Liu Y (2020) Maternal Inheritance of U’s Triangle and Evolutionary Process of Brassica Mitochondrial Genomes. Front. Plant Sci. 11:805. doi: 10.3389/fpls.2020.00805
Received: 04 March 2020; Accepted: 19 May 2020;
Published: 12 June 2020.
Edited by:
Michael R. McKain, The University of Alabama, United StatesReviewed by:
J. Chris Pires, University of Missouri, United StatesCopyright © 2020 Xue, Wang, Chen, Dong, Shao and Liu. This is an open-access article distributed under the terms of the Creative Commons Attribution License (CC BY). The use, distribution or reproduction in other forums is permitted, provided the original author(s) and the copyright owner(s) are credited and that the original publication in this journal is cited, in accordance with accepted academic practice. No use, distribution or reproduction is permitted which does not comply with these terms.
*Correspondence: Zhu-Qing Shao, emh1cWluZ3NoYW9AMTI2LmNvbQ==; Yang Liu, eWFuZy5saXUwNTA4QGdtYWlsLmNvbQ==
Disclaimer: All claims expressed in this article are solely those of the authors and do not necessarily represent those of their affiliated organizations, or those of the publisher, the editors and the reviewers. Any product that may be evaluated in this article or claim that may be made by its manufacturer is not guaranteed or endorsed by the publisher.
Research integrity at Frontiers
Learn more about the work of our research integrity team to safeguard the quality of each article we publish.