- 1Plant Genome Mapping Laboratory, University of Georgia, Athens, GA, United States
- 2The Land Institute, Salina, KS, United States
- 3Center for Genomics and Biotechnology, Fujian Agriculture and Forestry University, Fuzhou, China
Despite a “ploidy barrier,” interspecific crosses to wild and/or cultivated sorghum (Sorghum bicolor, 2n = 2x = 20) may have aided the spread across six continents of Sorghum halepense, also exemplifying risks of “transgene escape” from crops that could make weeds more difficult to control. Genetic maps of two BC1F1 populations derived from crosses of S. bicolor (sorghum) and S. halepense with totals of 722 and 795 single nucleotide polymorphism (SNP) markers span 37 and 35 linkage groups, with 2–6 for each of the 10 basic sorghum chromosomes due to fragments covering different chromosomal portions or independent segregation from different S. halepense homologs. Segregation distortion favored S. halepense alleles on chromosomes 2 (1.06–4.68 Mb, near a fertility restoration gene), 7 (1.20–6.16 Mb), 8 (1.81–5.33 Mb, associated with gene conversion), and 9 (47.5–50.1 Mb); and S. bicolor alleles on chromosome 6 (0–40 Mb), which contains both a large heterochromatin block and the Ma1 gene. Regions of the S. halepense genome that are recalcitrant to gene flow from sorghum might be exploited as part a multi-component system to reduce the likelihood of spread of transgenes or other modified genes. Its SNP profile suggests that chromosome segments from its respective progenitors S. bicolor and Sorghum propinquum have extensively recombined in S. halepense. This study reveals genomic regions that might discourage crop-to-weed gene escape, and provides a foundation for marker-trait association analysis to determine the genetic control of traits contributing to weediness, invasiveness, and perenniality of S. halepense.
Introduction
Native to western Asia, Sorghum halepense L. (“Johnsongrass,” 2n = 4x = 40) finds occasional use as forage and even food (seed/flour), but is most noted as one of the world’s most noxious weeds, having spread across much of Asia, Africa, Europe, North and South America, and Australia and with the unusual distinction of being both a noxious weed and an invasive species (Quinn et al., 2013). Cytological, morphological, and molecular genetic data suggest that S. halepense is a naturally formed tetraploid hybrid derivative of Sorghum bicolor (2n = 20), an annual, polytypic African grass species which includes cultivated sorghum, and Sorghum propinquum (2n = 20), a perennial native of moist habitats in southeast Asia (Oyer et al., 1959; McWhorter, 1971; Paterson et al., 1995) estimated to have diverged from S. bicolor ∼1–2 million years ago.
The invasiveness of S. halepense is mainly owing to effective propagation by rapid flowering and disarticulation of mature inflorescences, together with underground rhizomes that can account for up to 70% of an individual plant’s dry weight (Oyer et al., 1959), store nutrients, and quickly produce new vegetative growth after quiescent periods (cold or drought). To date, no herbicide has been found to eradicate S. halepense without damaging sorghum—moreover, at least 24 herbicide-resistant S. halepense biotypes (Heap, 2012) are known.
Its ability to cross with cultivated sorghum (S. bicolor) makes S. halepense a paradigm for the dangers of crop “gene escape” (Dale, 1992; Ellstrand, 2001; Morrell et al., 2005), with engineered improvements of sorghum raising concerns about the potential to increase persistence and/or spread of this weedy and invasive plant (Arriola and Ellstrand, 1996; Tesso et al., 2008). Although differing in ploidy from S. halepense, S. bicolor can serve as the pollen parent of triploid or tetraploid hybrids (Warwick and Black, 1983; Hoang-Tang and Liang, 1988). The “Johnsongrass” of North America has been extensively affected by introgression from S. bicolor (Morrell et al., 2005) like Sorghum almum, commonly known as Columbus Grass (Warwick et al., 1984). Introgression from S. bicolor to S. halepense has persisted in non-random regions of the genome, associated with seed size, rhizomatousness, and levels of lutein, an antioxidant implicated in cold tolerance (Paterson et al., submitted).
From a different perspective, however, S. halepense harbors many characteristics that may increase agricultural productivity if transferred to sorghum (Sangduen and Hanna, 1984). It flowers and produces seeds rapidly, is resistant to many diseases and insects, and adapts to a wider range of environments than both of its progenitors. S. halepense might also contribute to breeding of genotypes suitable for multiple harvests from single plantings (Cox et al., 2002; Glover et al., 2010; Paterson et al., 2013).
Here, we report genetic maps of two BC1F1 populations derived from different tetraploid F1 progenies from a cross of S. bicolor BTx623 (recurrent parent) × S. halepense (Gypsum 9E) and reveal chromosomal characteristics and segregation patterns using genotyping by sequencing (GBS). In comparison to its progenitors S. bicolor and S. propinquum, the chromosomal composition of S. halepense sheds light on its evolution. Patterns of transmission of alleles from S. bicolor and S. halepense to interspecific progenies provide evidence of genomic regions that may, respectively, be favorable or recalcitrant to interspecific gene flow. This information identifies potential locations for transgenes or other genetic modifications (“edited” alleles) that may minimize crop-to-weed gene flow. These two populations are also of potential agronomic importance: identifying and incorporating novel alleles conferring yield potential, nitrogen fixation, insect or disease resistance, and rhizomatousness may benefit current or future sorghum breeding programs.
Materials and Methods
Genetic Stocks
Two tetraploid F1 hybrids (H4 and H6) derived from crossing tetraploid S. bicolor BTx623 (colchicine-induced) × S. halepense (G9E) (Cox et al., 2018) were backcrossed to a tetraploid version of the recurrent parent, S. bicolor BTx623: two BC1F1 mapping populations, of 146 H4-derived and 108 H6-derived individuals, respectively, were developed. BC1F2 rows derived from selfed seed of a single BC1F1 plant were planted at the University of Georgia Plant Science Farm, Watkinsville, GA, United States, on 28 May 2013 and 9 May 2014, and at The Land Institute, Salina, KS, United States, on 3 June 2013 and 17 June 2014. Plants were harvested for phenotyping when the main head reached senescence.
Genotyping by Sequencing (GBS)
Leaf samples of the BC1F1 individuals were frozen at −80°C and lyophilized for 48 h. Genomic DNA was extracted from the lyophilized leaf samples based on Aljanabi et al. (1999). Genome sequencing was conducted in Fujian Agricultural and Forestry University (FAFU) genome sequencing center. The GBS platform used a slightly modified version of Multiplex Shotgun Genotyping (MSG) (Andolfatto et al., 2011) combined with the Tassel GBS5 v2 analysis pipeline (Glaubitz et al., 2014). Sequencing used an Illumina HiSeq 2500, Rapid V2 kit that generated about 150 million reads of 100 base pair (bp) fragments per run with single-end sequencing. The restriction enzymes Hinp1I and HaeIII were used in GBS to construct the library. Adapter sequences can be found in the Supplementary Material. The dsDNA concentration was measured (20 ng/μL) and normalized across 96 individuals before library construction. Libraries were PCR-amplified to enrich for adapter-ligated fragments. Size selection was performed at 250–300 bp using “QIAquick Gel Extraction Kit.”
Genotype Calling and Filtering
Genotypes were determined by single nucleotide polymorphism (SNP) “calling” based on the reference genome of S. bicolor BTx623 v1.4 (Paterson et al., 2009). Using Tassel-GBS 5 (Glaubitz et al., 2014), the first 90 bp of each read were mapped onto the reference genome. SNPs were “called” based on alignment of the reads to the reference genome. An in-house pipeline was used to determine the genotypes for these two populations, as follows:
1 Raw SNPs were first thinned out within 100 bp, since SNP sites close to each other or on the same read provide little non-redundant information in early generations following crossing.
2 Biallelic SNP markers with an average depth of 10 were selected.
3 The PL (phred-scaled genotype likelihoods) field from the raw VCF file consisted of three floating point log10-scaled likelihoods for AA, AB, and BB genotypes where A is the reference allele and B is the alternative allele (Danecek et al., 2011). The PL field was transformed into probability scales by 10(–PL/10). Genotype calling used the field with the minimum PL value, except that a missing genotype was assigned if the second largest probability of a genotype is greater than 0.05 for each individual at each locus.
4 Homozygous genotypes with lower than 6x coverage were considered missing data.
A total of 2240 raw polymorphic markers were obtained after the genotyping and filtering steps described above for both H4- and H6-derived populations and used to analyze patterns of segregation.
Map Construction
For each sorghum chromosome, we clustered markers based on a minimum LOD score of 10. Genetic distances were first estimated based on the physical orders of markers in the published sorghum genome (Paterson et al., 2009) and then markers within 1cM bins were combined. Bin genotypes were defined as follows: If there was only one marker in the bin, the bin genotype would be the same as the marker genotype; if there were more than one marker in the bin, bin genotypes would be determined by merging marker genotypes to minimize missing data points. Using the combined genotype file, de novo marker ordering was implemented for each corresponding sorghum chromosome and the final genetic map was constructed using R/qtl with the Kosambi mapping function. The map distance was calculated with an error probability of 0.01 (Broman et al., 2003). SNP marker co-ordinates to sorghum reference genome v3.1 are provided in Supplementary File S1.
Analysis of Segregation
Using the R program (R Core Team, 2013), a chi-squared test was applied to each marker to test the hypothesis that it deviated significantly from a ratio of 5:1.
Whole Genome Polymorphism Analysis
A total of four genotypes, S. bicolor IS3620C (SRX2158431), S. propinquum from University of Georgia (SRX030701 and SRX030703), S. propinquum from Australia (SRX208587 and SRX208588), and S. halepense (SRX142088), were included in whole-genome SNP analysis against the S. bicolor BTx623 v1.4 reference genome. The Burrows-Wheeler Aligner (BWA) MEM algorithm was used for read alignment (Li and Durbin, 2009). Variant calling used samtools/Bcftools (Li, 2011). Data were filtered with a minimum phred score of Q20, and a minimum depth of 10 with a maximum missing data of 30% for each SNP locus.
Results
Genetic Mapping and Patterns of Segregation
For three sets of 96 individuals, sequencing read depths of 360.7, 181.2, and 175.6 million yielded 689,684 raw SNP markers, which were thinned to 215,341 by removing loci within 100 bp of another locus. Of the 254 genotyped individuals, eight were deleted due to very low sequence coverage leaving 141 from the H4 population, and 105 from H6. After filtering steps (see section “Materials and Methods”), the same 2240 polymorphic markers with a minimum average depth of 10 at each locus were used for genetic mapping of each population.
Ratios of heterozygotes to homozygotes for all mapped markers after square-root transformation (Figure 1) show a continuous distribution, indicating a mixture of disomic and polysomic inheritance as observed in other tetraploids (Jannoo et al., 2004; Stift et al., 2008). Autotetraploids can segregate in a variety of manners, including random chromosome segregation, random chromatid segregation, and maximum equational segregation, and can be further complicated by varying degrees of double reduction (Gupta, 2007). Random chromosome segregation assumes no crossing over between a gene and the centromere, while maximum equational segregation assumes that such crossing over always occurs. An intermediate state between random chromosome segregation and maximum equational segregation is often more frequent than the two extremes (Gupta, 2007). With random chromosome segregation (Muller, 1914), the expected segregation ratios for these populations are 1:1 (heterozygotes:homozygotes) for simplex markers and 5:1 for duplex markers. Under random chromatid segregation, where a chromatid can end up with any chromatid in a gamete with equal frequency, the segregation ratio can be 13:15 (simplex) or 11:3 (duplex) (Haldane, 1930). With maximum equational segregation (Mather, 1935), the segregation ratio can be 11:13 (simplex) or 7:2 (duplex).
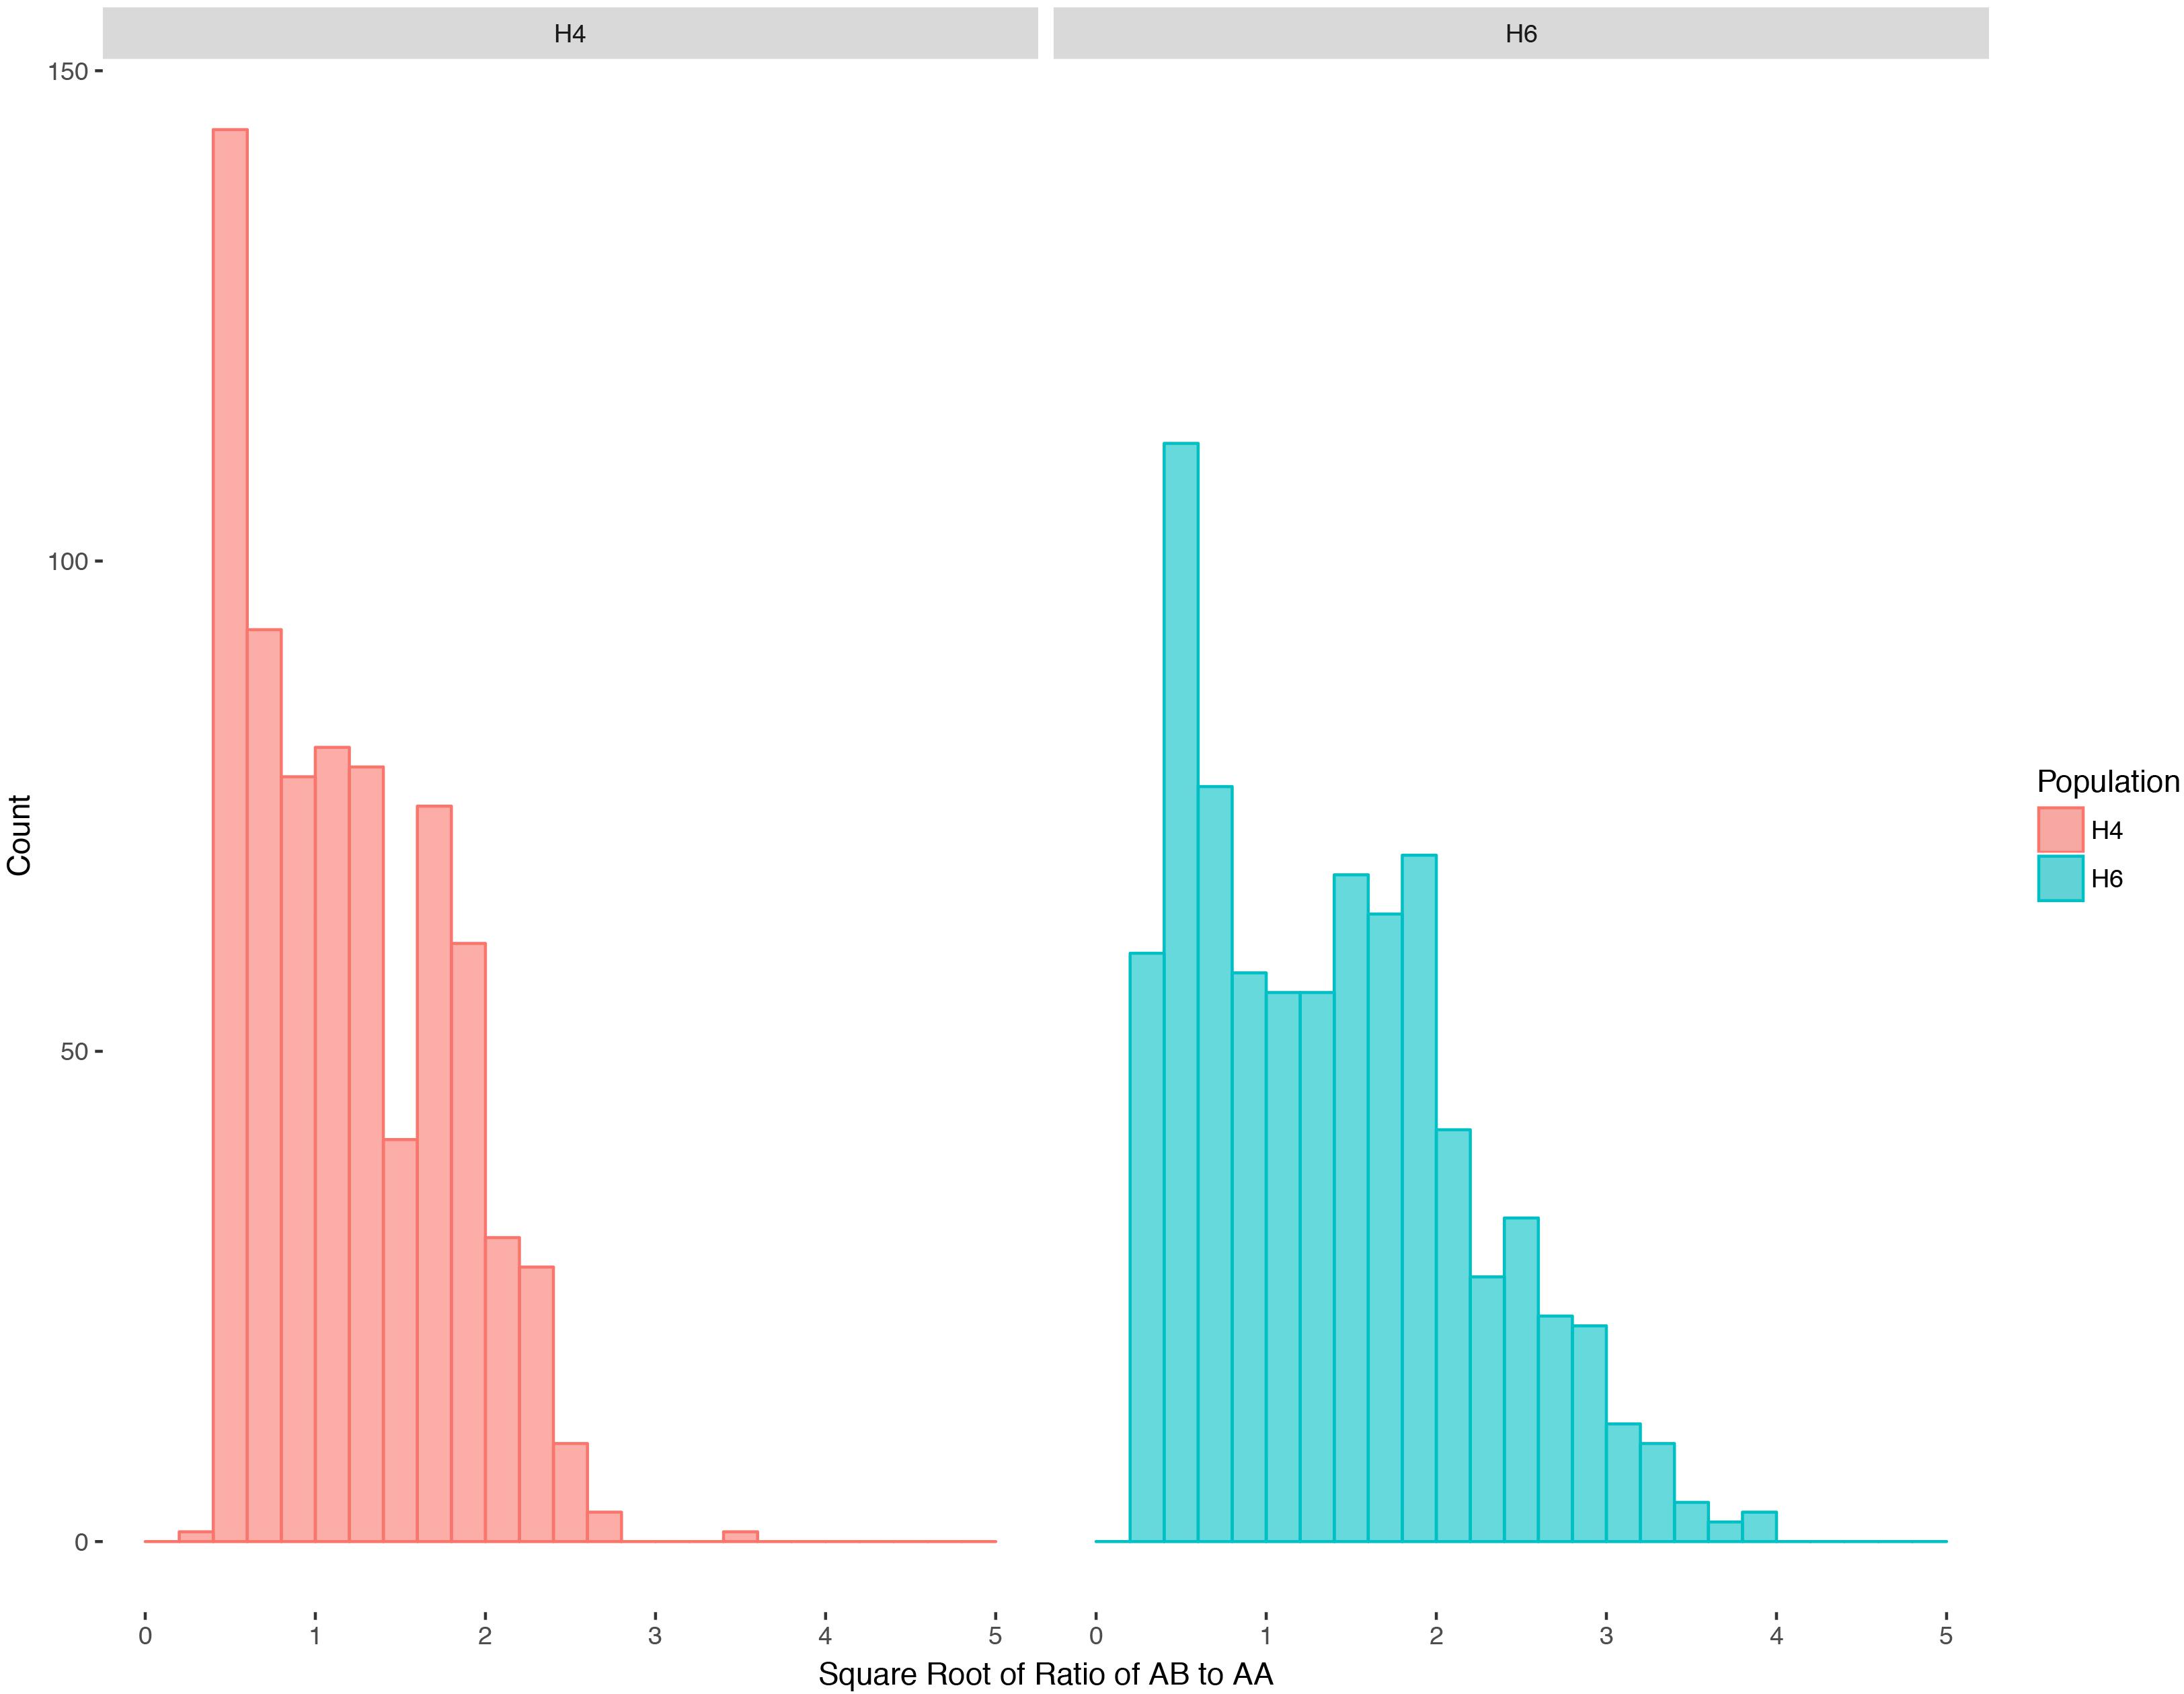
Figure 1. Distribution of segregation ratios (square root transformed) for H4 and H6 populations of S. bicolor BTx623 × S. halepense G9E with mapped markers. AA is the homozygous genotype while AB is the heterozygous genotype.
We grouped all 2240 selected SNP markers based on pair-wise recombination fractions using relatively stringent thresholds in R/qtl (Broman et al., 2003), mapping 722 and 795 to 38 and 36 linkage groups spanning 3896.5 and 6048.4 cM for the H4- and H6-derived populations, respectively (Tables 1, 2 and Figure 2). For individual sorghum chromosomes, we obtained two to six linkage groups, some covering only portions of the underlying chromosome (Figure 2) but others due to highly divergent segregation patterns of different allele groups (below).
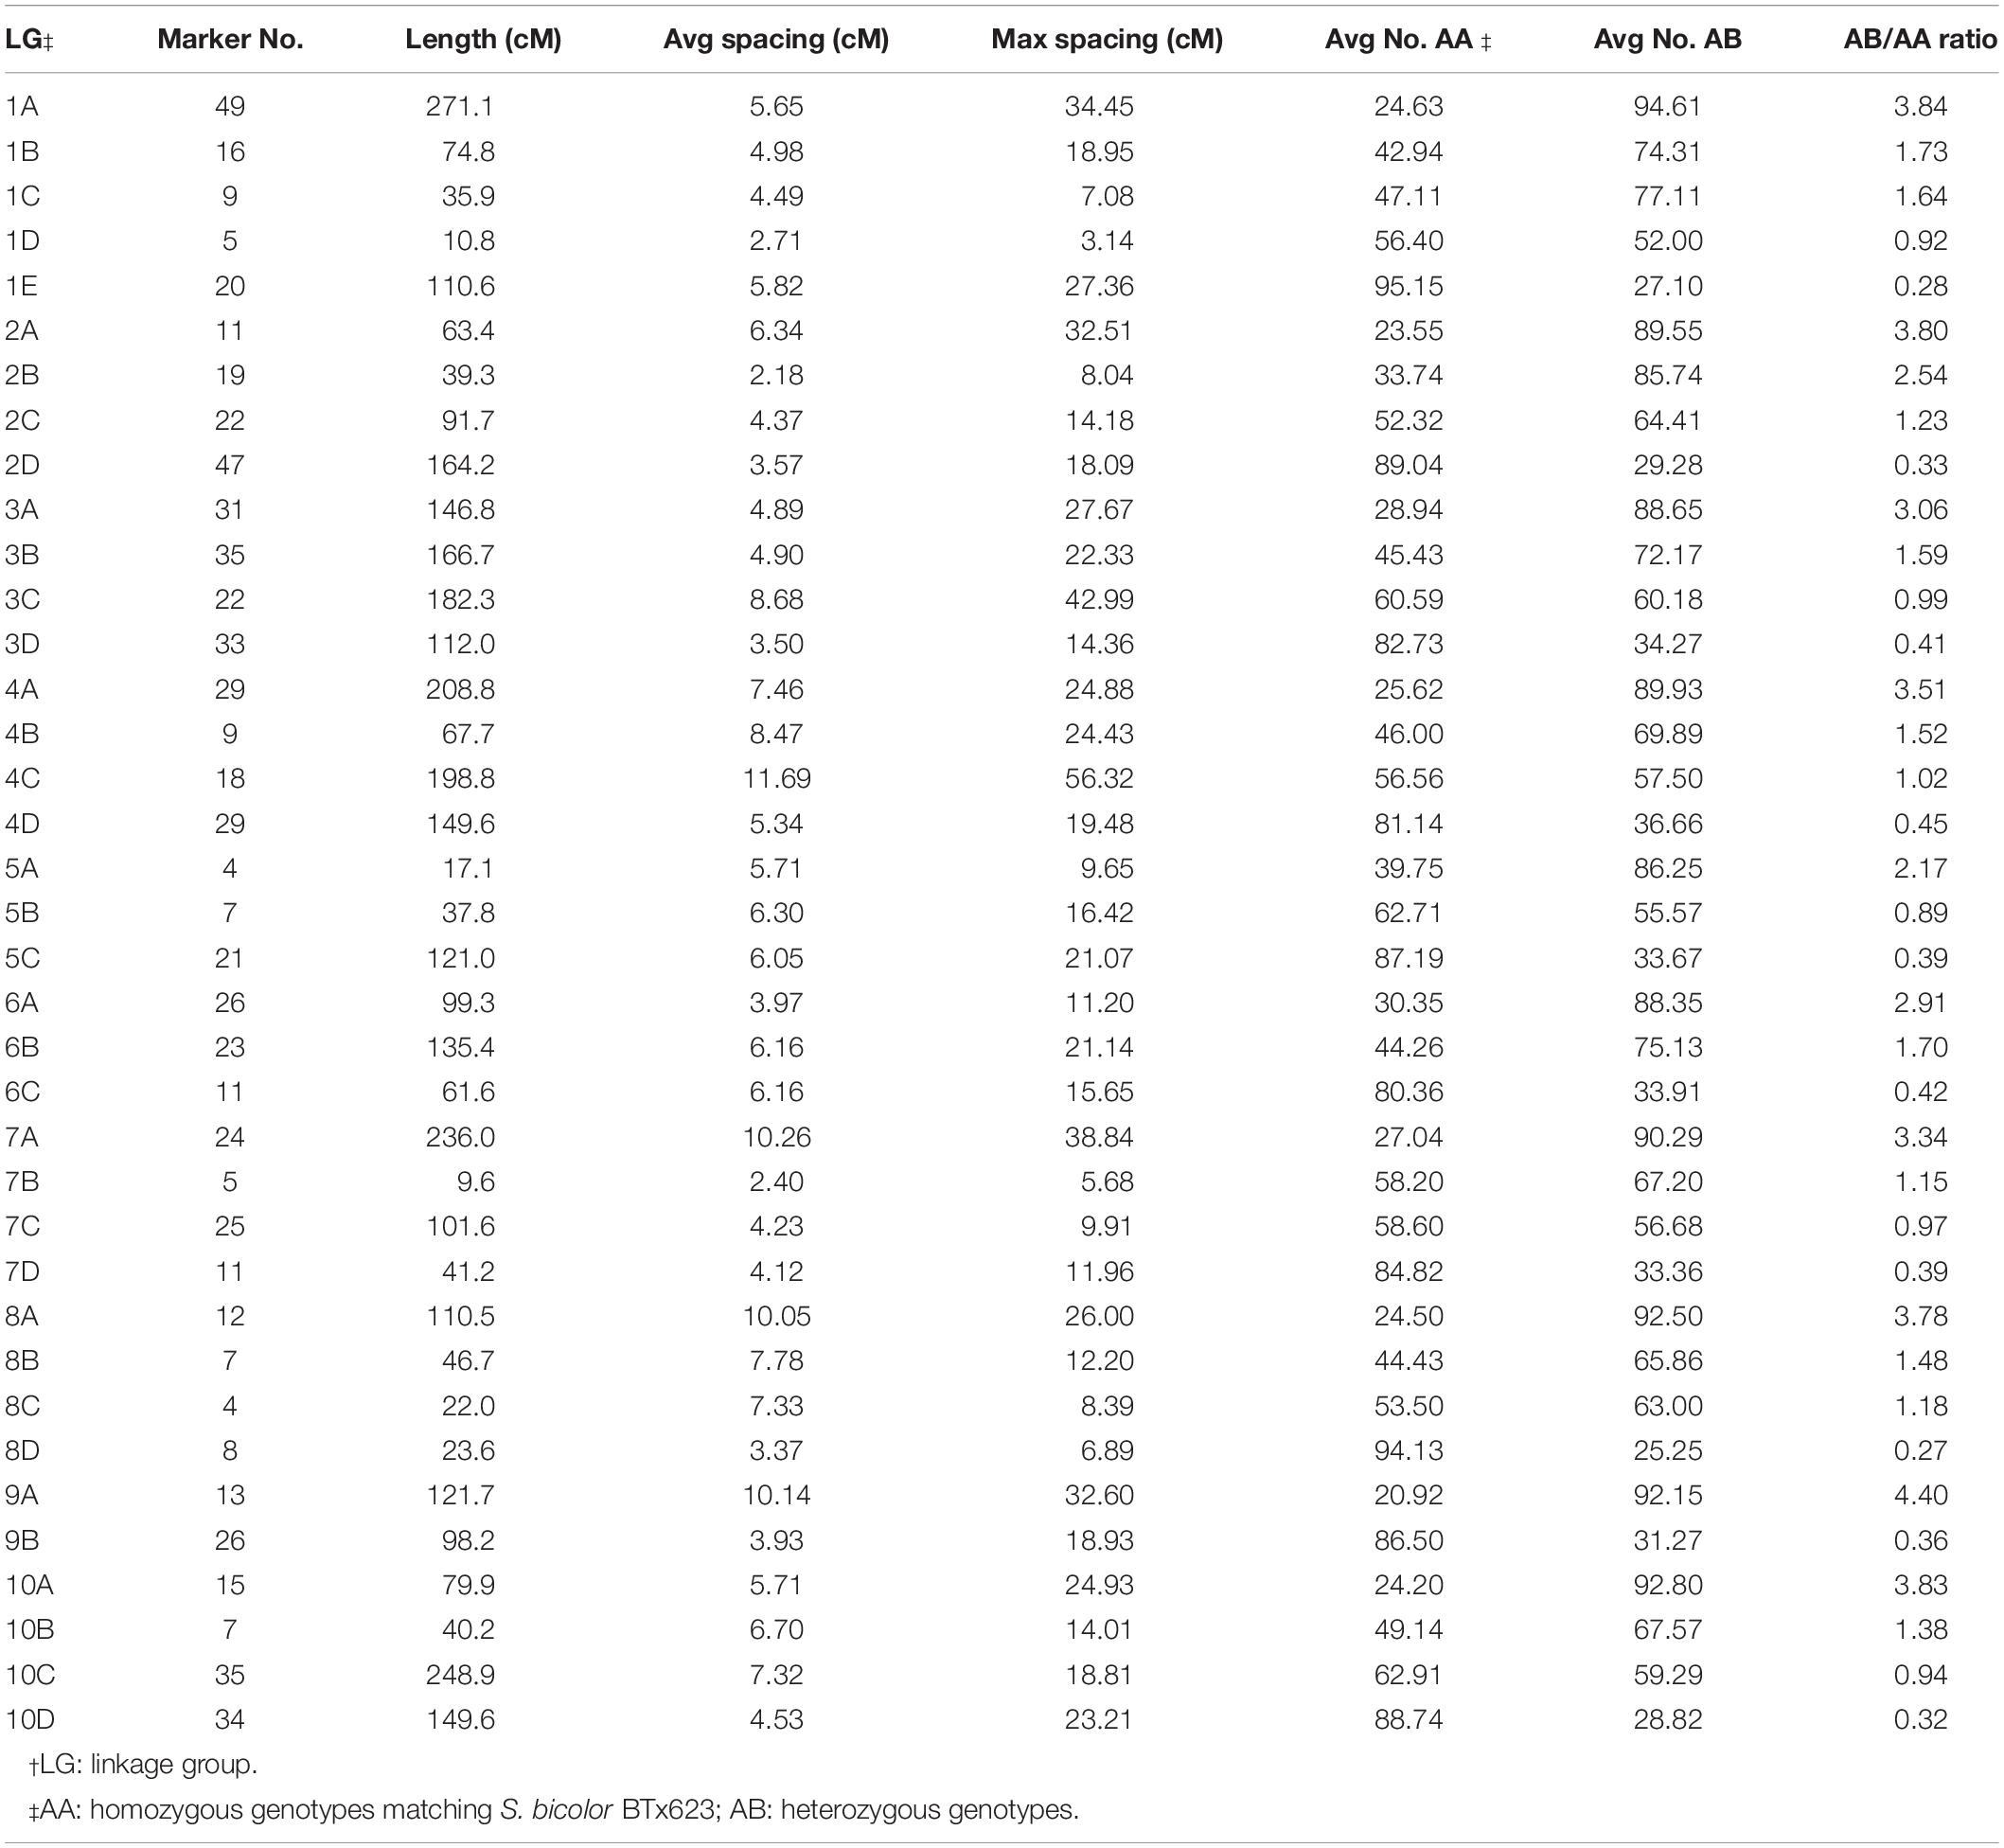
Table 1. Characteristics of the genetic map of the H4-derived BC1F1 population of S. bicolor BTx623 × S. halepense G9E.
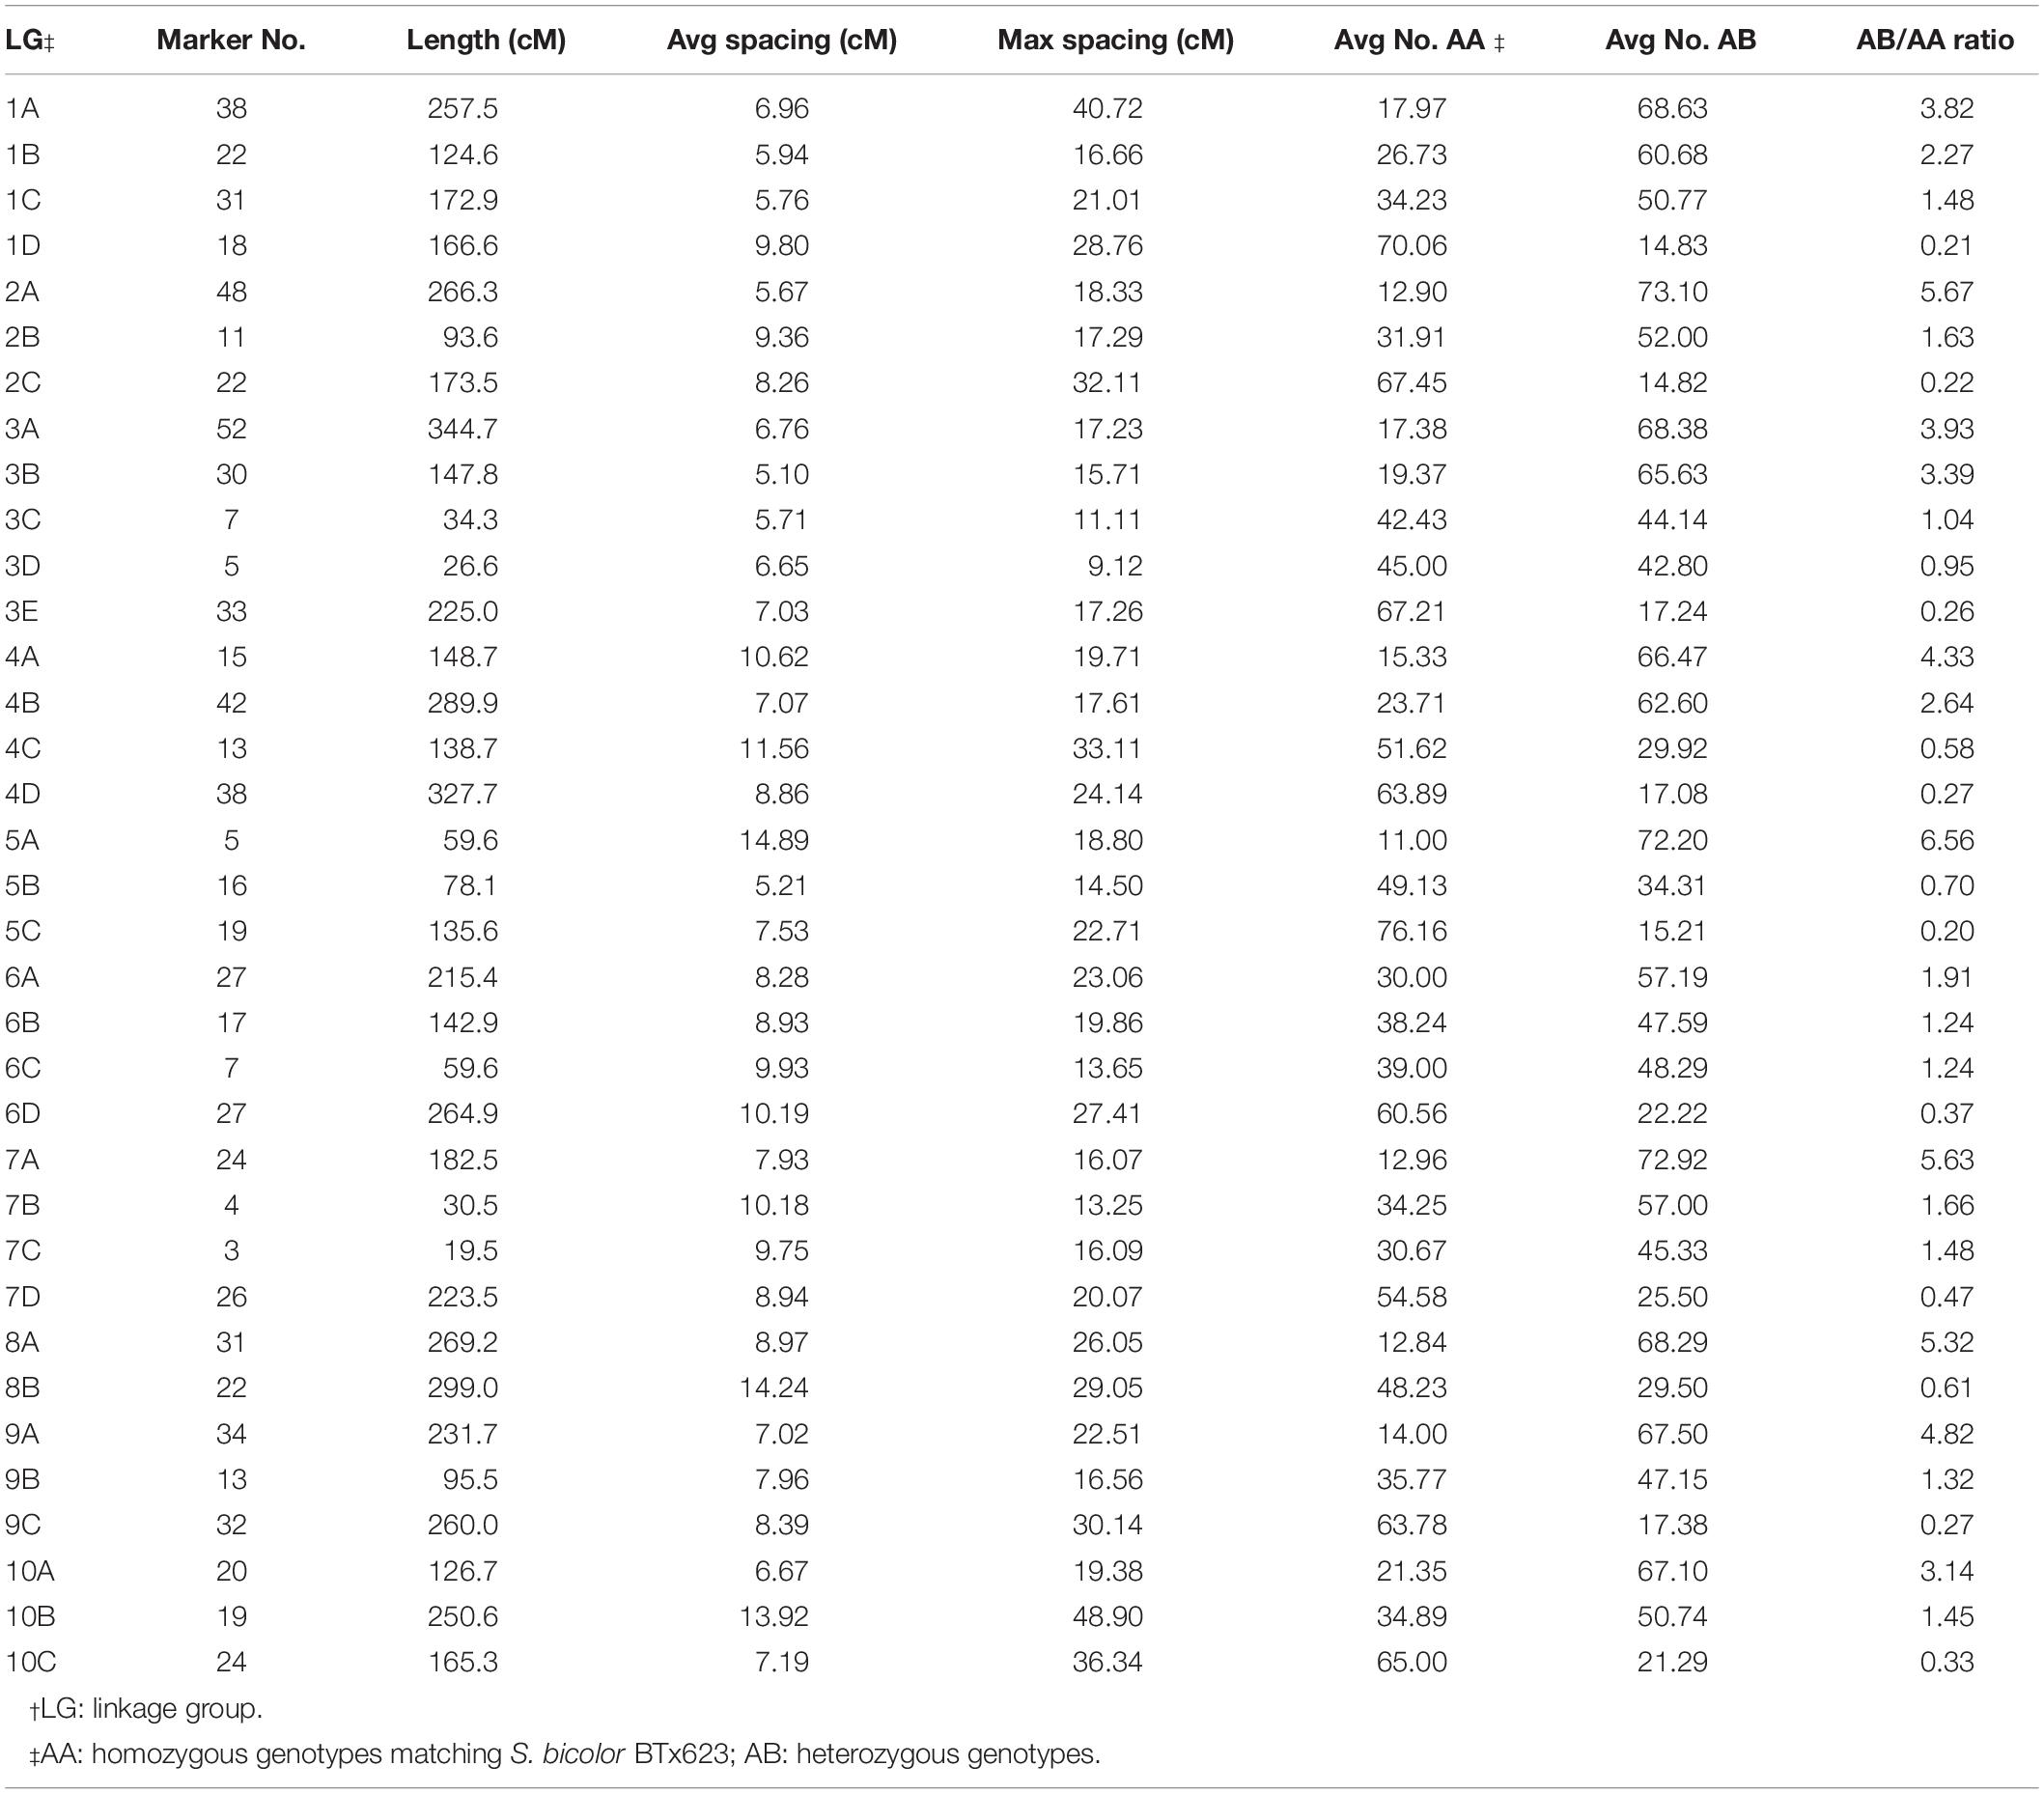
Table 2. Characteristics of the genetic map of the H6-derived BC1F1 population of S. bicolor BTx623 × S. halepense G9E.
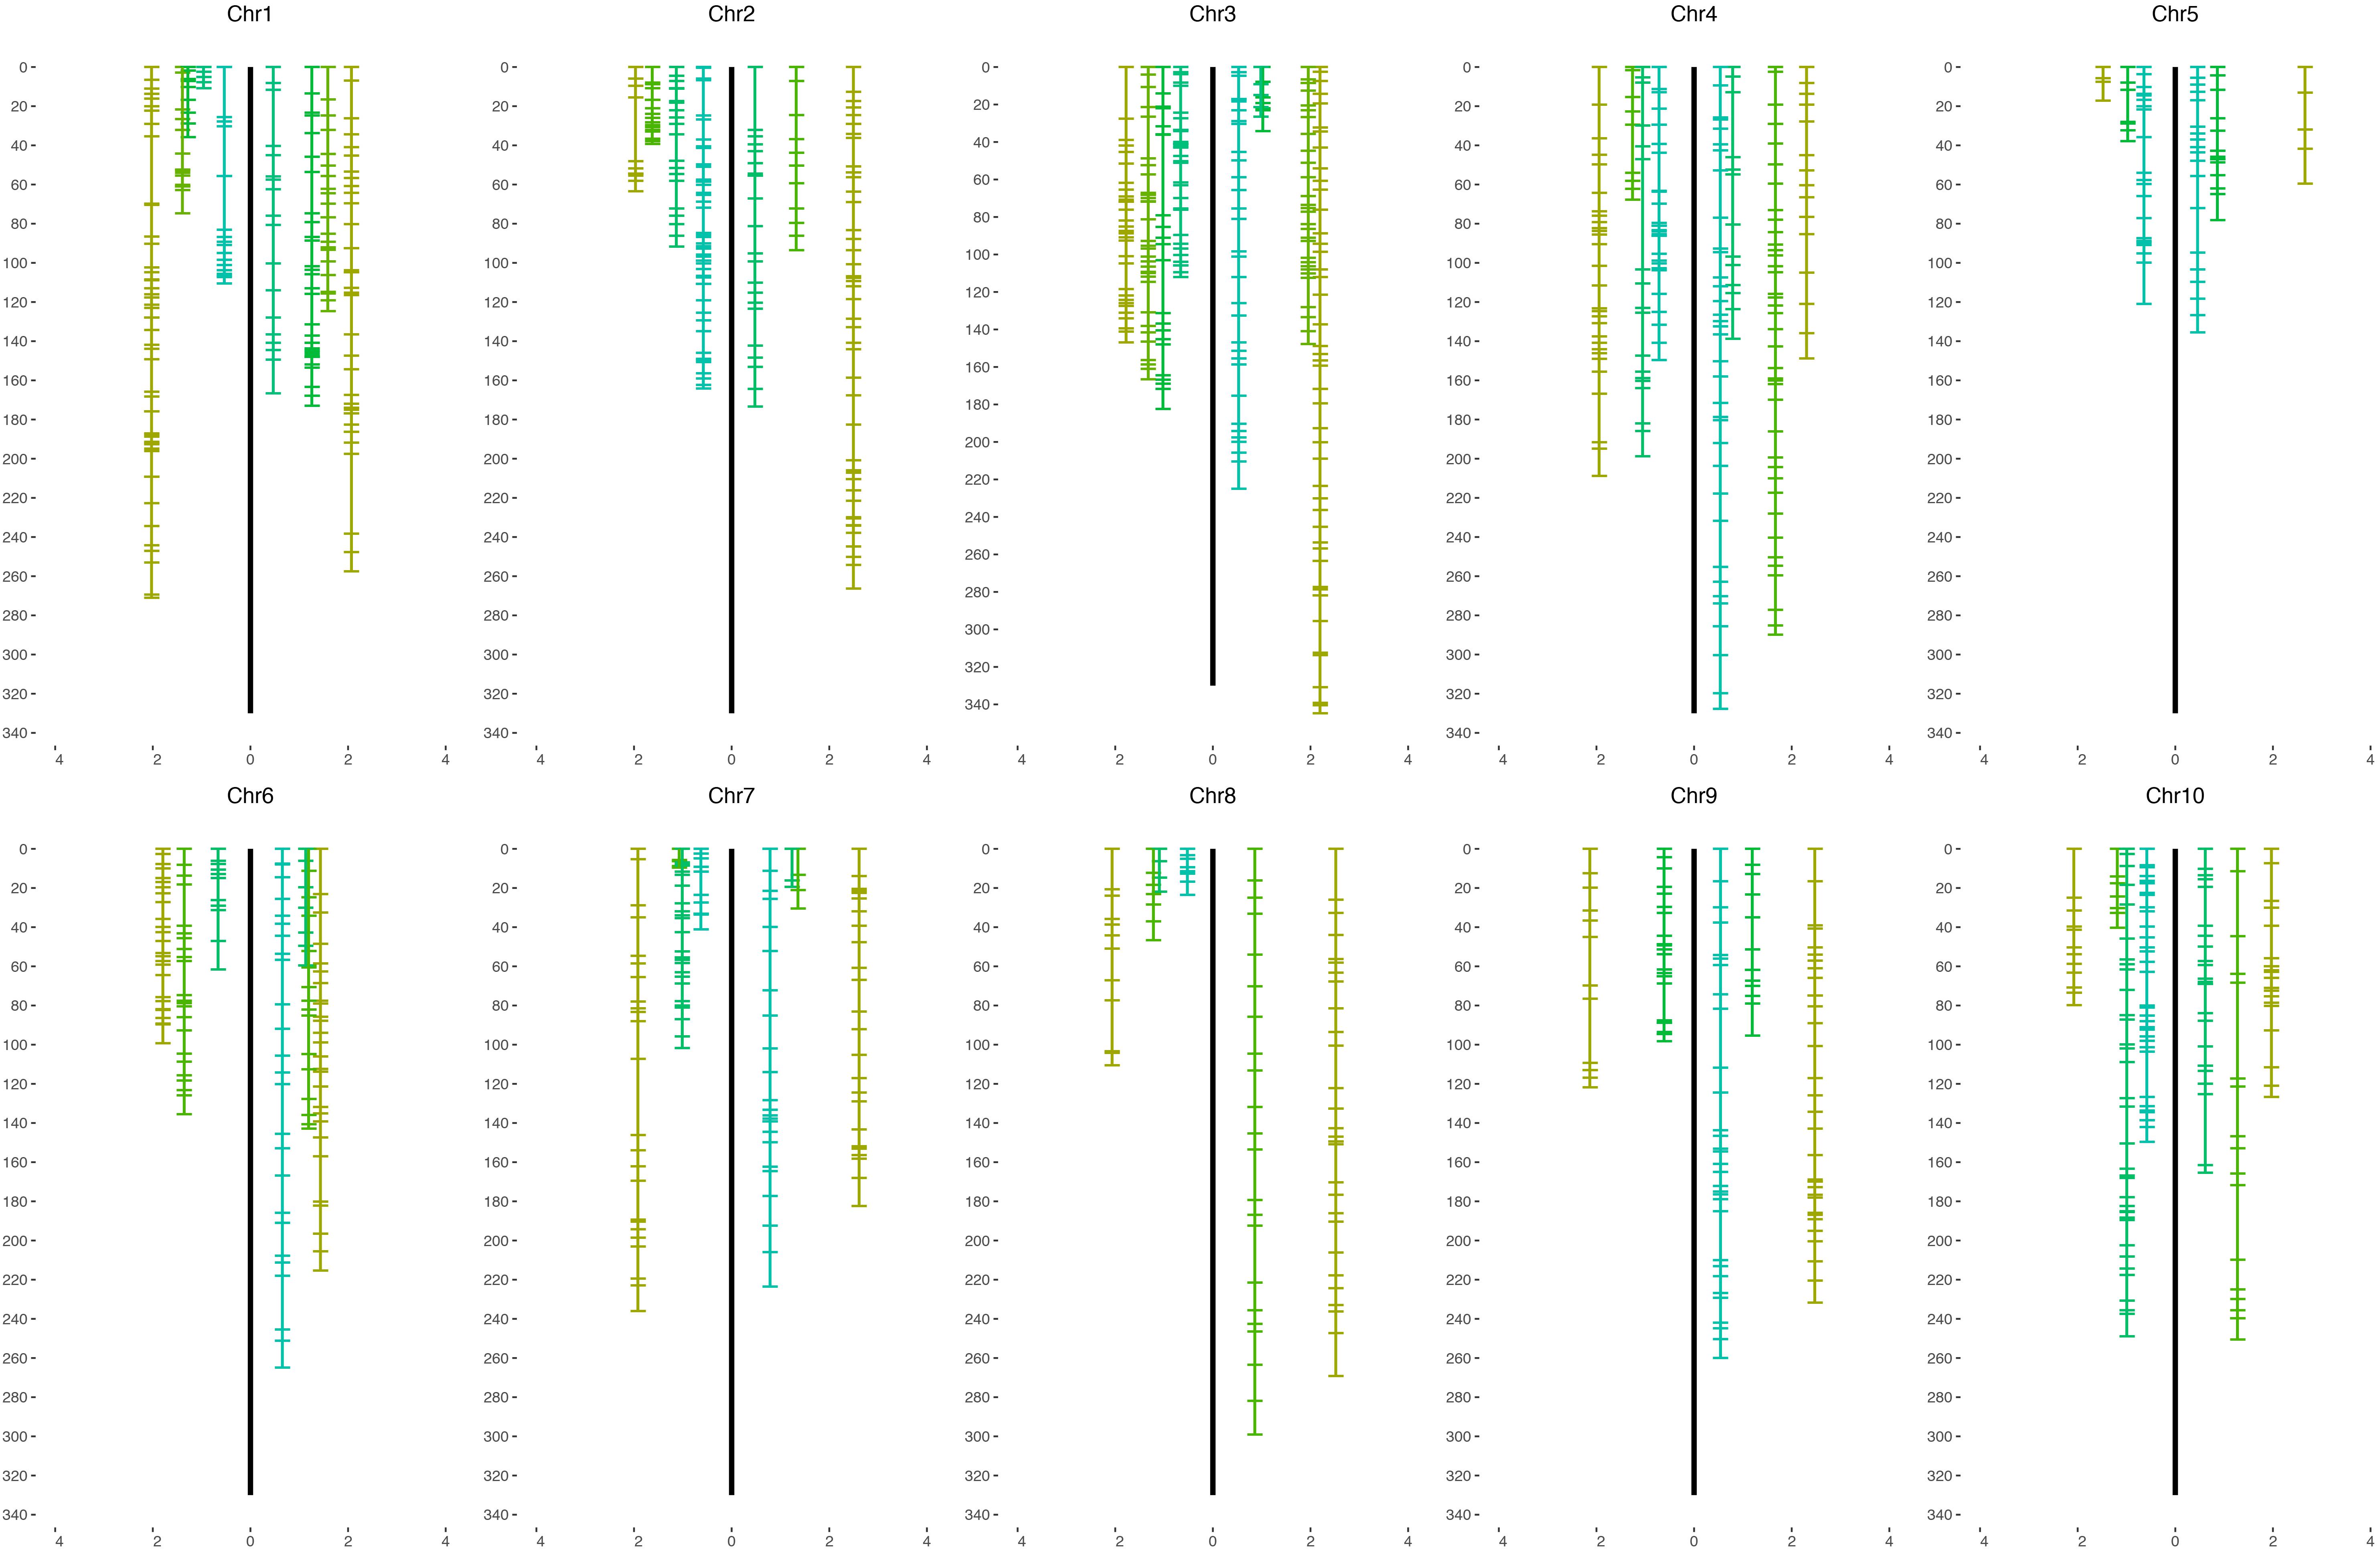
Figure 2. Genetic maps of the BC1F1 population of S. bicolor BTx623 × S. halepense G9E. The maps of the H4-derived population are on the left of the black line and H6 maps are on the right for each sorghum chromosome. The x-axis is the average segregation ratio of each linkage group after square-root transformation.
Transmission Genetics
Simplex markers should have segregation ratios of 1:1, 13:15, and 11:13, while duplex markers should have segregation ratios of 5:1, 11:3, and 7:2 for random chromosome segregation, random chromatid segregation, and maximum equational segregation, respectively. We lack the statistical power to distinguish with confidence among the three possible variations of simplex or duplex ratios, or intermediates. Therefore, we expect to find a total of four linkage groups for each sorghum chromosome including one S. halepense enriched group comprised of duplex alleles, two allele balanced groups with S. halepense simplex markers (one representing each S. halepense homolog in the F1 parent), and one S. bicolor enriched group comprised of duplex alleles. Since the S. bicolor parent is largely homozygous, linkage groups of S. bicolor simplex alleles are not expected. If chromosome pairing is disomic, the S. bicolor enriched group would be in repulsion phase with S. halepense groups, though the sample sizes of the two populations limit our ability to test this hypothesis.
We define linkage groups as either S. halepense or S. bicolor enriched based on statistically significant deviation from the expected segregation ratio of 1:1 for the average of all markers in the group. Linkage groups were deemed S. halepense enriched if the average segregation ratio of the entire linkage group is greater than 1.82 or S. bicolor enriched if it is smaller than 0.55 (calculated for 105 individuals by a Chi-squared test with 1 degree of freedom and an alpha value of 0.001), otherwise it is allele balanced (Table 3).
In the H4-derived population, six chromosomes (2, 3, 4, 7, 8, and 10) are largely congruent with the expected four linkage groups, although allele balanced groups are fragmented and do not provide full chromosome coverage of 4 and 8. Chromosome 1 is largely covered by both S. halepense and S. bicolor enriched groups, with three allele balanced fragmented linkage groups covering non-overlapping parts of the chromosome. Chromosome 2 has two S. halepense enriched groups and one S. bicolor enriched group but only one allele balanced group, with the less S. halepense enriched group (average 2.54 segregation ratio) possibly reflecting segregation distortion. For chromosomes 5 and 6, we only find one allele balanced linkage group, with both S. halepense enriched and one S. bicolor enriched (6) group only partly covering the chromosome(s). No linkage group segregating with an average ratio not significantly different from 1 was found on chromosome 9, perhaps suggesting a high density of duplex markers.
In the H6-derived population, chromosomes 6 and 7 have four linkage groups with the expected segregation ratios (albeit with incomplete chromosome coverage), while chromosomes 1 and 4 both have one S. bicolor enriched group but only one balanced group and two S. halepense enriched groups—this may reflect segregation distortion because both linkage group 1B and 4B have segregation ratios of 2.27 and 2.64. Chromosomes 2, 5, 9, and 10 each had only one allele balanced linkage group, while chromosome 8 had no allele balanced linkage groups. Chromosome 3 was particularly unusual, with a total of five linkage groups, deviating from our model in having two S. halepense enriched groups. However, the two allele balanced groups were extremely sparse, with questions about whether they truly overlap. If in fact they do not overlap, then segregation distortion could account for the extra S. halepense enriched group.
Detailed descriptions for each chromosome can be found in Supplementary File S1. Genetic maps can be found in Supplementary File S2.
Segregation Distortion
From the 2240 filtered markers, we detected totals of 53 and 80 SNP markers enriched for S. halepense alleles in the H4- and H6-derived populations, respectively, with heterozygote versus homozygote ratios significantly higher than 5:1 (P < 0.05, df = 1). Noting that these frequencies (53 and 80) are near the levels that could be expected by chance, further evidence was considered to discern whether some of these were true positives. The most compelling case for segregation distortion can be made for 22 markers significant at an alpha level of 0.05 in not just one but both populations. Finally, 57 markers are found significant from pooling the result of two populations (Supplementary File S3 and Figure 3). Regions on chromosomes 2 (1.06–4.68 Mb), 7 (1.20–6.16 Mb), 8 (1.81–5.33 Mb), and 9 (47.5–50.1 Mb) harbored at least three markers showing significant segregation distortion in each population. Interestingly, those regions completely lack markers segregating at 1:1 ratios, indicating aberrant transmission affected by selection or illegitimate recombination, hypotheses that warrant further investigation.
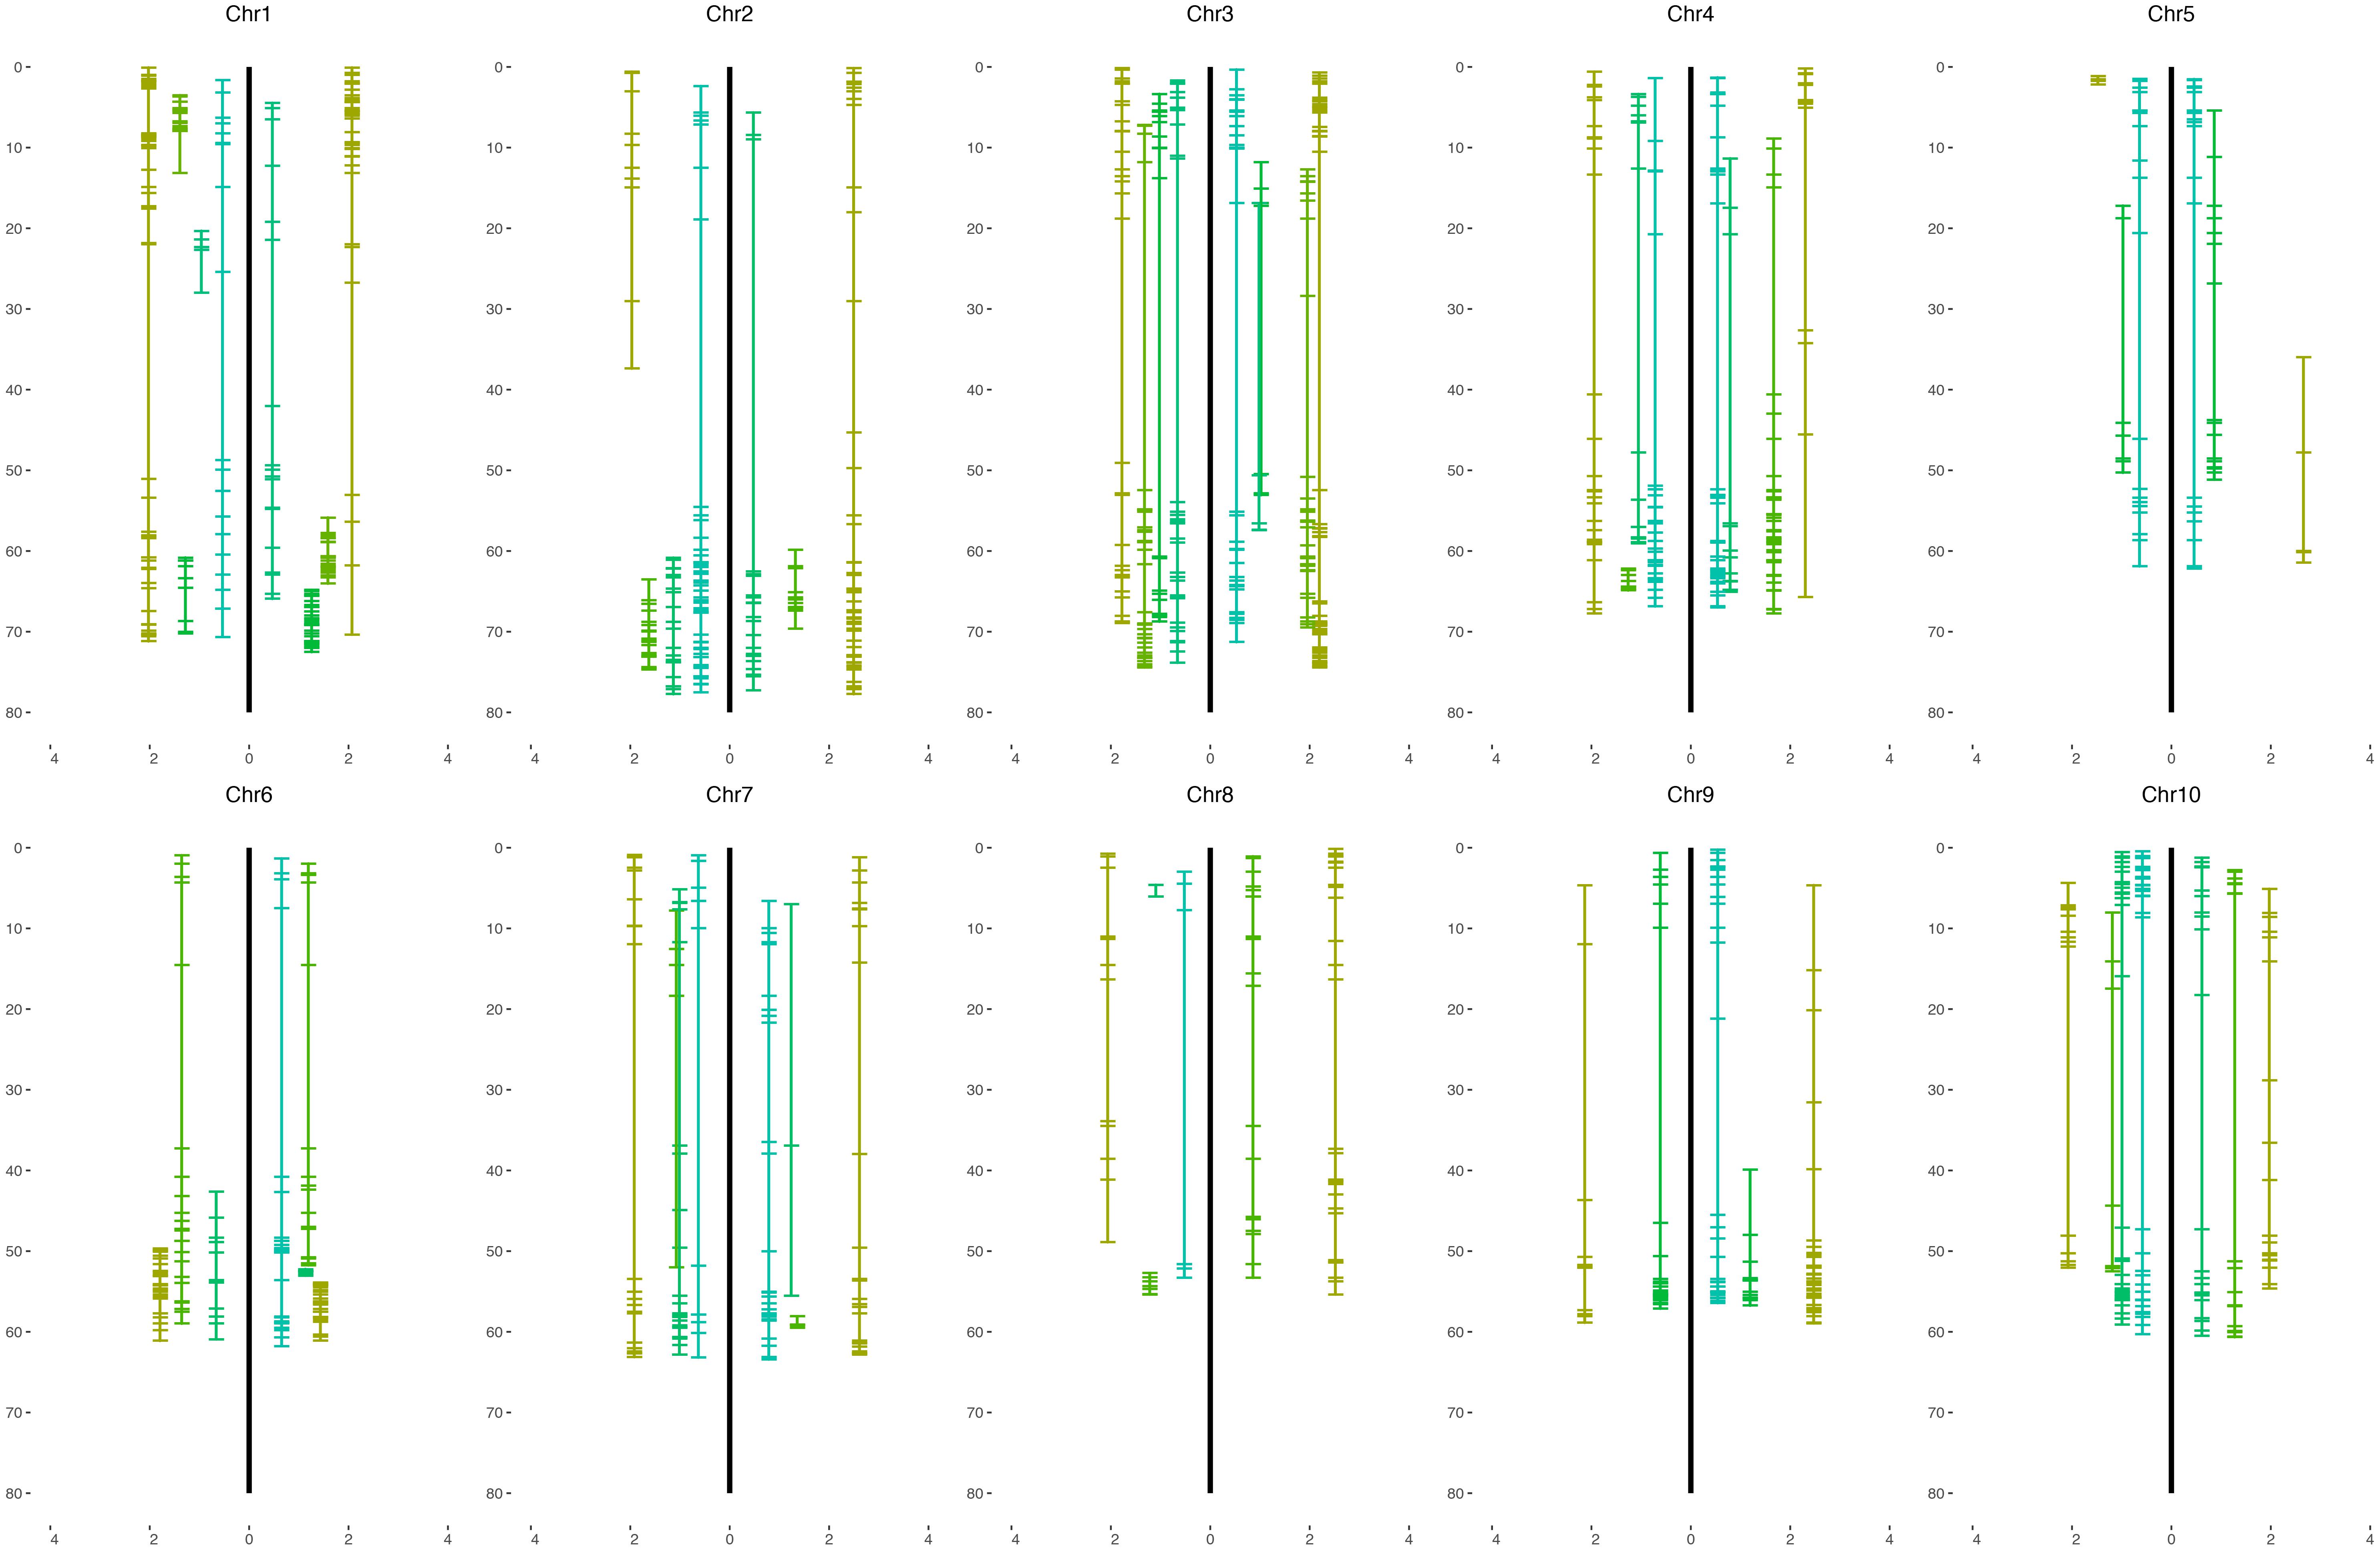
Figure 3. Physical coverage of the sorghum genome by each S. bicolor BTx623 × S. halepense G9E linkage group. The H4 population is on the left of the black line and the H6 population is on the right. The x-axis is the segregation ratio after square root transformation and that of the H4 population (left) is assigned a negative sign.
Genomic Composition of S. halepense
Noting that S. halepense is a naturally occurring polyploid thought to derive from hybridization between S. bicolor and S. propinquum, to investigate its genomic composition we performed SNP “calling” with four genotypes: S. bicolor IS3620C, a race “guinea” accession that is highly diverged from BTx623 as a control; two S. propinquum accessions; and S. halepense. After filtering (see section “Materials and Methods”), we obtained a total of 8,703,936 SNP markers genome-wide with 1,777,782 (36.64%) identical to BTx623, 744,924 (15.35%) identical to S. propinquum, 447,479 (9.22%) heterozygous with one allele each from S. bicolor and S. propinquum (Table 4), 1,873,115 (38.61%) non-progenitor alleles, presumably arising from new mutation, and 3,852,257 unknown alleles due to missing data or polymorphism in S. bicolor (not included in calculating the percentages). A much smaller sample with SNP markers only from the genetic maps was also categorized into groups matching S. bicolor, S. propinquum alleles, and new mutations. For mapped SNP markers that were not polymorphic between the divergent S. bicolor races represented by BTx623 and IS3620C, a total of 36.72 and 42.41% of S. halepense loci retained S. propinquum alleles, while 52.48 and 46.56% are novel in the H4- and H6-derived populations, respectively (Table 4).

Table 4. Inferred SNP origins in the H4 and H6 populations of S. bicolor BTx623 × S. halepense G9E and in the whole genome.
The distribution of S. halepense alleles putatively derived from S. bicolor and S. propinquum indicates extensive recombination between progenitor chromosomes. There are only 26 (16 in H4, 19 in H6, and nine in both) non-random “runs” of 3 or more consecutive mapped loci with S. propinquum derived alleles, covering roughly 18.7% (H4) and 11.3% (H6) of the genome (Table 5).
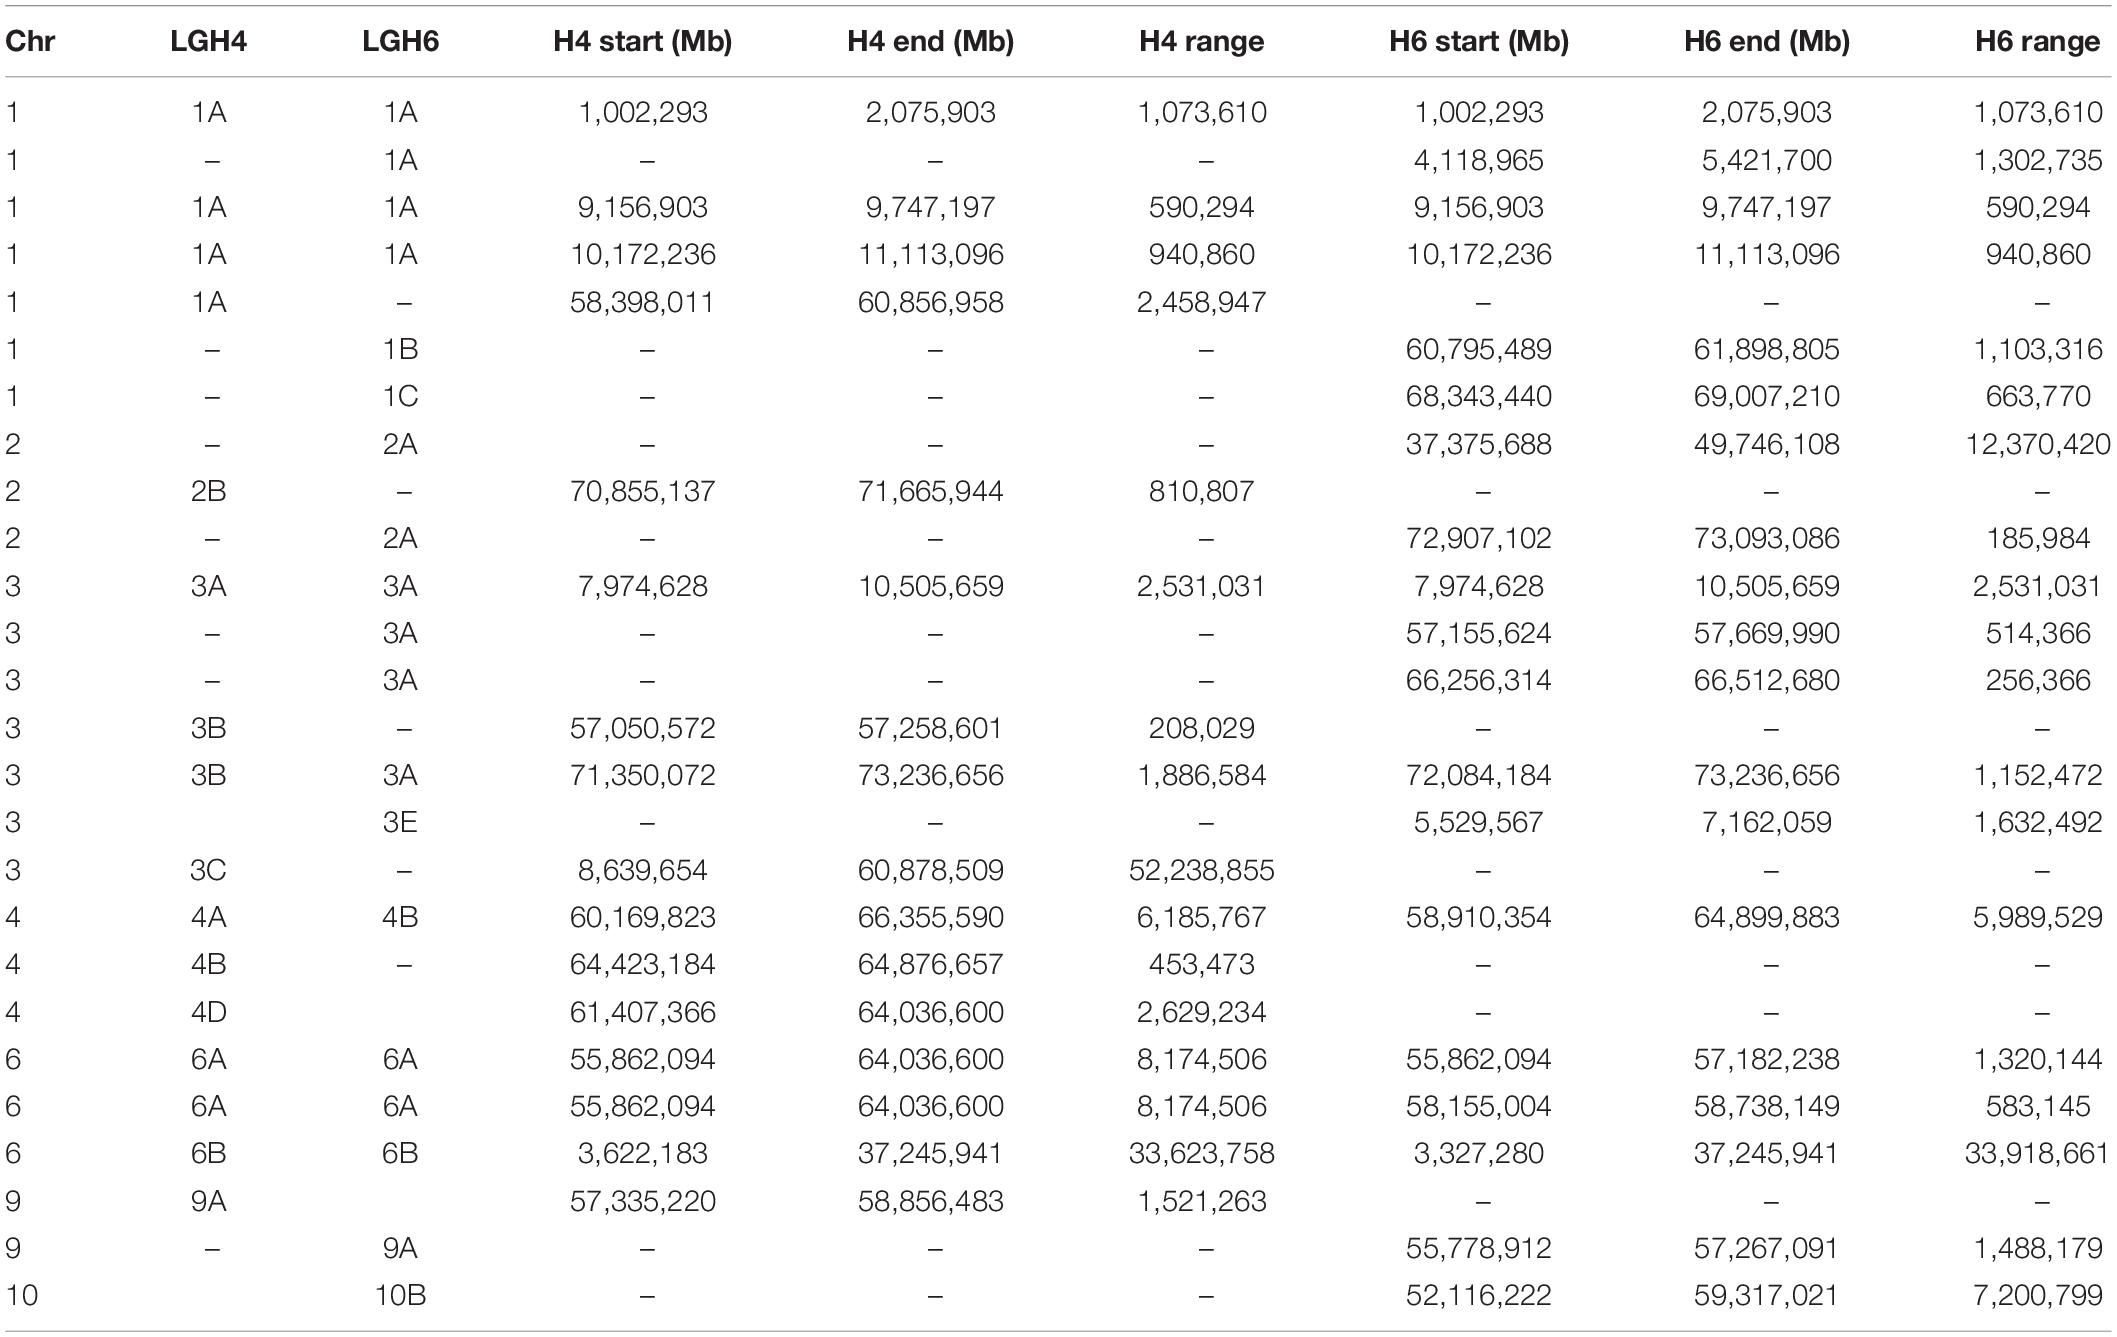
Table 5. S. halepense G9E genomic regions with non-random “runs” of more than three consecutive S. propinquum alleles.
Discussion
Genetic maps of two BC1F1 populations derived from crossing of S. bicolor BTx623 and S. halepense G9E provide important new information about the genome-wide transmission genetics of crosses which may have aided the spread across six continents of S. halepense (“Johnsongrass”), and confer risks to “escape” of sorghum genes that could make S. halepense more difficult to control. Identification of DNA markers and construction of genetic maps will facilitate marker-trait association analysis and comparative studies with other sorghum populations. Revealing chromosomal characteristics, especially identifying non-random patterns of DNA marker distribution, provides information about underlying features of sorghum genome organization. An SNP profile sampling the breadth of the Sorghum genus illustrates the evolutionary path and fate of alleles from progenitors of S. halepense.
GBS and Genetic Mapping in Polyploids
While GBS is a cost- and time-efficient method of finding SNP markers (Elshire et al., 2011; Poland et al., 2012), our coverage of each locus was not high enough to differentiate heterozygous genotypes with different dosages—nonetheless, we obtained adequate numbers of SNP markers to construct linkage maps in these two populations using allele presence/absence, and the unmapped markers may still be useful in analysis of marker-trait association.
For each of the basic sorghum chromosomes, we expect to find one linkage group segregating with a ratio of 5:1 (heterozygotes: homozygotes) derived from homozygous S. halepense loci, two linkage groups segregating with ratios of 1:1 from heterozygous loci on different S. halepense homologs, and one linkage group segregating with a ratio of 1:5 derived from homozygous S. bicolor loci.
Genetic maps of 722 and 795 loci comprising 38 and 36 linkage groups were generally congruent with the expected four linkage groups for each sorghum chromosome. However, noting that about 300 markers were necessary for the sorghum chromosomes to coalesce into largely complete linkage groups (Chittenden et al., 1994), it was not surprising to find incomplete chromosome coverage by some linkage groups. Marker distribution patterns of the H4 and H6-derived populations are generally similar (Figure 4), although varying somewhat in the number and segregation patterns of homologous chromosomes, suggesting differences in allele dosage. We consistently found at least one linkage group for each sorghum chromosome enriched with S. halepense alleles, segregating with ratios greater than 1.82 (heterozygotes: homozygotes), which is the upper 95% confidence limit for simplex markers segregating with a ratio of 1:1 (Table 1). We found one to three allele balanced linkage groups segregating with average ratios near 1 for most chromosomes; failure of finding two allele balanced linkage groups may be due to either fragmented pieces covering different portion of the chromosome, independent segregation from different homologous S. halepense chromosomes or not enough markers to coalesce the linkage group. In three cases (H4-2, H6-1, 4), segregation distortion along much of a linkage group appeared to shift otherwise allele-balanced groups into the S. halepense enriched category.
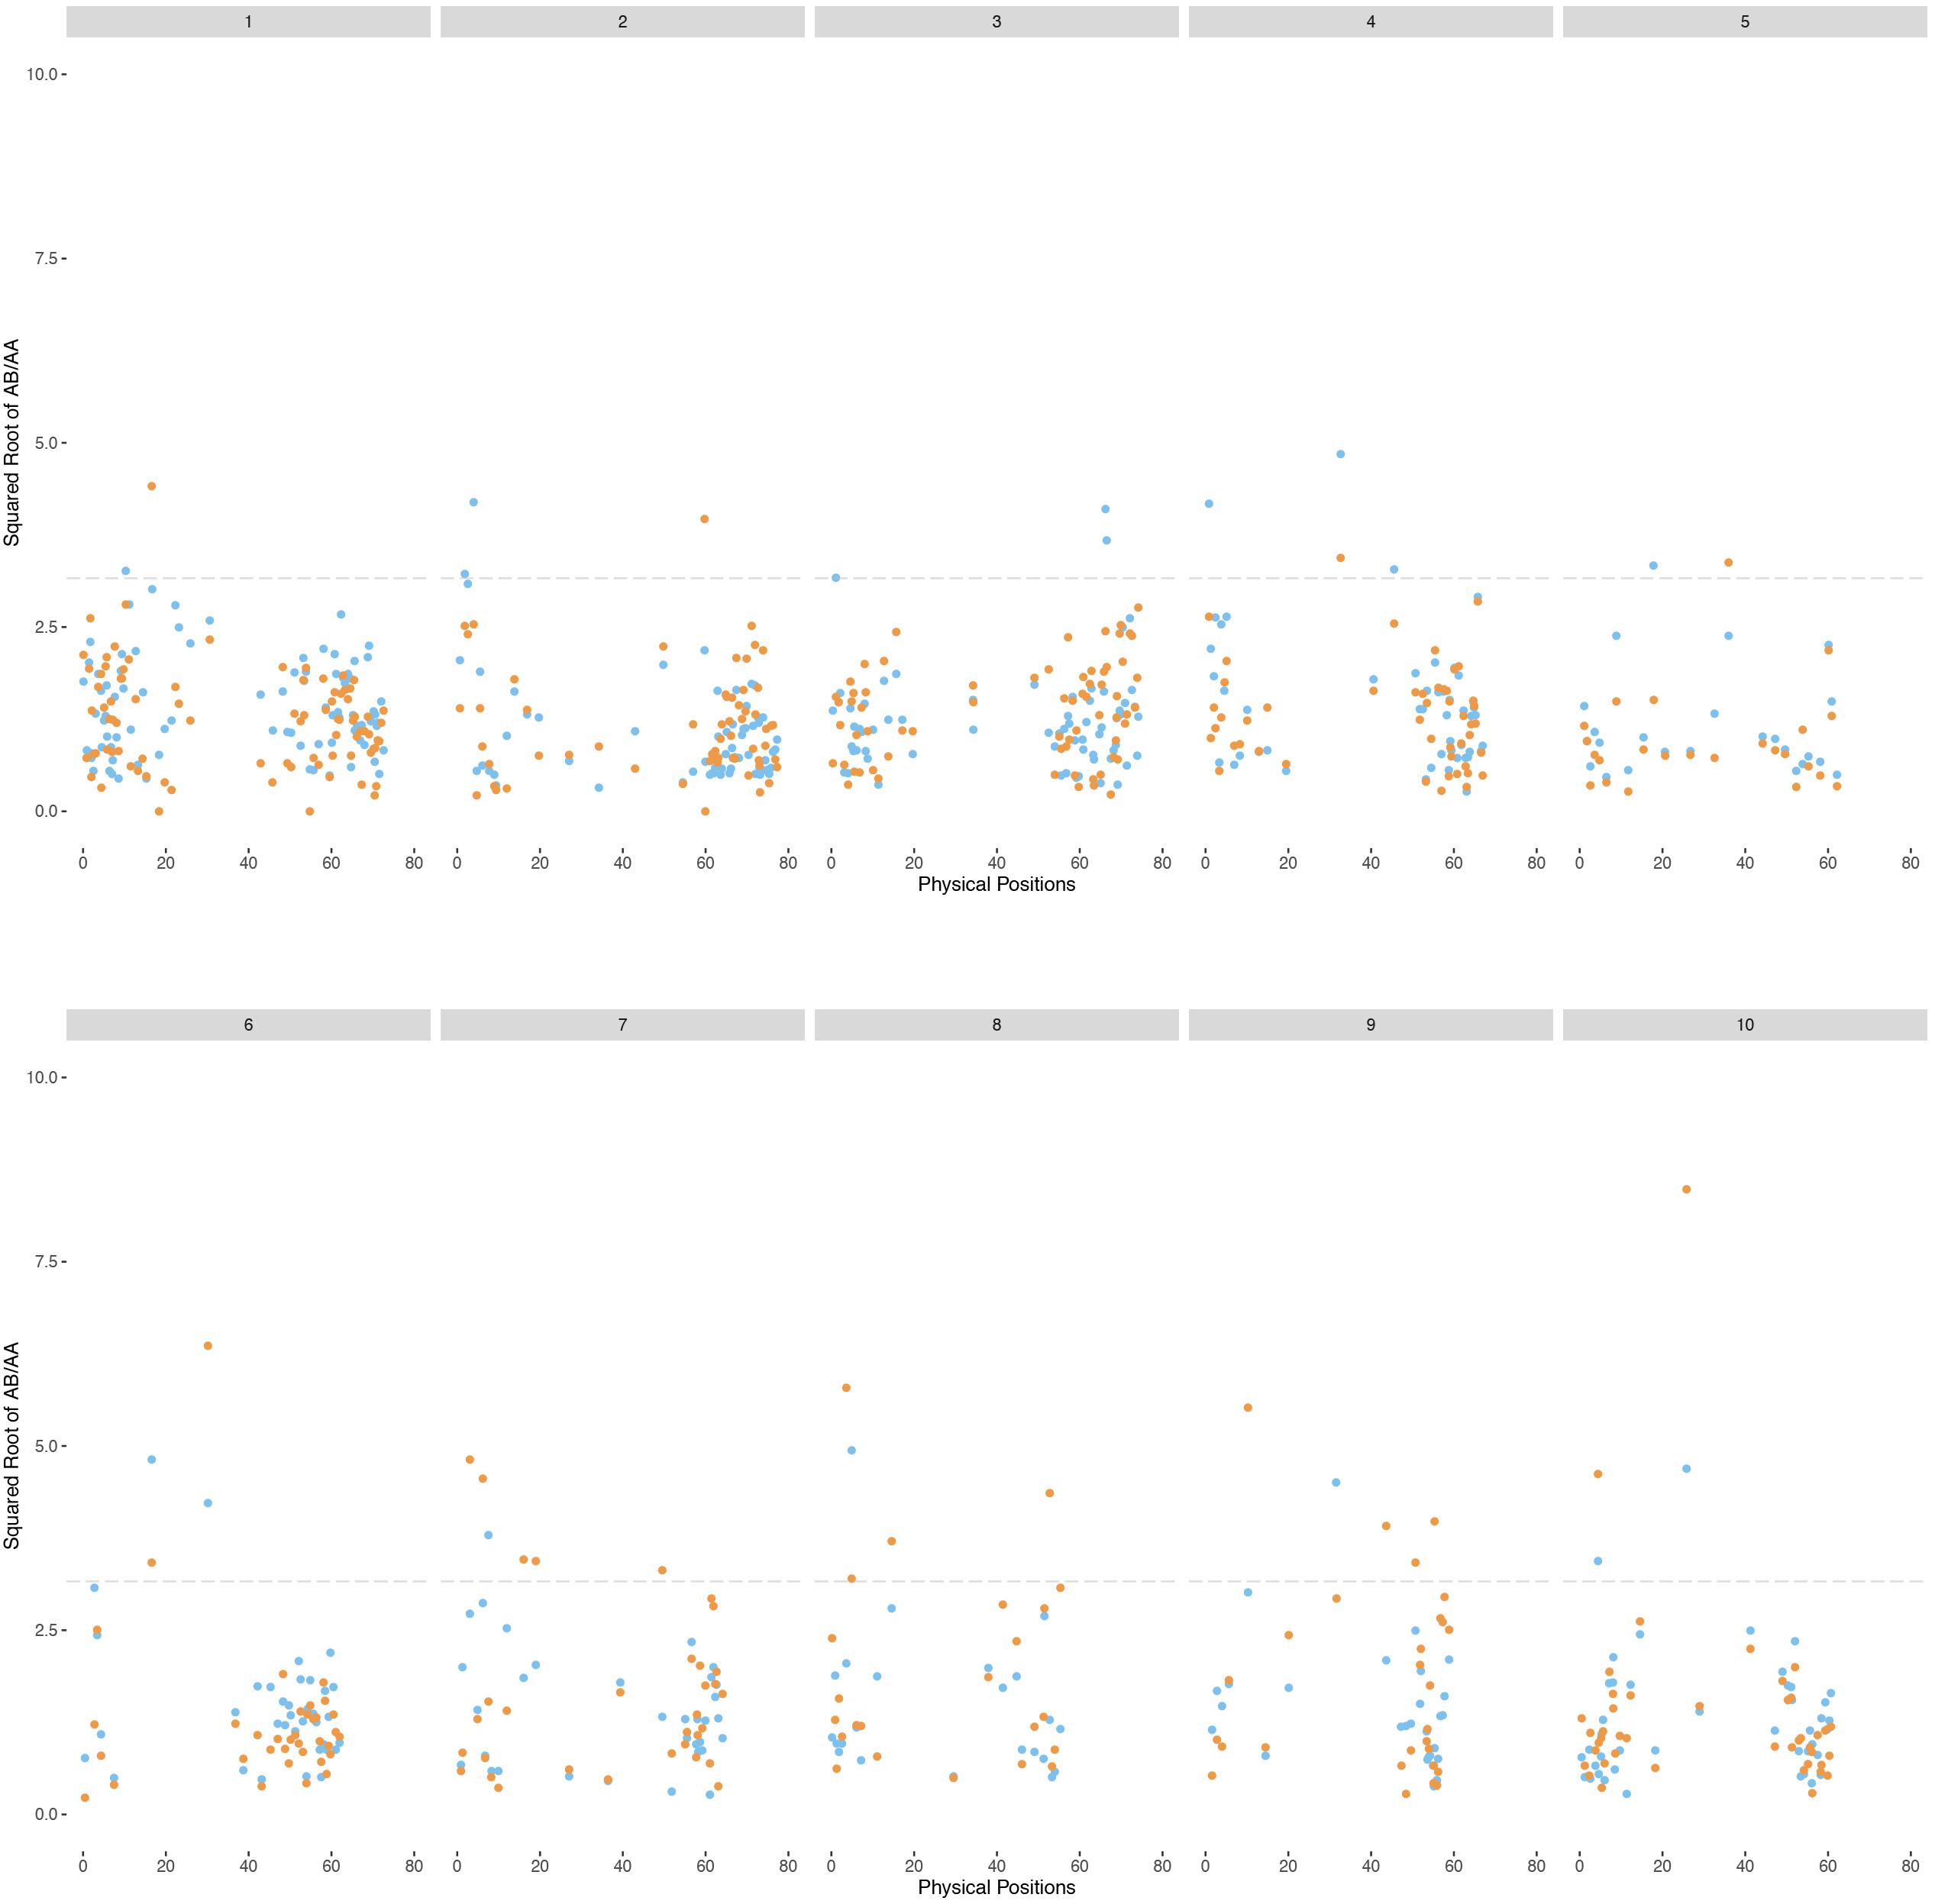
Figure 4. Patterns of segregation of the BC1F1 populations of S. bicolor BTx623 × S. halepense G9E based on the sorghum chromosomes. Square root transformation of the ratio of AB/AA for each marker are plotted in blue (H4-derived population) or orange (H6). AA is the homozygous genotype while AB is the heterozygous genotype.
In principle, S. halepense enriched markers (segregating with ratios of approximately 5:1) and S. bicolor enriched markers (1:5) might comprise repulsion-phase associations of disomic alleles. To test this hypothesis, we reversed the genotyping of groups segregating with patterns of 1:5 and tried merging and ordering them together with groups segregating near 5:1. Such pairs of linkage groups either failed to coalesce or were only loosely connected to each other with relatively large genetic distances. Therefore, linkage groups segregating with average ratios of approximately 5:1 and 1:5 appear not to be in the repulsion state, although it remains possible that the sample sizes of the two populations are not large enough to detect linkage between some loci (Wu et al., 1992).
Chromosomes 5, 6, 8, and 9 are of particular interest, in that we fail to find linkage groups for certain ratios, or markers only cover parts of the corresponding sorghum chromosomes, suggesting aberrant chromosomal behavior caused by factors such as selection or preferential pairing. Only small portions of chromosomes 5 and 6 are covered by markers enriched with S. halepense alleles. A previous study (Bowers et al., 2003) of S. bicolor BTx623 × S. propinquum F2 population discovered a ribosomal DNA-enriched region with S. propinquum-dominated loci spanning 32.3–40 cM on chromosome 5, corresponding to 5–20 Mb in physical distance (Zhang et al., 2013). We find few S. halepense alleles in this region (Figure 4), possibly due to selection favoring an rDNA allele. Similarly, a large heterochromatin block on sorghum chromosome 6 is enriched for S. bicolor alleles. Chromosomes 8 and 9 each have a paucity of markers segregating with a ratio of 1:1. Further investigation is needed to understand these biases of marker distribution across the genome.
Segregation Distortion
The overall distributions of segregation (Figure 1) in H4- and H6-derived populations suggest more intermediate than extreme segregation ratios (chromosome segregation and maximum equational segregation), consistent with other autopolyploids (Jannoo et al., 2004; Stift et al., 2008). Segregation distorted regions in these two populations may have causes including illegitimate recombination, unusual chromosomal events such as translocation and gene conversion (Wang et al., 2009), and gametic or zygotic selection. Fitness of progeny associated with particular alleles is being further investigated by QTL mapping. Regions of the S. halepense genome under strong selection may provide relatively “safe landing sites” for transgenes, i.e., with strong selection for S. halepense alleles reducing crop-to-weed gene flow from cultivated sorghum (Arriola and Ellstrand, 1996). With many different segregation patterns occurring in these populations, testing for segregation distorted regions requires stringent measures to avoid false positives. Nonetheless, four regions, on chromosomes 2 (1.06–4.68 Mb), 7 (1.20–6.16 Mb), 8 (1.81–5.33 Mb), and 9 (47.5–50.1 Mb), consistently have more S. halepense alleles than expected, and one region on chromosome 6 (0–40 Mb) has fewer than expected (Supplementary File S3).
Markers displaying segregation distortion might be linked to genes affecting fitness, for example, controlling fertility. To date, three sorghum genes controlling fertility have been located (Klein et al., 2005; Jordan et al., 2010, 2011), all proposed to encode pentatricopeptide repeat (PPR) proteins that are essential in the post-transcriptional process (Schmitz-Linneweber and Small, 2008). The interval on chromosome 2 (1.06–4.68 Mb) enriched for S. halepense alleles might be associated with Rf2, which is within the region from 5.4 to 5.7 Mb (Jordan et al., 2010). Similarly, the chromosome 8 interval (43.98–55.35 Mb in H6) enriched for S. halepense alleles in the H6 population harbors Rf1, based on flanking SSR markers Xtxp18-Xtxp250 located from 50.5 to 51.0 Mb. Segregation distortion on the short arm of chromosome 8 (1.81–5.33 Mb) overlaps with a region that has experienced frequent gene conversion (0.94–2.8 Mb), a mechanism that may cause segregation distortion (Wang et al., 2009, 2011).
The risk of “gene escape” into S. halepense constrains improvement of sorghum through biotechnology—many substantial benefits that could be realized by commercial use of transgenic S. bicolor are sacrificed due to risk of transgene escape into Johnsongrass, which has spread across more of the United States than sorghum is cultivated in, and continues to spread.
An attractive method for containment that is potentially effective and has minimal risk of public opposition is the targeting of transgenes to genomic regions recalcitrant to gene flow from sorghum. We identify several such candidate regions here, albeit based only on segregation in two populations derived from a cross between a single S. halepense genotype and an S. bicolor elite inbred, in a single environment. Clearly, the use of such regions for gene containment will depend first upon validating that the observed segregation distortions are reproduced in a broad sampling of genotypes and environments. Further, targeting of transgenes will require greater clarity as to the physical bounds of the genomic region that is recalcitrant to gene flow—such information might be obtained from fine-scale study either of large segregating populations or of large numbers of diverse accessions collected across the United States (for example), to precisely determine the loci responsible for segregation distortion in these regions. The co-evolution of its S. bicolor- and S. propinquum-derived subgenomes to adapt to cohabitation of a common nucleus in polyploid S. halepense may have resulted in many small chromosomal regions in which introgression from one ancestor may reduce fitness.
Evolution of S. halepense
The S. halepense chromosomes consist of largely random distributions of S. bicolor-derived, S. propinquum-derived, and novel alleles, which indicates extensive recombination between S. bicolor and S. propinquum-derived “subgenomes.” It has been controversial whether S. halepense is an allo- or auto-tetraploid (Endrizzi, 1957; de Wet, 1978; Hoang-Tang and Liang, 1988; Fernandez et al., 2013). Since progenies of S. bicolor × S. propinquum crosses are fertile and show near-normal recombination, our previous studies (Paterson et al., 1995; Kong et al., 2013) have favored that S. halepense was auto-tetraploid. Comparing segregation patterns among two mapping populations and SNP distributions across the entire genome each further support the hypothesis that S. halepense is an autotetraploid, with its chromosomes a mosaic of alleles from S. bicolor, S. propinquum, and novel mutations (Table 4). Nevertheless, we found a total of 26 regions of the genome in either H4- or H6-derived population with non-random distribution of consecutive S. propinquum alleles in both populations (Table 5), including a total of eight regions occurring in both populations, on chromosomes 1 (3 regions), 3 (2), 4 (1), and 6 (2).
Data Availability Statement
The raw data supporting the conclusions of this article will be made available by the authors, without undue reservation, to any qualified researcher.
Author Contributions
WK performed the experiment, conducted the analysis, and drafted the manuscript. PN and TC developed the populations, collected phenotypic data, and conducted the analysis. VG, GP, CL, JR, and RC collected phenotypic and genotypic data. HT performed GBS sequencing. AP supervised the experiment and drafted and revised the manuscript.
Funding
We appreciate the support of the USDA Biotechnology Risk Assessment Program (2012-01658 to AP and TC), USAID Feed The Future program (AID-OAA-A-13-00044 to AP and TC), and NIFA Global Food Security CAP (2015-68004-23492 to AP).
Conflict of Interest
The authors declare that the research was conducted in the absence of any commercial or financial relationships that could be construed as a potential conflict of interest.
Supplementary Material
The Supplementary Material for this article can be found online at: https://www.frontiersin.org/articles/10.3389/fpls.2020.00467/full#supplementary-material
TABLE S1 | Loci with non-Mendelian segregation combined for two BC1F1 populations of S. bicolor BTx623 × S. halepense G9E.
FILE S1 | Details for each chromosome.
FILE S2 | Details of genetic maps for the S. halepense-derived H4 and H6 populations.
FILE S3 | Loci with non-Mendelian segregation combined for two BC1F1 populations of S. bicolor BTx623 × S. halepense G9E.
References
Aljanabi, S. M., Forget, L., and Dookun, A. (1999). An improved and rapid protocol for the isolation of polysaccharide- and polyphenol-free sugarcane DNA. Plant Mol. Biol. Rep. 17, 281–281.
Andolfatto, P., Davison, D., Erezyilmaz, D., Hu, T. T., Mast, J., Sunayama-Morita, T., et al. (2011). Multiplexed shotgun genotyping for rapid and efficient genetic mapping. Genome Res. 21, 610–617. doi: 10.1101/gr.115402.110
Arriola, P. E., and Ellstrand, N. C. (1996). Crop-to-weed gene flow in the genus Sorghum (Poaceae): spontaneous interspecific hybridization between johnsongrass, Sorghum halepense, and crop Sorghum, S-bicolor. Am. J. Bot. 83, 1153–1159. doi: 10.1002/j.1537-2197.1996.tb13895.x
Bowers, J. E., Abbey, C., Anderson, S., Chang, C., Draye, X., Hoppe, A. H., et al. (2003). A high-density genetic recombination map of sequence-tagged sites for Sorghum, as a framework for comparative structural and evolutionary genomics of tropical grains and grasses. Genetics 165, 367–386.
Broman, K. W., Wu, H., Sen, S., and Churchill, G. A. (2003). R/qtl: QTL mapping in experimental crosses. Bioinformatics 19, 889–890. doi: 10.1093/bioinformatics/btg112
Chittenden, L., Schertz, K., Lin, Y., Wing, R., and Paterson, A. (1994). A detailed RFLP map of Sorghum bicolor x S. propinquum, suitable for high-density mapping, suggests ancestral duplication of Sorghum chromosomes or chromosomal segments. TAG Theor. Appl. Genet. 87, 925–933. doi: 10.1007/bf00225786
Cox, S., Nabukalu, P., Paterson, A., Kong, W., and Nakasagga, S. (2018). Development of perennial grain Sorghum. Sustainability 10:172. doi: 10.3390/su10010172
Cox, T. S., Bender, M., Picone, C., Van Tassel, D. L., Holland, J. B., Brummer, E. C., et al. (2002). Breeding perennial grain crops. Crit. Rev. Plant Sci. 21, 59–91.
Dale, P. J. (1992). Spread of engineered genes to wild relatives. Plant Physiol. 100, 13–15. doi: 10.1104/pp.100.1.13
Danecek, P., Auton, A., Abecasis, G., Albers, C. A., Banks, E., Depristo, M. A., et al. (2011). The variant call format and VCFtools. Bioinformatics 27, 2156–2158. doi: 10.1093/bioinformatics/btr330
de Wet, J. M. J. (1978). Systematics and evolution of Sorghum sect. Sorghum (Gramineae). Am. J. Bot. 65, 477–484. doi: 10.1002/j.1537-2197.1978.tb06096.x
Ellstrand, N. C. (2001). When transgenes wander, should we worry? Plant Physiol. 125, 1543–1545. doi: 10.1104/pp.125.4.1543
Elshire, R. J., Glaubitz, J. C., Sun, Q., Poland, J. A., Kawamoto, K., Buckler, E. S., et al. (2011). A robust, simple genotyping-by-sequencing (GBS) approach for high diversity species. PLoS One 6:e19379. doi: 10.1371/journal.pone.0019379
Endrizzi, J. E. (1957). Cytological Studies of some Species and Hybrids in the Eu-Sorghums. Bot. Gazette 119, 1–10. doi: 10.1086/335954
Fernandez, L., De Haro, L. A., Distefano, A. J., Martinez, M. C., Lia, V., Papa, J. C., et al. (2013). Population genetics structure of glyphosate-resistant Johnsongrass (Sorghum halepense L. Pers) does not support a single origin of the resistance. Ecol. Evol. 3, 3388–3400.
Glaubitz, J. C., Casstevens, T. M., Lu, F., Harriman, J., Elshire, R. J., Sun, Q., et al. (2014). TASSEL-GBS: a high capacity genotyping by sequencing analysis pipeline. PLoS One 9:e90346. doi: 10.1371/journal.pone.0090346
Glover, J. D., Reganold, J. P., Bell, L. W., Borevitz, J., Brummer, E. C., Buckler, E. S., et al. (2010). Increased food and ecosystem security via perennial grains. Science 328, 1638–1639. doi: 10.1126/science.1188761
Haldane, J. B. S. (1930). Theoretical genetics of autopolyploids. J. Genet. 22, 359–372. doi: 10.1007/bf02984197
Heap, I. (2012). The International Survey of Herbicide Resistant Weeds [Online]. Available: www.weedscience.org (accessed December 7 2012).
Hoang-Tang Liang, G. H. (1988). The genomic relationship between cultivated Sorghum [Sorghum bicolor (L.) Moench] and Johnsongrass [S. halepense (L.) Pers.]: a re-evaluation. Theor. Appl. Genet. 76, 277–284. doi: 10.1007/bf00257856
Jannoo, N., Grivet, L., David, J., D’hont, A., and Glaszmann, J. C. (2004). Differential chromosome pairing affinities at meiosis in polyploid sugarcane revealed by molecular markers. Heredity 93, 460–467. doi: 10.1038/sj.hdy.6800524
Jordan, D. R., Klein, R. R., Sakrewski, K. G., Henzell, R. G., Klein, P. E., and Mace, E. S. (2011). Mapping and characterization of Rf 5 : a new gene conditioning pollen fertility restoration in A1 and A2 cytoplasm in Sorghum (Sorghum bicolor (L.) Moench). Theor. Appl. Genet. 123, 383–396. doi: 10.1007/s00122-011-1591-y
Jordan, D. R., Mace, E. S., Henzell, R. G., Klein, P. E., and Klein, R. R. (2010). Molecular mapping and candidate gene identification of the Rf2 gene for pollen fertility restoration in Sorghum [Sorghum bicolor (L.) Moench]. Theor. Appl. Genet. 120, 1279–1287. doi: 10.1007/s00122-009-1255-3
Klein, R. R., Klein, P. E., Mullet, J. E., Minx, P., Rooney, W. L., and Schertz, K. F. (2005). Fertility restorer locus Rf1 [corrected] of Sorghum (Sorghum bicolor L.) encodes a pentatricopeptide repeat protein not present in the colinear region of rice chromosome 12. Theor. Appl. Genet. 111, 994–1012. doi: 10.1007/s00122-005-2011-y
Kong, W., Jin, H., Franks, C. D., Kim, C., Bandopadhyay, R., Rana, M. K., et al. (2013). Genetic Analysis of Recombinant Inbred Lines for Sorghum bicolor × Sorghum propinquum. G3 3, 101–108. doi: 10.1534/g3.112.004499
Li, H. (2011). A statistical framework for SNP calling, mutation discovery, association mapping and population genetical parameter estimation from sequencing data. Bioinformatics 27, 2987–2993. doi: 10.1093/bioinformatics/btr509
Li, H., and Durbin, R. (2009). Fast and accurate short read alignment with Burrows-Wheeler transform. Bioinformatics 25, 1754–1760. doi: 10.1093/bioinformatics/btp324
Mather, K. (1935). Reductional and equational separation of the chromosomes in bivalents and multivalents. J. Genet. 30, 53–78. doi: 10.1007/bf02982205
McWhorter, C. G. (1971). Introduction and Spread of Johnsongrass in the United States. Weed Sci. 19, 496–500. doi: 10.1017/s0043174500050517
Morrell, P. L., Williams-Coplin, D., Bowers, J. E., Chandler, J. M., and Paterson, A. H. (2005). Crop-to-weed introgression has impacted allelic composition of johnsongrass populations with and without recent exposure to cultivated Sorghum. Mol. Ecol. 14, 2143–2154. doi: 10.1111/j.1365-294x.2005.02579.x
Muller, H. J. (1914). A new mode of segregation in gregory’s tetraploid primulas. Am. Nat. 48, 508–512. doi: 10.1086/279426
Oyer, E. B., Gries, G., and Rogers, B. (1959). The seasonal development of Johnson grass plants. Weeds 7, 13–19.
Paterson, A. H., Bowers, J. E., Bruggmann, R., Dubchak, I., and Grimwood, J. (2009). The Sorghum bicolor genome and the diversification of grasses. Nature 457, 551–556.
Paterson, A. H., Cox, T. S., Kong, W., and Navarro, M. (2013). “Viewpoint: multiple-harvest Sorghums toward improved food securit,” in Perennial Crops for Food Security, eds C. Batello, L. Wade, S. Cox, N. Pogna, A. Bozzini, and J. Choptiany (Athens, GA: University of Georgia).
Paterson, A. H., Schertz, K. F., Lin, Y. R., Liu, S. C., and Chang, Y. L. (1995). The weediness of wild plants - molecular analysis of genes influencing dispersal and persistence of johnsongrass, Sorghum-halepense (L) Pers. Proc. Natl. Acad. Sci. U.S.A. 92, 6127–6131. doi: 10.1073/pnas.92.13.6127
Poland, J. A., Brown, P. J., Sorrells, M. E., and Jannink, J. L. (2012). Development of high-density genetic maps for barley and wheat using a novel two-enzyme genotyping-by-sequencing approach. PLoS One 7:e32253. doi: 10.1371/journal.pone.0032253
Quinn, L., Barney, J. N., Mccubbins, J., and Endres, A. (2013). Navigating the “Noxious” and “Invasive” regulatory landscape: suggestions for improved regulation. Bioscience 63, 124–131. doi: 10.1525/bio.2013.63.2.8
R Core Team (2013). R: A Language and Environment for Statistical Computing. Vennia: R Foundation for Statistical Computing.
Sangduen, N., and Hanna, W. W. (1984). Chromosome and fertility studies on reciprocal crosses between two species of autotetraploid Sorghum: Sorghum bicolor (L.) Moench and S. halepense (L.) Pers. J. Heredity 75, 293–296. doi: 10.1093/oxfordjournals.jhered.a109936
Schmitz-Linneweber, C., and Small, I. (2008). Pentatricopeptide repeat proteins: a socket set for organelle gene expression. Trends Plant Sci. 13, 663–670. doi: 10.1016/j.tplants.2008.10.001
Stift, M., Berenos, C., Kuperus, P., and Van Tienderen, P. H. (2008). Segregation models for disomic, tetrasomic and intermediate inheritance in tetraploids: a general procedure applied to rorippa (Yellow Cress) microsatellite data. Genetics 179, 2113–2123. doi: 10.1534/genetics.107.085027
Tesso, T., Kapran, I., Grenier, C., Snow, A., Sweeney, P., Pedersen, J., et al. (2008). The potential for crop-to-wild gene flow in Sorghum in ethiopia and Niger: a geographic survey. Crop Sci. 48, 1425–1431. doi: 10.2135/cropsci2007.08.0441
Wang, X., Tang, H., and Paterson, A. H. (2011). Seventy million years of concerted evolution of a homoeologous chromosome pair, in parallel, in major Poaceae lineages. Plant Cell 23, 27–37. doi: 10.1105/tpc.110.080622
Wang, X. Y., Tang, H. B., Bowers, J. E., and Paterson, A. H. (2009). Comparative inference of illegitimate recombination between rice and Sorghum duplicated genes produced by polyploidization. Genome Res. 19, 1026–1032. doi: 10.1101/gr.087288.108
Warwick, S., and Black, L. (1983). the biology Of Canadian weeds.: 61. Sorghum halepense (L.) PERS. Can. J. Plant Sci. 63, 997–1014. doi: 10.4141/cjps83-125
Warwick, S. I., Thompson, B., and Black, L. (1984). Population variation in Sorghum halepense, Johnson grass, at the northern limits of its range. Can. J. Bot. 62, 1781–1790. doi: 10.1139/b84-242
Wu, K. K., Burnquist, W., Sorrells, M. E., Tew, T. L., Moore, P. H., and Tanksley, S. D. (1992). The detection and estimation of linkage in polyploids using single-dose restriction fragments. Theor. Appl. Genet. 83, 294–300. doi: 10.1007/bf00224274
Keywords: genetic maps, autopolyploid, genotyping by sequencing, segregation, crop-to-weed
Citation: Kong W, Nabukalu P, Cox TS, Goff VH, Pierce GJ, Lemke C, Robertson JS, Compton R, Tang H and Paterson AH (2020) Transmission Genetics of a Sorghum bicolor × S. halepense Backcross Populations. Front. Plant Sci. 11:467. doi: 10.3389/fpls.2020.00467
Received: 15 August 2019; Accepted: 30 March 2020;
Published: 30 April 2020.
Edited by:
Jose Luis Gonzalez Hernandez, South Dakota State University, United StatesReviewed by:
Melinda Yerka, University of Nevada, Reno, United StatesRichard Boyles, Clemson University, United States
Copyright © 2020 Kong, Nabukalu, Cox, Goff, Pierce, Lemke, Robertson, Compton, Tang and Paterson. This is an open-access article distributed under the terms of the Creative Commons Attribution License (CC BY). The use, distribution or reproduction in other forums is permitted, provided the original author(s) and the copyright owner(s) are credited and that the original publication in this journal is cited, in accordance with accepted academic practice. No use, distribution or reproduction is permitted which does not comply with these terms.
*Correspondence: Andrew H. Paterson, cGF0ZXJzb25AdWdhLmVkdQ==
 Wenqian Kong
 Pheonah Nabukalu2
 Andrew H. Paterson