 Qianwen Zhang
 Tongyin Li
 Qiushuang Wang
 Judson LeCompte
 Richard L. Harkess
 Guihong Bi
94% of researchers rate our articles as excellent or good
Learn more about the work of our research integrity team to safeguard the quality of each article we publish.
Find out more
ORIGINAL RESEARCH article
Front. Plant Sci., 13 March 2020
Sec. Crop and Product Physiology
Volume 11 - 2020 | https://doi.org/10.3389/fpls.2020.00280
This article is part of the Research TopicResponses of Tea Plants to Climate Change: From Molecules to EcosystemsView all 15 articles
The United States (U.S.) consumed over 80 billion servings of tea, approximately 3.8 billion gallons, in the year of 2018. With the vast majority of tea demand being met by importation, the United States became the third largest tea importer worldwide after Russia and Pakistan. As demand for domestically produced tea increases and growers expressing increasing interest in growing and producing tea, tea production became an emerging industry in the United States. Compared to major tea producing countries with centuries of growing history, tea production in the United States is limited and requires research support in many aspect of tea production including selecting suitable cultivars adapted to local climatic conditions. This study evaluated nine tea cultivars, including ‘BL1,’ ‘BL2,’ ‘Black Sea,’ ‘Christine’s Choice,’ ‘Dave’s Fave,’ ‘Large Leaf,’ ‘Small Leaf,’ ‘Sochi,’ and ‘var. assamica,’ for plant growth, leaf morphological characteristics, cold tolerance, and leaf biochemical compositions when grown in Mississippi United States with a subtropical climate. The nine tested cultivars had varying plant growth indices (PGI) and varying degrees of cold tolerance to freezing temperatures in winter, but resumed healthy growth the following spring. ‘BL2’ showed the highest PGI of 104.53 cm by February 2019, which might be helpful toward suppressing weed and early establishment of tea plantation. The nine cultivars also showed varying leaf characteristics in terms of leaf length, width, area, fresh and dry weights, and new shoot weight. There existed a diversity in leaf biochemical composition including soluble solids, carbohydrates, total polyphenols (TP), free amino acids (AA), L-theanine and caffeine among the nine cultivars and among different harvesting seasons of spring, summer, and fall within a certain cultivar. The nine cultivars in this study generally grow well in local environment. All tea samples collected from nine cultivars and three seasons were considered suitable for green tea processing with low TP/AA ratios ranging from 1.72 to 3.71 in this study.
Tea is the most popular beverage worldwide second only to water, with world consumption of 5.5 million tons in 2016 (Food and Agriculture Organization of the United Nations [FAO], 2018). The industry value for world tea consumption increased from $1.84 billion in 1990 to $12.66 billion in 2018, with a projected strong increasing trend over the next 10 years (Goggi, 2018; USDA, 2018). Tea is rich in a number of health beneficial compounds including catechin, caffeine, theanine, and other polyphenols. Polyphenols in tea are antioxidants believed to slow down aging, prevent certain types of cancer, and reduce risk of cardiovascular diseases (Sharangi, 2009; Lorenzo and Munekata, 2016). Americans consumed over 3.8 billion gallons, or more than 84 billion servings of tea in 2018, making the United States the third largest importer of tea after Russia and Pakistan, importing a total of 263 million pounds including black and green tea (Tea Association of the U.S.A., 2019). The vast majority of tea demand in the United States is met by importation. With increased demand for locally sourced food products, questions are raised regarding whether domestic production of tea is feasible.
Tea plant is a broad-leaved evergreen shrub, adapted to subtropical to tropical climates, with optimal growing temperatures of 18 to 30°C during the growing season and the ability to withstand temperatures from −16 to 40°C (Bhagat et al., 2010; Luo, 2015). They thrive in warm, humid climates with annual rainfall of 1,250 to 6,000 mm, favor humidity levels of 80 to 90% and elevations up to 2,000 m above sea level (Hajra, 2001). Successful tea plant production requires deep, light, well-drained, and acid soil with pH ranging from 4.5 to 5.5 (Willson and Clifford, 1992; Hajra, 2001; Ruan et al., 2007; Gascoyne et al., 2016). In the United States tea can be grown in USDA hardiness zones 6 to 9 (Dirr, 2009). Once established, a tea plantation can have commercial productivity for decades (Wang, 2016).
As United States growers seek to diversify their crops, tea plants can potentially serve as a high-value alternative crop. Tea production effort occurs in over 16 states in the United States, including Alabama, California, Florida, Georgia, Hawai’i, Idaho, Louisiana, Maryland, Michigan, Mississippi, New Jersey, New York, North Carolina, Oregon, South Carolina, Texas, Virginia, and Washington with the majority started over the past decade and having limited production (Zee et al., 2003; Walcott, 2012; Song et al., 2012; Bell, 2014; Hardin, 2017; LeCompte, 2018). The state of Mississippi is located in a subtropical climate, having annual average temperatures ranging from 17°C in the north to 20°C along the coast. Annual precipitation ranges from 1270 to 1650 mm (50–65 inches) and fairly evenly distribute throughout the year (Mississippi State University, 2019). There are currently three small scale commercial tea farms in Mississippi. Growing tea in Mississippi is subjected to challenges including periods of drought and flood, temperatures exceeding 35°C for over 100 days annually, and potential cold damage with lowest temperatures down to −14°C. Compared to centuries of growing history of tea in leading tea producing countries including China and India (Food and Agriculture Organization of the United Nations [FAO], 2015), there lacks research-based information to guide farmers on growing tea in the United States. The availability of suitable cultivars adapted to local climates is fundamental to an emerging tea industry in the United States.
Tea germplasms have been evaluated using morphology, biochemical compositions, molecular markers, and sensory evaluations (Feng et al., 2014; Li Y. et al., 2016; Wambulwa et al., 2016). Fresh leaf characteristics including leaf size, area, and fresh weight are commonly evaluated in breeding programs for yield potential. The final quality of tea product is highly associated with leaf biochemical composition including polyphenols, soluble solids, carbohydrates, amino acids (AA), theanine and caffeine (Willson and Clifford, 1992; Li X. et al., 2016). There exists large variations in physical characteristics and chemical composition in leaves of different germplasms (Willson and Clifford, 1992; Gai et al., 2019). Growing environment including soil, temperature, precipitation, light, seasonality, and altitude affect leaf characteristics and biosynthesis of important chemicals, thus the final tea quality (Lee et al., 2010; Wang et al., 2011; Wei et al., 2011; Han et al., 2017; Ahmed et al., 2019). This study is of the few recent research efforts to evaluate tea cultivars grown in Southeastern United States. The objectives of this study were to investigate plant growth and leaf morphology of nine tea cultivars; and to investigate chemical compositions in leaves of these cultivars in different seasons of the year (spring, summer, and fall) when grown in Mississippi, United States.
One-year-old tea plants propagated from stem cuttings grown in one-gallon containers were transplanted into the field located at the R. R. Foil Plant Research Center at Mississippi State University (USDA Hardiness Zone 8a; 33°29′N 88°47′W) in spring 2017. The nine tested cultivars included: ‘BL1,’ ‘BL2,’ ‘Black Sea,’ ‘Christine’s Choice,’ ‘Dave’s Fave,’ ‘Large leaf,’ ‘Small leaf,’ ‘Sochi,’ and ‘var. assamica.’. Tea plants were pruned to a uniform height of 30.48 cm (12 inch) at transplanting and grown in full sun in Stough fine sandy loam soil with a pH of 4.9 (Brent, 1973). Plants were planted in a double row hedge, with 0.76 m (2.5 ft) between plants within a row, 0.91 m (3 ft) between rows within the double row, and 1.83 m (6 ft) apart between double rows center-to-center. Each plant was fertilized with controlled release fertilizer 15N-3.9P-10K (Osmocote® Plus, 15-9-12, 8–9 months, ICL Specialty Fertilizers, Summerville, SC, United States) at a rate of 110 g per plant per year based on recommended medium rate. All plants were irrigated as needed through drip irrigation. Wheat straw was used between rows to aid weed control.
Each plant was measured for plant height, width 1 and width 2, where width 1 was the greatest width of an individual plant and width 2 was the perpendicular width to width 1, in February 2018 and 2019. Plant Growth Index (PGI) was calculated as the average of plant height, width 1, and width 2. Plants were evaluated for cold tolerance in February 2018 and 2019. The percentage of foliage showing cold-damaged symptoms on each plant was recorded as described by Luo (2015). All plants were pruned to a height of 30.48 cm (12 inch) in 2018 and 50.80 cm (20 inch) in 2019 after plant growth and cold tolerance data were collected in February. Local monthly air temperature data, including average, maximum, and minimum temperatures, within the experiment duration were obtained from the USDA Natural Resources Conservation Service website (U. S. Department of Agriculture, National Resources Conservation Service [USDA-NRCS], 2019).
Leaf characteristics of each cultivar including individual leaf length, width, area, fresh, and dry weights were evaluated in Feb. 2018. For each cultivar, twenty most recent fully expanded leaves were collected from each replication (block) composed of 20 plants, with a total of four replications. Each leaf was measured for length and width (widest points apart). The twenty leaves from each replication were then passed through a leaf area meter (LI-3100C; LI-COR Biosciences, Lincoln, NE, United States) for the total leaf area, and an average was calculated for individual leaf area. Fresh weight of the 20 leaves from each replication was measured, and an average individual leaf fresh weight was calculated. The leaves were then oven dried at 60°C until no weight change for their average dry weight. Fresh weight of 100 new shoots in each cultivar, composed of one terminal bud and two leaves, were also measured with four replications.
Plant photosynthetic activity was measured between 1,000 and 1,300 HR on September 20, 2018 using a portable photosynthesis system (LI-6400XT; LI-COR Biosciences, Lincoln, NE, United States). One plant from each replication was randomly selected to measure photosynthetic activities. For each plant, one most recent fully expanded leaf, not shaded by other leaves, was enclosed into a 2 cm2 leaf chamber for the photosynthetic measurements. Photosynthetically active radiation (PAR) of 1500 μmol m–2 s–1 and reference CO2 concentration of 400 μmol mol–1 were maintained inside the leaf chamber during measurements. Block temperature in the leaf chamber was maintained according to the air temperature on the measurement date. Net photosynthetic rate (Pn), stomatal conductance (gs), and leaf transpiration rate (Trmmol) were measured on each selected plant.
New shoots containing one terminal bud and two leaves were harvested on 10 April, 12 July, and 18 October 2018 to represent tea harvests in spring (first flush of growth), summer, and fall. New shoots from each harvest were then oven-dried at 60°C and ground to pass a 40-mesh (0.42 mm) sieve using a Wiley mini mill (Thomas Scientific, Waltham, MA, United States). Dry shoot sample of 0.6 g were infused with 100 mL freshly boiled deionized water for 45 min. Then the supernatant was filtered through filter paper (Grade 1, GE Healthcare Bio-Sciences Corp., Marlborough, MA, United States) using a vacuum pump. After filtration, deionized water was added to the supernatant to reach a final volume of 100 mL. Three tea extracts (subsamples) were prepared for each replication and then used to test for biochemical compositions including soluble solids, carbohydrates, total polyphenols, free AAs, L-theanine and caffeine content. All biochemical compositions were presented as percentage on a dry weight basis.
Soluble solid content was measured following the protocol of Xu et al. (2018) with minor modifications. Tea extract of 50 mL was added to a weighed evaporation dish and evaporated to dryness, then oven-dried at 120°C (for approximately 2 h) to a constant weight and then cooled to room temperature in a desiccator. The residual solids were then measured to calculate soluble solid content.
Carbohydrates in tea extract were measured by modified anthrone-sulphuric acid method using dextrose as the standard as described by Fan et al. (2017). Anthrone-sulphuric acid solution (1 g L–1 anthrone dissolved in sulphuric acid) of 8 mL was added to 1 mL of tea extract. Then the mixture was placed in a water bath at 100°C for 7 min. After cooling to room temperature, absorbance of the solution at 620 nm was determined using a 1 cm photometer disposable cuvette and a spectrophotometer (Nicolet evolution 100, Thermo Scientific, Waltham, MA, United States). Dextrose, anthrone and sulfuric acid reagent were equal or above to ACS grade, purchased from Thermo Fisher Scientific (Waltham, MA, United States).
Caffeine content in tea extract was analyzed by high performance liquid chromatography (HPLC) (1260 Infinity II series; Agilent Technologies, Willington, DE, United States) according to Wang et al. (2019) with modifications. Tea extract was filtered through a 0.22 μm membrane. HPLC analyses were performed using a diode array detector (G1315C Diode-array Detector, Agilent Technologies) with an injection volume of 10 μL, flow rate of 1 mL min–1, controlled oven temperature of 30°C, and a C18 column [Agilent TC-C18 (2), 4.6 mm × 250 mm, 5 μm; Agilent Technologies] plus a C18 guard column [Agilent TC-C18 (2) Grd, 4.6 mm × 12.5 mm; Agilent Technologies]. Mobile phase A consists of 0.5% acetic acid, 1% acetonitrile, and 2% methanol. Mobile phase B consists of 0.5% acetic acid, 10% acetonitrile, and 20% methanol. The elution program was 0–30 min: percentage of mobile phase A linearly decreased from 72.5 to 20.0%, percentage of mobile phase B linearly increased from 27.5 to 80.0%; 30–35 min: percentage of mobile phase A linearly increased from 20.0 to 72.5%, percentage of phase B linearly decreased from 80.0 to 27.5%; 35–40 min: 72.5% mobile phase A and 27.5% mobile phase B. Chromatograms were recorded at 280 nm. Caffeine used to develop calibration standard curves were purchased from Sigma-Aldrich (St. Louis, MO, United States). Mobile phase of HPLC grade were purchased from Thermo Fisher Scientific (Waltham, MA, United States).
Total polyphenols in tea extract were estimated using the Folin-Ciocalteu method described by Singleton and Rossi (1965). The tea extract was diluted 25 times with deionized water. Then 2.5 mL of freshly prepared 10% (v/v) Folin & Ciocalteu’s phenol reagent (Sigma-Aldrich Co., St. Louis, MO, United States) was added to 0.5 mL diluted tea extract. After 5 min of equilibration, 2 mL of 75 g L–1 Na2CO3 was added to the mixture, which was then placed at room temperature for 60 min. The absorbance of the solution at 765 nm was measured in a glass cuvette using a spectrophotometer. Folin-Ciocalteu reagent was purchased from Sigma-Aldrich Company. The calibration standard curve was obtained using gallic acid (Sigma-Aldrich Co.) as standard.
The content of free AAs was determined by the ninhydrin dyeing method as described by Yin et al. (2009) with minor modifications using glutamic acid as standard. Ninhydrin solution (40 g L–1) of 0.5 mL was added to 1.0 mL of tea extract in a test tube with cap. Then 0.5 mL of pH 8.0 buffer (95% v/v 0.067 mol L–1 Na2HPO4⋅12H2O solution and 5% v/v 0.067 mol L–1 KH2PO4 solution) was added to the mixture. Test tubes with caps were then placed in a water bath at 100°C for 15 min. After cooling to room temperature, the solution was transferred to a volumetric flask and diluted to 25 mL with deionized water. Absorbance of the diluted solution at 540 nm was determined using a 1 cm photometer disposable cuvette and a spectrophotometer. Glutamic acid, ninhydrin, Na2HPO4⋅12H2O, KH2PO4 were equal or above to ACS grade, purchased from Thermo Fisher Scientific.
L-theanine in tea extract was determined by HPLC as described by Li et al. (2019) with minor modification using L-theanine as standard. HPLC analyses were performed using the same detector and columns as mentioned in caffeine analyses. The injection volume was 20 μL of 0.22 μm membrane filtered tea extract, flow rate was 2 mL min–1, controlled oven temperature was set at 27°C. Mobile phase A was 100% water and mobile phase B was 100% acetonitrile. The elution program was 0–7 min: 100% A; 7–9 min: percentage of mobile phase B linearly increased from 0 to 60%; 9–15 min: percentage of mobile phase B linearly decreased from 60 to 0%; 15–20 min: 100% A. Chromatograms were recorded at 210 nm. L-theanine used to develop calibration standard curves were purchased from Sigma-Aldrich (St. Louis, MO, United States).
A PCA was conducted to investigate the relationship among nine tested cultivars using six biochemical descriptors including contents of soluble solids, carbohydrates, caffeine, total polyphenol, free AAs, L-theanine and the TP/AA ratios. Tea leaf samples used in the PCA were collected from each cultivar and from three harvesting seasons including spring, summer, and fall of 2018 as mentioned above. The PCA was conducted using software XLSTAT (version 2019; Addinsoft United States, New York, NY, United States).
The experiment was conducted in a completely randomized block design with four replications and cultivar as the experimental factor. There were 20 single-plant subsamples for each cultivar within each replication. The number of subsamples used for each variable varied and was specified in each methodology section. Significance of the cultivar effect was determined by the analysis of variance (ANOVA) using the PROC GLM procedure of SAS (version 9.4; SAS Institute, Cary, NC, United States). A logarithmic transformation was made on cold damage data (%) to meet the assumption of normality. Means were separated by Tukey’s honestly significant difference (HSD) test at P ≤ 0.05. All statistical analyses were performed using SAS.
Within the experiment duration from January 2017 to February 2019, average monthly air temperature ranged from 3.9°C in January 2018 to 27.3°C in July 2017 (Figure 1 and Supplementary Figure S1). Maximum monthly air temperature ranged from 20.6°C in January 2019 to 35.6°C in July 2017. Minimum monthly air temperature ranged from −13.9°C in January 2018 to 19.8°C in July 2018. The lowest air temperature in this study was −13.9°C, and occurred in January 2018 in which the winter was colder than normal in this region. The highest air temperature was 35.6°C and occurred in July 2017.
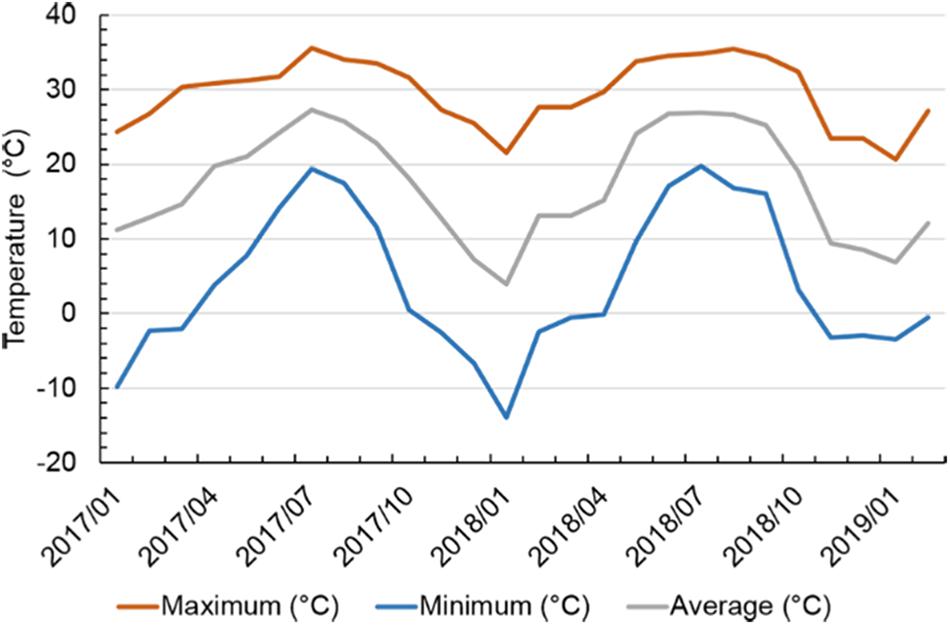
Figure 1. Maximum, minimum, and average air temperatures on a monthly basis in Starkville, MS, United States from January 2017 to February 2019. Air temperature data were obtained from the website of USDA Natural Resources Conservation Service (https://wcc.sc.egov.usda.gov/reportGenerator/).
Tea cultivars varied in size with plant growth indices ranging from 38.22 to 59.34 cm in February 2018 (Table 1, Supplementary Figure S1). ‘BL2’ had the highest PGI of 59.34 cm. The second highest PGIs were in ‘Black Sea,’ ‘Christine’s Choice,’ and ‘Large Leaf’ ranging from 50.44 to 53.36 cm. ‘BL1,’ ‘Small Leaf,’ and ‘var. assamica’ had the lowest PGIs ranging from 38.22 to 41.25 cm. In February 2019, the trend of PGI among cultivars was similar to 2018, ranging from 63.75 to 104.53 cm. ‘BL2’ had the highest PGI of 104.5 cm, and ‘BL1,’ ‘Small Leaf,’ and ‘var. assamica’ had the lowest PGIs of 69.33, 63.75, and 74.62 cm, respectively. ‘Black Sea,’ ‘Christine’s Choice,’ ‘Dave’s Fave,’ and ‘Large Leaf’ had comparable PGIs, but lower than ‘BL2,’ ranging from 83.97 to 92.92 cm. From February 2018 to February 2019, PGIs of all cultivars increased by 62.0–83.6%.
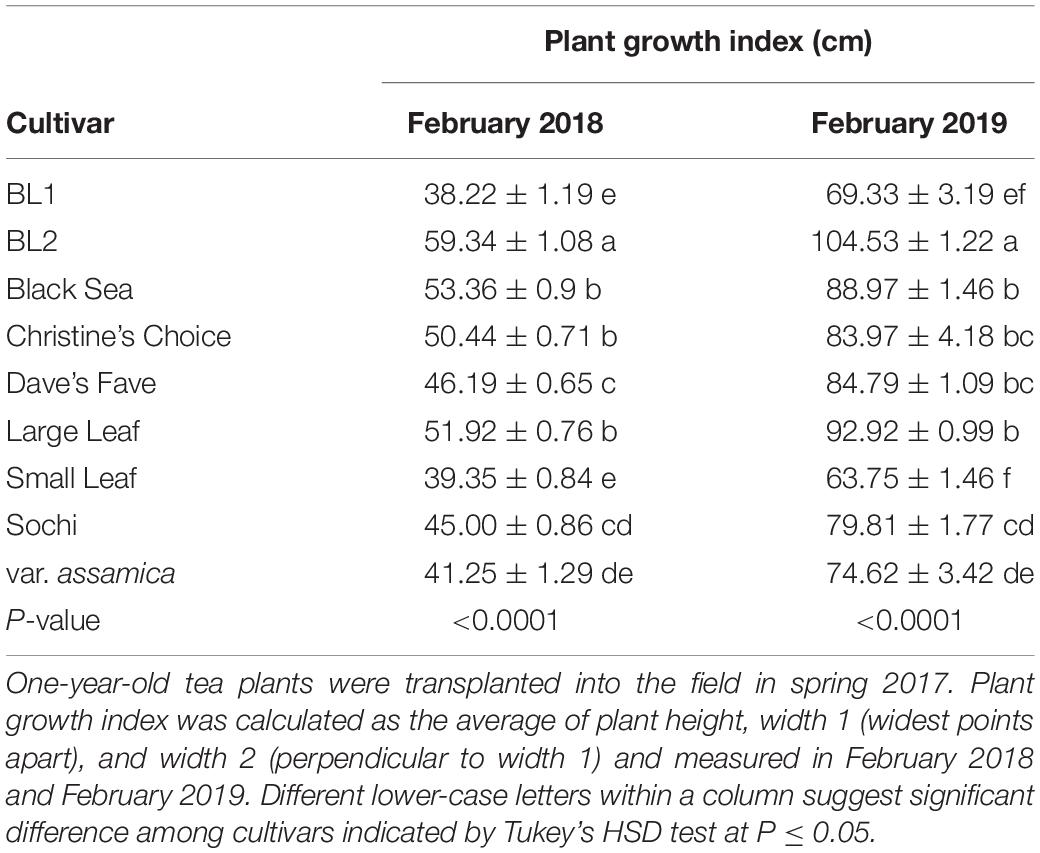
Table 1. Plant growth index (PGI) of nine tea cultivars grown in Mississippi, United States.
Measured in February 2018, ‘Christine’s Choice’ showed the highest percentage of cold damage, with an average of 34.67% foliage on an individual plant showing symptoms (Table 2). ‘Dave’s Fave’ showed the second highest percentage of cold damage of 18.2% foliage per plant. ‘BL2,’ ‘Small Leaf,’ and ‘Sochi’ had the least cold damage with average cold-damaged foliage of 2.08–3.85%. In February 2019, cold damage on tea plants was not as severe compared to February 2018 due to a generally mild winter. ‘Dave’s Fave’ and ‘Small Leaf’ had the highest percentage of cold-damaged foliage ranging from 9.83 to 9.90%. In comparison, ‘BL2’ and ‘Large Leaf’ showed the least cold-damaged foliage at 1.90 and 1.94%, respectively.
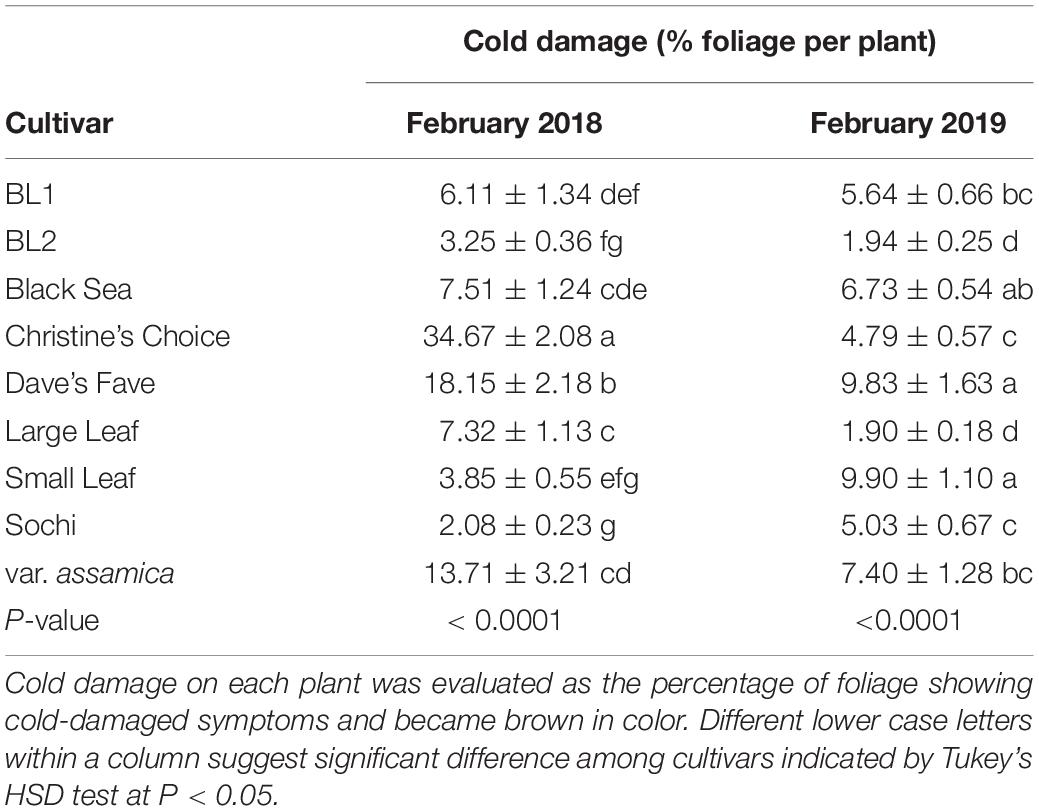
Table 2. Cold damage of nine tea cultivars in February 2018 and February 2019 grown in Mississippi, United States.
The nine tested cultivars had varying leaf shapes and sizes (Table 3). ‘Large Leaf’ had the largest leaf length of 9.61 cm per leaf. Lower than ‘Large Leaf,’ ‘BL2,’ ‘Black Sea,’ ‘Christine’s Choice,’ ‘Dave’s Fave,’ ‘Sochi,’ and ‘var. assamica’ had similar leaf lengths ranging from 8.04 to 8.73 cm per leaf. ‘BL1’ and ‘Small Leaf’ had the lowest leaf lengths averaging less than 8 cm per leaf. In terms of leaf width, ‘Dave’s Fave’ and ‘Large Leaf’ had the widest leaves and were wider than the other seven cultivars. The smallest leaf width was in ‘BL1’ averaging 2.99 cm per leaf. The other six cultivars had leaf widths ranging from 3.40 cm in ‘Small Leaf’ to 4.12 cm in ‘Christine’s Choice.’
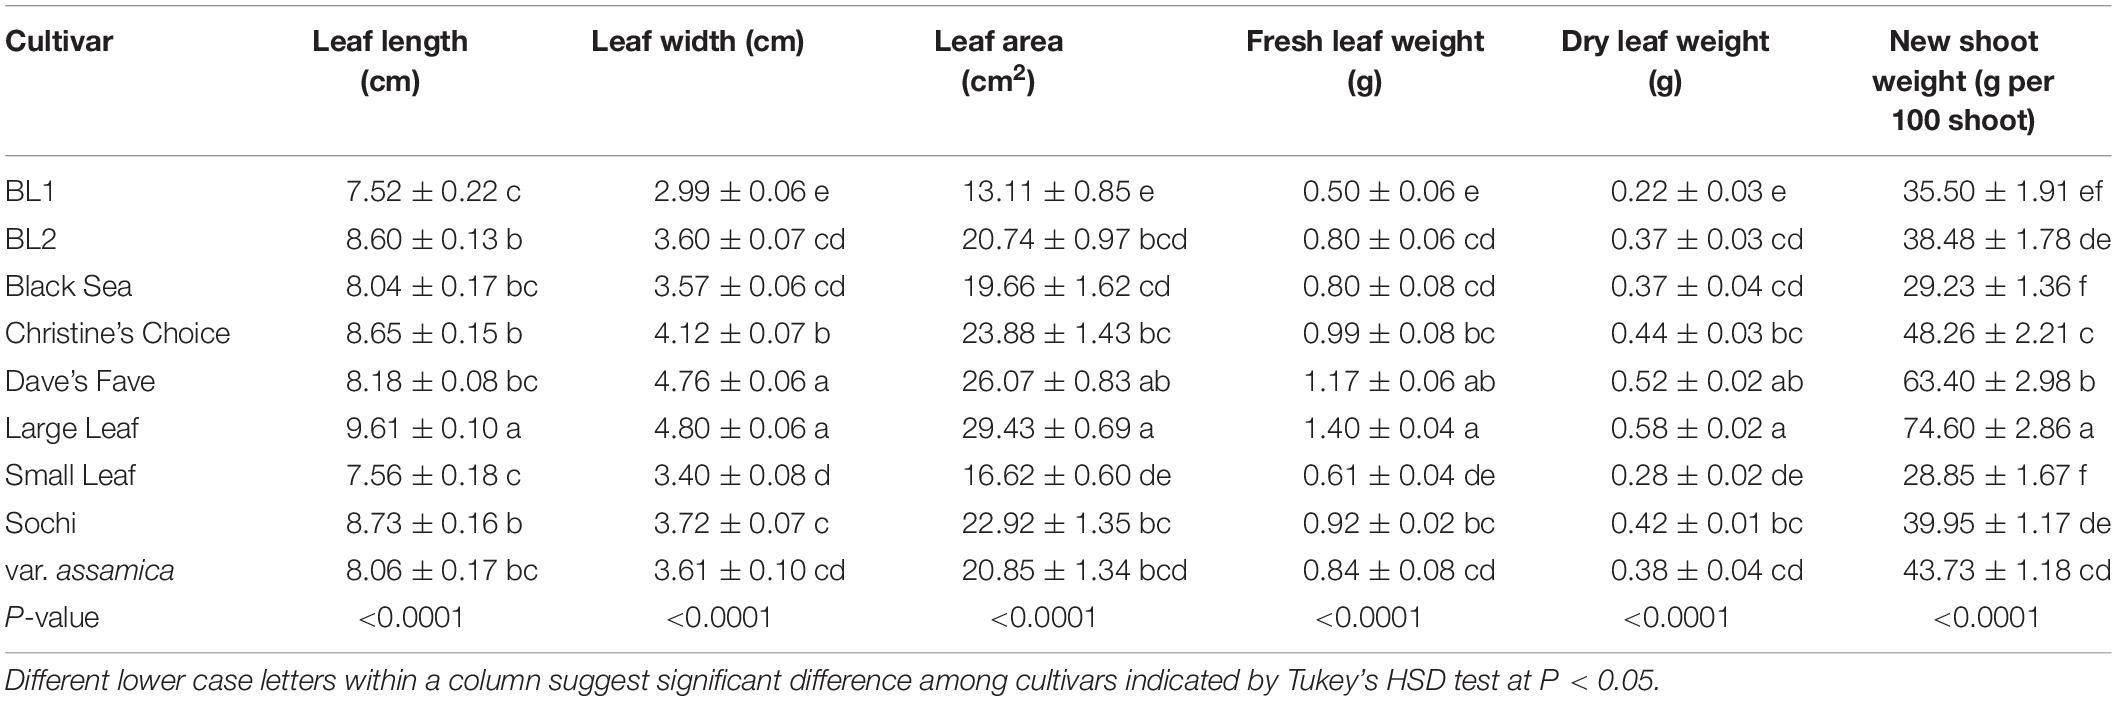
Table 3. Leaf and shoot characteristics of nine tea cultivar grown in Mississippi, United States.
Single leaf areas of the nine cultivars ranged from 13.11 cm2 in ‘BL1’ to 29.43 cm2 per leaf in ‘Large Leaf’ (Table 3). ‘BL2,’ ‘Christine’s Choice,’ ‘Dave’s Fave,’ ‘Sochi,’ and ‘var. assamica’ had comparable single leaf areas ranging from 19.66 to 26.07 cm2 per leaf. ‘BL1’ had the smallest single leaf area, lower than any of the other eight cultivars.
Individual leaf fresh or dry weight shared a similar trend with leaf area (Table 3). ‘Large Leaf’ and ‘Dave’s Fave’ had the greatest leaf weight, fresh (1.40 g and 1.17 g per leaf, respectively) or dry (0.58 g and 0.52 g per leaf, respectively). The five cultivars ‘BL2,’ ‘Black Sea,’ ‘Christine’s Choice,’ ‘Sochi,’ and ‘var. assamica’ had comparable leaf fresh weights ranging from 0.80 to 0.99 g per leaf, and dry weights ranging from 0.37 to 0.44 g per leaf. ‘BL1’ and ‘Small Leaf’ had the lowest leaf fresh weights (0.50 g and 0.61 g per leaf, respectively) and dry weights (0.22 g and 0.28 g per leaf, respectively).
Fresh weight of 100 new shoots of the nine cultivars ranged from 28.85 g in ‘Small Leaf’ to 74.60 g in ‘Large Leaf’ (Table 3). ‘Dave’s Fave,’ ‘Christine’s Choice’ had intermediate new shoot weight of 63.4 and 48.26 g per 100 shoots, respectively. ‘BL1,’ ‘Black Sea,’ and ‘Small Leaf’ had the comparable lowest fresh weight of 100 new shoots.
Tea cultivars did not vary significantly in net photosynthetic rate (Pn), stomatal conductance (gs), or leaf transpiration rate (Trmmol) when measured in September 2018 (Table 4). Pn ranged from 5.53 μmol m–2 s–1 in ‘var. assamica’ to 11.51 μmol m–2 s–1 in ‘BL2.’ Stomatal conductance and leaf transpiration rate ranged from 0.10 to 0.19 mol m–2 s–1 and 3.19 to 5.69 mmol m–2 s–1, respectively, suggesting cultivars were at similar physiological and water status.
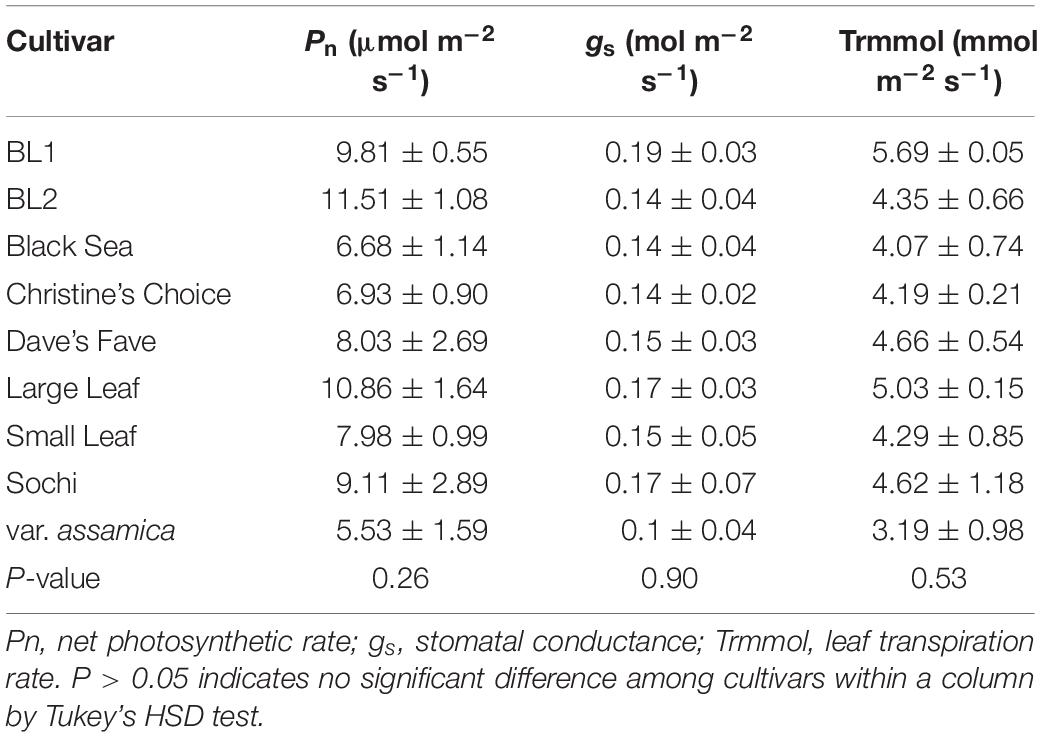
Table 4. Net photosynthetic rate, stomatal conductance, and leaf transpiration rate of nine tea cultivar grown in Mississippi, United States.
Among nine cultivars, soluble solids in tea extract ranged from 32.6 to 36.02%, 32.89 to 38.68%, and 31.87 to 37.15% on a dry weight basis in spring, summer, and fall of 2018, respectively (Figure 2A). In spring, there was no difference in soluble solid content among the nine cultivars. In summer, six cultivars including ‘BL1,’ ‘BL2,’ ‘Christine’s Choice,’ ‘Small Leaf,’ ‘Sochi,’ and ‘var. assamica’ had comparable soluble solids content ranging from 36.97 to 38.84%. ‘Dave’s Fave’ had the lowest soluble solids content of 32.89%. In fall, nine cultivars generally had similar soluble solids with ‘Dave’s Fave’ having the lowest soluble solids of 31.87%, lower than ‘BL1,’ ‘Christine’s Choice,’ ‘Small Leaf,’ and ‘Sochi.’ There was generally no difference in soluble solids content among seasons within a certain cultivar, except for ‘Sochi’ having higher soluble solids content in summer and fall than in spring.
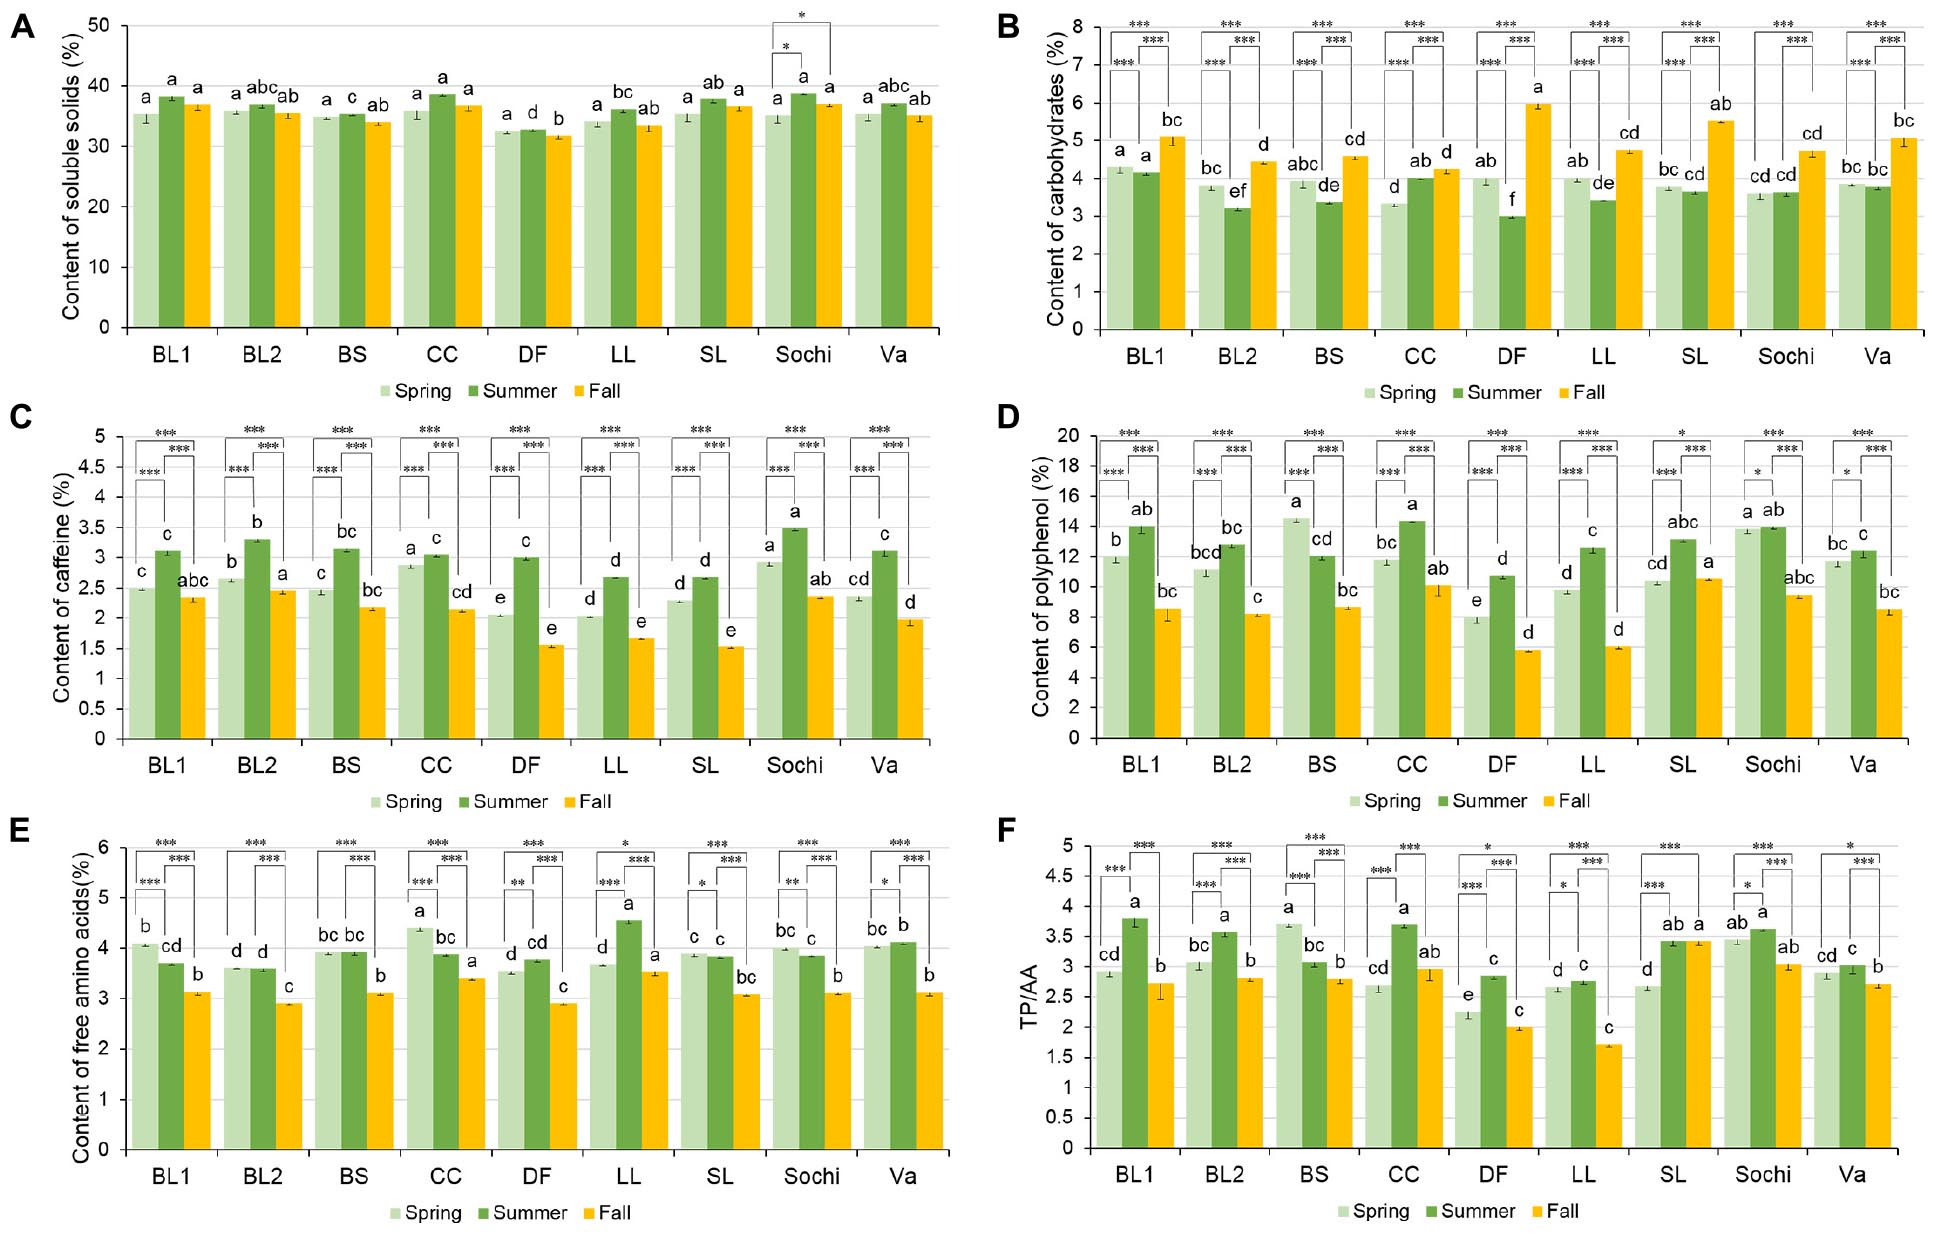
Figure 2. Content of soluble solids (dry weight%) (A), carbohydrates (dry weight%) (B), caffeine (dry weight%) (C), total polyphenols (dry weight%) (D), free amino acids (AA) (dry weight%) (E), and ratio between total polyphenols and free amino acids (TP/AA) (F) in tea extract of nine cultivars grown in Mississippi, United States. ‘BS’ stands for cultivar ‘Black Sea,’ ‘CC’ stands for cultivar ‘Christine’s Choice,’ ‘DF’ stands for cultivar ‘Dave’s Fave,’ ‘LL’ stands for cultivar ‘Large Leaf,’ ‘SL’ stands for cultivar ‘Small Leaf,’ ‘Va’ stands for cultivar ‘var. assamica.’ Different lower case letters on top of the same colored bars suggest significant difference in soluble solid content among nine cultivars within one harvesting season indicated by Tukey’s HSD test at P ≤ 0.05; ∗ suggests significant difference within one cultivar among different harvest seasons at P ≤ 0.05; ∗∗ suggests significant difference within one cultivar among different harvest seasons at P ≤ 0.01; ∗∗∗ suggests significance different within one cultivar among different harvest seasons at P ≤ 0.0001.
Carbohydrates in nine cultivars ranged from 3.33 to 4.31%, 3.00 to 4.16%, and 4.24 to 5.99% in spring, summer, and fall, respectively (Figure 2B). In spring, ‘BL1,’ ‘Black Sea,’ ‘Dave’s Fave,’ and ‘Large Leaf’ had comparable highest carbohydrates ranging from 3.94 to 4.31%, with’ Christine’s Choice’ having the lowest carbohydrate content of 3.33%. In summer, ‘BL1’ and ‘Christine’s Choice’ had the highest carbohydrates at 4.16 and 4.02% respectively, higher than ‘BL2,’ ‘Black Sea,’ ‘Dave’s Fave,’ ‘Large Leaf,’ ‘Small Leaf,’ or ‘Sochi.’ In fall, ‘Dave’s Fave’ and ‘Small Leaf’ had the highest carbohydrates at 5.99 and 5.53%, respectively. ‘BL2,’ ‘Black Sea,’ ‘Christine’s Choice,’ ‘Large Leaf,’ and ‘Sochi’ had comparable low carbohydrate content ranging from 4.24 to 4.76%. Within each cultivar, carbohydrates in fall were the highest among the three tested seasons. In seven cultivars including ‘BL1,’ ‘BL2,’ ‘Black Sea,’ ‘Dave’s Fave,’ ‘Large Leaf,’ ‘Small Leaf,’ and ‘var. assamica,’ spring carbohydrates were higher than summer, whereas in ‘Christine’s Choice’ higher carbohydrates was found in summer than in spring.
Caffeine content in nine cultivars ranged from 2.06 to 2.92%, 2.67 to 3.49%, and 1.53 to 2.46% in spring, summer, and fall, respectively (Figure 2C). The trend of caffeine levels among nine cultivars was generally similar in all three seasons. ‘Sochi’ had the highest levels of caffeine among cultivars in spring and summer. ‘Dave’s Fave,’ ‘Large Leaf,’ and ‘Small Leaf’ generally had the lowest caffeine levels in all three seasons. All nine cultivars shared the same trend of caffeine levels across seasons, where cultivars had the highest caffeine content in summer, spring the second, with fall having the lowest caffeine content.
Total polyphenols in nine cultivars ranged from 7.99 to 14.53%, 10.75 to 14.36%, and 5.83 to 10.55% in spring, summer, and fall, respectively (Figure 2D). In spring, ‘Black Sea’ and ‘Sochi’ had the highest total polyphenol content of 14.53 and 13.82%, respectively. Lower than ‘Black Sea’ or ‘Sochi,’ ‘BL1,’ ‘BL2,’ ‘Christine’s Choice,’ and ‘var. assamica’ had comparable total polyphenol ranging from 11.72 to 11.98%. ‘Dave’s Fave’ had the lowest total polyphenol of 7.98%. In summer, ‘BL1,’ ‘Chiristina’s Choice,’ ‘Small Leaf,’ and ‘Sochi’ had comparable highest total polyphenol content ranging from 13.15 to 14.36%, whereas ‘Dave’s Fave’ had the lowest total polyphenol of 10.75%. In fall, the highest polyphenol content was found in ‘Christine’s Choice’ (10.11%), ‘Small Leaf’ (10.55%), and ‘Sochi’ (9.48%), and the lowest polyphenol was found in ‘Dave’s Fave’ (5.83%) and ‘Large Leaf’ (6.05%). All cultivars except ‘Black Sea’ shared a similar trend in total polyphenols across seasons: highest total polyphenol was found in summer and lowest in fall. ‘Black Sea’ had the highest polyphenol of 14.53% in spring, higher than summer of 12.03%, with fall being the lowest of 8.69%.
The content of free AAs in nine cultivars ranged from 3.54 to 4.41%, 3.59 to 4.56%, and 2.91 to 3.54% in spring, summer, and fall, respectively (Figure 2E). In spring, ‘Christine’s Choice’ had the highest total free AAs at 4.41%, with ‘BL2,’ ‘Dave’s Fave,’ and ‘Large Leaf’ having the lowest total AAs ranging from 3.54 to 3.67%. In summer, ‘Large Leaf’ had the highest free AAs at 4.56%. In fall, ‘Christine’s Choice’ and ‘Large Leaf’ had the highest total free AAs of 3.41 and 3.54%, respectively. Five cultivars, ‘BL1,’ ‘Black Sea,’ ‘Small Leaf,’ ‘Sochi,’ and ‘var. assamica,’ had comparable free AAs ranging from 3.09 to 3.14%. Cultivars varied in trends of free AAs among the three seasons. In ‘BL1,’ ‘Christine’s Choice,’ ‘Small Leaf,’ and ‘Sochi,’ greatest free AAs were found in spring, summer second, with fall having the lowest AAs. In ‘BL2’ and ‘Black Sea,’ spring and summer had comparable free AAs, both higher than fall. In ‘Dave’s Fave,’ ‘Large Leaf,’ and ‘var. assamica’ greatest free AAs were found in summer, spring the second, with fall being the lowest.
The content of L-theanine in nine cultivars ranged from 0.28 to 0.87%, 0.33 to 0.99%, and 0.47 to 0.85% in spring, summer and fall, respectively (Table 5). In spring, ‘Christine’s Choice’ had the highest L-theanine content of 0.87%, and ‘Small Leaf’ had the second highest L-theanine content of 0.68%, with ‘Dave’s Fave’ having the lowest content of 0.28%. Six cultivars including ‘BL1,’ ‘BL2,’ ‘Black Sea,’ ‘Large Leaf,’ and ‘Small Leaf’ had comparable intermediate L-theanine content ranging from 0.36 to 0.47%. In summer, ‘Large Leaf’ had the highest L-theanine content of 0.99%, with ‘BL1,’ ‘BL2,’ ‘Dave’s Fave,’ and ‘Sochi’ having comparable lowest content of 0.33 to 0.41%. In fall, six cultivars including ‘Black Sea,’ ‘Christine’s Choice,’ ‘Large Leaf,’ ‘Small Leaf,’ ‘Sochi,’ and ‘var. assamica’ had comparable L-theanine content of 0.67 to 0.85%, with ‘BL1’ having the lowest content of 0.47%. Among seasons, L-theanine content was generally the highest in the fall among all cultivars. ‘BL2,’ ‘Black Sea,’ ‘Sochi,’ and ‘var. assamica’ had comparable L-theanine contents in spring and summer. ‘BL1,’ ‘Christine’s Choice,’ and ‘Small Leaf’ had higher L-theanine content in spring than in summer, with ‘Dave’s Fave’ and ‘Large Leaf’ having higher content in summer than spring.
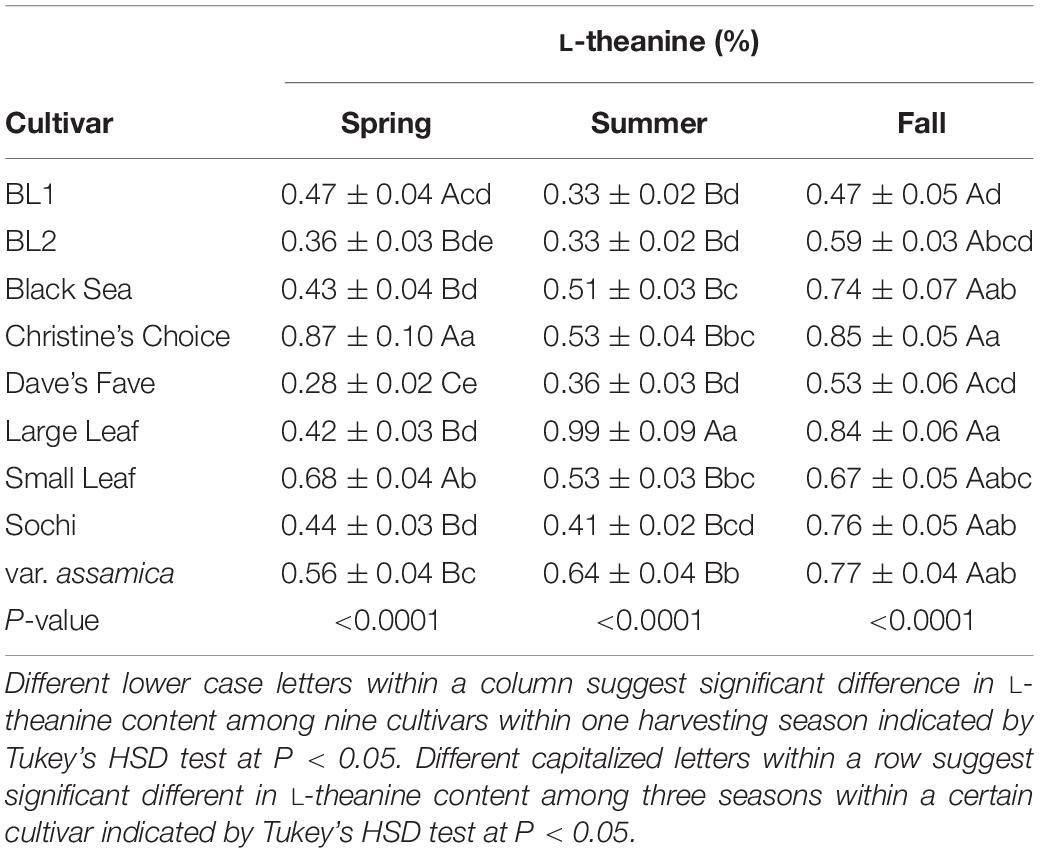
Table 5. Content of L-theanine in tea extract in three harvest seasons and nine cultivars grown in Mississippi, United States.
The ratio between total polyphenol and free amino acids (TP/AA) among nine cultivars ranged from 2.26 to 3.71, 2.77 to 3.80, and 1.72 to 3.42 in spring, summer, and fall, respectively (Figure 2F). In spring, the highest ratios of TP/AA were found in ‘Black Sea’ and ‘Sochi,’ with ‘Dave’s Fave’ having the lowest TP/AA ratio of 2.26. In summer, the five cultivars ‘BL1,’ ‘BL2,’ ‘Christine’s Choice,’ ‘Small Leaf,’ and ‘Sochi’ had comparable high ratios of TP/AA ranging from 3.43 to 3.80. In fall, the highest ratios of TP/AA were found in ‘Christine’s Choice,’ ‘Small Leaf,’ and ‘Sochi,’ with ‘Dave’s Fave’ and ‘Large Leaf’ having the lowest ratios. Six cultivars ‘BL1,’ ‘BL2,’ ‘Christina’s Choice,’ ‘Dave’s Fave,’ ‘Large Leaf,’ and ‘Sochi’ had higher ratios of TP/AA ratios in summer than in spring or fall. ‘Black Sea’ and ‘var. assamica’ had higher TP/AA ratios in spring and summer than in fall.
The first and second principle components (PC1 and PC2) in PCA accounted for 57.62 and 18.14% of the variation among the nine cultivars tested in three seasons, respectively (Figure 3). The positive PC1 dimension was largely correlated with contents of soluble solids, caffeine, total polyphenols, AAs, and TP/AA that had higher values in spring or summer. PC1 was negatively correlated with content of carbohydrates and L-theanine that had higher values in fall. The positive PC2 dimension was largely correlated with contents of L-theanine and AAs. PC2 was negatively correlated with content of carbohydrates, soluble solids and TP/AA. Based on the PCA results, tea leaves of nine cultivars harvested from fall were generally characterized with high content of carbohydrates. Except for ‘Dave’s Fave’ and ‘Large Leaf,’ tea leaves collected from spring which were characterized with a high content of AAs. Except for ‘Black Sea,’ leaves of the other cultivars collected in summer were characterized with high contents of total polyphenols and caffeine.
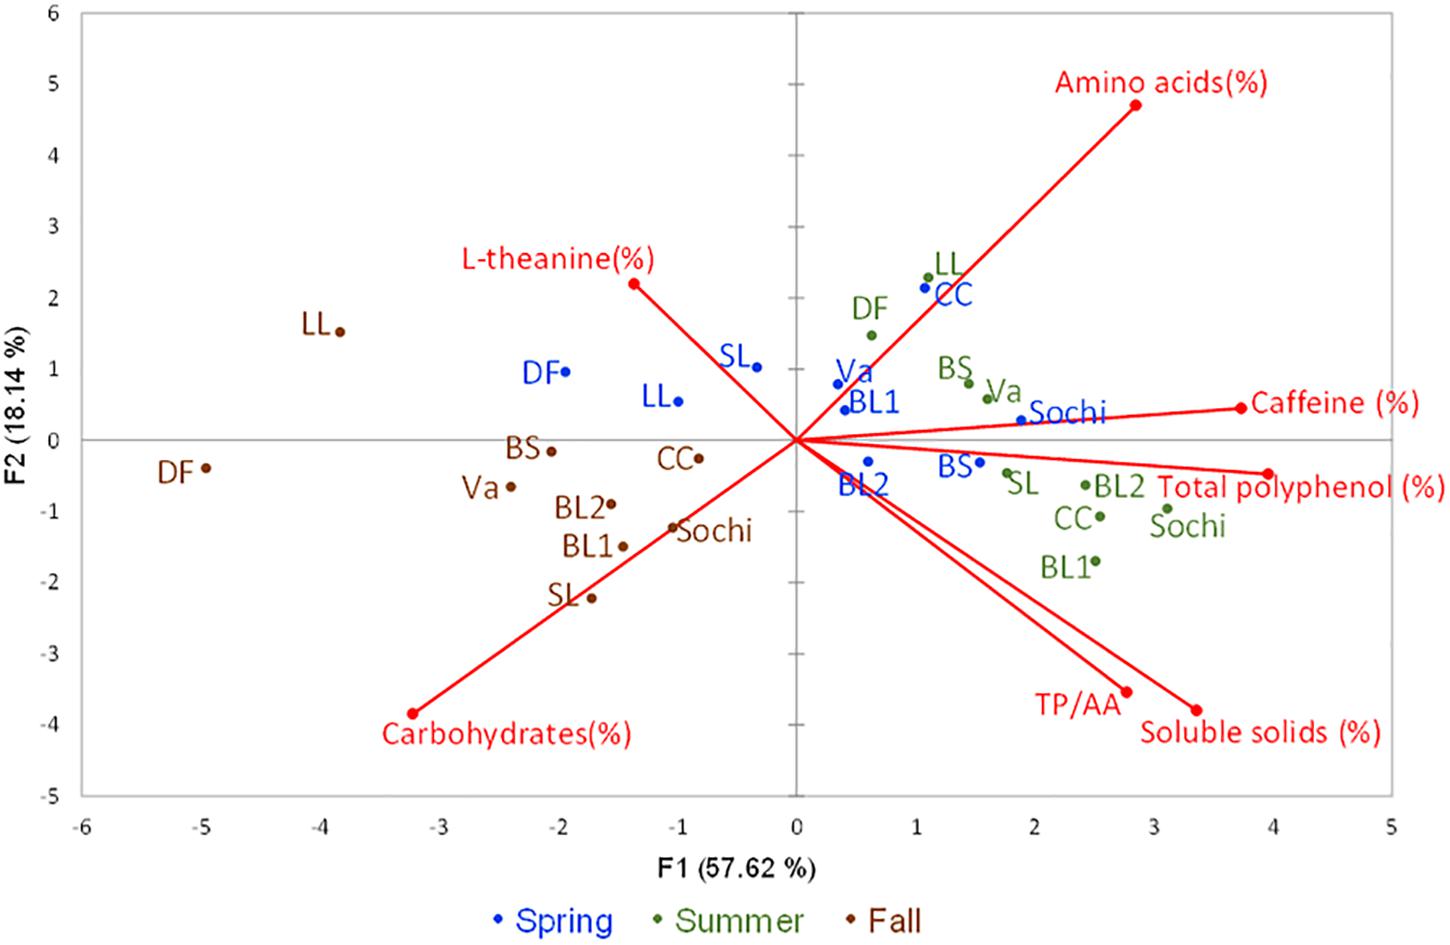
Figure 3. Principle component analyses (PCA) in nine tea cultivars grown in Mississippi, United States with six descriptors. The principal components scatterplot was generated based seven descriptors including contents of soluble solids, carbohydrates, total polyphenols, caffeine, L-theanine, and the ratios between total polyphenols and free amino acids (TP/AA) using leaf samples collected from nine test tea and from three harvesting seasons from each cultivar in spring (blue color), summer (green color), and fall (brown color) of 2018. The first and second principal components accounted for 75.75% of the total variation. ‘BS’ stands for cultivar ‘Black Sea,’ ‘CC’ stands for cultivar ‘Christine’s Choice,’ ‘DF’ stands for cultivar ‘Dave’s Fave,’ ‘LL’ stands for cultivar ‘Large Leaf,’ ‘SL’ stands for cultivar ‘Small Leaf,’ ‘Va’ stands for cultivar ‘var. assamica.’
The nine tested cultivars in this study, including ‘BL1,’ ‘BL2,’ ‘Black Sea,’ ‘Christine’s Choice,’ ‘Dave’s Fave,’ ‘Large leaf,’ ‘Small leaf,’ ‘Sochi,’ and ‘var. assamica’ showed diverse results in plant growth, leaf morphology and chemical composition. Within each cultivar, leaf chemical composition also varied among harvesting seasons in spring, summer, and fall. Despite some cold damage during winter, the nine tested cultivars generally demonstrated healthy growth and satisfactory adaptation to the growing environment in Mississippi since spring 2017.
At this current stage of tea industry in the United States, availability of superior tea cultivars are of the most limiting factors. To our knowledge, ‘BL1,’ ‘BL2,’ ‘Black Sea,’ ‘Christine’s Choice,’ ‘Dave’s Fave,’ ‘Large leaf,’ ‘Small leaf,’ and ‘Sochi’ are Camellia sinensis var. sinensis. Var. assamica is Camellia sinensis var. assamica. As for sources of tested cultivars, two cultivars ‘BL1’ and ‘BL2’ were donated by Robert E. “Buddy” Lee from Transcend Nursery in Louisiana, they were grown in the nursery since mid-1970s and survived down to −13°C during the 1980s. The remaining seven cultivars were obtained from Camellia Forest Nursery in North Carolina. Through personal communication with the nursery, ‘Black Sea’ was collected from Batumi region of Georgia and grown in the nursery since 2015; ‘Christine’s Choice’ and ‘Dave’s Fave’ were collected from China and grown in the nursery since 2008; ‘Sochi’ was collected from Sochi region of Russia and grown in the nursery since 2008; ‘Large Leaf,’ ‘Small Leaf,’ and ‘var. assamica’ were grown in the nursery since 1970s, 1970s, and 2000 with unknown original sources, respectively. The exact genotype of tea cultivars remain unclear. Research is in progress to investigate genetic background of tested cultivars using single nucleotide polymorphisms (Yamashita et al., 2019), and will be discussed in future research.
Tea is a long-lived woody perennial plant with decades of commercial productivity (Wang, 2016). Previous studies in traditional tea producing countries focused on profitable tea plants that were over 4 years and up to 100 years in age (Han et al., 2007; Kamau et al., 2008; Chan et al., 2009; Kumar et al., 2015). Few studies have been conducted in newly transplanted tea fields. The tea plants in our field were pruned back to 30 cm in February 2018 (2 years old) and to 50 cm in February 2019 (3 years old), respectively. The increase in PGI of tea plants in our study ranged from 62.0 to 83.6% within a year, which is consistent with previous studies (Green, 1971; Kulasegaram and Kathiravetpillai, 1972; Ahmed et al., 2014). When tea plants have a high growth rate and tea canopy covers 90% of tea fields, weed control becomes less of a concern (Wang, 2016). Fast plant growth and increases in PGI are thus beneficial for newly established tea fields to suppress weed growth (Anderson, 2010). Larger plant sizes, measured by PGI, may serve as an indicator for yield, which is one of the most important consideration in commercial tea production. Therefore, tea plants with higher PGI may establish faster, decrease weed pressure, and potentially become profitable at a younger age. In our study, ‘BL2’ had the highest PGI, followed by ‘Black Sea,’ ‘Christine’s Choice,’ and ‘Large Leaf.’
Leaf morphology, including size and weight, are correlated with tea yield (Karthigeyan et al., 2008). Of the nine tested cultivars, ‘Large Leaf’ had the largest leaf length (9.61 cm), width (4.80 cm), area (29.43 cm2), and fresh (1.40 g) and dry weights (0.58 g) on a single leaf basis and the highest 100 new shoot weight of 74.60 g. Rajkumar et al. (2010) reported C. sinensis var. assamica to be a large leaf variety with leaf length of 13.05 cm and width of 5.35 cm when grown in India. In our study, leaf size of var. assamica was among the smallest of the nine tested cultivars, which may have been affected by genetic background, plant age, and growing environment (Parkhurst and Loucks, 1972; Forrester et al., 2017). ‘BL1’ had the smallest leaf length of 7.52 cm and width of 2.99 cm, appearing to be larger than some small leaf cultivars reported from China (Karthigeyan et al., 2008). Leaf morphology also affects suitability of tea cultivars to make certain types of tea. For instance, most black tea is made from large leaf varieties (Astill et al., 2001). As plants age, leaf morphology of the tested cultivars may change.
Within this study duration, from spring 2017 to spring 2019, the lowest air temperature was reported to be −13.9°C in January 2018 (U. S. Department of Agriculture, National Resources Conservation Service [USDA-NRCS], 2019), which was approximately the historical extreme in this region. Tea plants can tolerate lowest air temperatures between −6 and −16°C, varying among varieties and different growth environments (Bi et al., 2014). With approximate 1 week of minimum air temperature below −6°C in January 2018, ‘Christine’s Choice’ had the most severe cold damage in February 2018, with over 34% of foliage showing cold damage symptoms. However, PGIs of ‘Christine’s Choice’ increased by 66% in spring 2019, suggesting the cultivar resumed vigorous growth after relatively severe cold damage. It was reported that cold damage on shoots may serve as a pinching agent, reducing apical dominance, as seen in Cordyline, and may promote production of more lateral shoots (Harris et al., 2001). In addition to the pinching effect of cold damage, all plants were pruned to a fixed height (30.48 and 50.80 cm in 2018 and 2019, respectively). Removal of apical dominance also promote lateral growth during the growing season. Compared to 2018, minimum air temperature in Jan 2019 was −3.5°C, resulting in cold damage on all cultivars below 10%. Lu et al. (2017) reported that tea cultivars varied in their critical cold temperature below which cell damage increased rapidly in tea leaves. This might explain the more severe cold damages in January 2018 compared to January 2019.
A wide range of variation in leaf chemical composition existed among the nine tested cultivars and among the three harvest seasons. This is in agreement with previous reports, where a high variability in soluble solids, total polyphenols, carbohydrates, AAs and caffeine content was found due to differences in gene expression and environmental conditions among cultivars and harvest seasons (Xu W. et al., 2012; Jayasekera et al., 2014; Fang et al., 2017). The content of soluble solids affects sensory characteristics of tea extract, including cream formation, viscosity, mouth feel and taste (Xu Y. Q. et al., 2012; Wang et al., 2019). Eight tested cultivars had similar soluble solids contents among the three harvest seasons, except that ‘Sochi’ had the highest soluble solids content in summer and lowest in spring. In comparison, the nine tested cultivars showed more variations among three seasons in their contents of carbohydrates, total polyphenols, free AAs, and caffeine.
With a number of reports around the world confirming seasonal effects on content of total polyphenol and AAs (Hilton et al., 1973; Gulati and Ravindranath, 1996; Yao et al., 2005; Chen et al., 2010; Lee et al., 2010; Jayasekera et al., 2014), few studies investigated the seasonal effects on carbohydrate content in tea leaves. In this study, the PCA results clearly separated fall samples from spring or summer due to the higher carbohydrate content in each cultivar (Figure 3). Such results indicate seasonality significantly affects carbohydrate content in tea leaves. A previous study reported the accumulation of carbohydrates contributes to increased cold tolerance of tea plants (Yue et al., 2015), suggesting that increasing carbohydrate levels in the fall might be related to plants adaptation to decreasing temperatures.
There are three fundamental tastes in tea extract including umami, sweetness, and bitterness. AAs, especially are an important contributor to the umami taste, which is especially important for green tea quality (Narukawa et al., 2008). The TP/AA ratio is a widely-used parameter to evaluate suitability of tea leaves to make certain types of tea. A previous study reported increased TP/AA with increasing temperatures (Han et al., 2017). Most of our results agreed with this finding except for ‘Black Sea’. The TP/AA ratios found in the nine tested cultivars in this study, ranging from 1.72 to 3.80 with total polyphenol content ranging from 5.83 to 14.53%, are considered suitable for green tea processing as black tea requires higher TP/AA ratios (Karori et al., 2007; Ai et al., 2011; Han et al., 2017). The low TP/AA ratios may have resulted from the young age of tea plants used in this study, having limited ability for biosynthesis of phenolics (Wang, 2013).
L-theanine is an important AAs in tea for its health benefits in reducing blood pressure, stress and anxiety, and improving memory and learning ability. L-theanine also contributes to flavor of tea infustion including caramel and umami tastes and alleviate bitterness (Yokogoshi et al., 1995; Juneja et al., 1999; Narukawa et al., 2008; Yang et al., 2013). Compared to the lowest AAs content in fall being among all seasons, L-theanine content was generally the highest in fall. This was consistent with Wang’s (2013) in investigating seasonal effects on tea leaves grown in China. While green tea harvested from spring were considered most popular with optimum quality in terms of flavor and taste (Liu et al., 2015), tea harvested from fall may contain higher health beneficial compounds considering the highest contents of total polyphenols and L-theanine among three seasons in tested cultivars. Future research will be conducted to investigate changes of individual AA agent among season and over time as tea plants mature.
The nine cultivars tested in this study varied in plant size, leaf characteristics (including leaf length, width, area, fresh and dry weights, and new shoot weight), and leaf biochemical compounds including carbohydrates, TP, AA, caffeine, and L-theanine. ‘BL2’ showed the highest PGI of 104.53 cm by February 2019, a beneficial characteristic toward weed suppression and early establishment of tea plantation. ‘Large Leaf’ and ‘Dave’s Fave’ had the largest leaves in terms of individual leaf area, fresh, dry weights, and new shoot weight. Biochemical compounds in tea cultivars differed among harvesting seasons of spring, summer, and fall. With TP/AA ratios ranging from 1.72 to 3.71, the tested nine cultivars are generally considered suitable for green tea processing in three seasons at current growth stage, which may change over time as plants mature and requires further investigation.
All datasets generated for this study are included in the article/Supplementary Material.
GB, QZ, and JL designed and set up experiments. QZ and QW carried out experiments. QZ and TL analyzed experimental results. GB, RH, and TL provided essential instruments and technical guidance. TL and QZ wrote the manuscript that was revised and approved by GB, RH, QW, and JL.
This work was funded, in part, by the Mississippi State University Agricultural and Forestry Experiment Station Strategic Research Initiative Program (MIS-212050), the United States Department of Agriculture (USDA)-Mississippi Department of Agriculture and Commerce Specialty Crop Block Grant Program (G00000343), and the USDA National Institute of Food and Agriculture Hatch Project MIS-249180.
Mention of a trademark, proprietary product, or vendor does not constitute a guarantee or warranty of the product by the United States Department of Agriculture and does not imply its approval to the exclusion of other products or vendors that also may be suitable.
The authors declare that the research was conducted in the absence of any commercial or financial relationships that could be construed as a potential conflict of interest.
The authors gratefully acknowledge Jason McDonald from The Great Mississippi Tea Company, Brookhaven, MS, Buddy Lee from Transcend Nursery, Independence, LA, and Christine and David Parks from Camellia Forest Nursery, Chapel, NC, for plant materials.
The Supplementary Material for this article can be found online at: https://www.frontiersin.org/articles/10.3389/fpls.2020.00280/full#supplementary-material
Ahmed, S., Griffin, T. S., Kraner, D., Schaffner, M. K., Sharma, D., Hazel, M., et al. (2019). Environmental factors variably impact tea secondary metabolites in the context of climate change. Front. Plant Sci. 10:939. doi: 10.3389/fpls.2019.00939
Ahmed, S., Orians, C. M., Griffin, T. S., Buckley, S., Unachukwu, U., Stratton, A. E., et al. (2014). Effects of water availability and pest pressures on tea (Camellia sinensis) growth and functional quality. AoB Plants 6, 1–9. doi: 10.1093/aobpla/plt054
Ai, S., Wu, R., Yan, L., and Wu, Y. (2011). Measurement of the ratio of tea polyphenols to amino acids in green tea infusion based on near infrared spectroscopy. Adv. Mater. Res. 301–303, 1093–1097. doi: 10.4028/www.scientific.net/amr.301-303.1093
Anderson, R. L. (2010). A rotation design to reduce weed density in organic farming. Renew. Agric. Food Syst. 25, 189–195. doi: 10.1017/S1742170510000256
Astill, C., Birch, M. R., Dacombe, C., Humphrey, P. G., and Martin, P. T. (2001). Factors affecting the caffeine and polyphenol contents of black and green tea infusions. J. Agric. Food Chem. 49, 5340–5347. doi: 10.1021/jf010759%2B
Bell, R. (2014). Niche Michigan Organic Tea Producer Embraces Traditions. East Lansing, MI: Michigan State University Extension.
Bhagat, R. M., Deb Baruah, R., and Safique, S. (2010). Climate and tea [Camellia sinensis (L.) O. Kuntze] production with special reference to north eastern India: a review. J. Environ. Res. Dev. 4, 1017–1028.
Bi, C., Fan, K., Li, J., Shen, L., and Liu, X. (2014). Identification and screening of cold resistance of the tea clone varieties [Camellia sinensis (L.) O. Kuntze] in yimeng mountain area. J. Anhui Agric. 42, 8936–8937.
Brent, F. V. (1973). Soil Survey of Oktibbeha County, Mississippi. Washington, D.C: Soil Conservation Service.
Chan, H. C., Chen, Y. S., Lliu, B. L., Chen, C. S., and Chang, Y. N. (2009). Effects of bacterial strains on sensory quality of pu-erh tea in an improved pile-fermentation process. J. Sens. Stud. 24, 534–553. doi: 10.1111/j.1745-459x.2009.00225.x
Chen, Y., Jiang, Y., Duan, J., Shi, J., Xue, S., and Kakuda, Y. (2010). Variation in catechin contents in relation to quality of “Huang Zhi Xiang” Oolong tea (Camellia sinensis) at various growing altitudes and seasons. Food Chem. 119, 648–652. doi: 10.1016/j.foodchem.2009.07.014
Dirr, M. A. (2009). Manual of Woody Landscape Plants: Their Identification, Ornamental Characteristics, Culture, Propagation and Uses, 6th Edn. Champaign, IL: Stipes Publishing.
Fan, D., Fan, K., Yu, C., Lu, Y., and Wang, X. (2017). Tea polyphenols dominate the short-term tea (Camellia sinensis) leaf litter decomposition. J. Zhejiang Univ. B 18, 99–108. doi: 10.1631/jzus.B1600044
Fang, R., Redfern, S. P., Kirkup, D., Porter, E. A., Kite, G. C., Terry, L. A., et al. (2017). Variation of theanine, phenolic, and methylxanthine compounds in 21 cultivars of Camellia sinensis harvested in different seasons. Food Chem. 220, 517–526. doi: 10.1016/j.foodchem.2016.09.047
Feng, L., Gao, M. J., Hou, R. Y., Hu, X. Y., Zhang, L., Wan, X. C., et al. (2014). Determination of quality constituents in the young leaves of albino tea cultivars. Food Chem. 155, 98–104. doi: 10.1016/j.foodchem.2014.01.044
Food and Agriculture Organization of the United Nations [FAO], (2015). World Tea Production and Trade – Current and Future Development. Rome: FAO.
Food and Agriculture Organization of the United Nations [FAO], (2018). Current Market Situation and Medium Term Outlook. Rome: FAO.
Forrester, D. I., Tachauer, I. H. H., Annighoefer, P., Barbeito, I., Pretzsch, H., Ruiz-peinado, R., et al. (2017). Forest ecology and management generalized biomass and leaf area allometric equations for European tree species incorporating stand structure, tree age and climate. For. Ecol. Manage. 396, 160–175. doi: 10.1016/j.foreco.2017.04.011
Gai, Z., Wang, Y., Jiang, J., Xie, H., Ding, Z., Ding, S., et al. (2019). The quality evaluation of tea (Camellia sinensis) varieties based on the metabolics. HortScience 54, 409–415. doi: 10.21273/HORTSCI13713-18
Gascoyne, K., Marchand, F., Desharnais, J., and Americi, H. (2016). Tea: History, Terroirs, Varieties, 2nd Edn. Ontario: Firefly Books Ltd.
Goggi, P. F. (2018). State of the U.S. Tea Industry, 2018-19 Tea Market Review. New York, NY: Tea Association of the U.S.A., Inc.
Green, M. J. (1971). An evaluation of some criteria used in selecting large-yielding tea clones. J. Agric. Sci. 76, 143–156. doi: 10.1017/S0021859600015689
Gulati, A., and Ravindranath, S. D. (1996). Seasonal variations in quality of Kangra tea (Camellia sinensis (L) O kuntze) in Himachal Pradesh. J. Sci. Food Agric. 71, 231–236. doi: 10.1002/(sici)1097-0010(199606)71:2<231::aid-jsfa573>3.0.co;2-y
Hajra, N. G. (2001). Tea Cultivation: Comprehensive Treatise. Lucknow: International Book Distribution Company.
Han, W. Y., Huang, J. G., Li, X., Li, Z. X., Ahammed, G. J., Yan, P., et al. (2017). Altitudinal effects on the quality of green tea in east China: a climate change perspective. Eur. Food Res. Technol. 243, 323–330. doi: 10.1007/s00217-016-2746-5
Han, W. Y., Shi, Y. Z., Ma, L. F., Ruan, J. Y., and Zhao, F. J. (2007). Effect of liming and seasonal variation on lead concentration of tea plant (Camellia sinensis (L.) O. Kuntze). Chemosphere 66, 84–90. doi: 10.1016/j.chemosphere.2006.05.017
Hardin, J. G. (2017). American Special Tea Alliance. Where tea is grown in the United States and Canada. Available at: https://specialtyteaalliance.org/world-of-tea/us-grown-tea/ (accessed August 1, 2019).
Harris, W., Beever, R. E., and Smallfield, B. (2001). Variation in response to cold damage by populations of Cordyline australis and of some other species of Cordyline (Lomandraceae). New Zeal. J. Bot. 39, 147–159. doi: 10.1080/0028825X.2001.9512723
Hilton, P. J., Palmer-Jones, R., and Ellis, R. T. (1973). Effects of season and nitrogen fertiliser upon the flavanol composition and tea making quality of fresh shoots of tea (Camellia sinensis L.) in Central Africa. J. Sci. Food Agric. 24, 819–826. doi: 10.1002/jsfa.2740240710
Jayasekera, S., Kaur, L., Molan, A. L., Garg, M. L., and Moughan, P. J. (2014). Effects of season and plantation on phenolic content of unfermented and fermented Sri Lankan tea. Food Chem. 152, 546–551. doi: 10.1016/j.foodchem.2013.12.005
Juneja, L. R., Chu, D. C., Okubo, T., Nagato, Y., and Yokogoshi, H. (1999). L-theanine - A unique amino acid of green tea and its relaxation effect in humans. Trends Food Sci. Technol. 10, 199–204. doi: 10.1016/S0924-2244(99)00044-8
Kamau, D. M., Spiertz, J. H. J., and Oenema, O. (2008). Carbon and nutrient stocks of tea plantations differing in age, genotype and plant population density. Plant Soil 307, 29–39. doi: 10.1007/s11104-008-9576-6
Karori, S. M., Wachira, F. N., Wanyoko, J. K., and Ngure, R. M. (2007). Antioxidant capacity of different types of tea products. Afr. J. Biotechnol. 6, 2287–2296. doi: 10.5897/ajb2007.000-2358
Karthigeyan, S., Rajkumar, S., Sharma, R. K., Gulati, A., Sud, R. K., and Ahuja, P. S. (2008). High level of genetic diversity among the selected accessions of tea (Camellia sinensis) from abandoned tea gardens in western Himalaya. Biochem. Genet. 46, 810–819. doi: 10.1007/s10528-008-9195-1
Kulasegaram, S., and Kathiravetpillai, A. (1972). Effects of nutrition and hormones on growth and apical dominance in tea (Camellia sinensis (L.) O. Kuntze). J. Hortic. Sci. 47, 11–24. doi: 10.1080/00221589.1972.11514435
Kumar, R., Bisen, J. S., Choubey, M., Singh, M., and Bera, B. (2015). Studies on effect of altitude and environment on physiological activities and yield of Darjeeling tea (Camellia sinensis L.) plantation. J. Crop Weed 11, 71–79.
LeCompte, J. S. (2018). Tea as an Alternative Crop for Mississippi. Ph.D. Dissertation, Mississippi State University, Mississippi State, MS.
Lee, J. E., Lee, B. J., Chung, J. O., Hwang, J. A., Lee, S. J., Lee, C. H., et al. (2010). Geographical and climatic dependencies of green tea (Camellia sinensis) metabolites: a 1H NMR-based metabolomics study. J. Agric. Food Chem. 58, 10582–10589. doi: 10.1021/jf102415m
Li, F., Dong, C., Yang, T., Ma, J., Zhang, S., Wei, C., et al. (2019). Seasonal theanine accumulation and related gene expression in the roots and leaf buds of tea plants (Camellia Sinensis L.). Front. Plant Sci. 10:1397. doi: 10.3389/fpls.2019.01397
Li, X., Ahammed, G. J., Li, Z. X., Zhang, L., Wei, J. P., Shen, C., et al. (2016). Brassinosteroids improve quality of summer tea (Camellia sinensis L.) by balancing biosynthesis of polyphenols and amino acids. Front. Plant Sci. 7:1304. doi: 10.3389/fpls.2016.01304
Li, Y., Chen, C., Li, Y., Ding, Z., Shen, J., Wang, Y., et al. (2016). The identification and evaluation of two different color variations of tea. J. Sci. Food Agric. 96, 4951–4961. doi: 10.1002/jsfa.7897
Liu, M., Tian, H. L., Wu, J. H., Cang, R. R., Wang, R. X., Qi, X. H., et al. (2015). Relationship between gene expression and the accumulation of catechin during spring and autumn in tea plants (Camellia sinensis L.). Hortic. Res. 2, 1–8. doi: 10.1038/hortres.2015.11
Lorenzo, J. M., and Munekata, P. E. S. (2016). Phenolic compounds of green tea: health benefits and technological application in food. Asian Pac. J. Trop. Biomed. 6, 709–719. doi: 10.1016/j.apjtb.2016.06.010
Lu, Y., Hu, Y., and Li, P. (2017). Consistency of electrical and physiological properties of tea leaves on indicating critical cold temperature. Biosyst. Eng. 159, 89–96. doi: 10.1016/j.biosystemseng.2017.04.012
Mississippi State University, (2019). Department of Geosciences. Mississippi Climate. Available at: https://www.geosciences.msstate.edu/state-climatologist/climate/ (accessed August 15, 2019).
Narukawa, M., Morita, K., and Hayashi, Y. (2008). L-theanine elicits an umami taste with inosine 5’-monophosphate. Biosci. Biotechnol. Biochem. 72, 3015–3017. doi: 10.1271/bbb.80328
Parkhurst, D. F., and Loucks, O. L. (1972). Optimal leaf size in relation to environment. J. Ecol. 60, 505–537. doi: 10.2307/2258359
Rajkumar, S., Karthigeyan, S., Sud, R. K., Rajkumar, R., Muraleedaran, N., Das, S. C., et al. (2010). Genetic diversity of indian tea (Camellia sinensis (L.) Kuntze) germplasm detected using morphological characteristics. J. Cell Plant Sci. 1, 13–22.
Ruan, J., Gerendás, J., Härdter, R., and Sattelmacher, B. (2007). Effect of nitrogen form and root-zone pH on growth and nitrogen uptake of tea (Camellia sinensis) plants. Ann. Bot. 99, 301–310. doi: 10.1093/aob/mcl258
Sharangi, A. B. (2009). Medicinal and therapeutic potentialities of tea (Camellia sinensis L.) – A review. Food Res. Int. 42, 529–535. doi: 10.1016/j.foodres.2009.01.007
Singleton, V. L., and Rossi, J. (1965). Colorimetry of Total Phenolics with phosphomolybdic-phosphotungstic acid reagents. Am. J. Enol. Vitic. 16, 144–158. doi: 10.12691/ijebb-2-1-5
Song, R., Kelman, D., Johns, L., and Wright, A. D. (2012). Correlation between leaf age, shade levels, and characteristic beneficial natural constitution of tea (Camellia sinensis) grown in Hawaii. Food Chem. 133, 707–714. doi: 10.1016/j.foodchem.2012.01.078
Tea Association of the U.S.A., (2019). Tea Fact Sheet 2018-2019. Available online at: http://www.teausa.com/14655/tea-fact-sheet (accessed July 2, 2019).
U. S. Department of Agriculture, National Resources Conservation Service [USDA-NRCS], (2019). Report Generator 2.0. Available online at: https://wcc.sc.egov.usda.gov/reportGenerator/edit/customMultiTimeSeries GroupByStationReport/daily/start_of_period/NONE/0,0/NONE?fitToScreen =false (Accessed September 6, 2019).
USDA, (2018). Summary Data on Annual Food Imports, Values and Volume by Food Category and Source Country, 1999-2017. Washington, D.C: USDA Econ. Res. Serv.
Walcott, S. M. (2012). Brewing a new American tea industry. Geog. Rev. 102, 350–363. doi: 10.1111/j.1931-0846.2012.00156.x
Wambulwa, M. C., Meegahakumbura, M. K., Samson, K., Alice, M., Michael, M., and Liu, J. (2016). Insights into the genetic relationships and breeding patterns of the African tea germplasm based on nSSR markers and cpDNA sequences. Front. Plant Sci. 7:1244. doi: 10.3389/fpls.2016.01244
Wang, B. (2016). Modern Techniques of Tea Cultivation and Processing. Beijing: China Agricultural University Press.
Wang, L. Y., Wei, K., Jiang, Y. W., Cheng, H., Zhou, J., He, W., et al. (2011). Seasonal climate effects on flavanols and purine alkaloids of tea (Camellia sinensis L.). Eur. Food Res. Technol. 233, 1049–1055. doi: 10.1007/s00217-011-1588-4
Wang, Q., Chen, D., Zhang, Q., Qin, D., Jiang, X., Li, H., et al. (2019). Volatile components and nutritional qualities of Viscum articulatum Burm.f. parasitic on ancient tea trees. Food Sci. Nutr. 7, 3017–3029. doi: 10.1002/fsn3.1159
Wang, X. (2013). A Study on Annual Variation Characteristics of the Major Compounds in Tea Leaves. Master Dissertation, Anhui Agricultural University, Hefei.
Wei, K., Wang, L., Zhou, J., He, W., Zeng, J., Jiang, Y., et al. (2011). Catechin contents in tea (Camellia sinensis) as affected by cultivar and environment and their relation to chlorophyll contents. Food Chem. 125, 44–48. doi: 10.1016/j.foodchem.2010.08.029
Willson, K. C., and Clifford, M. N. (1992). Tea: Cultivation to Consumption. Berlin: Springer-Science+Business Media.
Xu, W., Song, Q., Li, D., and Wan, X. (2012). Discrimination of the production season of Chinese green tea by chemical analysis in combination with supervised pattern recognition. J. Agric. Food Chem. 60, 7064–7070. doi: 10.1021/jf301340z
Xu, Y. Q., Chen, S. Q., Yuan, H. B., Tang, P., and Yin, J. F. (2012). Analysis of cream formation in green tea concentrates with different solid concentrations. J. Food Sci. Technol. 49, 362–367. doi: 10.1007/s13197-011-0281-8
Xu, Y. Q., Liu, P. P., Shi, J., Gao, Y., Wang, Q. S., and Yin, J. F. (2018). Quality development and main chemical components of Tieguanyin oolong teas processed from different parts of fresh shoots. Food Chem. 249, 176–183. doi: 10.1016/j.foodchem.2018.01.019
Yamashita, H., Katai, H., Kawaguchi, L., Nagano, A. J., Nakamura, Y., Morita, A., et al. (2019). Analyses of single nucleotide polymorphisms identified by ddRAD-seq reveal genetic structure of tea germplasm and Japanese landraces for tea breeding. PLoS One 14:e0220981. doi: 10.1371/journal.pone.0220981
Yang, H., Li, W., Yu, H., Yuan, R., Yang, Y., Pung, K., et al. (2013). Physiological effects of L-theanine on drosophila melanogaster. Molecules 18, 13175–13187. doi: 10.3390/molecules181113175
Yao, L., Caffin, N., D’Arcy, B., Jiang, Y., Shi, J., Singanusong, R., et al. (2005). Seasonal variations of phenolic compounds in Australia-grown tea (Camellia sinensis). J. Agric. Food Chem. 53, 6477–6483. doi: 10.1021/jf050382y
Yin, J. F., Xu, Y. Q., Yuan, H. B., Luo, L. X., and Qian, X. J. (2009). Cream formation and main chemical components of green tea infusions processed from different parts of new shoots. Food Chem. 114, 665–670. doi: 10.1016/j.foodchem.2008.10.004
Yokogoshi, H., Kato, Y., Sagesaka, Y. M., Takihara-Matsuura, T., Kakuda, T., and Takeuchi, N. (1995). Reduction effect of theanine on blood pressure and brain 5-hydroxyindoles in spontaneously hypertensive rats. Biosci. Biotechnol. Biochem. 59, 615–618. doi: 10.1271/bbb.59.615
Yue, C., Cao, H. L., Wang, L., Zhou, Y. H., Huang, Y. T., Hao, X. Y., et al. (2015). Effects of cold acclimation on sugar metabolism and sugar-related gene expression in tea plant during the winter season. Plant Mol. Biol. 88, 591–608. doi: 10.1007/s11103-015-0345-7
Keywords: tea, Camellia sinensis, plant growth, cold tolerance, leaf quality, polyphenols, amino acids, caffeine
Citation: Zhang Q, Li T, Wang Q, LeCompte J, Harkess RL and Bi G (2020) Screening Tea Cultivars for Novel Climates: Plant Growth and Leaf Quality of Camellia sinensis Cultivars Grown in Mississippi, United States. Front. Plant Sci. 11:280. doi: 10.3389/fpls.2020.00280
Received: 11 December 2019; Accepted: 25 February 2020;
Published: 13 March 2020.
Edited by:
Wenyan Han, Chinese Academy of Agricultural Sciences, ChinaReviewed by:
Asosii Paul, Nagaland University, IndiaCopyright © 2020 Zhang, Li, Wang, LeCompte, Harkess and Bi. This is an open-access article distributed under the terms of the Creative Commons Attribution License (CC BY). The use, distribution or reproduction in other forums is permitted, provided the original author(s) and the copyright owner(s) are credited and that the original publication in this journal is cited, in accordance with accepted academic practice. No use, distribution or reproduction is permitted which does not comply with these terms.
*Correspondence: Guihong Bi, Z2JpQHBzcy5tc3N0YXRlLmVkdQ==
Disclaimer: All claims expressed in this article are solely those of the authors and do not necessarily represent those of their affiliated organizations, or those of the publisher, the editors and the reviewers. Any product that may be evaluated in this article or claim that may be made by its manufacturer is not guaranteed or endorsed by the publisher.
Research integrity at Frontiers
Learn more about the work of our research integrity team to safeguard the quality of each article we publish.