 Edward Mwando1,2
 Yong Han1,2
 Tefera Tolera Angessa1,2,3
 Gaofeng Zhou1,3
 Camilla Beate Hill1,2Xiao-Qi Zhang1,2
 Chengdao Li1,2,3*
- 1Western Barley Genetics Alliance, College of Science, Health, Engineering and Education, Murdoch University, Perth, WA, Australia
- 2Western Australian State Agricultural Biotechnology Centre, Murdoch University, Perth, WA, Australia
- 3Department of Primary Industries and Regional Development Government of Western Australia, Perth, WA, Australia
Barley seeds need to be able to germinate and establish seedlings in saline soils in Mediterranean-type climates. Despite being a major cereal crop, barley has few reported quantitative trait loci (QTL) and candidate genes underlying salt tolerance at the germination stage. Breeding programs targeting salinity tolerance at germination require an understanding of genetic loci and alleles in the current germplasm. In this study, we investigated seed-germination-related traits under control and salt stress conditions in 350 diverse barley accessions. A genome-wide association study, using ~24,000 genetic markers, was undertaken to detect marker-trait associations (MTA) and the underlying candidate genes for salinity tolerance during germination. We detected 19 loci containing 52 significant salt-tolerance-associated markers across all chromosomes, and 4 genes belonging to 4 family functions underlying the predicted MTAs. Our results provide new genetic resources and information to improve salt tolerance at germination in future barley varieties via genomic and marker-assisted selection and to open up avenues for further functional characterization of the identified candidate genes.
Introduction
Soil salinity is a major global environmental factor limiting plant growth and productivity (Allakhverdiev et al., 2000; Ashraf et al., 2015). It causes two types of stress in plants, namely osmotic pressure associated with non-ionic factors, and ionic stress induced by Na+ and Cl− ions (Bernstein, 1975; reviewed by Munns and Tester, 2008). High salt in the soil increases the osmotic pressure and creates a condition similar to drought (Leon, 1963; Bliss et al., 1986; Sayar et al., 2010) that impairs the ability of seeds to absorb water from the soil, hence prolonging or even inhibiting seed imbibition for subsequent germination. In addition, the absorption of excess Na+ and Cl− ions causes toxicity that impedes normal cellular processes (Hampson and Simpson, 1990), contributing to a decrease in seed germination rate (Dodd and Donovan, 1999; Zhihui et al., 2014). Ionic and osmotic stress interaction effects ultimately decrease the number of sprouted seeds and the germination rate (Kazemi and Eskandari, 2011).
Barley is one of the most saline-tolerant crops (Munns, 2005) and is often used as a model to understand salinity adaptation mechanisms in plants (Chen et al., 2007; Wu et al., 2011). Adaptation to salinity varies among barley genotypes and growth stages (Mano et al., 1996; Mano and Takeda, 1997; Xue et al., 2009). The germination process begins when a quiescent dry seed imbibes water, and terminates on the emergence of the radicle (Gupta et al., 2019); barley is a model plant for studying the germination stage in monocots (Gorzolka et al., 2016). Depending on their ability to germinate and survive under salinity stress, barley genotypes are either tolerant or sensitive depending on their genetic diversity (Shelden et al., 2013; Shelden et al., 2016; Gupta et al., 2019). At this stage, several different loci control salinity tolerance (Mano and Takeda, 1997). Angessa et al. (2017) reported transgressive phenotypic segregation for germination rate and biomass at the seedling stage using a doubled haploid (DH) barley population derived from a CM72 Gairdner cross, with both traits controlled by different QTLs on chromosomes 2H and 3H, respectively. At the germination stage, Mano and Takeda (1997) reported 17 QTLs controlling abscisic acid (ABA) response on chromosomes 2H, 3H, 1H, and 5H in Steptoe Morex DH lines, and 9 QTL on 2H and 5H in a Harrington TR306 DH population. Loci located on chromosome 5H in both populations were closely linked to salinity tolerance. QTL mapping using a DOM REC Oregon Wolf Barley population identified several chromosomal regions on 2H, 5H, and 7H that were associated with salt stress response at the germination stage (Witzel et al., 2009). A single QTL on chromosome 5H, detected at three salt concentrations, was responsible for 42% of the phenotypic variation (Cattivelli et al., 2002).
There is little information linking the QTLs reported for salinity tolerance at the germination stage to specific genes and genetic mechanisms (Mano and Takeda, 1997; Hanen et al., 2014; Angessa et al., 2017). Genome-wide association (GWAS) studies are increasingly used to discover and explain the genetic basis of agronomic traits that are often controlled by many genes of small magnitude, such as germination (Shi et al., 2017; Hazzouri et al., 2018; Naveed et al., 2018; Yu et al., 2018). GWAS relies on linkage disequilibrium (LD) to detect associations between a large number of genetic variants and traits across a large number of genotypes from natural populations. GWAS typically achieves higher mapping resolution due to higher recombination levels between the linked genetic loci and traits at the population level than conventional QTL mapping (Hu et al., 2011). With the current advances in genome-wide genotyping technology, hundreds of accessions encompassing thousands of gene loci can be genotyped using high-throughput markers to improve the efficiency of current breeding approaches (Russell et al., 2011; Kilian and Graner, 2012; Tondelli et al., 2013). GWAS can precisely locate polymorphisms and the underlying genetic loci that are accountable for phenotypic variations to allow gene-targeted searches (Naveed et al., 2018; Xu X. et al., 2018; Yu et al., 2018).
This study used GWAS analysis to identify salinity tolerance at the seed germination stage in 350 barley accessions from 32 countries. The germination rate of these accessions was assessed in 150 mM NaCl, and a tolerance index was calculated (the fraction of germination under salt and deionized water as a percentage), using seeds harvested from two trial locations in Western Australia. The GWAS analysis of two traits associated with salinity tolerance at germination was conducted using 24,138 diversity arrays technology (DArTseq) and single-nucleotide polymorphism (SNP) markers. This research aimed to identify quantitative trait nucleotides (QTNs) and predict genes that are highly associated with salt-tolerant traits at the germination stage to select markers for future breeding.
Materials and Methods
Barley Germplasm
A total of 350 barley genotypes selected from a larger set of 594 accessions in a worldwide collection were evaluated for salinity response at the germination stage to map the locations of genes associated with tolerance (Supplementary Tables 1 and 2). The genotypes originated from 32 countries in various geographic regions, including Europe, Asia, North and South America, Africa, and Australia (Supplementary Figure 1), and comprised landraces, domesticated cultivars, and breeding lines conserved at the Western Barley Genetics Alliance at Murdoch University Perth, Australia. The domesticated barleys were selected from various breeding programs representing all cultivated varieties, including two-row (92%) and six-row (8%) head types, and winter (7%), spring (92%), and facultative (1%) growth habits (Supplementary Table 2). All barley plants were grown at two Western Australian locations, Merredin (31.4756°S, 118.2789°E, 315 m asl, 324 mm annual rainfall) and Katanning (33.6856°S, 117.6064°E, 320 m asl, 470 mm annual rainfall) in the 2016 and 2017 cropping seasons, respectively, and harvested at maturity. Both sites experience Mediterranean-type climates with hot, dry summers, and winter-dominant rainfall (Supplementary Figure 2) and are affected by salinity. The hot, dry summer increases salinity levels through ion accumulation in the topsoil, just before the autumn sowing, that affects seed germination. After harvest, the seeds were stored for at least 2 months at room temperature and then incubated at 37°C for 48 h to break seed dormancy.
Evaluation of Salinity Tolerance at Germination
This study used a modified method based on those of Bliss et al. (1986) and Angessa et al. (2017) to determine salinity tolerance during germination. Barley seeds were surface-sterilized for 5 min using 10% sodium hypochlorite, and then rinsed with sterile water. A set of 100 seeds of each genotype was placed in a 90 mm Petri dish on two layers of Whatman no. 1 filter paper to germinate. The treatments, with three replicates per treatment, contained either 4 ml deionized (DI) water (control) or 150 mM NaCl (salt treatment). The Petri dishes were sealed with parafilm and placed in a dark oven at 20°C. Germinated seeds were counted after 72 h of incubation; most domesticated barley malt varieties (mostly two-row)—selected for dormancy are expected to germinate (95–100%) within 2–4 days of imbibition (Briggs, 1978; Bothmer et al., 1995). However, the wild form (ssp. Spontaneum), those developed for feed, and most six-row varieties have not undergone such selection; hence, seed germination is irregular (Oberthur et al., 1995). To account for this variation, the tolerance index (TI) was adopted to reflect the stress effect on the same genotype over the period; any reduction in germination was considered to be caused by salinity stress (Askari et al., 2016). The germination percentage (G%) was calculated following the equation of Adjel et al. (2013), namely, G% = GS/TS×100%, where GS is the total number of germinated seeds, and TS is the total number of incubated seeds. The tolerance index was subsequently calculated as follows (Angessa et al., 2017), TI% = Gt%/Gc%×100%, where Gt% is the percentage of seeds germinated in the salt treatment, and Gc% is the percentage of seeds germinated in deionized water.
Statistical Analysis
The germination percentage of individual accessions from three replications and two locations were analyzed by SAS software (version 9.4, SAS Institute Inc, 2013). Analysis of variance (ANOVA) was performed to test the interaction between germplasm, treatments, and locations. Correlation analysis between germination in the salt treatment and the tolerance index was calculated and visualized using IBM SPSS Statistics (Version 25.0, IBM Corp, 2017).
Genome-Wide Marker Profiling
We used a combination of three sequencing methods to capture variation in and around the gene-containing regions of 350 barley genotypes, namely targeted resequencing, low-coverage whole-genome resequencing, and DArTseq. We used SNP markers, based on a custom target-enrichment sequencing assay, that included loci implicated in the flowering pathway in barley and related plant species, as previously published by Hill et al. (2019a, 2019b). The remainder of the pre-capture DNA libraries were subjected to low-coverage whole-genome sequencing at BGI (Hongkong) on an Illumina HiSeq4000 instrument. DArTseq genotyping by sequencing (GBS) was performed using the DArTseq platform (DArT PL, Canberra, NSW, Australia) as described on the company website (https://www.diversityarrays.com/). The genetic position of each marker was determined based on the Morex physical reference assembly. All sequence files were post-run filtered and aligned to barley reference genome assembly (IBSC v2; Mascher et al., 2017). All genotype data were combined, filtered for duplicates, minor allele frequency (MAF), and imputed using BEAGLE v4.1 adopting MAF > 0.05, SNP call rate > 0.95, and missing values < 0.05 (Browning and Browning, 2007).
Population Structure and Linkage Disequilibrium Analysis
Population structure was analyzed by Structure software version 2.3 (Hubisz et al., 2009). The genotypic data were imported into the software; the burn-in period was set to 5,000, producing 5,000 MCMC (Markov Chain Monte Carlo) repetitions. Simulations were conducted to estimate the number of populations (K) using admixture models by running K from 2 to 10, as described by Evanno et al. (2005). The LD between every two linear markers and the correlation between a pair of markers, which is squared allele frequency correlations (r2 value), was estimated using TASSEL software version 5.0 (Bradbury et al., 2007). Correlations between a pair of markers (r2 value) and the genetic distance was selected to calculate LD using a fitted equation in the whole genome.
Genome-Wide Association Analysis
Marker-trait association analysis for the salinity tolerance index at germination was performed by TASSEL software version 5.0 (Bradbury et al., 2007), using the mixed linear model basing on: trait of interest = population structure + marker effect + individual + residual. Heritability was estimated with the formula proposed by Kruijer et al. (2015), using genetic variance simulated from tolerance index and marker data obtained from the TASSEL package. The effectiveness and appropriateness of the model were assessed by constructing quantile–quantile (Q–Q) plots. Manhattan plots were constructed to visualize the GWAS output, with chromosome position as the X-axis and –log (P-value) of all markers using the R “qqman” (Wickham, 2009; R Core Team, 2014; Bates et al., 2015). Markers with P < 0.05 were considered significant and corrected for multiple tests by calculating q-value (FDR adjusted P-value). False discovery rate (FDR) correction was performed using Benjamini-Hochberg multiple test correction to determine significant marker-trait associations (MTA) (Benjamini and Hochberg, 1995) and markers with q-values < 0.05 were selected.
The formula described by Li et al. (2016) was used to identify favorable alleles for markers significantly associated with salinity tolerance during germination. The tolerance allele effect (ai) was calculated as; ai = ∑xij/ni − ∑Nk/nk, where ai is the tolerance effect of the ith allele, xij is the tolerance index value over the jth material with the ith allele, ni is the number of germplasm with the ith allele, Nk is the salinity tolerance value across all genotypes, and nk is the number of germplasm (Mei et al., 2013). In this study, ai denotes the association of the average salinity tolerance value of germplasm with a specific allele with that of all genotypes; hypothetically, values > 0 have a positive effect on the trait, and < 0 have a negative effect (Zhang et al., 2013).
Database Search to Predict Putative Candidate Genes and Favorable Alleles
The barley reference genome assembly (IBSC v2; Mascher et al., 2017) was used to identify possible candidate genes by searching the region flanking the QTN range of significantly associated salinity tolerance markers, with a –log10 (P) (logarithm of the odds –LOD) value set at ≥ 3.
Results
Phenotypic Variation and Correlations Among Traits
Three hundred and fifty barley genotypes were evaluated for salinity tolerance under control (germination in DI water) and salt conditions (150 mM NaCl) using seeds obtained from barley grown in Merredin and Katanning (Western Australia). The ANOVA results showed that genotype, treatment, and location differed significantly at P < 0.01. There were significant interactions between genotype and treatment and genotype by treatment by location (Table 1). In the salt treatment, the tolerance index and germination percentage had a positive correlation, such that a high percentage for the two traits indicated tolerance to salinity stress. There was a positive correlation coefficient between germination at 150 mM NaCl and tolerance index (R2 = 0.85 for Merredin and R2 = 0.90 for Katanning; see Supplementary Information), indicating that either of the two can be used to identify salinity tolerance during germination (Supplementary Figure 3).
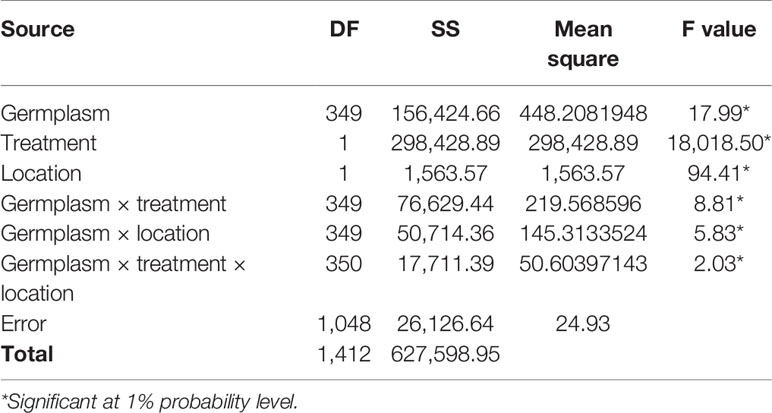
Table 1 Phenotype analysis of variance (ANOVA) for barley germplasms.
In the control (DI water), the average germination percentage at the two locations was 94.5% (Supplementary Figure 5). In the salt treatment (150 mM NaCl), the average germination percentage at Merredin was 76.8% (range 50–99%) and Katanning was 75.7% (range 49–98%) (Figure 1). The high average germination percentage in DI water indicates that the seeds were not dormant; therefore, the reduction in germination in the salt treatment can be attributed to salinity stress. The mean tolerance index for the two locations was 79.5%, with an average of 96.99% for the most tolerant germplasm WABAR2347 (Table 2) and 52.73% for the susceptible Torrens (Supplementary Table 4). At both sites (Merredin and Katanning), the tolerance index and germination rate in 150 mM NaCl had positive correlations of R2 = 0.52 and 0.40, respectively (Figure 2). The top 10 genotypes at each location in terms of tolerance index are presented in Table 2 and Supplementary Figure 4.
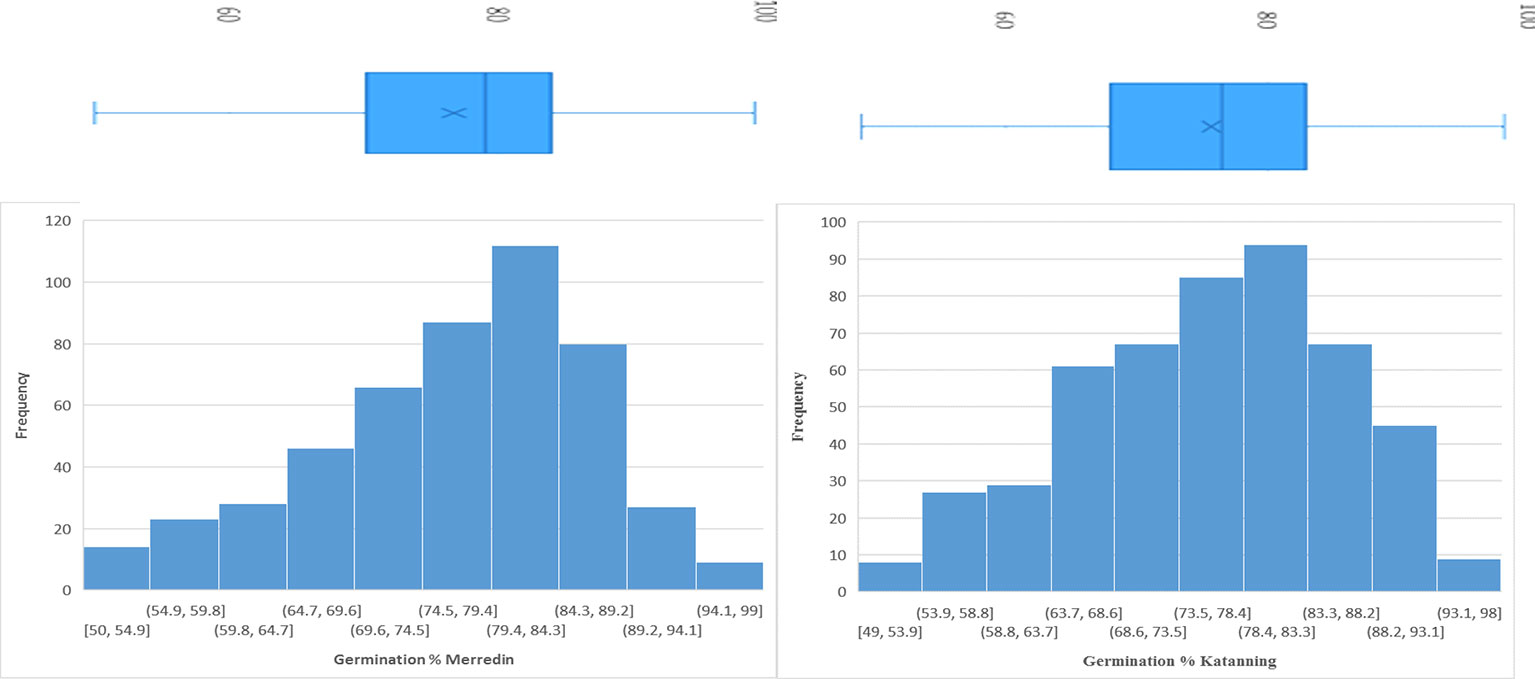
Figure 1 Combined histogram and plot block for germination percentage of 350 barley genotypes under 150 mM NaCl for seeds sourced from Merredin and Katanning, WA.
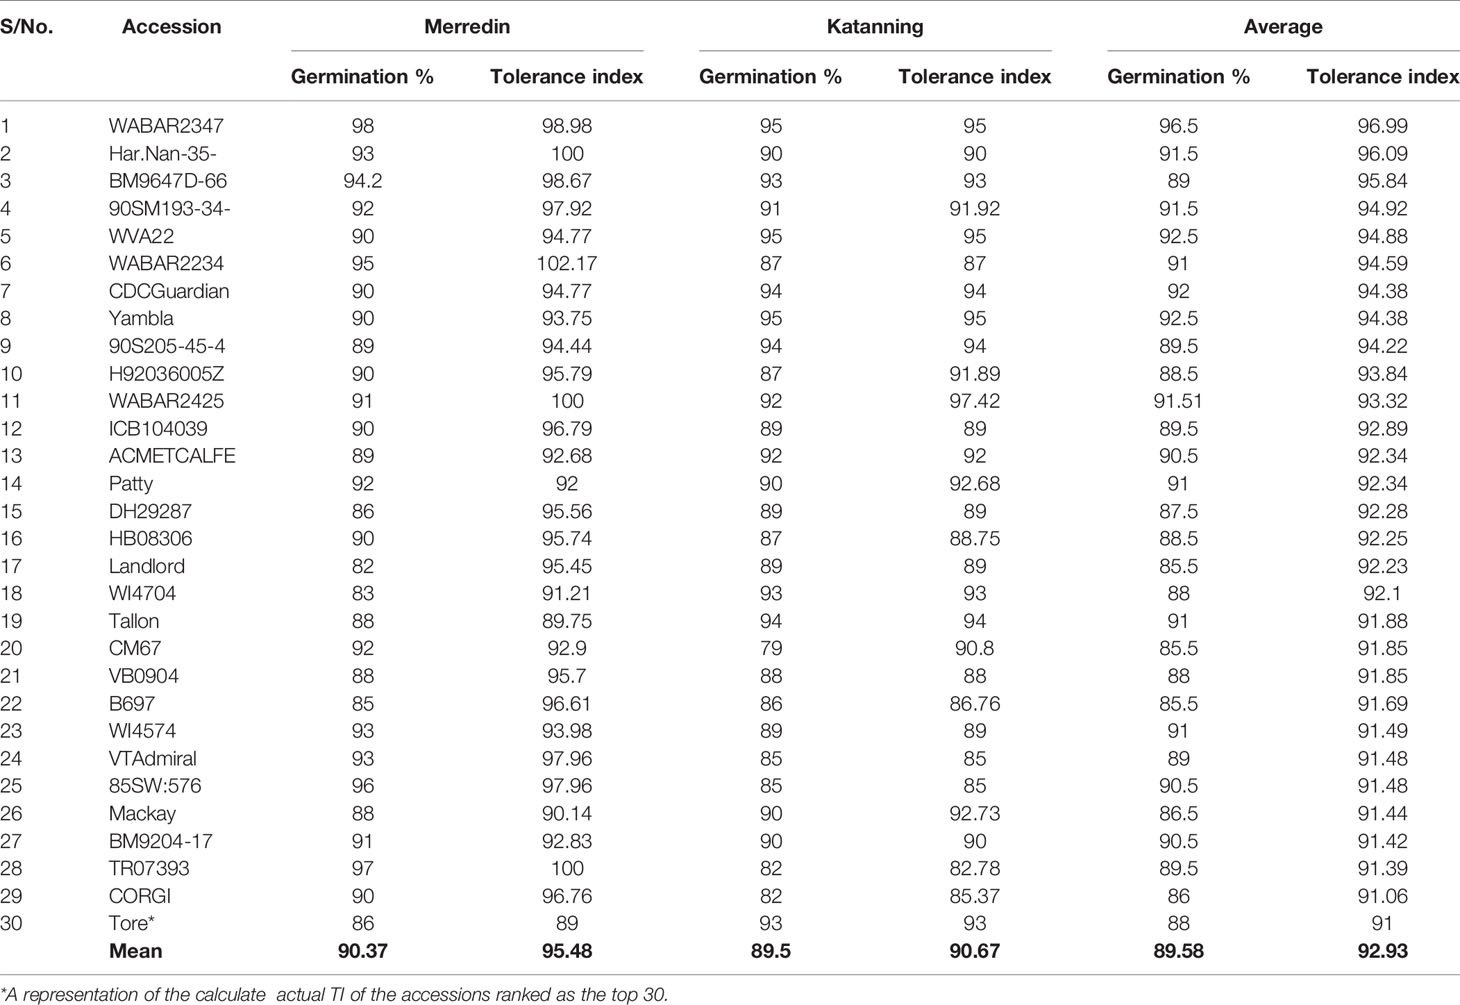
Table 2 List of most tolerant barley accessions (top 30) for seeds sourced from Merredin and Katanning (Western Australia).
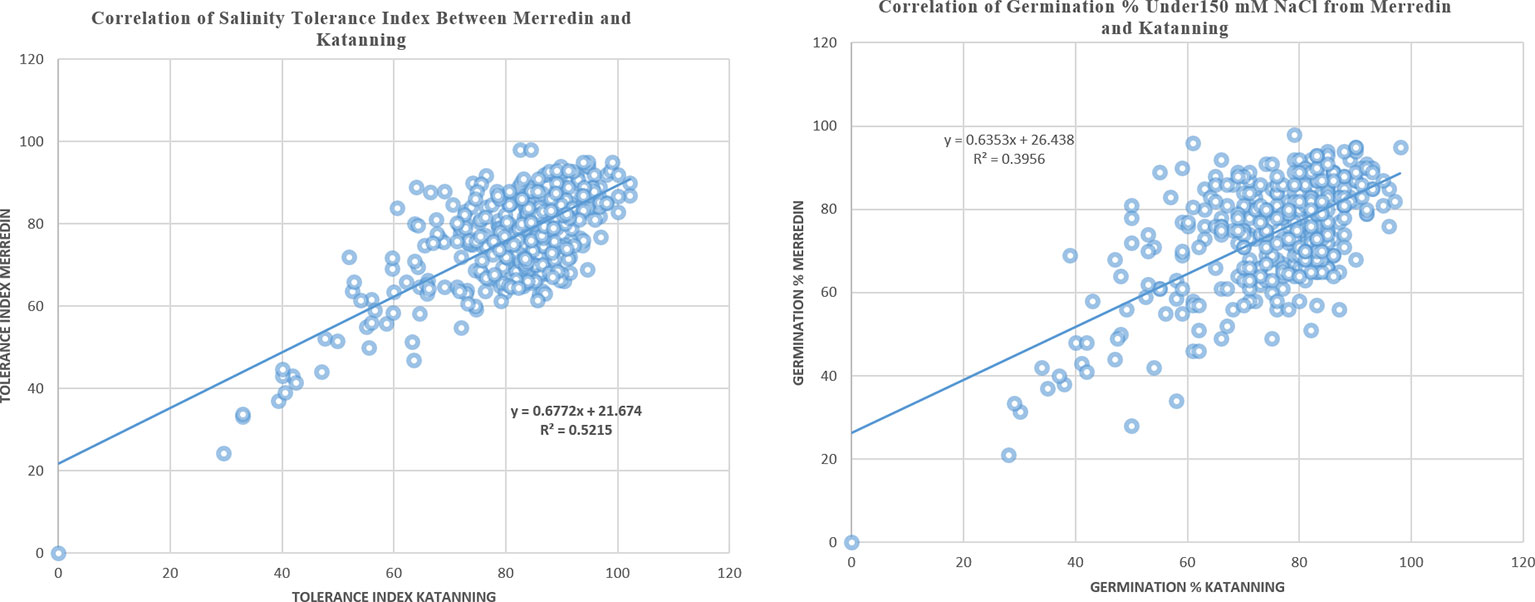
Figure 2 Correlation coefficient for seeds sourced from Merredin and Katanning for tolerance index and germination in 150 mM NaCl.
Marker Coverage, Population Structure, and Linkage Disequilibrium Analysis
Only DArTseq markers with a call rate of > 95% were selected, being 9,637 from a total of 22,241. An additional 28,502 SNP markers were identified by aligning the low-coverage sequences and targeted re-sequencing (Hill et al., 2019a; Hill et al., 2019b) of 350 barley accessions to the “Morex” reference genome and removing those with less than 5% allele frequency. In total, 24,138 DArTseq and SNP markers, anchored to the barley reference genome, were selected for population structure, linkage disequilibrium, and GWAS analysis.
Population structure analysis combined previously selected DArTseq and SNP markers to determine the genetic background of germplasm belonging to a group in a given number of populations (K). The number of genetic clusters (K values) for population structure was analyzed in 350 barley genotypes with STRUCTURE software where parameter (ΔK) was used to determine the number of clusters suitable for association mapping analysis, with the cluster parameter K set from 2 to 10. The appropriate number of clusters was defined as 3, according to the method by Evanno et al. (2005)—when k was 3, ΔK would reach a top value of 21. The outputs were cross-confirmed to determine the optimal K-value, which was authenticated to be 3, according to the valley of the error rates of cross-validation (Supplementary Figure 4 and Supplementary Table 6).
Linkage disequilibrium (LD) decay (r2) of individual chromosomes was analyzed and then summed to obtain an average value for the whole genome. The mean LD decay value for the 350 barley accessions was 3.5 Mb (r2 = 0.2), with 24,138 were evenly spread and adequate for GWAS.
Genome-Wide Association Analysis of Salinity Tolerance at Germination
The GWAS was performed on 350 genotypes using both genotypic and phenotypic data. Given that the accuracy of association mapping analysis might be affected by population stratification, quantile–quantile (QQ) plots were generated to test the suitability of the model (Figure 3). The plots showed that the observed values (ordinate) initially matched the equivalent expected values (abscissa), but eventually, they were delineated and deviated to indicate a reasonable positive. Therefore, the GWAS results from all locations were reliable and not likely to give false negatives due to population stratification. Manhattan figure plots were created to visualize the significance of markers associated with the tolerance index (Figure 4). Heritability values of 0.18, 0.11, and 0.19 were obtained from the tolerance indices of Merredin, Katanning, and the average of the two locations, respectively.
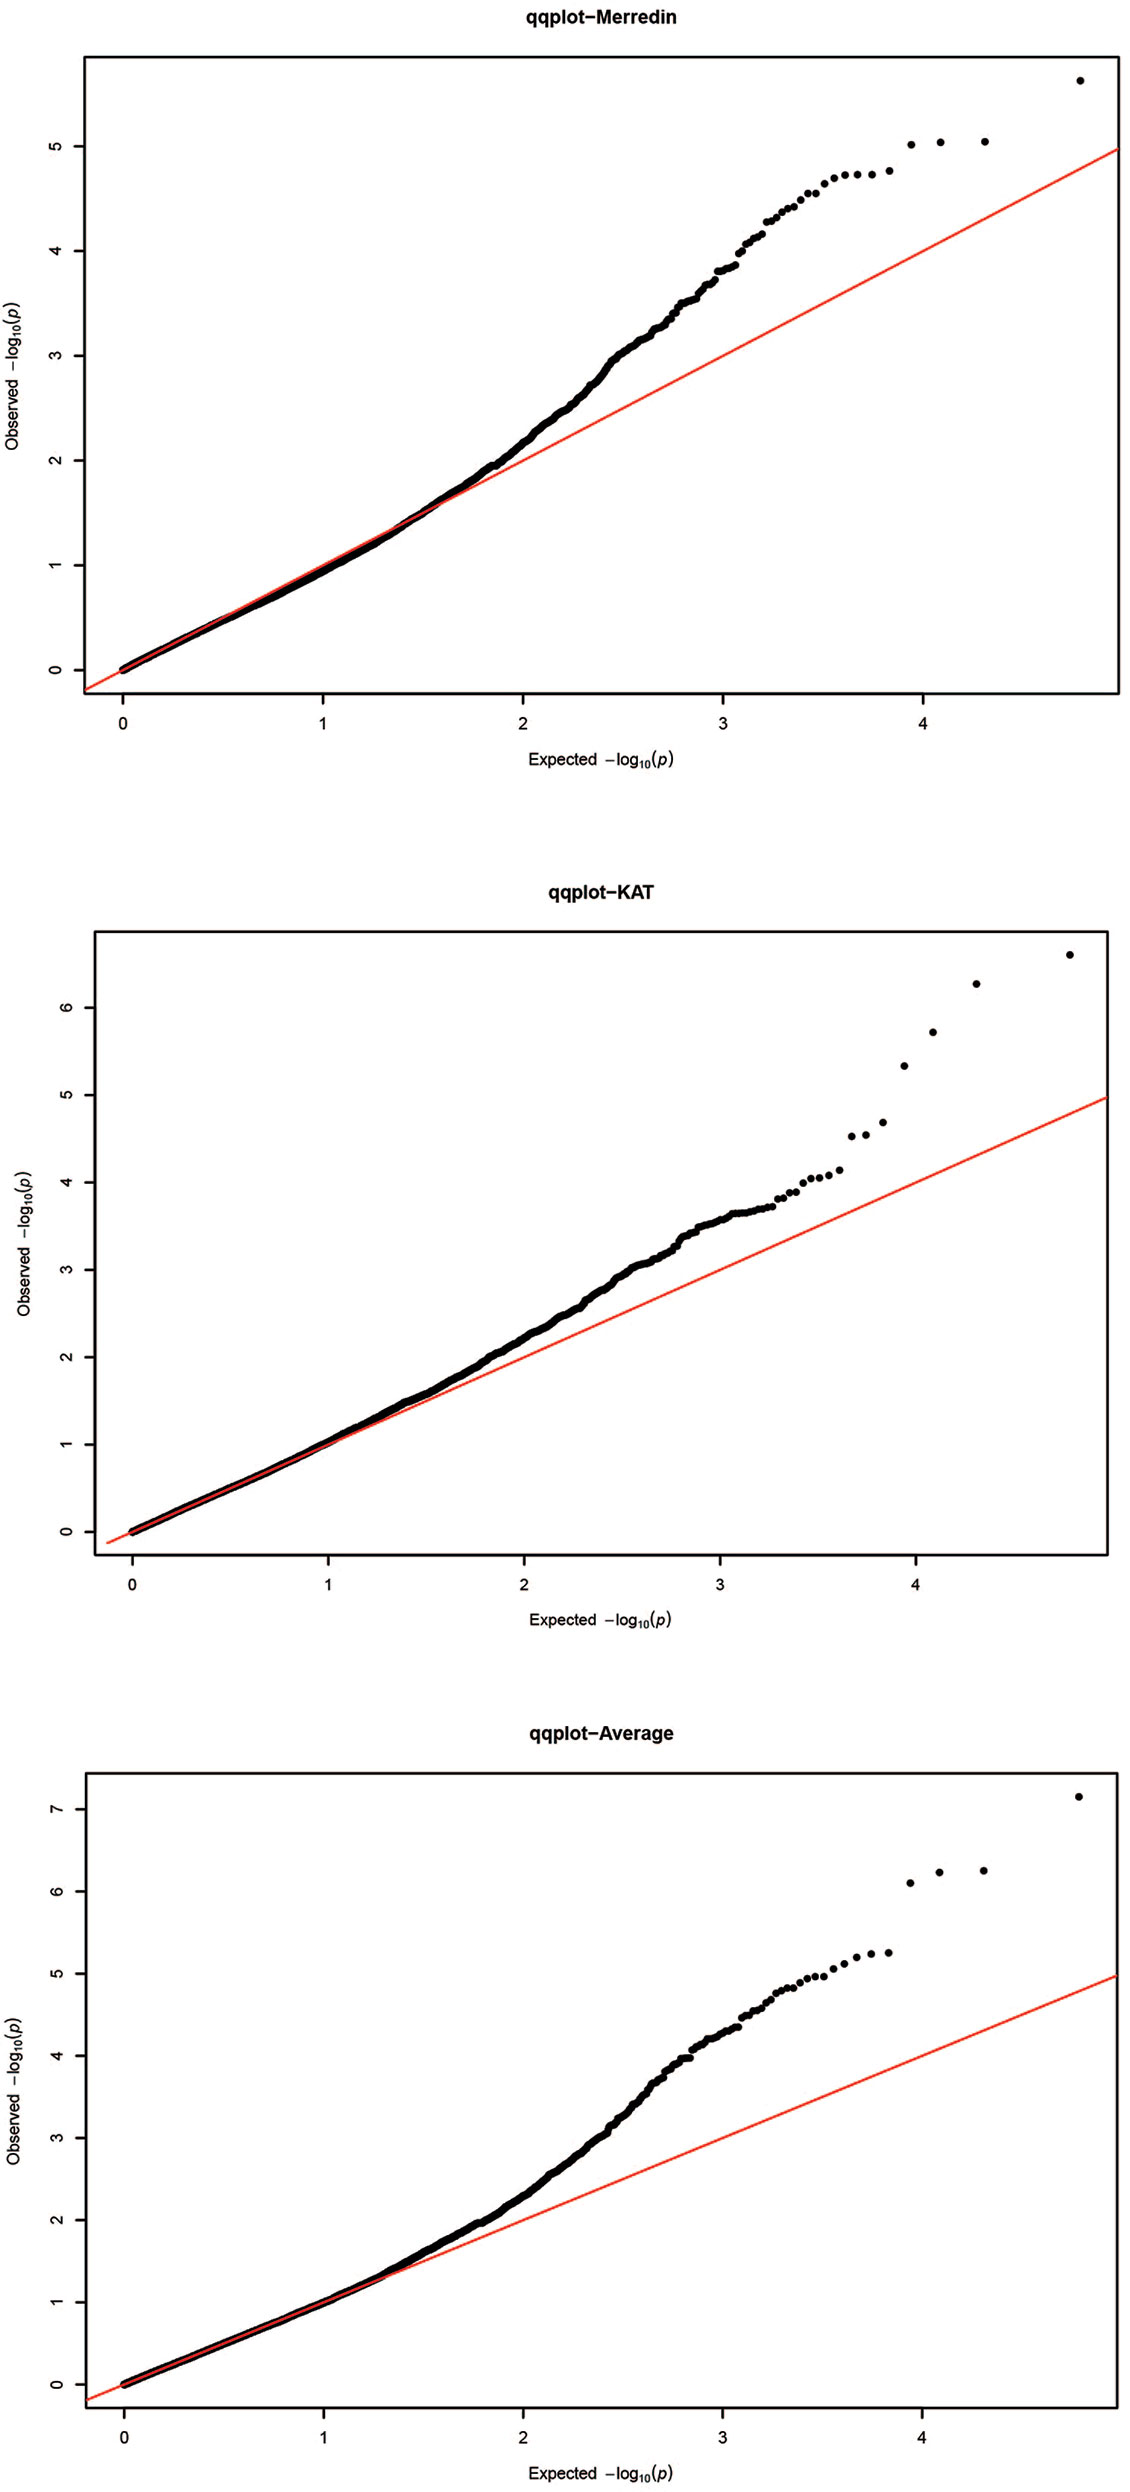
Figure 3 Quantile–quantile (Q-Q) plots for genome-wide association study (GWAS) of 350 barley accessions grown in Merredin, Katanning, and average for salinity tolerance index during germination under 150 mM NaCl. The Y-axis is observed –log (P) values, and X-axis the expected.
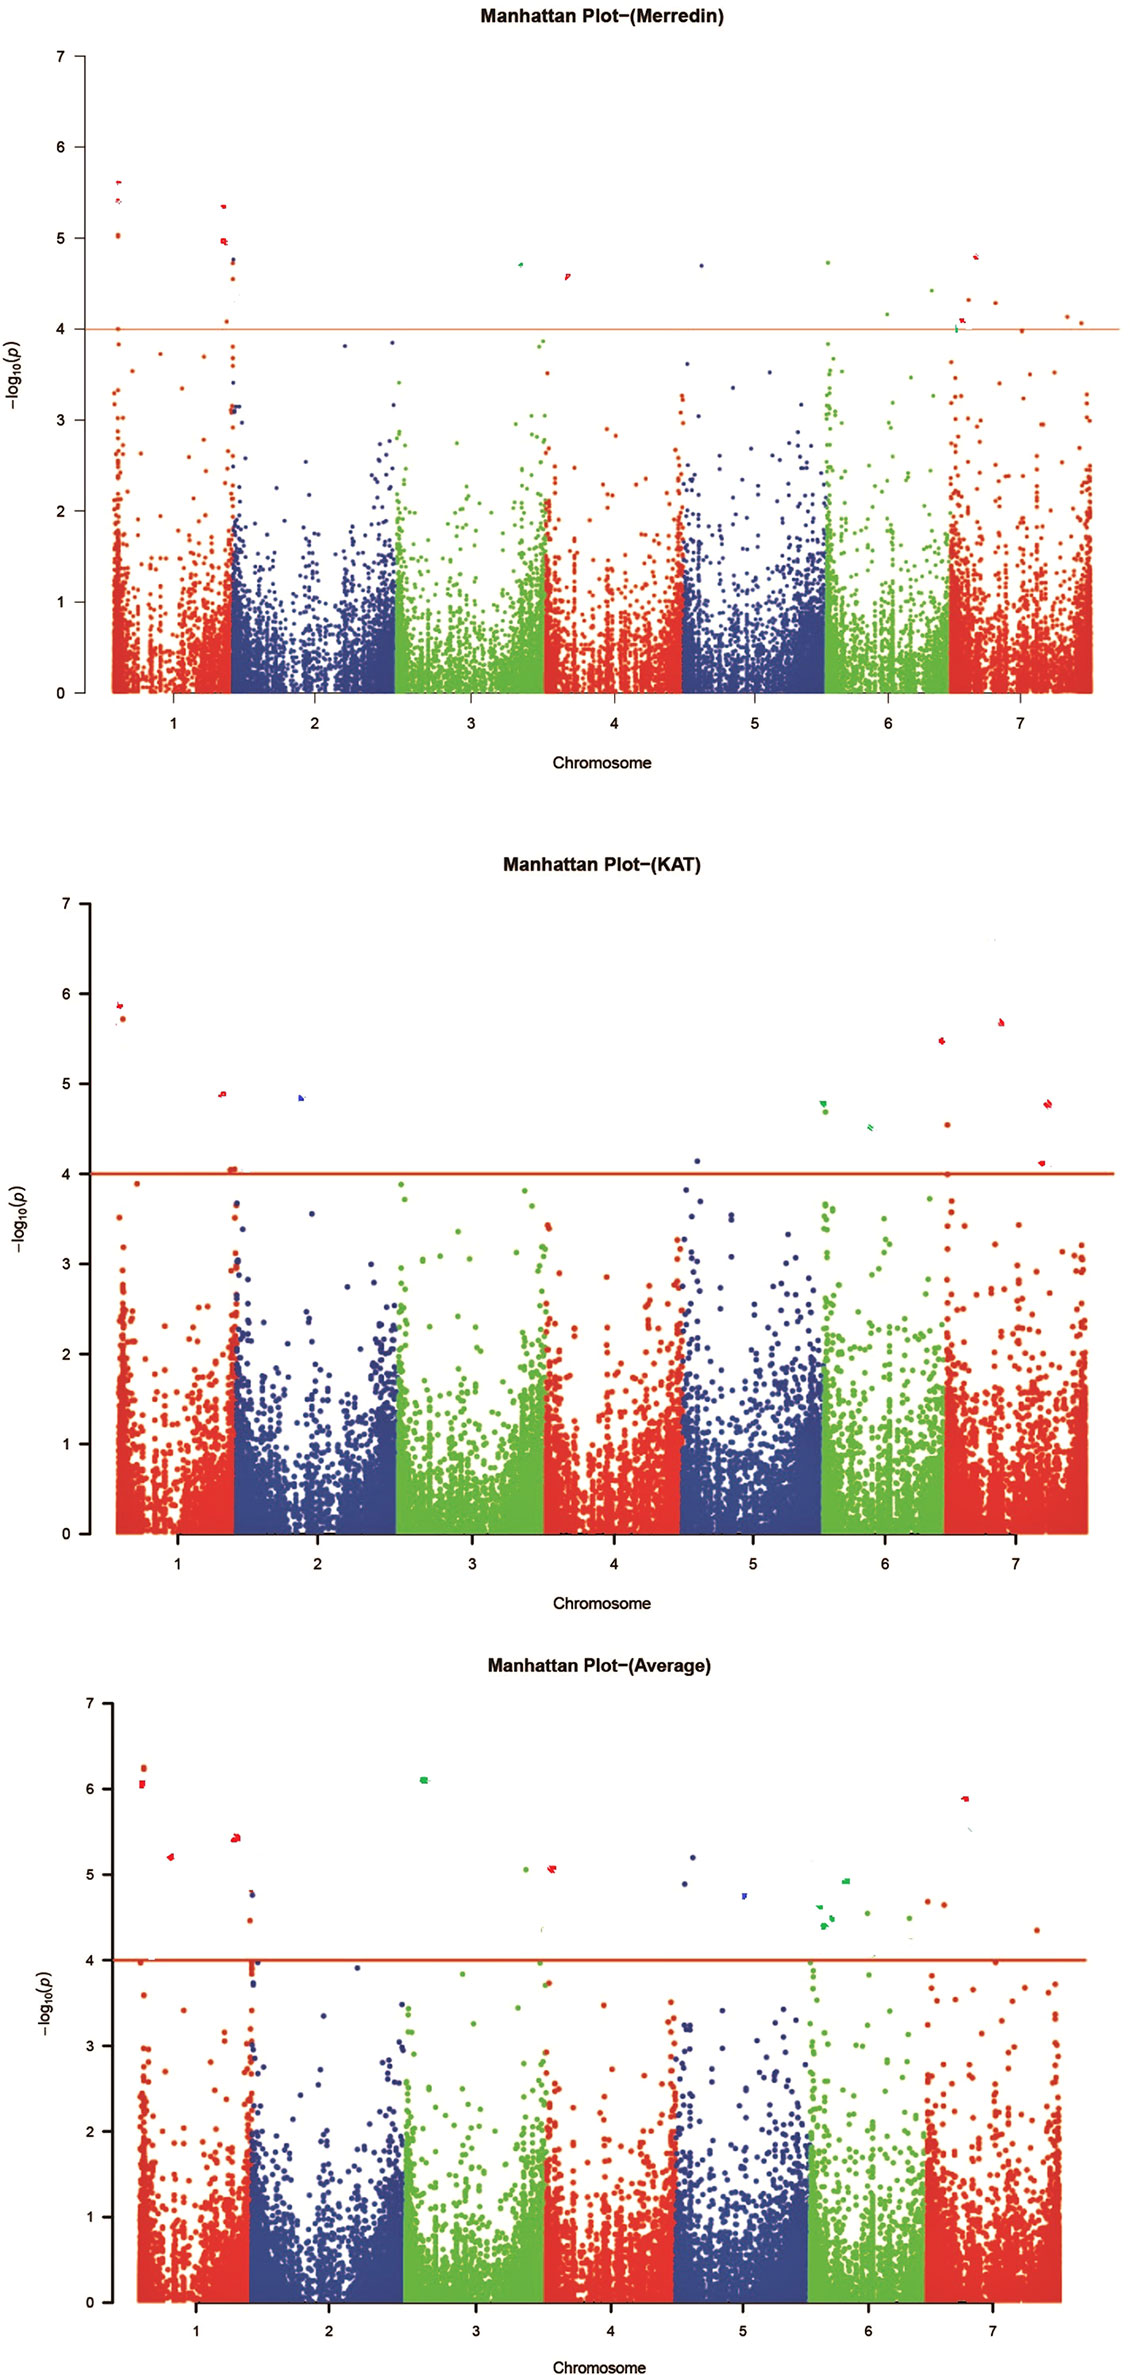
Figure 4 Manhattan plots for genome-wide association study (GWAS) of 350 barley accessions grown in Merredin, Katanning, and average for salinity tolerance index during germination under 150 mM NaCl. Each color indicates a different chromosome, the Y-axis is –log (P) values, and the dots above the red line are significant markers at –log10 (P) ≥ 4.0 (Krzywinski et al., 2009).
Marker-Trait Associations for Salinity Tolerance Index During Germination
The threshold level was determined at a significance level of P = 0.05. Centered on the same, the genome-wide significance threshold for this study was P = 1.39×10⁻⁴ or –log10 (P) = 3.86 (rounded to 4.0). The selected markers were corrected for multiple testing, and those with q-values (FDR adjusted P-value) < 0.05 were considered accurately significant. Fifty-one markers (18 from Merredin, 13 from Katanning, and 21 from the average of the two sites), associated with the salinity tolerance index at germination were detected across all chromosomes, when –log10 (P) > 4.0. (Figure 4). Of these, L1H018492689 explained R2 value of 11.03% and D7H016569501 for 6.33% as the highest and lowest, respectively (Supplementary Table 3). Five markers were detected at both locations (L1H018492798, L1H018492689, D1H528333687, L7H212035410, and D7H085710245), with eight at Katanning (L2H525371651, L5H070630348, L6H002587116, L6H004005746, D6H074421386, L7H004015622, C7H653619080, and D7H655103370), and 14 at Merredin (L1H018495748, C1H556900705, C1H556900787, D2H001502476, D3H598501321, L4H635824216, L5H044127079, L6H286731484, D6H471369639, L6H495910722, D7H016569501, L7H614807240, and D7H638672485). A hybrid of 21 markers at both locations was detected when the average was used (Supplementary Table 3). Some markers were detected only in one location, while others were present in both—an indication that some QTNs showed gene by environment (G×E) interactions.
Mining of Favorable Marker Alleles Associated With Salinity Tolerance At Germination
The GWAS results are presented in Figure 3 and Supplementary Table 3 for significant markers at –log10 (P) > 4.0 and adjusted P-value (FDR) < 0.05. All significant markers from the two locations (Merredin and Katanning) were considered, and those detected in a range of 3.5 Mb were pooled to select the marker with the highest –log10 (P). Twelve representative significant markers were selected grounding on –log10 (P) > 4.0, overlapping both locations, and presence in one location and average (Table 4). Marker alleles with positive effects for tolerance index were considered favorable alleles, whereas marker alleles with negative effects were deemed unfavorable. Among the favorable marker alleles, L6H495910722, L6H286731484, and L7H614807240 had positive phenotypic effects on salinity tolerance at germination, being 5.3, 1.5, and 1.8%, respectively (Table 3). Salinity tolerance at germination in genotypes with favorable marker alleles was greater than those in genotypes with unfavorable marker alleles. Genotypes BM9204-17 and BM9647D-66 had favorable alleles for marker L6H495910722 and were present in the top 10 and 30 list (Supplementary Table 4 and Table 2) of varieties with the highest tolerance index from both locations. Accessions BM9647D-66 and TR06390 had favorable alleles for markers L6H495910722 and L7H614807240, while genotype SM02544 had favorable alleles for markers L6H495910722 and L6H286731484.
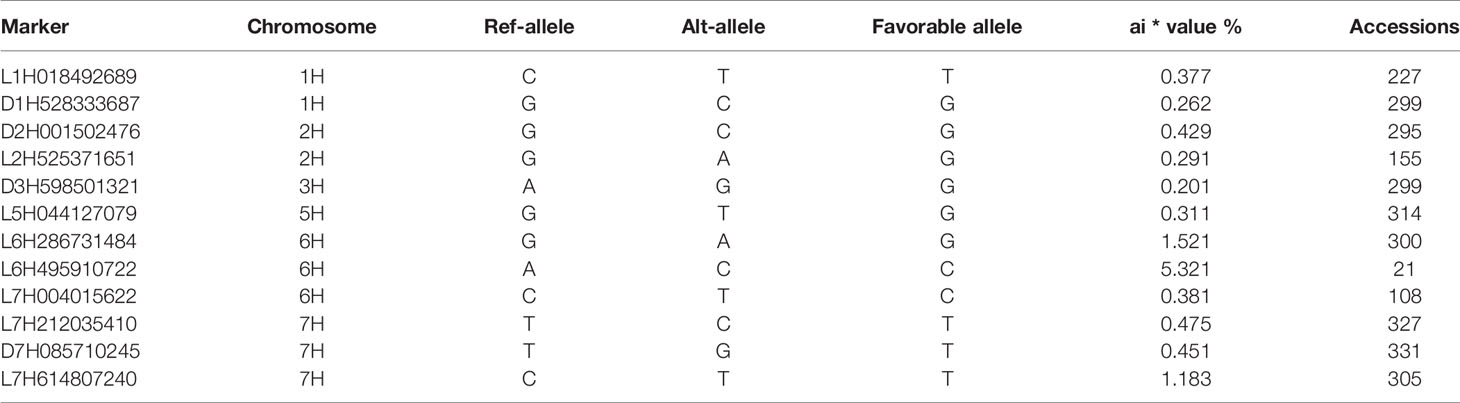
Table 3 Favourable alleles, their phenotypic effects (ai), and the number of accessions.
Quantitative Trait Nucleotides Controlling Salinity Tolerance During Germination in Barley
Significant markers flanking a range of 3.5 Mb were considered under one QTN, with only the highest –log10 (P) selected. Nineteen QTNs for salinity tolerance index during germination were identified from the two locations. Two QTLs were mapped on chromosomes 1H, 2H, and 4H, four each on 5H, 6H, and 7H, and one on 3H (Table 4). In Katanning, we detected ten QTNs—two on chromosome 1H and 6H, four on 7H, and one on 5H and 2H. Twelve QTNs were detected at the Merredin site, four on 7H, one each on 2H, 3H, 4H, and 5H, and two on 2H and 6H. When the average tolerance index value from the two locations was used for the analysis, a hybrid of the QTNs detected from Katanning and Merredin were realized (Table 4). For further analyses, we only considered QTNs that were present at both locations and their average. Four QTNs were present at Merredin, Katanning, and when the average was used, with two each on chromosome 1H and 7H (Table 5).
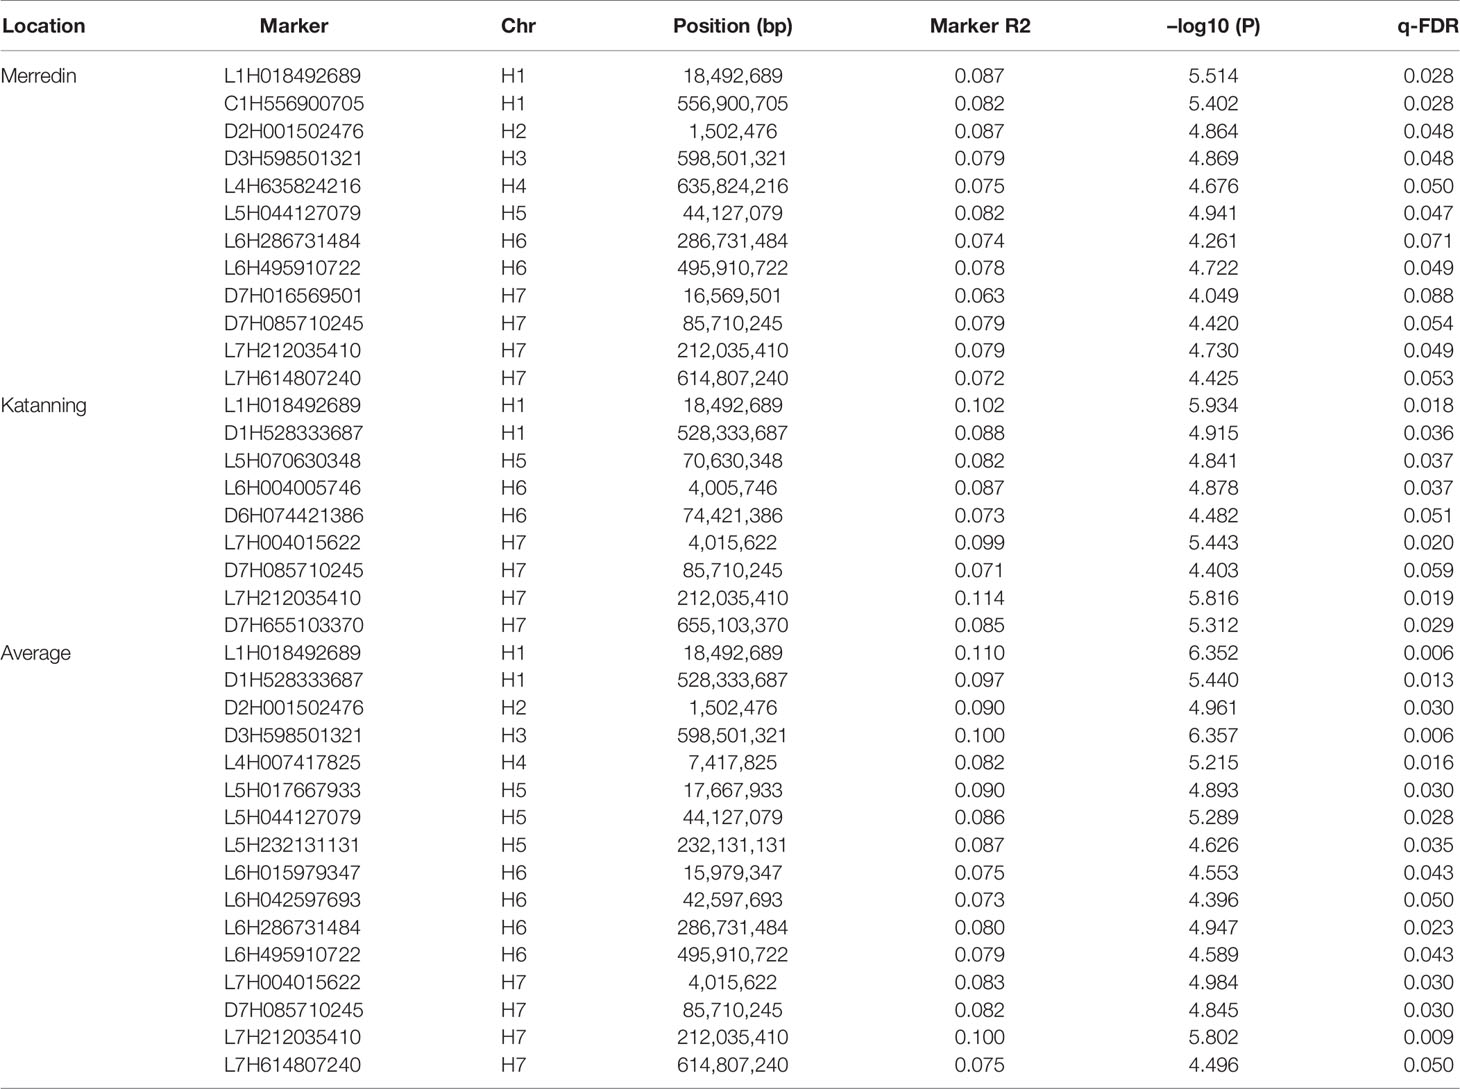
Table 4 Association mapping quantitative trait nucleotides (QTNs) for salinity tolerance at germination in barley.
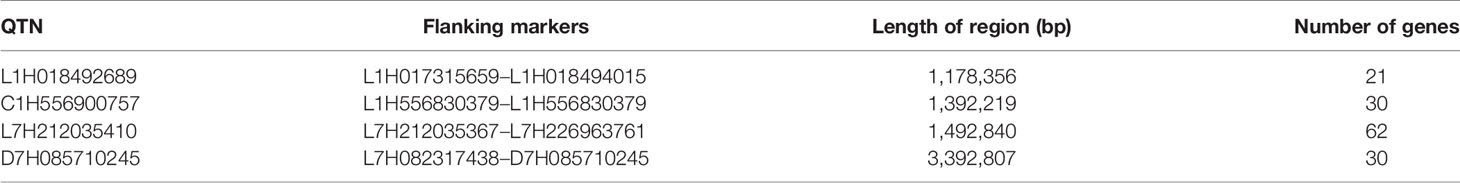
Table 5 Quantitative trait nucleotides present at both locations, estimated flanking region, and gene numbers.
The estimated boundaries of the four QTNs were determined using –log10 (P) (logarithm of the odds –LOD) of the markers, setting the threshold at LOD ≥ 3, i.e., the borders for the intervals were the markers immediately below LOD 3. The most significant marker within the borders was selected as the representative QTN in the region. Two QTNs on chromosome 1H were flanked within an average range of 1.18 Mb for marker L1H018492689 and 1.39 Mb for C1H556900757, while on 7H they oscillated at an average of 1.49 Mb for L7H212035410 and 3.39 Mb for D7H085710245.
Candidate Gene Prediction
A search for possible salt-tolerant candidate genes within the regions flanking each marker, based on the estimated QTNs boundaries above (Table 5), was conducted on the recently published barley reference genome assembly, with 143 genes found (Supplementary Table 5). Of these, four were very close to the most significant markers, or the markers were inside them; hence, they were given a high confidence as possible candidates (Table 6). Genes associated with the following four markers, Piriformospora indica-insensitive protein 2 (L1H018492689), lipase 1 (L7H212035410), protein kinase superfamily protein (C1H556900757), and heat shock protein 21 (D7H085710245), most likely play role in enhancing salinity tolerance during germination, as indicated by their –log10 (P) and % R2 values (Supplementary Table 3). The frequency of B3 domain-containing protein, glutamate-1-semialdehyde-2;1-aminomutase, heat shock protein 21, leucine-rich repeat protein kinase family protein, MADS-box transcription factor family protein, protein kinase superfamily protein, RING/U-box superfamily protein, ubiquitin-like superfamily protein, and zinc finger protein family more than once at different chromosome locations indicated their involvement in enhancing salinity tolerance during germination (Supplementary Table 5).
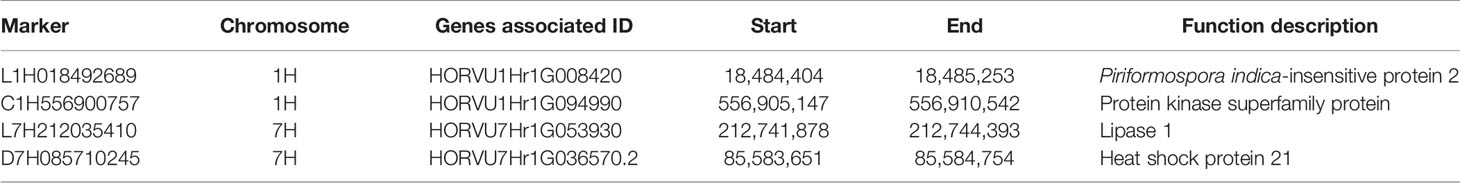
Table 6 Genes close to or embedding significant markers associated with salinity tolerance at germination.
Discussion
Salt Stress Significantly Inhibited Seed Germination
Seed germination is the first and most crucial stage in crop growth and development (Almansouri et al., 2001). It starts with the imbibition of water, which is repressed in the presence of salinity stress, hence disturbing the progression of germination (Othman et al., 2006). Earlier reports have shown that salinity delays the initiation processes, thus reducing germination percentage and vigor (Dodd and Donovan, 1999; Zhihui et al., 2014). The biochemical and physical processes involved are incredibly complex and attributed to osmotic stress and ionic toxicity (Yu et al., 2018). Barley is a Mediterranean field crop that is directly sown in soil in autumn after hot summer, and salt tolerance during seed germination is essential. In this study, salinity reduced the average germination percentage across locations in the barley germplasm by 18.25%, confirming the compound effect of the stress (El Madidi et al., 2004; Abdi et al., 2016). At both locations, germination under salt stress and the tolerance index had a positive correlation (R2 = 0.85–0.90), indicating that adapted barley germplasm has the capacity to withstand salt stress (Munns, 2005; Tajbakhsh et al., 2006; Zhang et al., 2010; Negrão et al., 2017).
Different methods of screening for salinity tolerance have been proposed, including non-stress conditions (Betran et al., 2003), stress conditions, and midway (non-stress and stress) (Ashraf et al., 2015). Selection criteria for salinity stress tolerance include the capacity of germplasm to produce high yields under stress (Rosielle and Hamblin, 1981), the stress susceptibility index being the degree of damage caused (Fischer and Maurer, 1978), and the stress tolerance index, being the percentage of yield under stress and non-stress conditions in the same germplasm (Angessa et al., 2017).The stress tolerance index is not suitable for genotypes that produce low yields under non-stress conditions (Kumar et al., 2014); it can be used to identify genotypes that produce high yields under both stress and non-stress conditions (Askari et al., 2016). Allel et al. (2019) evaluated various indices for salinity tolerance screening and confirmed that the salt-tolerance index is a better selection tool for highly salt-tolerant and productive barley genotypes under salinity, as reported by others (Ali et al., 2007; Shahzad et al., 2012; Senguttuvel et al., 2016). Traits with high rates of variation are among the most indicative and responsive under stress and can be used for the selection using tolerance indices, such as the tolerance index (TOL), salinity susceptibility index (SSI), geometric mean productivity (GMP), mean productivity (MP), and stress tolerance index (STI). Traits with low rates of variation are not suitable for selecting tolerant barley genotypes using tolerance indices under stress (Jamshidi and Javanmard, 2017). Nayyeripasand et al. (2019) reported a positive correlation among stress tolerance indices, including STI, SSI, and TOL, but not in the subgroups. Yu et al. (2018) reported that salt-tolerance levels in rice (O. sativa) were not strongly correlated with rice subgroups, which was confirmed in a maize population the following year (Luo et al., 2019). Tolerance indices do not accurately distinguish cultivars under severe stress (Mardeh et al., 2006; Mohammadi, 2019), but can be used as indicators for high-yielding, salt-tolerant lines in stress, and non-stress environments or for traits like germination (Nayyeripasand et al., 2019; Sedri et al., 2019).
Barley Reference Genome and High-Density Markers Facilitate the Prediction of Candidate Genes Through Genome-Wide Association
To boost barley production in salt-prone areas, unique genes and alleles linked to salt tolerance at germination must be identified in a wider range of barley accessions. GWAS is an alternative and complementary approach that takes advantage of historical recombinations in a high-resolution genome scan to identify regions that are responsive to the traits (Zhao et al., 2011). Several QTLs for salt-tolerant traits at the germination stage have been reported (Mano and Takeda, 1997; Hanen et al., 2014; Angessa et al., 2017). Fan et al. (2015) reported two QTLs for salinity tolerance and N+ content on chromosomes 7H and 2H in a DH population of TX9425 × Franklin that were closely linked to markers D7H085710245 and D2H001502476, respectively. A QTL for salinity tolerance mapped on 1H in a YYXT × Franklin DH population was closely linked to marker C1H556900757 (Zhou et al., 2012), as reported in this study. Using 206 barley accessions collected worldwide, 408 Diversity Arrays Technology (DArT) markers, and GWAS, Fan et al. (2016) reported a QTL on 2H that is closely linked to marker D2H001502476. Direct comparisons of our GWAS findings with other studies is tricky, as the marker-trait linkages and chromosomal locations we identified were based on a worldwide barley panel not previously investigated for salinity traits.
Our GWAS for the salinity tolerance index during germination was undertaken on 350 barley accessions using 24,138 DArTseq and SNP markers. Our findings will be a source of new understanding into the genetic basis of salt tolerance at germination and the identification of alleles underlying variation in the trait and candidate genes. Markers with significant effects identified at both locations were selected. We detected 19 QTNs for the tolerance index during germination across the barley genome, showing the complex genetic architecture of salinity tolerance in barley during germination, which is genetically and physiologically controlled by multiple small-effect genes (Flowers, 2004). The significant markers associated with the QTNs will form a basis for marker-assisted selection in barley breeding programs. Conferring with the released genome sequence of barley (Mascher et al., 2017) and gene annotation information, four candidate genes for the tolerance index during germination, belonging to four families, were predicted around the reliable QTNs in the QTN clusters (Table 6). In a GWAS study on rice, Naveed et al. (2018) reported 20 QTNs within 22 genes associated with salinity stress at the germination and seedling stages, including kinase family protein, as found in our study. Yu et al. (2018) and Cui et al. (2018) identified 17 and 66 genes, respectively, contributing to salinity tolerance during germination in rice.
Nine markers were identified in Katanning and 12 in Merredin, with four overlapping at both locations (Supplementary Table 3). This indicates that salinity tolerance encompasses a complex of mechanisms at both the molecular and plant level that is controlled by many genes affected by the environment and genotype-by-environment (G × E) interactions (Arzani and Ashraf, 2016). The heritability values observed in this study indicated that the variation in tolerance index (germination in salt divided by germination in DI water) was mainly a factor of salinity concentration with a small genetic component. However, salinity tolerance is an important trait in barley that is inherited quantitatively and strongly influenced by environmental conditions (Jabbari et al., 2018), as indicated by the significant interactions among genotypes, salinity tolerance, and location in this study (Table 1). Estimated heritability defines how a trait is affected by genotype; however, it is not a total quantifier of how genes and the environment govern a phenotype, but specific to the population and environment under study. It does not account for the effect of missing or the lack of variable factors in the population (Yu et al., 2016).
Candidate Genes Reveal the Possible Molecular Basis of Salinity Tolerance at Germination
Of the 4 genes associated with salinity stress tolerance traits identified in this study, P. indica-insensitive protein 2 is reportedly involved in salinity tolerance through its interaction with phytohormones (auxins, cytokinin, gibberellins, abscisic acid, ethylene, salicylic acid, jasmonates, and brassinosteroids) in Arabidopsis (Xu L. et al., 2018). When barley and rice roots were colonized by endophytic basidiomycete fungi (P. indica), the host plants enhanced performance under salinity stress (Baltruschat et al., 2008; Vahabi et al., 2016; Jogawat et al., 2016). The protein kinase superfamily is another important gene family that has been characterized in several plants; e.g., for drought tolerance in barley (Cieśla et al., 2016; Yang et al., 2017) and salinity stress tolerance in wheatgrass (Shen et al., 2001). Protein kinase gene family, regulated by transcription factors (TFs) and microRNAs (miRNAs), plays key roles in salt stress tolerance in cotton (Shehzad et al., 2019). Overexpressed transgenic plants of soybean with protein kinase showed significantly increased tolerance to salt stress, suggesting that it plays a pivotal role in salinity tolerance (QIU et al., 2019). Arabidopsis thaliana, abscisic acid (ABA)-non-activated protein kinases regulates reactive oxygen species (ROS) homeostasis and triggers genes expression under salinity stress (Szymańska et al., 2019).
In Arabidopsis, lipase expression is prompted by NaCl; its overexpression enhances salinity tolerance in transgenic plants, relative to non-transformed control plants, which facilitates seed germination, vegetative growth, flowering, and seed set (Naranjo et al., 2006). Studies have suggested that heat shock protein are likely to be involved in tolerance to other abiotic stresses such as salinity apart from thermal stresses (Song and Ahn, 2011; Mu et al., 2013). Transgenic tobacco plants with heat shock protein of alfalfa exhibited enhanced tolerance to salinity in comparison to wild type plants, in terms of germination rates (Lee et al., 2012). Overexpression of maize heat shock transcription factor enhanced thermo, increased the sensitivity to abscisic acid and salinity stress tolerance in transgenic Arabidopsis (Jiang et al., 2018). High expression of heat shock protein genes in barley have been reported in tissue—specific manner salinity stress (Chaudhary et al., 2019). The gene families mentioned above have been associated with stress tolerance, including salinity, in barley, related relatives, and other organisms. This finding will form the basis of more detailed studies to discover and validate the mechanism by which candidate genes play roles in salinity tolerance during germination in barley.
Data Availability Statement
The datasets analyzed and generated for this study are included in the article/Supplementary Material.
Author Contributions
EM performed phenotyping experiments. EM, GZ, and CH conducted data analysis and interpretation. GZ, X-QZ, and CH generated the genotypic data. TA and CL conducted field experiments. CL, YH, and TA conceived the project. EM drafted paper with inputs from YH, TA, and CH. CL revised the paper and approved the final version for publication.
Funding
This study was supported by grants from the Australian Grains Research and Development Corporation and Murdoch University through Western Barley Genetic Alliance, Western Australia State Agricultural Biotechnology Centre and The Department of primary and Industry and Regional Development.
Conflict of Interest
The authors declare that the research was conducted in the absence of any commercial or financial relationships that could be construed as a potential conflict of interest.
Acknowledgments
We appreciate the expert assistance from the institution and staff of Murdoch University, Western Barley Genetics Alliance, Western Australian State Agricultural Biotechnology Centre, and The Department of Primary Industries and Regional Development. The authors acknowledge technical support from Ms. Sharon Westcott, Ms. LeeAnne McFawn, Ms. Jenny Bussanich, and Mr. David Farleigh. We are grateful to Cong Tang and Tianhua He for their input in drafting the manuscript.
Supplementary Material
The Supplementary Material for this article can be found online at: https://www.frontiersin.org/articles/10.3389/fpls.2020.00118/full#supplementary-material
Supplementary Figure 1 | A map showing geographical representation and origin of barley accessions used in this study.
Supplementary Figure 2 | Annual average weather pattern for Merredin and Katanning as reported by the Australian Bureau of Meteorology (http://www.bom.gov.au/index.php).
Supplementary Figure 3 | Correlation coefficient for germination in 150 mM NaCl against tolerance index for seeds from Merredin and Katanning.
Supplementary Figure 4 | Estimate of the most probable number of clusters (k) and population structure.
Supplementary Figure 5 | Average germination percent distribution of 350 barley accession in deionized water.
References
Abdi, N., Wasti, S., Slama, A., Salem, M. B., Faleh, M. E., Mallek-Maalej, E. (2016). Comparative study of salinity effect on some Tunisian barley cultivars at germination and early seedling growth stages. J. Plant Physiol. Pathol. 4, 3. doi: 10.4172/2329-955X.1000151
Adjel, F., Kadi, Z., Bouzerzour, H., Benmahammed, A. (2013). Salt stress effects on seed germination and seedling growth of barley (Hordeum Vulgare L.) genotypes. J. Agric. Sustainability 3 (2), 223–237.
Ali, Z., Salam, A., Azhar, F. M., Khan, I. A. (2007). Genotypic variation in salinity tolerance among spring and winter wheat (Triticum aestivum) accessions. South Afr. J. Bot. 73, 70–75. doi: 10.1016/j.sajb.2006.08.005
Allakhverdiev, S. I., Sakamoto, A., Nishiyama, Y., Inaba, M., Murata, N. (2000). Ionic and osmotic effects of NaCl-induced inactivation of photosystems I and II in Synechococcus sp. Plant Physiol. 123, 1047–1056. doi: 10.1104/pp.123.3.1047
Allel, D., BenAmar, A., Badri, M., Abdelly, C. (2019). Evaluation of salinity tolerance indices in North African barley accessions at reproductive stage. Czech J. Genet. Plant Breed. 55 (2), 61–69. doi: 10.17221/50/2017-CJGPB
Almansouri, M., Kinet, J. M., Lutts, S. (2001). Effect of salt and osmotic stresses on germination in durum wheat (Triticum durum Desf.). Plant Soil 231, 243–254. doi: 10.1023/A:1010378409663
Angessa, T. T., Zhang, X. Q., Zhou, G., Zhang, W., Li, C., Broughton, S. (2017). Early growth stages salinity stress tolerance in CM72 × Gairdner doubled haploid barley population. PloS One 12 (6), e0179715. doi: 10.1371/journal.pone.0179715
Arzani, A., Ashraf, M. (2016). Smart engineering of genetic resources for enhanced salinity tolerance in crop plants. Crit. Rev. Plant Sci. 35, 146–189. doi: 10.1080/07352689.2016.1245056
Ashraf, A., Abd, E.-S. M.A., Gheith, E. M. S., Suleiman, H. S. (2015). Using different statistical procedures for evaluation drought tolerance indices of bread wheat genotypes. Adv. Agric. Biol. 4 (1), 19–30. doi: 10.15192/PSCP.AAB.2015.4.1.1930
Askari, H., Kazemitabar, S., Zarrini, H. (2016). Salt tolerance assessment of barley (Hordeum vulgare L.) genotypes at germination stage by tolerance indices. Open Agric. 1 (1), 2016-0005. doi: 10.1515/opag-2016-0005
Baltruschat, H., Fodor, J., Harrach, B., Niemczyk, E., Barna, B., Gullner, G., et al. (2008). Salt tolerance of barley induced by the root endophyte Piriformospora indica is associated with a strong increase in antioxidants. New Phytol. 180 (2), 501–510. doi: 10.1111/j.1469-8137.2008.02583.x
Bates, D., Maechler, M., Bolker, B., Walker, S. (2015). Fitting linear mixed-effects models using lme4. J. Stat. Software 67 (1), 1–48. doi: 10.18637/jss.v067.i01
Benjamini, Y., Hochberg, Y. (1995). Controlling the false discovery rate - a practical and powerful approach to multiple testing. J. R. Stat. Soc. Ser. B-Methodol. 57, 289–300. doi: 10.1111/j.2517-6161.1995.tb02031.x
Bernstein, L. (1975). Effects of salinity and sodicity on plant growth. Annu. Rev. Phytopathol. 13 (1), 295–312. doi: 10.1146/annurev.py.13.090175.001455
Betran, F. J., Beck, D., Banziger, M., Edmeades, G. O. (2003). Genetic analysis of inbred and hybrid grain yield under stress and non-stress environments in tropical maize. Crop Sci. 200343, 807–817. doi: 10.2135/cropsci2003.8070
Bliss, R. D., Plattaloia, K. A., Thomson, W. W. (1986). Osmotic sensitivity in relation to salt sensitivity in germinating barley seeds. Plant Cell Environ. 9, 721–725. doi: 10.1111/j.1365-3040.1986.tb02104.x
Bothmer, R., Jacobsen, N., Baden, C., Jørgensen, R. B., Linde-Laursen, I. (1995). An ecogeographical study of the genus Hordeum (2nd edition). Systematic and Ecogeographis Studies on Crop Genepools 7 (Rome: International Plant Genetic Resources Institute).
Bradbury, P. J., Zhang, Z., Kroon, D. E., Casstevens, T. M., Ramdoss, Y., Buckler, E. S. (2007). TASSEL: software for association mapping of complex traits in diverse samples. Bioinformatics 23, 2633–2635. doi: 10.1093/bioinformatics/btm308
Browning, S. R., Browning, B. L. (2007). Rapid and accurate haplotype phasing and missing-data inference for whole-genome association studies by use of localized haplotype clustering. Am. J. Hum. Genet. 81, 1084–1097. doi: 10.1086/521987
Cattivelli, L., Baldi, P., Crosatti, C., Di Fonzo, N., Faccioli, P., Grossi, M., et al. (2002). Chromosome regions and stress-related sequences involved in resistance to abiotic stress in Triticeae. Plant Mol. Biol. 48, 649–665. doi: 10.1023/A:1014824404623
Chaudhary, R., Baranwal, V. K., Kumar, R., Sircar, D., Chauhan, H. (2019). Genome-wide identification and expression analysis of Hsp70, Hsp90, and Hsp100 heat shock protein genes in barley under stress conditions and reproductive development. Funct. Integr. Genomics ,19 (6), 1007–1022. doi: 10.1007/s10142-019-00695-y
Chen, Z., Cuin, T. A., Zhou, M., Twomey, A., Naidu, B. P., Shabala, S. (2007). Compatible solute accumulation and stress-mitigating effects in barley genotypes contrasting in their salt tolerance. J. Exp. Bot. 58, 4245–4255. doi: 10.1093/jxb/erm284
Cieśla, A., Mituła, F., Misztal, L., Fedorowicz-Strońska, O., Janicka, S., Tajdel-Zielińska, M., et al. (2016). A role for barley calcium-dependent protein kinase CPK2a in the response to drought. Front. Plant Sci. 7, 1550. doi: 10.3389/fpls.2016.01550
Cui, Y., Zhang, F., Zhou, Y. (2018). The application of multi-locus GWAS for the detection of salt-tolerance loci in rice. Front. Plant Sci. 9, 1464. doi: 10.3389/fpls.2018.01464
Dodd, G. L., Donovan, L. A. (1999). Water potential and ionic effects on germination and seedling growth of two cold desert shrubs. Am. J. Bot. 86 (8), 1146–1153. doi: 10.2307/2656978
El Madidi, S., El Baroudi, B., Fouzia, B. A. (2004). Effects of salinity on germination and early growth of barley (Hordeum vulgare L.) cultivars. Intern. J. Agric. Biol. 1560 (8530), 767–770.
Evanno, G., Regnaut, S., Goudet, J. (2005). Detecting the number of clusters of individuals using the software STRUCTURE: a simulation study. Mol. Ecol. 14, 2611–2620. doi: 10.1111/j.1365-294X.2005.02553.x
Fan, Y., Shabala, S., Ma, Y., Xu, R., Zhou, M. (2015). Using QTL mapping to investigate the relationships between abiotic stress tolerance (drought and salinity) and agronomic and physiological traits. BMC Genomics 16 (1), 43. doi: 10.1186/s12864-015-1243-8
Fan, Y., Zhou, G., Shabala, S., Chen, Z. H., Cai, S., Li, C., et al. (2016). Genome-wide association study reveals a new QTL for salinity tolerance in barley (Hordeum vulgare L.). Front. Plant Sci. 7, 946–956. doi: 10.3389/fpls.2016.00946
Fischer, R. A., Maurer, R. (1978). Drought resistance in spring wheat cultivars. Part 1: grain yield response. Aust. J. Agric. Res. 29, 897–912. doi: 10.1071/AR9780897
Flowers, T. J. (2004). Improving crop salt tolerance. J. Exp. Bot. 55, 307–319. doi: 10.1093/jxb/erh003
Gorzolka, K., Kölling, J., Nattkemper, T. W., Niehaus, K. (2016). Spatiotemporal metabolite profiling of the barley germination process by MALDI MS imaging. PloS One 11, e0150208. doi: 10.1371/journal.pone.0150208
Gupta, S., Rupasinghe, T., Callahan, D. L., Natera, S. H. A., Smith, P. M. C., Hill, C. B., et al. (2019). Spatio-temporal metabolite and elemental profiling of salt stressed barley seeds during initial stages of germination by MALDI-MSI and µ-XRF spectrometry. Front. Plant Sci. 10, 1139. doi: 10.3389/fpls.2019.01139
Hampson, C. R., Simpson, G. M. (1990). Effects of temperature, salt, and osmotic potential on early growth of wheat (Triticum aestivum L.) germination. Can. J. Botany-Revue Can. Botanique 68, 524–528. doi: 10.1139/b90-072
Hanen, S., Kazuhiro, S., Tariq, S., Moncef, H., Kazutoshi, O. (2014). Detection of QTLs for salt tolerance in Asian barley (Hordeum vulgare L.) by association analysis with SNP markers. Breed. Sci. 64, 378–388. doi: 10.1270/jsbbs.64.378
Hazzouri, K. M., Khraiwesh, B., Amiri, K. M. A., Pauli, D., Blake, T., Shahid, M., et al. (2018). Mapping of HKT1; 5 gene in barley using GWAS approach and its implication in salt tolerance mechanism. Front. Plant Sci. 9, 156. doi: 10.3389/fpls.2018.00156
Hill, C. B., Angessa, T. T., McFawn, L. A., Wong, D., Tibbits, J., Zhang, X. Q., et al. (2019a). Hybridisation-based target enrichment of phenology genes to dissect the genetic basis of yield and adaptation in barley. Plant Biotechnol. J. 17 (5), 932–944. doi: 10.1111/pbi.13029
Hill, C. B., Wong, D., Tibbits, J., Forrest, K., Hayden, M., Zhang, X. Q., et al. (2019b). Targeted enrichment by solution-based hybrid capture to identify genetic sequence variants in barley. Scientific Data Nature. 6 (1), 12. doi: 10.1038/s41597-019-0011-z
Hu, V. W., Addington, A., Hyman, A. (2011). Novel autism subtype-dependent genetic variants are revealed by quantitative trait and subphenotype association analyses of published GWAS data. PloS One 6 (4), e19067. doi: 10.1371/journal.pone.0019067
Hubisz, M. J., Falush, D., Stephens, M., Pritchard, J. K. (2009). Inferring weak population structure with the assistance of sample group information. Mol. Ecol. Resour. 9, 1322–1332. doi: 10.1111/j.1755-0998.2009.02591.x
Jabbari, M., Fakheri, B. A., Aghnoum, R., Mahdi Nezhad, N., Ataei, R. (2018). GWAS analysis in spring barley (Hordeum vulgare L.) for morphological traits exposed to drought. PloS One 13 (9), e0204952. doi: 10.1371/journal.pone.0204952
Jamshidi, A., Javanmard, H. R. (2017). Evaluation of barley (Hordeum vulgare L.) genotypes for salinity tolerance under field conditions using the stress indices. Ain Shams Eng J. 9, 2093–2099. doi: 10.1016/j.asej.2017.02.006
Jiang, Y., Zheng, Q., Chen, L., Liang, Y., Wu, J. (2018). Ectopic overexpression of maize heat shock transcription factor gene ZmHsf04 confers increased thermo and salt-stress tolerance in transgenic Arabidopsis. Acta physiologiae plant. 40 (1), 9. doi: 10.1007/s11738-017-2587-2
Jogawat, A., Vadassery, J., Verma, N., Oelmüller, R., Dua, M., Nevo, E., et al. (2016). PiHOG1, a stress regulator MAP kinase from the root endophyte fungus Piriformospora indica, confers salinity stress tolerance in rice plants. Sci. Rep. 16 (6), 36765. doi: 10.1038/srep36765
Kazemi, K., Eskandari, H. (2011). Effects of salt stress on germination and early seedling growth of rice (Oryza sativa) cultivars in Iran. Afr. J. Biotechnol. 10, 17789–17792. doi: 10.5897/AJB11.2219
Kilian, B., Graner, A. (2012). NGS technologies for analyzing germplasm diversity in gene banks. Brief. Funct. Genomics 11 (1), 38–50. doi: 10.1093/bfgp/elr046
Kruijer, W., Boer, M. P., Malosetti, M., Flood, P. J., Engel, B., Kooke, R., et al. (2015). Marker-based estimation of heritability in immortal populations. Genetics 199 (2), 379–398. doi: 10.1534/genetics.114.167916
Krzywinski, I. M., Schein, E. J., Birol, I., Connors, J., Gascoyne, R., Horsman, D., et al. (2009). Circos: an information aesthetic for comparative genomics. Genome Res. 19, 1639–1645. doi: 10.1101/gr.092759.109
Kumar, S., Dwivedi, S. K., Singh, S. S., Jha, S. K. (2014). Identification of drought tolerant rice genotypes by analysing drought tolerance indices and morpho-physiological traits. Sabrao J. Breed. Genet. 46 (2), 217–230.
Lee, K. W., Cha, J. Y., Kim, K. H., Kim, Y. G., Lee, B. H., Lee, S. H. (2012). Overexpression of alfalfa mitochondrial HSP23 in prokaryotic and eukaryotic model systems confers enhanced tolerance to salinity and arsenic stress. Biotechnol. Lett. 34 (1), 167–174. doi: 10.1007/s10529-011-0750-1
Leon, B. (1963). Osmotic adjustment to saline media II. Dynamic phase. Am. J. Bot. 50 (4), 360–370. doi: 10.2307/2440153
Li, X., Zhou, Z., Ding, J., Wu, Y., Zhou, B., Wang, R., et al. (2016). Combined linkage and association mapping reveals qtl and candidate genes for plant and ear height in maize. Front. Plant Sci. 7, 833–834. doi: 10.3389/fpls.2016.00833
Luo, X., Wang, B., Gao, S., Zhang, F., Terzaghi, W., Dai, M. (2019). Genome-wide association study dissects the genetic bases of salt tolerance in maize seedlings. J. Integr. Plant Biol. 61 (6), 658–674. doi: 10.1111/jipb.12797
Mano, Y., Takeda, K. (1997). Mapping quantitative trait loci for salt tolerance at germination and the seedling stage in barley (Hordeum vulgare L.). Euphytica 94, 263–272. doi: 10.1023/A:1002968207362
Mano, Y., Nakazumi, H., Takeda, K. (1996). Varietal variation in effects of some major genes on salt tolerance at the germination stage in barley. Breed. Sci. 46, 227–233. doi: 10.1270/jsbbs1951.46.227
Mardeh, A. S. S., Ahmadi, A., Poustini, K., Mohammadi, V. (2006). Evaluation of drought resistance indices under various environmental conditions. Field Crops Res. 98 (2-3), 222–229. doi: 10.1016/j.fcr.2006.02.001
Mascher, M., Gundlach, H., Himmelbach, A., Beier, S., Twardziok, S.-O., Wicker., T., et al. (2017). A chromosome conformation capture ordered sequence of the barley genome. Nature 544, 427–448. doi: 10.1038/nature22043
Mei, H., Zhu, X., Zhang, T. (2013). Favorable QTL alleles for yield and its components identified by association mapping in Chinese upland cotton cultivars. PloS One 8 (12), e82193. doi: 10.1371/journal.pone.0082193
Mohammadi, R. (2019). The use of a combination scoring index to improve durum productivity under drought stress. Exp. Agric. 2019, 1–10. doi: 10.1017/S0014479719000231
Mu, C., Zhang, S., Yu, G., Chen, N., Li, X., Liu, H. (2013). Overexpression of small heat shock protein LimHSP16. 45 in Arabidopsis enhances tolerance to abiotic stresses. PloS One 8 (12), e82264. doi: 10.1371/journal.pone.0082264
Munns, R., Tester, M. (2008). Mechanisms of salinity tolerance. Annu. Rev. Plant Physiol. 59, 651–681. doi: 10.1146/annurev.arplant.59.032607.092911
Munns, R. (2005). Genes and salt tolerance: bringing them together. New Phytol. 167, 645–663. doi: 10.1111/j.1469-8137.2005.01487.x
Naranjo, M. A., Forment, J., Roldan, M., Serrano, R., Vicente, O. (2006). Overexpression of Arabidopsis thaliana LTL1, a salt-induced gene encoding a GDSL-motif lipase, increases salt tolerance in yeast and transgenic plants. Plant Cell Environ. 29, 1890–1900. doi: 10.1111/j.1365-3040.2006.01565.x
Naveed, S. A., Zhang, F., Zhang, J., Zheng, T. Q., Meng, L. J., Pang, Y. L., et al. (2018). Identification of QTN and candidate genes for salinity tolerance at the germination and seedling stages in rice by genome-wide association analyses. Sci. Rep. 8, 6505. doi: 10.1038/s41598-018-24946-3
Nayyeripasand, L., Garosi, G. A., Ahmadikhah, A. (2019). Selection for salinity tolerance in an international rice collection at vegetative stage. Aust. J. Crop Sci. 13 (6), 837. doi: 10.21475/ajcs.19.13.06.p1327
Negrão, S., Schmöckel, S. M., Tester, M. (2017). Evaluating physiological responses of plants to salinity stress. Ann. Bot. 119 (1), 1–11. doi: 10.1093/aob/mcw191
Oberthur, L., Blake, T. K., Dyer, W. E., Ullrich, S. E. (1995). Genetic analysis of seed dormancy in barley (Hordeum vulgare L.). J. Agric. Genomics 1, 5.
Othman, Y., Al-Karaki, G., Al-Tawaha, A., Al-Horani, A. (2006). Variation in germination and ion uptake in barley genotypes under salinity conditions. World J. Agric. Sci. 2, 11–15.
Qiu, Y. W., Zhe, F. E. N. G., Fu, M. M., Yuan, X. H., Luo, C. C., Yu, Y. B., et al. (2019). GsMAPK4, a positive regulator of soybean tolerance to salinity stress. J. Integr. Agric. 18 (2), 372–380. doi: 10.1016/S2095-3119(18)61957-4
R Core Team. (2014). R: A language and environment for statistical computing (Vienna, Austria: R Foundation for Statistical Computing). URL http://www.R-project.org/.
Rosielle, A. A., Hamblin, J. (1981). Theoretical aspects of selection for yield in stress and non-stress environment. Crop Sci. 21, 943–946. doi: 10.2135/cropsci1981.0011183X002100060033x
Russell, J., Dawson, I. K., Flavell, A. J., Steffenson, B., Weltzien, E., Booth, A., et al. (2011). Analysis of >1000 single nucleotide polymorphisms in geographically matched samples of landrace and wild barley indicates secondary contact and chromosome-level differences in diversity around domestication genes. New Phytol. 191 (2), 564–578. doi: 10.1111/j.1469-8137.2011.03704.x
Sayar, R., Bchini, H., Moshabi, M., Ezzine, M. (2010). Effect of salt and drought stress on germination, emergence and seedling growth of durum wheat (Triticum durum Desf.). Afr. J. Agric. Res. 5 (15), 2008–2016.
Sedri, M. H., Amini, A., Golchin, A. (2019). Evaluation of nitrogen effects on yield and drought tolerance of rainfed wheat using drought stress indices. J. Crop Sci. Biotechnol. 22 (3), 235–242. doi: 10.1007/s12892-018-0037-0
Senguttuvel, P., Sravan Raju, N., Padmavathi, G., Sundaram, R. M., Madhav, S., Hariprasad, A. S., et al. (2016). Identification and quantification of salinity tolerance through salt stress indices and variability studies in rice (Oryza sativa L.). SABRAO J. Breed. Genet. 48, 172–179.
Shahzad, A., Ahmad, M., Iqbal, M., Ahmed, I., Ali, G. M. (2012). Evaluation of wheat landrace genotypes for salinity tolerance at vegetative stage by using morphological and molecular markers. Genet. Mol. Res. 11, 679–692. doi: 10.4238/2012.March.19.2
Shehzad, M., Zhou, Z., Ditta, A., Cai, X., Khan, M., Xu, Y., et al. (2019). Genome-wide mining and identification of protein kinase gene family impacts salinity stress tolerance in highly dense genetic map developed from interspecific cross between G. hirsutum L., and G. darwinii G. Watt. Agronomy 9 (9), 560. doi: 10.3390/agronomy9090560
Shelden, M. C., Roessner, U., Sharp, R. E., Tester, M., Bacic, A. (2013). Genetic variation in the root growth response of barley genotypes to salinity stress. Funct. Plant Biol. 40, 516–530. doi: 10.1071/FP12290
Shelden, M. C., Dias, D. A., Jayasinghe, N. S., Bacic, A., Roessner, U. (2016). Root spatial metabolite profiling of two genotypes of barley (Hordeum vulgare L.) reveals differences in response to short-term salt stress. J. Exp. Bot. 67 (12), 3731–3745. erw059 doi: 10.1093/jxb/erw059
Shen, W., Gómez-Cadenas, A., Routly, E. L., Ho, T. H., Simmonds, J. A., Gulick, P. J. (2001). The salt stress-inducible protein kinase gene, Esi47, from the salt-tolerant wheatgrass Lophopyrum elongatum is involved in plant hormone signaling. Plant Physiol. 125 (3), 1429–1441. doi: 10.1104/pp.125.3.1429
Shi, Y., Gao, L., Wu, Z. C., Zhang, X. J., Wang, M. M., Zhang, C. S., et al. (2017). Genome-wide association study of salt tolerance at the seed germination stage in rice. BMC Plant Biol. 17, 92. doi: 10.1186/s12870-017-1044-0
Song, N. H., Ahn, Y. J. (2011). DcHsp17. 7, a small heat shock protein in carrot, is tissue-specifically expressed under salt stress and confers tolerance to salinity. New Biotechnol. 28 (6), 698–704. doi: 10.1016/j.nbt.2011.04.002
Szymańska, K. P., Polkowska-Kowalczyk, L., Lichocka, M., Maszkowska, J., Dobrowolska, G. (2019). SNF1-related protein kinases SnRK2. 4 and SnRK2. 10 modulate ROS homeostasis in plant response to salt stress. Int. J. Mol. Sci. 20 (1), 143. doi: 10.3390/ijms20010143
Tajbakhsh, M., Zhou, M. X., Chen, Z. H., Mendham, N. J. (2006). Physiological and cytological response of salt-tolerant and non-tolerant barley to salinity during germination and early growth. Aust. J. Exp. Agric. 46, 555–562. doi: 10.1071/EA05026
Tondelli, A., Xu, X., Moragues, M., Sharma, R., Schnaithmann, F., Ingvardsen, C., et al. (2013). Structural and temporal variation in genetic diversity of European spring two-row barley cultivars and association mapping of quantitative traits. Plant Genome 6, 1–14. doi: 10.3835/plantgenome2013.03.0007
Vahabi, K., Dorcheh, S. K., Monajembashi, S., Westermann, M., Reichelt, M., Falkenberg, D., et al. (2016). Stress promotes Arabidopsis–Piriformospora indica interaction. Plant Signaling Behav. 11 (5), e1136763. doi: 10.1080/15592324.2015.1136763
Witzel, K., Weidner, A., Surabhi, G. K., Varshney, R. K., Kunze, G., Buck-Sorlin, G. H., et al. (2009). Comparative analysis of the grain proteome fraction in barley genotypes with contrasting salinity tolerance during germination. Plant Cell Environ. 33, 211–222. doi: 10.1111/j.1365-3040.2009.02071.x
Wu, D., Qiu, L., Xu, L., Ye, L., Chen, M., Sun, D., et al. (2011). Genetic variation of HvCBF genes and their association with salinity tolerance in Tibetan annual wild barley. PloS One 6 (7), e22938. doi: 10.1371/journal.pone.0022938
Xu, L., Wu, C., Oelmüller, R., Zhang, W. (2018). Role of phytohormones in Piriformospora indica-induced growth promotion and stress tolerance in plants: More questions than answers. Front. Microbiol. 9, 1646. doi: 10.3389/fmicb.2018.01646
Xu, X., Sharma, R., Tondelli, A., Russell, J., Comadran, J., Schnaithmann, F., et al. (2018). Genome-wide association analysis of grain yield-associated traits in a pan-European barley cultivar collection. Plant Genome (11), 170073. doi: 10.3835/plantgenome2017.08.0073
Xue, D., Huang, Y., Zhang, X., Wei, K., Westcott, S., Li, C., et al. (2009). Identification of QTL associated with salinity tolerance at late growth stage in barley. Euphytica 169, 187–196. doi: 10.1007/s10681-009-9919-2
Yang, Y., Wang, Q., Chen, Q., Yin, X., Qian, M., Sun, X., et al. (2017). Genome wide survey indicates diverse physiological roles of the barley (Hordeum vulgare L.) calcium-dependent protein kinase genes. Sci. Rep. 7, 1–14. doi: 10.1038/s41598-017-05646-w
Yu, L.-X., Liu, X., Boge, W., Liu, X.-P. (2016). Genome-wide association study identifies loci for salt tolerance during germination in autotetraploid alfalfa (Medicago sativa L.) using genotyping-by-sequencing. Front. Plant Sci. 7, 956. doi: 10.3389/fpls.2016.00956
Yu, J., Zhao, W., Tong, W., He, Q., Yoon, M. Y., Li, F. P., et al. (2018). A Genome-wide association study reveals candidate genes related to salt tolerance in rice (Oryza sativa) at the germination stage. Int. J. Mol. Sci. 19, 3145. doi: 10.3390/ijms19103145
Zhang, H., Louis, J. I., Craig, M., Cory, M., Daowei, Z., Peter, K. (2010). The effects of salinity and osmotic stress on barley germination rate: sodium as an osmotic regulator. Ann. Bot. 106, 1027–1035. doi: 10.1093/aob/mcq204
Zhang, T., Qian, N., Zhu, X., Chen, H., Wang, S., Mei, H., et al. (2013). Variations and transmission of QTL alleles for yield and fiber qualities in upland cotton cultivars developed in China. PloS One 8 (2), e57220. doi: 10.1371/journal.pone.0057220
Zhao, K., Tung, C. W., Eizenga, G. C., Wright, M. H., Ali, M. L., Price, A. H., et al. (2011). Genome-wide association mapping reveals a rich genetic architecture of complex traits in Oryza sativa. Nat. Commun. 2, 467. doi: 10.1038/ncomms1467
Zhihui, L., Moxin, X., Daowei, Z., Hongxiang, Z., Yu, T., Yi, W., et al. (2014). Effects of salinity, temperature, and polyethylene glycol on the seed germination of sunflower (Helianthus annuus L.). Sci. World J. 170418, 9. doi: 10.1155/2014/170418
Keywords: genome-wide association, barley, quantitative trait nucleotide, germination, salinity tolerance, genetic marker, marker-trait association
Citation: Mwando E, Han Y, Angessa TT, Zhou G, Hill CB, Zhang X-Q and Li C (2020) Genome-Wide Association Study of Salinity Tolerance During Germination in Barley (Hordeum vulgare L.). Front. Plant Sci. 11:118. doi: 10.3389/fpls.2020.00118
Received: 14 June 2019; Accepted: 27 January 2020;
Published: 21 February 2020.
Edited by:
Giampiero Valè, University of Oriental Piedmont, ItalyReviewed by:
Alessandro Tondelli, Council for Agricultural and Economics Research, ItalyGian Attilio Sacchi, University of Milan, Italy
Copyright © 2020 Mwando, Han, Angessa, Zhou, Hill, Zhang and Li. This is an open-access article distributed under the terms of the Creative Commons Attribution License (CC BY). The use, distribution or reproduction in other forums is permitted, provided the original author(s) and the copyright owner(s) are credited and that the original publication in this journal is cited, in accordance with accepted academic practice. No use, distribution or reproduction is permitted which does not comply with these terms.
*Correspondence: Chengdao Li, Yy5saUBtdXJkb2NoLmVkdS5hdQ==