 Na Li
Na Li Jianli Shang†
 Shuangwu Ma
94% of researchers rate our articles as excellent or good
Learn more about the work of our research integrity team to safeguard the quality of each article we publish.
Find out more
ORIGINAL RESEARCH article
Front. Plant Sci. , 19 February 2020
Sec. Plant Breeding
Volume 11 - 2020 | https://doi.org/10.3389/fpls.2020.00116
The flesh color of watermelon (Citrullus lanatus) is an important fruit quality trait that helps to determine fruit attractiveness and is potentially beneficial to human health. Previous inheritance analyses determined that a single dominant gene, Yscr, produces the scarlet red flesh color rather than the coral red flesh color in watermelon. However, no genomic region or gene-based molecular markers for the locus Yscr have been reported thus far. In the present study, two high-density genetic maps and whole-genome variation detection aided by genome resequencing were first map the flesh color locus Yscr to a small region on chromosome 6 based on two independent populations derived from two scarlet red-fleshed lines and two coral red-fleshed lines. Two major quantitative trait loci located in the same genomic regions were identified in the F2 and BC1P2 populations and explained 90.36% and 75.1% of the phenotypic variation in flesh color, respectively. Based on the genetic variation in the two parental lines, newly developed PCR-based markers narrowed the Yscr region to 40 Kb. Of the five putative genes in this region, four encoded glycine-rich cell wall structural proteins, which implied that a new regulatory mechanism might occur between scarlet red- and coral red-fleshed in watermelon. Moreover, the genotypes of two newly developed InDel markers (InDel27_fc6 and InDel28_fc6) were completely consistent with the phenotypes in the F2 and BC1P2 populations and all 56 scarlet red-fleshed watermelon accessions. The results presented here provide valuable information for marker-assisted selection of flesh color breeding and the functional validation of candidate genes in watermelon.
Watermelon [Citrullus lanatus (Thunb.) Matsum. & Nakai] is enjoyed worldwide for its fleshy, sweet, and juicy fruit and is often consumed in hot weather. The flesh color of watermelon is an important trait for consumers, making the selection of fruit with brightly colored flesh a priority for watermelon breeders (Evans, 2008). Watermelon accessions exhibit a wide range of flesh colors, including red, canary yellow, salmon yellow, orange, and white. Moreover, red flesh has been reclassified into two distinct flesh colors, coral red and scarlet red (Gusmini and Wehner, 2006). The genetic basis of flesh color in watermelon is complex, and several loci are known to affect flesh color. Wehner summarized the flesh color genes (Wehner, 2012) B (yellow flesh) (Shimotsuma, 1963), C (canary yellow flesh) (Poole, 1944), i-C (inhibitor of canary yellow) (Henderson et al., 1998), Wf (white flesh) (Shimotsuma, 1963; Robinson et al., 1976), Yscr (scarlet red flesh) (Gusmini and Wehner, 2006), Ycrl (coral red flesh) (Porter, 1937; Poole, 1944; Henderson, 1989; Henderson et al., 1998), y° (orange flesh), and y (salmon yellow flesh) (Henderson, 1989; Henderson et al., 1998).
In addition to inheritance studies, several quantitative trait loci (QTLs) mapping and gene cloning studies on flesh color have been published. An early study found two flesh color QTLs in group 2 and 8 in F2 and BC1 populations segregating red, canary yellow, and white flesh (Hashizume et al., 2003). With the release of the draft genome of watermelon (Guo et al., 2013) and the advent of next-generation sequencing, the development of comparative linkage maps and QTLs between different populations is possible. Two flesh color QTLs are located on chromosomes 2 and 4, and map-based cloning was performed based on the white-fleshed line and red-fleshed line (Zhang et al., 2014). Cla005011 is considered a lycopene β-cyclase (LCYB) and candidate gene in the genomic region of chromosome 4. Another gene was narrowed down to a region of 1,200 Kb on chromosome 2. Several studies also identified major QTLs for lycopene content on chromosome 4 (Liu et al., 2015; Liu et al., 2016) and focused on gene LCYB (Bang et al., 2007; Bang et al., 2010). A major QTL for β-carotene accumulation located on 2.4 Mb of chromosome 1 was identified by a segregating population from a cross of orange-fleshed watermelon accession NY0016 and a yellow-fleshed line (Branham et al., 2017). QTL mapping for lycopene content was also applied in segregating populations from red (scarlet red)-fleshed and pink (coral red)-fleshed watermelon lines, but no stable QTL was identified (Fall et al., 2019). Most modern commercial watermelon cultivars have red flesh, but the genetic basis of red flesh is unclear. An inheritance study suggested that a single dominant gene, Yscr, produces the scarlet red flesh color rather than the coral red flesh color (Gusmini and Wehner, 2006). However, no genes for scarlet red or coral red flesh and no gene-based molecular markers have been reported for this trait.
Previously, we constructed a high density genetic map based on an F2 population from the coral red-fleshed line ZXG01478 and scarlet red-fleshed line 14CB11 (Shang et al., 2016). In the present study, two high-density genetic maps and whole-genome variation detection aided by genome resequencing were used to first map the flesh color locus Yscr to a small region on chromosome 6 based on two independent populations derived from two scarlet red-fleshed lines and two coral red-fleshed lines. Specifically, the main objectives of this study were as follows: (1) to perform the preliminary linkage mapping of the QTLs for flesh color in the F2 population; (2) to construst another high-density linkage map and perform QTL mapping for flesh color; (3) to fine map the major QTLs for flesh color using newly developed polymerase chain reaction (PCR)-based markers based on the high-coverage resequencing of two parental lines; (4) to analysis potential candidate genes; and (5) to validate the watermelon germplasm via two tightly linked InDel markers.
An F2 population of 93 individuals was developed from the F1 cross between ZXG01478 (a coral red-fleshed line) and 14CB11 (a scarlet red-fleshed line) (Shang et al., 2016). The corressponding recombinant inbred line (RIL) population of 106 lines (Li et al., 2018) was also constructed by single-seed descent for four generations to confirm the phenotype of F2 individuals. B47, a scarlet red-fleshed line, was crossed as the female parent to J, a coral red-fleshed line, and the resulting F1 plant backcrossed to J to create the BC1P2 population (J × (B47 × J)), which included 89 plants. A total of 87 accessions, 31 with coral red flesh and 56 with scarlet red flesh, were screened from National Mid-term Genebank for Watermelon and Melon in Zhengzhou Fruits Research Institute of the Chinese Academy of Agricultural Sciences (Zhengzhou, China). All watermelon accessions, F2 and RILs and backcross BC1P2 populations were planted at the Zhengzhou Fruits Research Institute of the Chinese Academy of Agricultural Sciences in Zhengzhou. Parents, F1 and watermelon accessions were grown in triplicate with 10 plants each. The F2, RIL and backcross BC1P2 populations were planted in a green house following essentially regular management practices throughout the growing season. In order to ensure the fruits were harvested at full maturity, we divided the individual or lines into early-maturing and late-maturing subgroups according to previous maturity data. The early-maturing and late-maturing fruits were harvested 35 and 40 days after manual pollination, respectively. Each fruit was cut lengthwise and immediately visually scored for flesh color based on parental lines with distinct coral red and scarlet red flesh. Pictures of fruits across the experiment were taken, allowing further confirmation of flesh color phenotypes during data analysis.
The goodness-of-fit tests for flesh color were performed based on χ2 testing of the expected segregation ratios using SAS.
The RAD protocol was employed as described by Baird et al. (2008). The enzymes and restriction fragment sizes were evaluated based on the reference genome sequence (ftp://cucurbitgenomics.org/pub/cucurbit/genome/watermelon/97103/v1/) (Guo et al., 2013). MseI was selected for RAD library construction. The library for Illumina sequencing was constructed from 200 ng of each DNA sample. All libraries were sequenced using Illumina HiSeq X Ten at Shanghai Major Biological Medicine Technology Co., Ltd.
For single nucleotide polymorphism (SNP) calling, the Burrows-Wheeler Aligner (Li and Durbin, 2009) was applied for sequence alignment between the individual reads and the reference genome sequence, Genome AnalysisToolKit (McKenna et al., 2010) was used to detect SNP loci, and SAMtools (Li et al., 2009) was used to filter out SNP loci. The filtering of SNP loci was based on three criteria: (i) an average sequence depth of < fivefold in the parents and < threefold in the progeny; (ii) no polymorphism between the parents; and (iii) heterozygosity in the parents.
The poorly performing markers were removed before map construction, which missed an excess of more than 50% of the missing data in the BC1P2 population. Markers with significant segregation distortion (χ2 test, P < 0.05) were excluded from the subsequent linkage map construction. The construction of the linkage map was performed using JoinMap 5.0 (https://www.kyazma.nl/index.php/JoinMap) with a goodness-of-fit threshold of ≦ 5, a recombination frequency of < 0.4 and a minimum logarithm of odds (LOD) score of 2.0. All genetic distances were expressed in centimorgans (cM), as determined by the Kosambi function (Kosambi, 2016). Linkage groups were assigned to chromosomes based on published high-density genetic map for watermelon (Shang et al., 2016).
Earlier genetic mapping was performed using morphological traits (Lister and Dean, 1993), which implied that flesh color could be treated as a phenotypic marker in later gene mapping. In the present study, two different methods were performed. First, the high-density linkage map was reconstructed with SNP markers on the linkage map and the phenotype marker (Scr_P) using JoinMap 5.0 software (https://www.kyazma.nl/index.php/JoinMap) as described above. Second, the genome-wide QTL scanning was performed by adopting Bayesian model selection (Yi et al., 2007; Kosambi, 2016) in the package R\qtlbim (www.qtlbim.org) (Yandell et al., 2007), which analyses the QTL model for binary traits. The appropriate LOD threshold was determined by a permutation test of 1,000 repetitions (Churchill and Doerge, 1994). LOD scores corresponding to P = 0.01 were used to identify novel QTLs. The linkage maps and QTL presentation were drawn using MapChart software (Voorrips, 2002).
Genome-wide identification of InDels and SNPs between ZXG01478 and 14CB11 was performed by our laboratory (Li et al., 2018). The extraction of 500 base pairs (bp) before and after SNP/InDel loci was performed by a self-compiled script on Perl. For developing PCR-based dCAPS (derived cleaved amplified polymorphic sequences) markers, the web-based free software dCAP Finder 2.0 program (http://helix.wustl.edu/dcaps/dcaps.html) was used to find appropriate restriction enzymes for detecting SNPs (Neff et al., 2002). Primer 5.0 (Clarke and Gorley, 2001) and Oligo 7 (Rychlik, 2007) were used to design the appropriate PCR primer sets.
DNA from all materials and populations used in the present study was extracted from young leaves using the Hi-DNAsecure Plant Kit (Tiangen Biotech, Beijing, China) according to the manufacturer’s instructions. PCR was performed in 25 μl reaction volumes containing 12.5 μl 2 × Power Taq PCR MasterMix (Bioteke, Beijing, China) with 10 μM primer (each) and approximately 50 ng of genomic DNA as a template. Thermocycling was initiated at 94°C for 5 min, followed by 35 cycles of 94°C for 20 s, 55°C for 1 min and 72°C for 30 s, with a final extension at 72°C for 5 min. The PCR products were separated on an 8% polyacrylamide gel and visualized by silver staining. Bioinformatics analysis.
Simple Modular Architecture Research Tool (http://smart.embl-heidelberg.de/) (Letunic et al., 2015; Letunic and Bork, 2018) was used to search known motifs in protein sequences. Multiple sequence comparison was performed using multiple sequence alignment (https://www.ebi.ac.uk/Tools/msa/muscle/) (Madeira et al., 2019). Genomics data was visualized with Integrative Genomics Viewer (Thorvaldsdottir et al., 2013).
Bathes of flesh tissue was cut into smaller pieces, immediately frozen in liquid nitrogen and stored at −80°C. For the qRT-PCR template, the reverse transcription reaction was performed using a PrimeScriptTM II 1st Strand cDNA Synthesis Kit (Takara, Beijing, China). qRT-PCR was performed using a Bio-Rad IQ5 with SYBR Green detection. Relative expression levels were evaluated using the 2-△△CT method. The watermelon actin gene was used as an internal control to normalize transcript levels. The primer details are shown in Supplementary Table 1. A cycling temperature of 57°C and the criterion of a single peak on the melting curve were used to confirm the specificity of designed primer pairs.
An F2 population derived from ZXG01478 (a coral red-fleshed line) and 14CB11 (a scarlet red-fleshed line) was generated (Shang et al., 2016). All fruits in F1 generations had scarlet red flesh, suggesting that the scarlet red flesh color was dominant. Based on visual observation, the flesh color produced in the F2 populations was classified into two categories, scarlet red and coral red. Fruits in the F2 generation segregated 68:25 (scarlet red: coral red), which fit a 3:1 ratio (χ2 = 0.18, P value = 0.68). Another crossed population, BC1P2 from the scarlet red-fleshed line B47 and the coral red-fleshed line, J, was also evaluated to determine the flesh color inheritance. All fruits in the F1 generations had scarlet red flesh, and the BC1P2 population segregated 43:46 (scarlet red: coral red), showing that the data were consistent with a 1:1 expectation (χ2 = 0.10, P value = 0.75). These results suggested that scarlet red flesh in watermelon is controlled by a single dominant gene, which is in agreement with the previous genetic analysis of the dominance of the Yscr locus (Gusmini and Wehner, 2006).
The degree of flesh color was used as a phenotypic marker (named Scr_P), the linkage map based on the F2 population, which covered a total of 2,634 SNP markers (Shang et al., 2016), was reconstructed. Scr_P was mapped to LG6 between Marker3917 and Marker3912 with genetic distances of 1 cM and 0.14 cM, respectively (Figure 1A). The genome-wide QTL analysis for flesh color was performed in the package R\qtlbim, which analyzes the QTL model for binary traits. For flesh color, one major QTL (Yscr), which explained 90.36% of the phenotype variation and showed a peak LOD of 23.65, was identified in linkage group 6 (Figure 1A and Table 1). The phenotypic marker, Scr_P, was located 1.95 cM from the genomic region with a peak LOD value. The SNP markers on the 1-LOD confidence interval showed significant association with flesh color (the average LOD = 14).
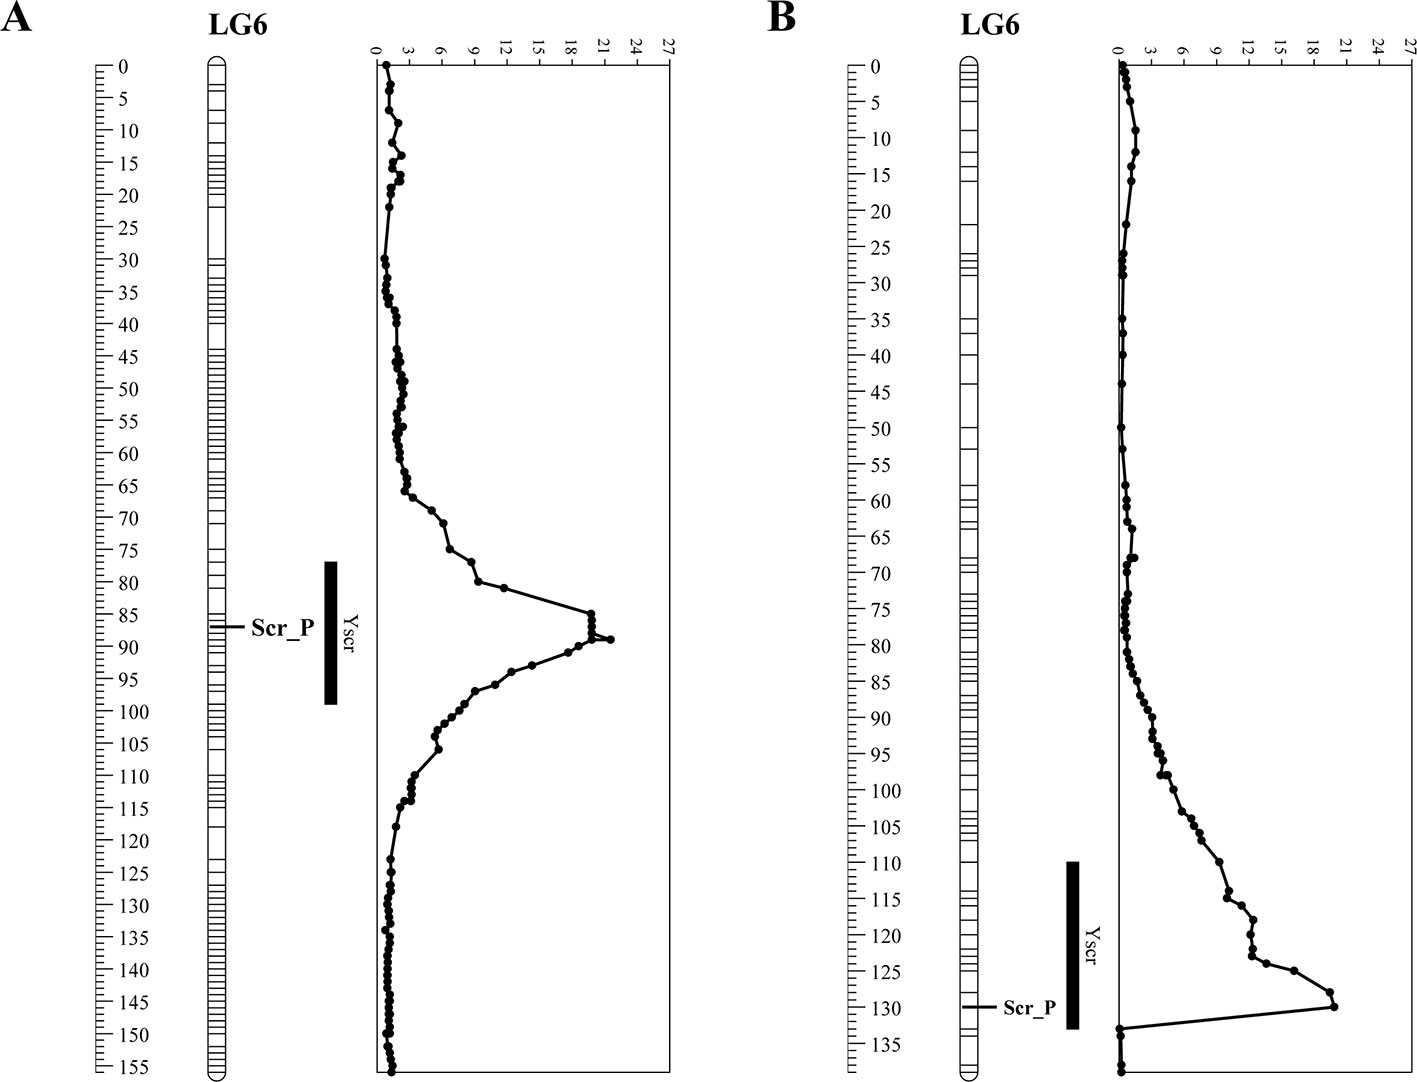
Figure 1 Linkage analysis of phenotypic marker for flesh color (Scr_P) and quantitative trait loci (QTL) profiling of Yscr on linkage groups in two populations. (A) Analysis based on the F2 population. (B) Analysis based on the BC1P2 population.

Table 1 Quantitative trait loci (QTL) mapping for flesh color in R\qtlbim, which analyzes the QTL model for binary traits.
Another genetic map, which contained 5,808 SNP markers, was constructed (Supplementary Table 2) based on the RAD-seq data from B47, J and 89 BC1P2 individuals. The total length of the linkage map was 1,745.4 cM, with an average distance of 0.3 cM between adjacent markers. The relationship between the genetic map and physical maps was mostly linear for each linkage group except for part of LG11 (Figure 2), which was in agreement with the above linkage map. Scr_P was mapped to LG6 between Mar6_20935299 and Mar6_20935345 with genetic distances of 0.08 cM and 2.13 cM, respectively (Figure 1B). The genome-wide QTL analysis for flesh color was also performed in the package R\qtlbim. In the BC1P2 population, the major QTL (Yscr), which explained 75.1% of the phenotype variation and showed a peak LOD of 20.36, was identified (Figure 1B and Table 1).
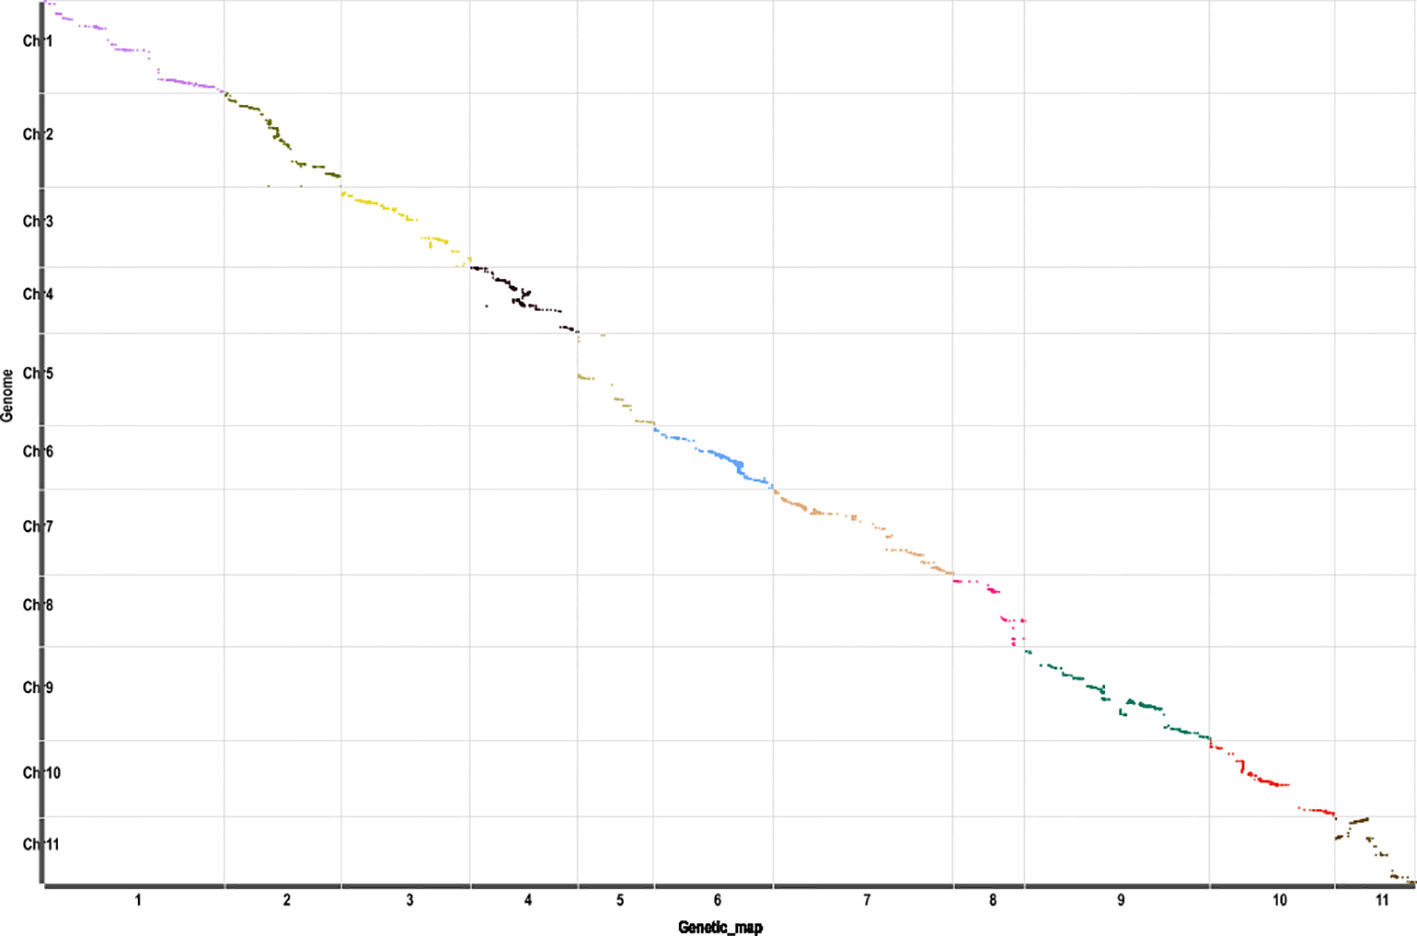
Figure 2 The collinearity of 11 linkage groups with the watermelon reference genome (97103 v1). The x-axis indicates the genetic distance of watermelon linkage groups accordingly, and the y-axis represents the linearity order of the physical position in the watermelon genome. All 5,808 SNP markers in these linkage groups are plotted as dots in the figure. Different colors indicate different linkage groups.
To fine map the Yscr locus, InDels and SNPs in the QTL region were converted into PCR-based markers that could be rapidly and reliably analyzed. Genome-wide InDels and SNPs were investigated between ZXG01478 and 14CB11 based on the resequencing of the two parents (Li et al., 2018). A total of 106 InDels with a length greater than 8 bp were identified in the Yscr flanking regions (chromosome 6: 16.75-23.79 Mb). Of these, 24 markers for InDels with length ranging from 8 bp to 36 bp were developed (Table 2 and Supplementary Table 3) to fine map the Yscr locus. Moreover, 1 dCAPS marker was developed based on SNPs located in the renarrowed region.
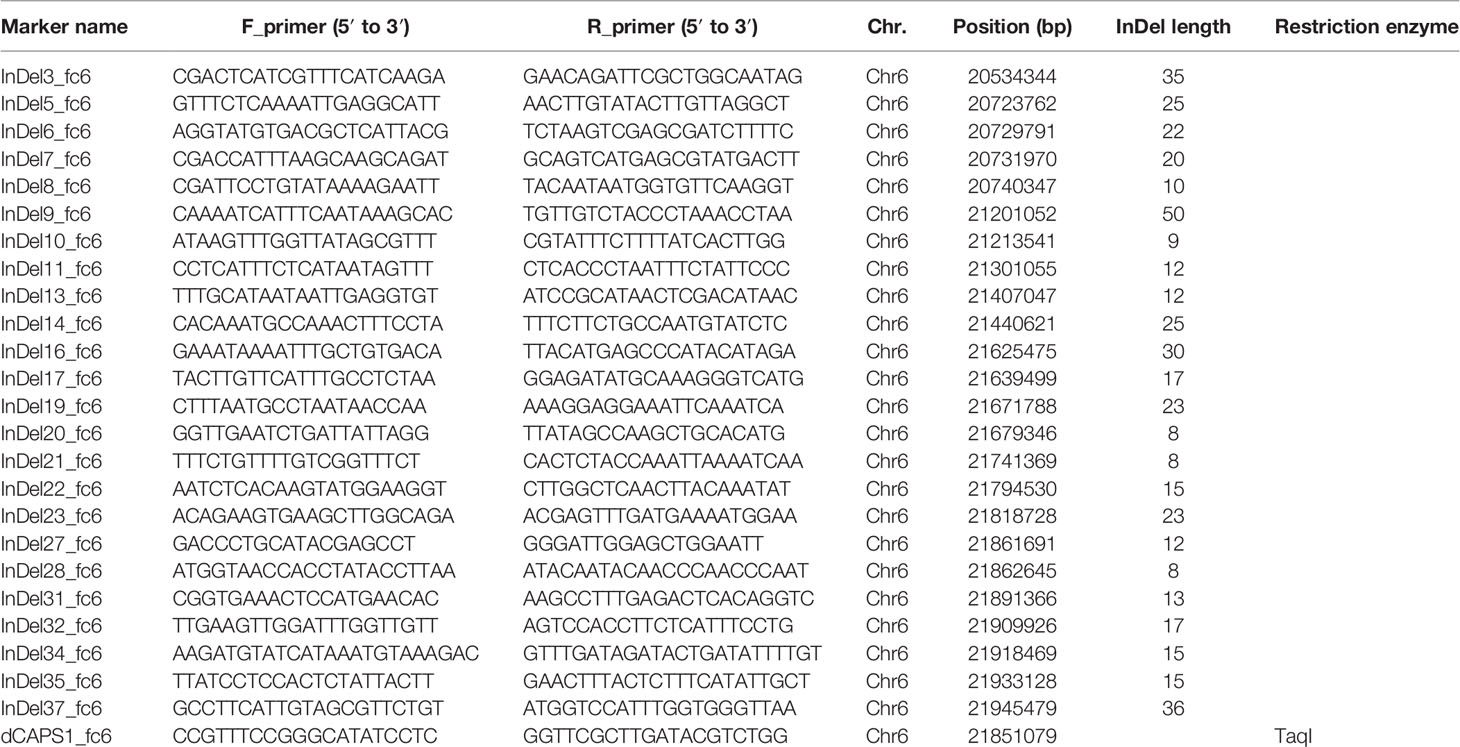
Table 2 The primer pair information for the PCR-based markers.
All 25 newly developed PCR-based markers were genotyped in the F2 population, and only eight recombinant individuals were identified around the Yscr narrowed region (Figure 3). Of the two recombinants with coral red flesh, 13QB135-016 showed a homozygous phenotype for coral red flesh downstream of InDel8_fc6 and delimited Yscr to a region downstream of InDel8_fc6; 13QB135-106 showed heterozygosity downstream of InDel31_fc6 and thus placed Yscr in a region upstream of InDel31_fc6. Of the six recombinants with scarlet red flesh in the F2 population, 13QB135-107 showed a homozygous phenotype for scarlet red flesh and the other five showed heterozygous phenotypes based on the phenotypes in the corresponding RILs. Therefore, 13QB135-107 showed heterozygosity upstream of InDel10_fc6 and placed Yscr in a region downstream of InDel10_fc6. As shown in Figure 3, 13QB135-115 placed Yscr in a region upstream of InDel35_fc6, 13QB135-014, 13QB135-035, 13QB135-056, and 13QB135-048 and delimited Yscr in a region downstream of InDel13_fc6, InDel8_fc6, InDel11_fc6, and InDel21_fc6. As a result, Yscr was narrowed down to a 150-Kb region between InDel21_fc6 (chromosome6: 21,741,369 bp) and InDel31_fc6 (chromosome6: 21,891,367 bp). Notably, allelic variation determined by five markers, InDel22_fc6, InDel23_fc6, dCAPS1_fc6, InDel27_fc6, and InDel28_fc6, cosegregated with Scr_P in the F2 population.
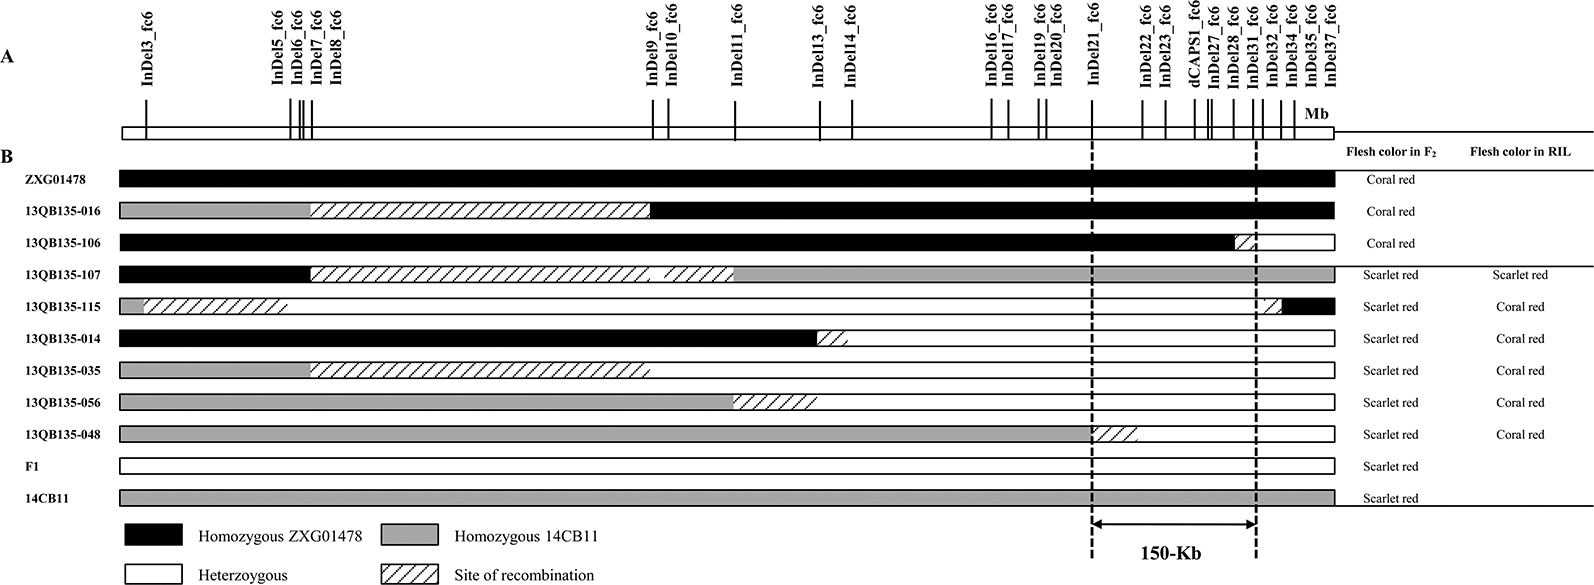
Figure 3 Graphical genotype of the recombinants in F2 and their flesh color in the F2 and recombinant inbred line (RIL) populations. (A) Partial physical map of the genomic region of Yscr on chromosome 6. (B) Yscr was narrowed to a 150 Kb region between InDel21_fc6 and InDel31_fc6 by analyzing the genotypes and phenotypes of the eight recombinants.
A total of 11 InDel markers and 1 dCAPs marker were genotyped in the BC1P2 population (Supplementary Table 4). Of the 43 fruits with scarlet red flesh, 17CB145-009 showed a parental homozygous genotype (scarlet red flesh) upstream of dCAPS1_fc6 and showed a maternal homozygous genotype (coral red flesh) downstream of InDel34_fc6, thus narrowing Yscr to a region between dCAPS1_fc6 and InDel34_fc6. Another 42 fruits showed a parental homozygous genotype (scarlet red flesh) upstream of dCAPS1_fc6 and delimited Yscr to a region downstream of dCAPS1_fc6. All 44 coral red-fleshed fruits in the BC1P2 population were heterozygous upstream of dCAPS1_fc6 and thus narrowed the Yscr locus to a region downstream of dCAPS1_fc6.
As a result of the two populations, Yscr was narrowed down to a 40-Kb region between dCAPS1_fc6 (chromosome6: 21,851,079 bp) and InDel31_fc6 (chromosome6: 21,891,367 bp) based on the 97103 reference genome (Guo et al., 2013).
According to the watermelon genome annotation (ftp://cucurbitgenomics.org/pub/cucurbit/genome/watermelon/97103/v1/), five putative genes (Cla018767 to Cla018771) were annotated in the narrowed 40-Kb region (Figure 4A). Among the five genes, three (Cla018768, Cla018769 and Cla018771) encoded unknown proteins. Both Cla018767 and Cla018770 encoded glycine-rich cell wall structural protein 2-like.
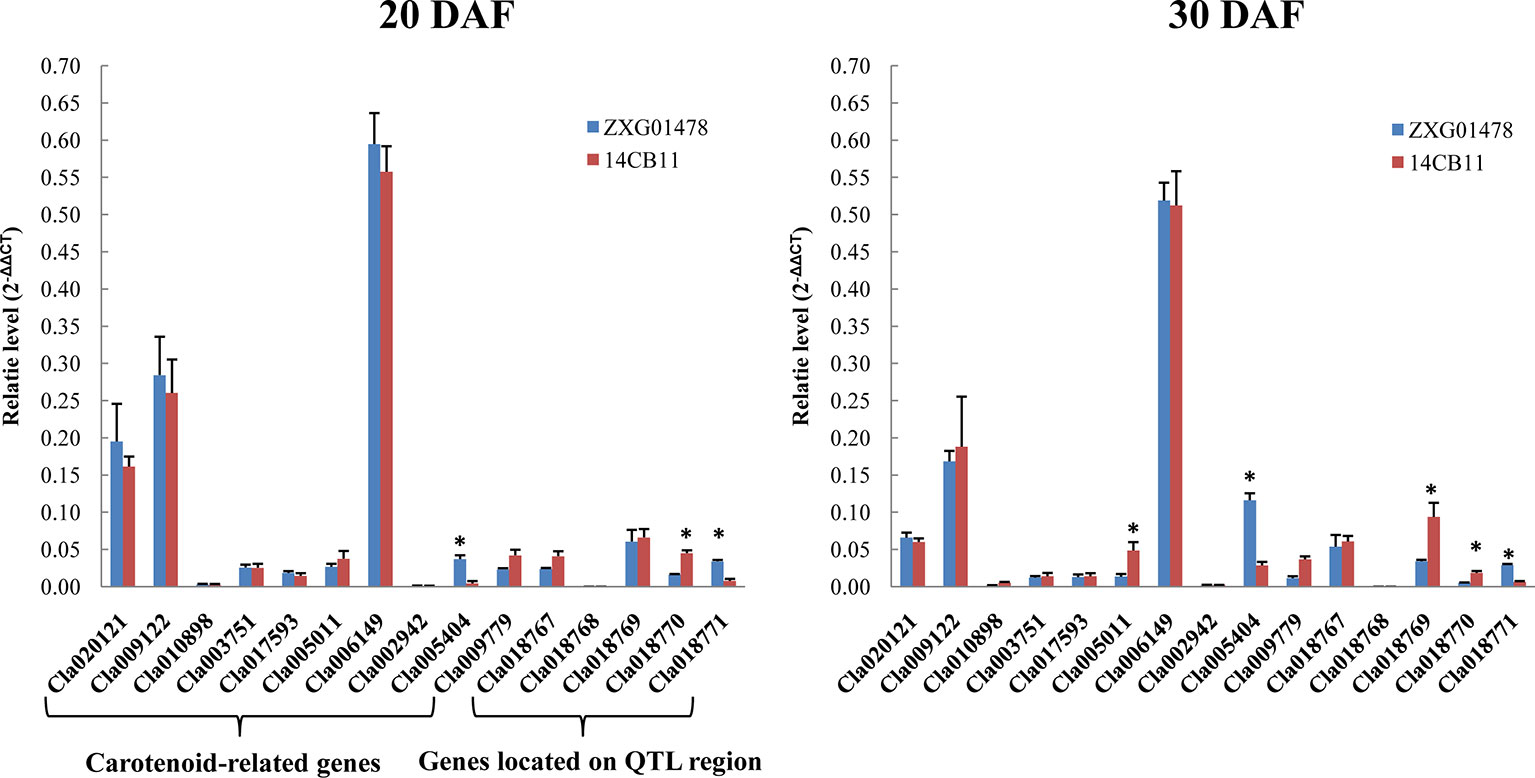
Figure 4 The expression profiles of carotenoid-related genes and potential candidate genes in flesh at different developmental stages using quantitative real-time polymerase chain reaction (qRT-PCR). DAF is the abbreviation for days after flowering. Watermelon actin was used as an internal control. Data are expressed as the means of the three biological replicates; error bars indicates SDs; ** indicates significance at p < 0.001.
Protein sequences of the five putative genes revealed that Cla018767 Cla018769, Cla018770, and Cla018771 had similar protein structures (Supplementary Figure 1). Simple Modular Architecture Research Tool identified a signal peptide, which was detected by the SignalP v4.0 program (Petersen et al., 2011), that started at position 1 and ended at positions 23, 23, 22, and 21 for the deduced proteins Cla018767 Cla018769, Cla018770, and Cla018771, respectively. Protein BLAST pairwise alignment against NCBI non-redundant (nr) protein sequences for these four signal peptides revealed significant hits with glycine-rich cell wall structural protein 2 (or -like). A region of low compositional complexity (residues 31–122, 35–133, 36–129, and 35–145 for the deduced proteins of Cla018767, Cla018769, Cla018770, and Cla018771, respectively), as detected by the SEG program (Wootton and Federhen, 1993), was also found, but no significant hits for this region were detected in the nr database.
A total of 10 carotenoid-related genes, Cla020121 (GGPPS), Cla009122 (PSY), Cla010898 (PDS), Cla003751 (ZDS), Cla017593 (CRTISO), Cla005011 (LCYB), Cla006149 (CHYB), Cla002942 (NCED1), Cla005404 (NCED2), and Cla009779 (NCED3) were cloned in watermelon (Lv and Gu, 2013). Expression pattern of 10 carotenoid-related genes and five candidate genes located on the narrowed 40-Kb region in two parental lines, ZXG01478 (Coral red flesh) and 14CB11 (Scarlet red flesh), at differental developmental flesh tissues were investigated to analysis whether the expression level of these genes are associated with flesh color. As showed in Figure 4, 10 carotenoid-related genes were expressed in a similar pattern during watermelon fruit growth in two parental lines with coral red and scarlet red flesh, which was consistent with Lv and Gu’s study. Only three genes, Cla005404, Cla005011, and Cla018769 showed significantly different between two partnal lines for different stages tissuse. Notably, the expresison level of Cla018769, Cla018770, and Cla018771 showed significantly different among tissues, which might be the potential candidate genes.
Two InDel markers, InDel27_fc6 and InDel28_fc6 cosegregated with flesh color in both the F2 and BC1P2 populations and thus were genotyped in a panel of 87 accessions with distinct coral red and scarlet red flesh (Figures 5A, B). As shown in Table 3, InDel27_fc6 and InDel28_fc6 cosegregated with the flesh color of all 87 accessions. Of the 31 accessions with coral red flesh, 24 showed maternal homozygous genotypes (coral red flesh, 167 bp and 197 bp for markers InDel27_fc6 and InDel28_fc6, respectively), and 7 showed parental homozygous genotypes (scarlet red flesh, 179 bp and 189 bp for markers InDel27_fc6 and InDel28_fc6, respectively). All 56 accessions with scarlet red flesh showed parental homozygous genotypes. In other words, all genotypes showed maternal homozygous genotypes (coral red flesh) with coral red flesh, while genotypes showed parental homozygous genotypes (scarlet red flesh), most with scarlet red flesh and several with coral red flesh. In summary, all genotypes matched the observed phenotype for accessions with coral red flesh, but not all genotypes matched the observed phenotypes for accessions with scarlet red flesh.
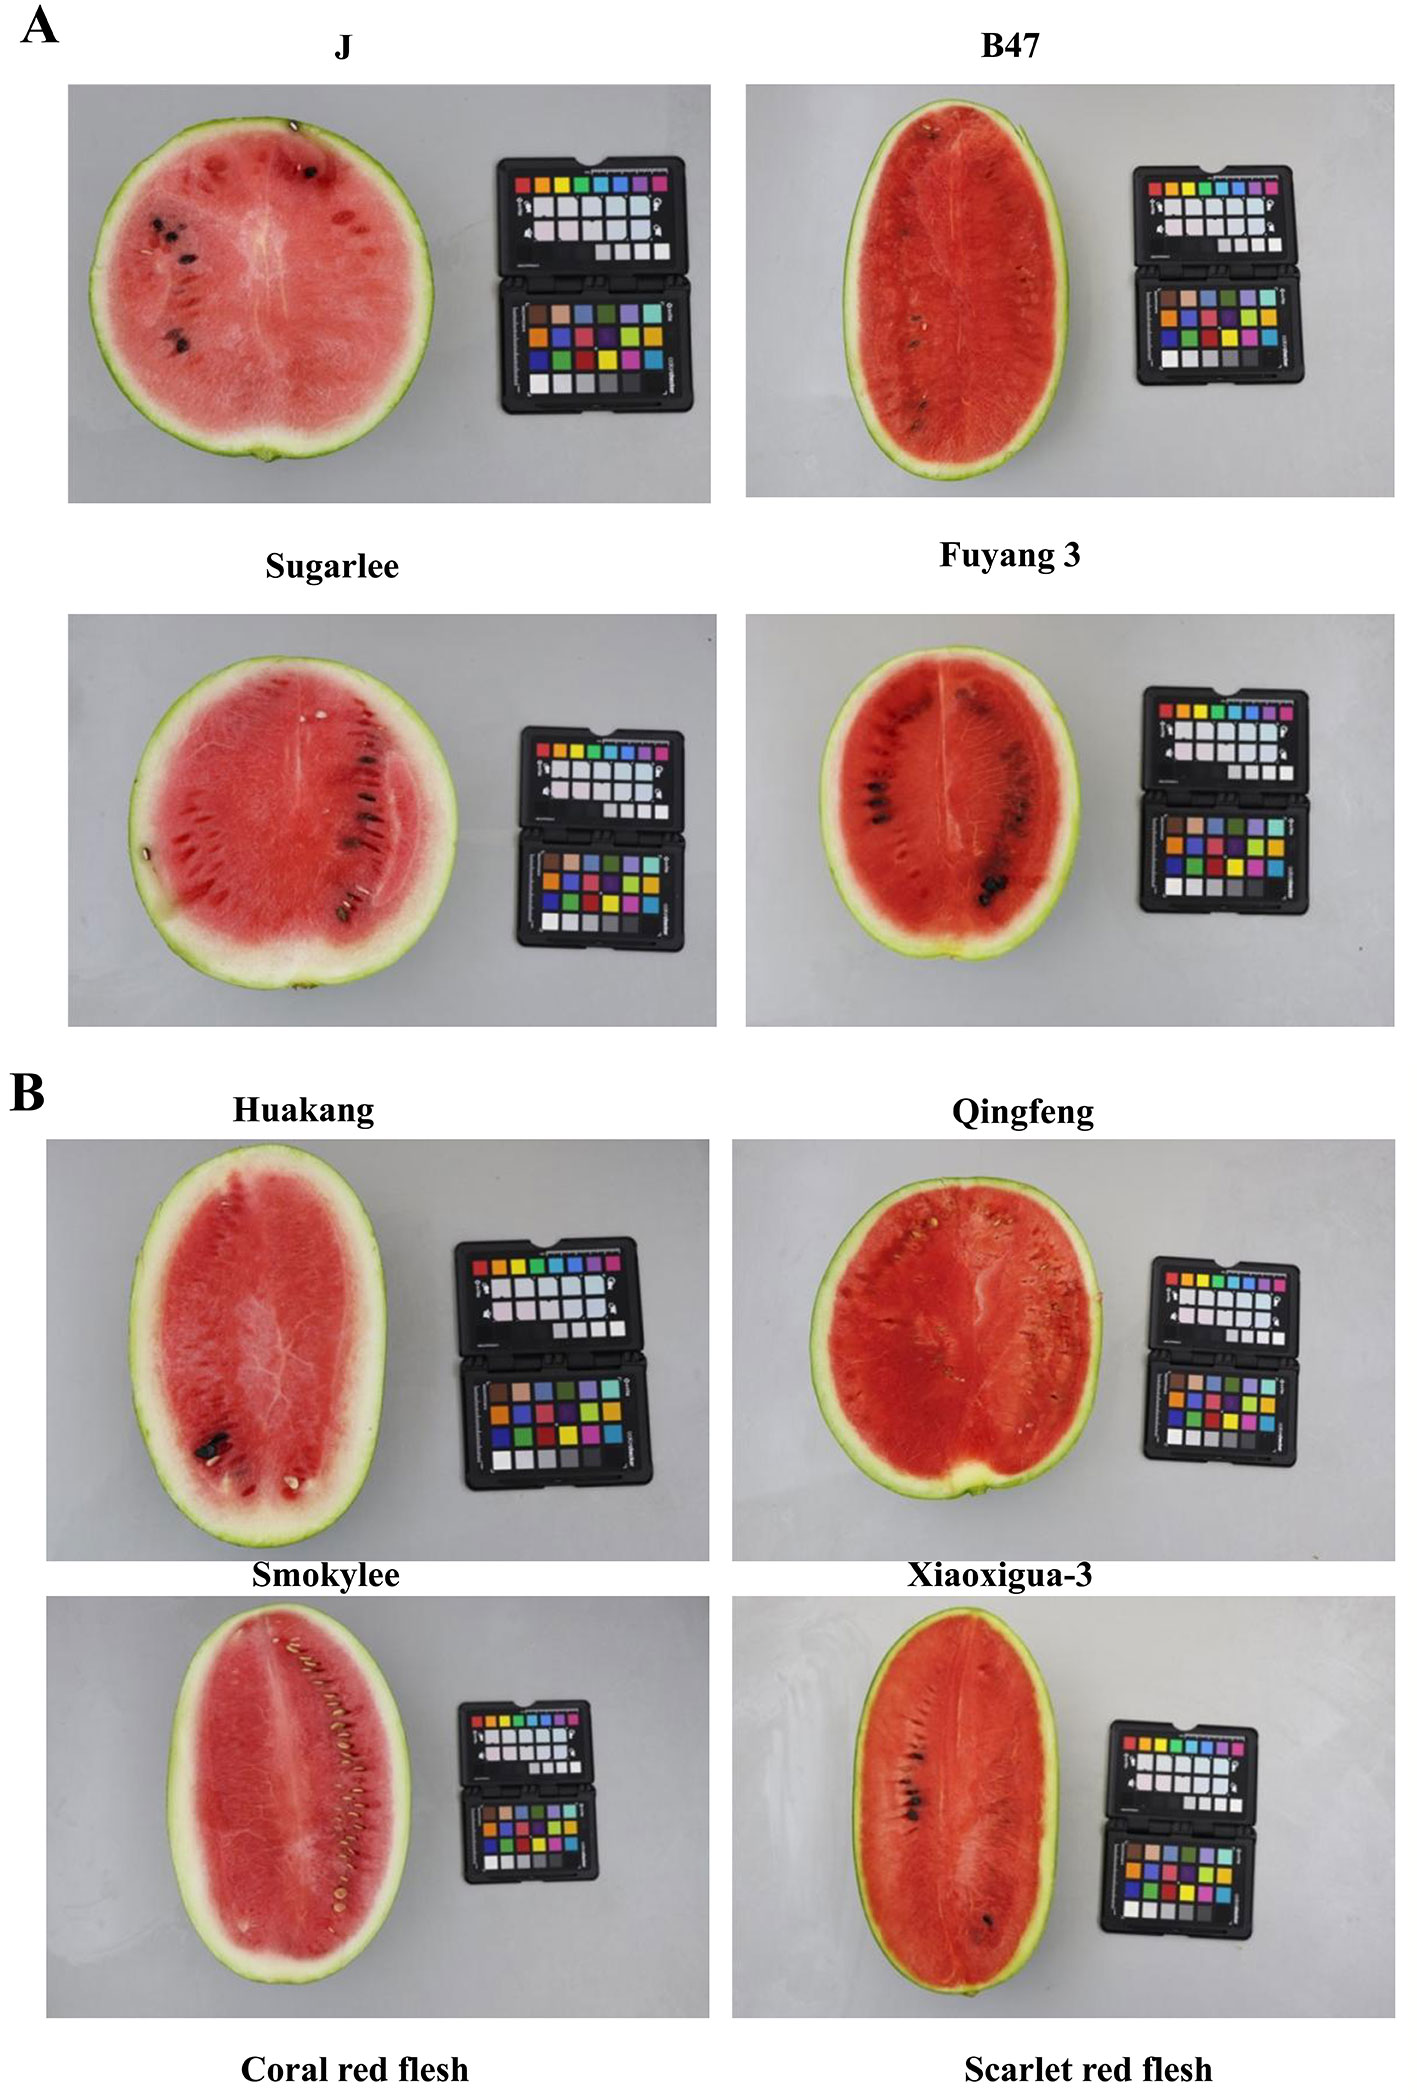
Figure 5 Photographs of longitudinal cross-sections of the parental lines and [the first line of (A)] a selection of the watermelon accessions with classic coral red- and scarlet red-fleshed color [the second line of (A) and (B)]. Left was the corel red-fleshed lines and right was the scarlet red-fleshed lines.
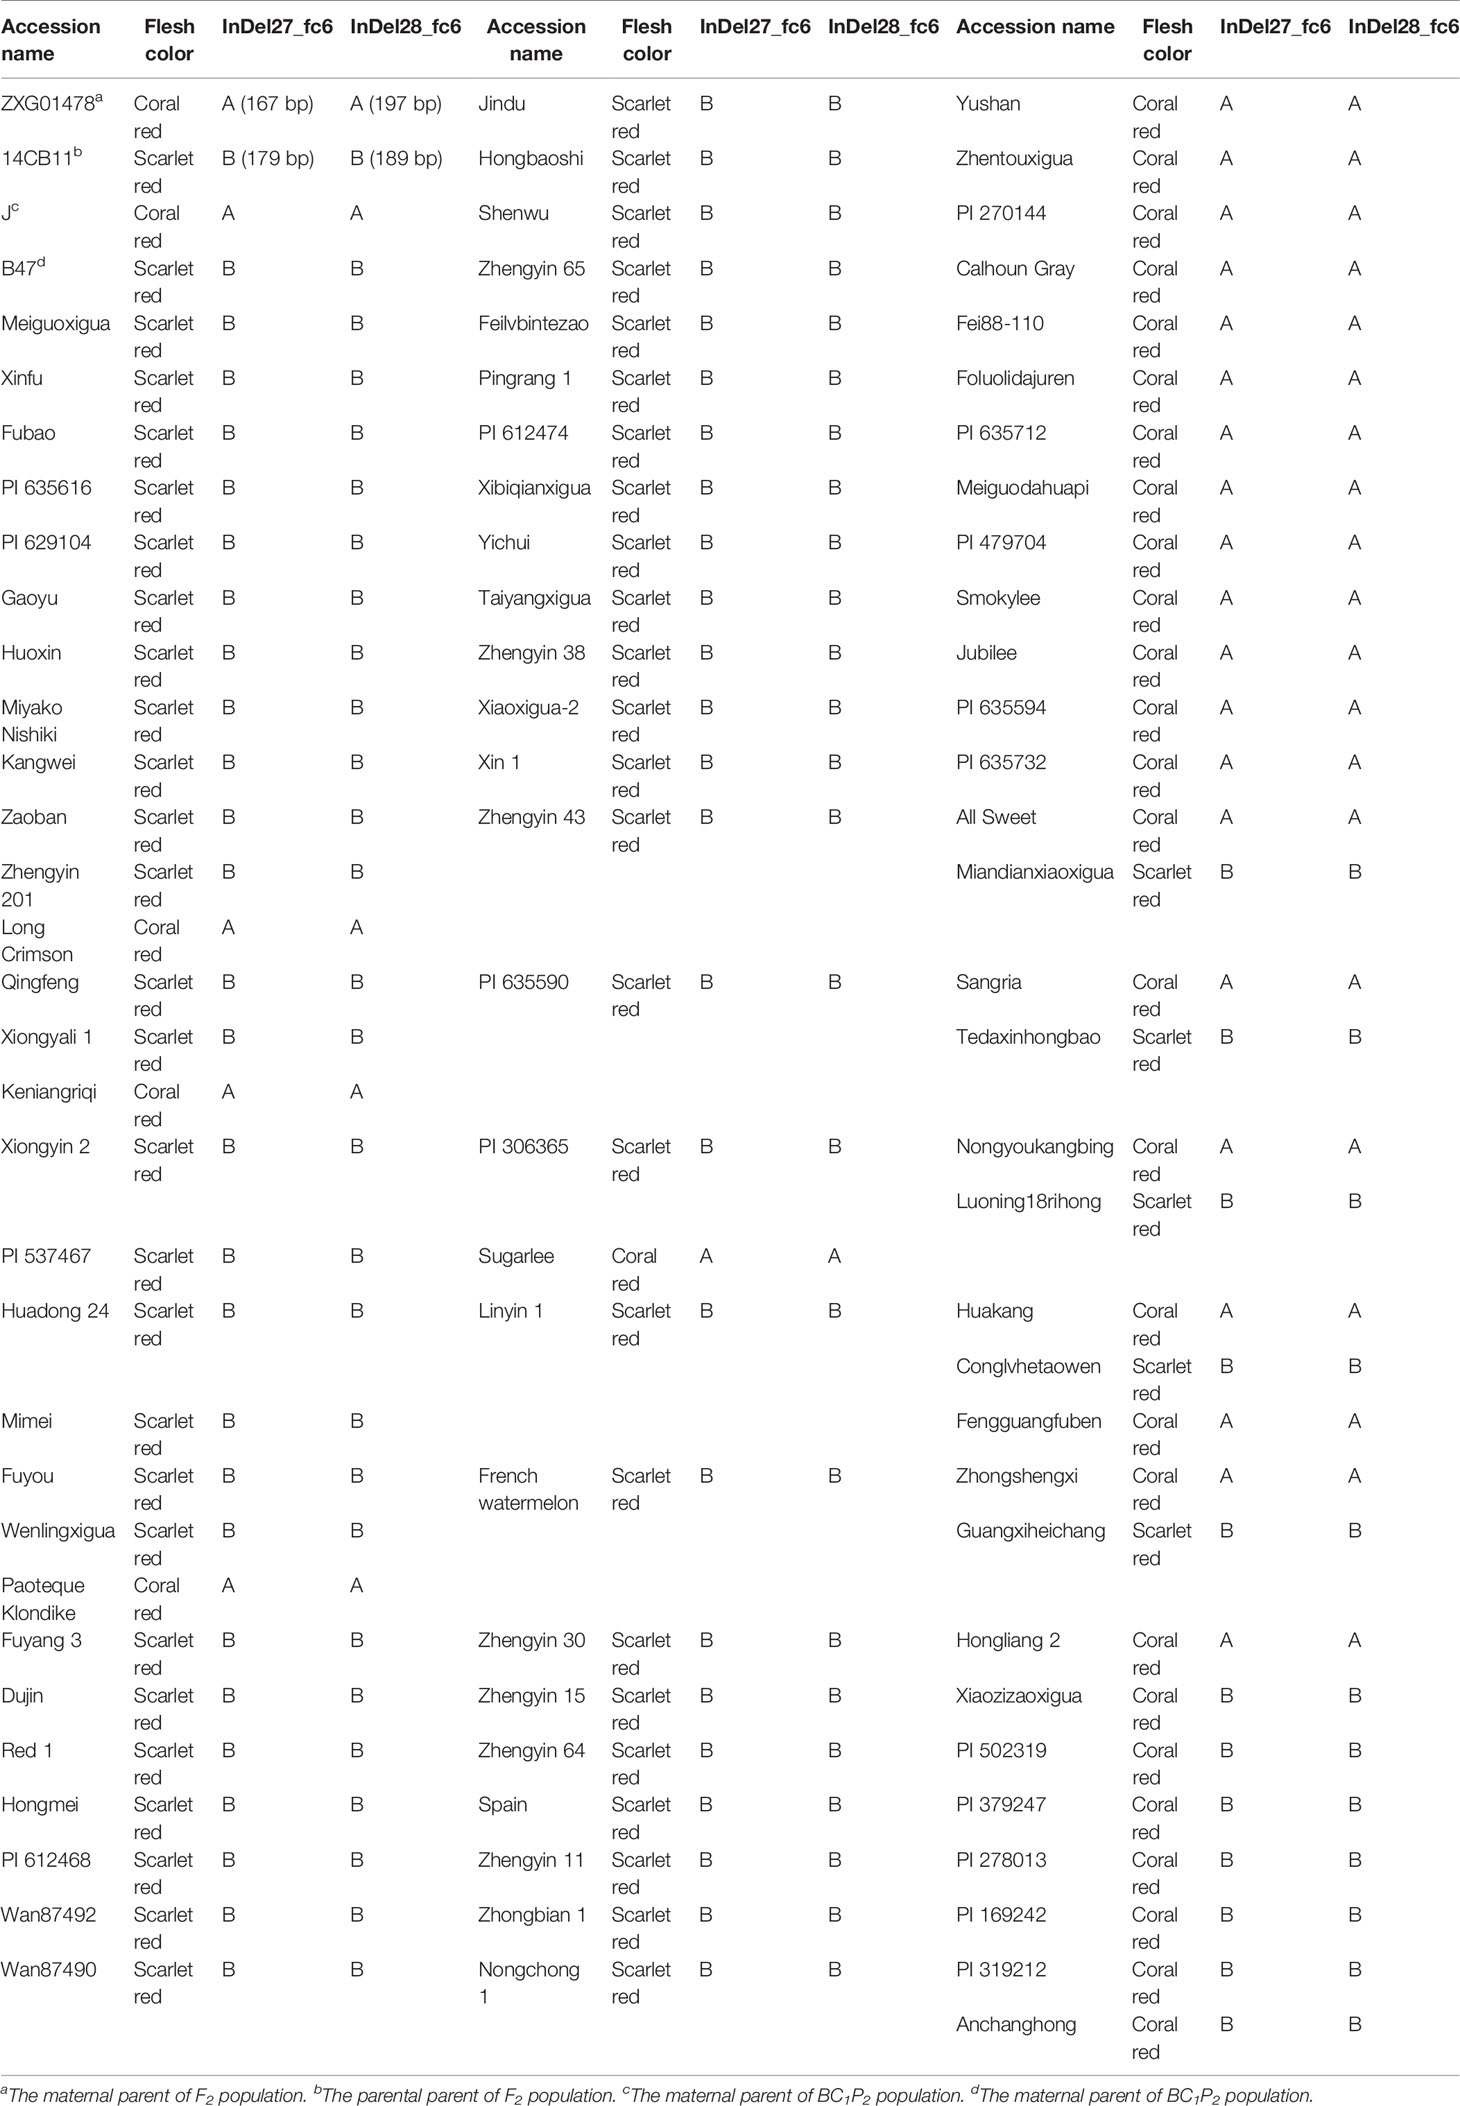
Table 3 Genotype identification of flesh color in 87 watermelon germplasm resources and four parental lines.
Most modern watermelon cultivars have red flesh, and the intensity of the red color has become a preference for consumers when selecting fresh watermelon. The genetic base of different red flesh colors is unclear. In this study, using two high-density genetic maps and whole-genome variation detection aided by genome resequencing, the flesh color locus Yscr was first mapped on a region of ~ 40 Kb in chromosome 6 based on two independent populations derived from two scarlet red-fleshed lines and two coral red-fleshed lines. Moreover, the genotypes of two newly developed InDel markers (InDel27_fc6 and InDel28_fc6) were completely consistent with the phenotypes in the F2 and BC1P2 populations and all 56 scarlet red-fleshed watermelon accessions. The red carotenoid pigment lycopene accumulates in watermelon flesh and gives watermelon flesh its red flesh color (Di Mascio et al., 1989). However, no homologous carotenoid-related genes were found in the narrowed Yscr region. Moreover, carotenoid-related genes, including GGPPS, PSY, PDS, ZDS, CRTISO, CCD, LCYB, CHYB, and NCED1, were expressed in a similar pattern during watermelon fruit growth in red (scarlet red)- and pink (coral red)-fleshed watermelon in previous (Lv and Gu, 2013) and present studies. These results imply that a new regulatory mechanism might occur between scarlet red- and coral red-fleshed watermelon. Four putative genes encoded glycine-rich cell wall structural proteins on the narrowed Yscr genomic region and three (Cla018769, Cla018770, and Cla018771) showed significantly different expressed in different fruit stages between scarlet red- and coral red flesh lines. These genes contain a signal peptide followed by a region of low compositional complexity, including a high glycine-content region with (GX)n repeats. Glycine-rich cell wall structural proteins as structural components of plant cell walls, appear to play important roles in signal transduction, protein-protein interactions, development, and transcriptional regulation, but there is no genetic evidencec of a specific function for these proteins (Ringli et al., 2001; Bocca et al., 2005). In addition, low-complexity sequences are extremely abundant in eukaryotic proteins (Marcotte et al., 1999) and may play a key role in the formation of novel genes (Toll-Riera et al., 2012). However, further evidence is needed to functionally validate the mechanism by which glycine-rich cell wall structural proteins control the flesh color in watermelon.
Great advances have been made in the analysis of carotenoids in watermelon. Ten cDNA fragments, geranylgeranyl pyrophosphate synthase (GGPPS, KF914758), PSY (KC166870), PDS (EF159942), ZDS (GQ140241), CRTISO (FJ788510), LCYB (EF014290), CHYB (FJ998045), and nine-cis-epoxycarotenoid dioxygenase (NCED1, FJ998046; NCED2, FJ998047; and NCED3, FJ998048), for carotenoid-related genes were cloned from watermelon (Lv and Gu, 2013). BLAST alignment against the reference genome coding sequences for these 10 carotenoid-related genes revealed significant hits with Cla020121 (GGPPS), Cla009122 (PSY), Cla010898 (PDS), Cla003751 (ZDS), Cla017593 (CRTISO), Cla005011 (LCYB), Cla006149 (CHYB), Cla002942 (NCED1), Cla005404 (NCED2), and Cla009779 (NCED3). Although Cla003751 (chromosome6: 13,838,002–13,848,966 bp) and Cla002942 (chromosme6: 9,157,470–9,159,170 bp) are located on chromosome 6, these two genes were not located within the Yscr narrowed genomic region and were located approximately 8 Mb and 12.8 Mb away from the QTL peak. Genetic analyses of flesh colors among red, orange, yellow, and white accessions have resulted in several advances and have indicated that flesh color might be associated with carotenoids in watermelon. A major locus for β-carotene accumulation is located on chromosome 1, and Cla009122 is considered a phytoene synthase (PSY) and candidate gene (Branham et al., 2017). One gene for flesh color and lycopene content was mapped to the same region on chromosome 4 (Bang et al., 2007; Zhang et al., 2014; Liu et al., 2015), and Cla005011 is regarded as the LCYB gene, which was identified as a key gene for color differentiation between red- and canary yellow-fleshed watermelon (Zhang et al., 2014).
Watermelon accessions exhibit a number of flesh color types, including colors that are easy to distinguish, such as red and white, and hard to distinguish, such as scarlet red and coral red. Limited researches on flesh color via molecular characterization and carotenoid profiles have focused on red, orange, yellow, and white (Bang et al., 2007; Zhang et al., 2014; Liu et al., 2015; Liu et al., 2016; Branham et al., 2017). Popular watermelon cultivars including Dixielee and Red-N-Sweet (Wehner, 2002) produce a more intense red color (scarlet red) than Angeleno Black Seeded, the type line for red flesh color (called coral red flesh to distinguish it from scarlet red). The first and only inheritance study between scarlet red and coral red flesh colors suggested that scarlet red flesh is controlled by a single dominant gene, Yscr(Gusmini and Wehner, 2006; Wehner, 2012). Because it is difficult to distinguish scarlet red and coral red colors when fruits are immature, scarlet red- and coral red-fleshed watermelons may have been miscategorized because previous categorizations didnot distinguish these two red colors. The National Mid-term Gene-bank for Watermelon and Melon was established in 2001 in our laboratory and has collected more than 3,000 watermelon and melon accessions from all over the world. After 15 years of collection, preservation, identification, and reproduction of these accessions, researchers in our laboratory had gained experience in fruit ripening and flesh color judgment. In addition to photo determination, coral red and scarlet red flesh could be distinguished by our researchers via standard materials with different red flesh. Therefore, the advantages of resources and phenotypic observations have enabled us to successfully identify genomic regions for flesh color that differentiate the coral red and scarlet red colors for the first time.
In summary, the present study first reported the genomic region Yscr associated with flesh color and identified potential candidate genes for this locus. Tightly linked markers were also developed and confirmed in different populations. The results presented here provide valuable information for marker-assisted selection of flesh color breeding and the functional validation of candidate genes in watermelon.
The data generated by this study can be found in Figshare (10.6084/m9.figshare.11647980).
NL and SM contributed to the conception and design of the study. NL, NNL, and JS performed the experiments. JS, SM, DZ, and JW contributed reagents/materials/tools and NL wrote the manuscript. All authors read and approved the final manuscript.
This research was supported by the National Key R&D Program of China (2016YFD0100204-26), the National Natural Science Foundation of China (31601779 and 31872134), the Special Protection and Utilization of the Crop Germplasm Resources (2014NWB038), the National R&D Infrastructure and Facility Development Program of China (NICGR2015-016), and the Agricultural Science and Technology Innovation Program (CAAS-ASTIP-2018-ZFRI).
The authors declare that the research was conducted in the absence of any commercial or financial relationships that could be construed as a potential conflict of interest.
The Supplementary Material for this article can be found online at: https://www.frontiersin.org/articles/10.3389/fpls.2020.00116/full#supplementary-material
Supplementary Figure 1 | Clustal multiple sequence alignment result.
dCAPS, derived cleaved amplified polymorphic sequences; InDel, insertion/deletions; PCR, polymerase chain reaction; qRT-PCR, quantitative real time PCR; QTL, quantitative trait locus; RIL, recombinant inbred line; RAD-seq, restriction site associated DNA sequencing; SNP, single nucleotide polymorphism.
Baird, N. A., Etter, P. D., Atwood, T. S., Currey, M. C., Shiver, A. L., Lewis, Z. A., et al. (2008). Rapid sNP discovery and genetic mapping using sequenced RAD markers. PloS One 3 (10), e3376. doi: 10.1371/journal.pone.0003376
Bang, H., Kim, S., Leskovar, D., King, S. (2007). Development of a codominant CAPS marker for allelic selection between canary yellow and red watermelon based on SNP in lycopene beta-cyclase (LCYB) gene. Mol. Breed. 20 (1), 63–72. doi: 10.1007/s11032-006-9076-4
Bang, H., Davis, A. R., Kim, S., Leskovar, D. I., King, S. R. (2010). Flesh color inheritance and gene interactions among canary yellow, pale yellow, and red watermelon. J. Am. Soc. Hortic. Sci. 135 (4), 362–368. doi: 10.21273/JASHS.135.4.362
Bocca, S. N., Magioli, C., Mangeon, A., Junqueira, R. M., Cardeal, V., Margis, R., et al. (2005). Survey of glycine-rich proteins (GRPs) in the Eucalyptus expressed sequence tag database (ForEST). Genet. Mol. Biol. 28 (3), 608–624. doi: 10.1590/S1415-47572005000400016
Branham, S., Vexler, L., Meir, A., Tzuri, G., Frieman, Z., Levi, A., et al. (2017). Genetic mapping of a major codominant QTL associated with beta-carotene accumulation in watermelon. Mol. Breed. 37 (12), 146. doi: 10.1007/S11032-017-0747-0
Churchill, G. A., Doerge, R. W. (1994). Empirical threshold values for quantitative trait mapping. Genetics 138 (3), 963–971. doi: 10.1101/gad.8.21.2653
Clarke, K., Gorley, R. (2001). Primer v5: user manual/tutorial (Plymouth, UK: Primer-E). PRIMER v5: User manual/tutorial. PRIMER-E, Plymouth, UK.
Di Mascio, P., Kaiser, S., Sies, H. (1989). Lycopene as the most efficient biological carotenoid singlet oxygen quencher. Arch. Biochem. Biophys. 274 (2), 532–538. doi: 10.1016/0003-9861(89)90467-0
Evans, C. (2008). Consumer preferences for watermelons: a conjoint analysis (Auburn, Alabama: Auburn University).
Fall, L. A., Perkins-Veazie, P., Ma, G. Y., McGregor, C. (2019). QTLs associated with flesh quality traits in an elitexelite watermelon population. Euphytica 215 (2), 30. doi: 10.1007/s10681-019-2356-y
Guo, S., Zhang, J., Sun, H., Salse, J., Lucas, W. J., Zhang, H., et al. (2013). The draft genome of watermelon (Citrullus lanatus) and resequencing of 20 diverse accessions. Nat. Genet. 45 (1), 51–58. doi: 10.1038/ng.2470
Gusmini, G., Wehner, T. C. (2006). Qualitative inheritance of rind pattern and flesh color in watermelon. J. Heredity 97 (2), 177–185. doi: 10.1093/jhered/esj023
Hashizume, T., Shimamoto, I., Hirai, M. (2003). Construction of a linkage map and QTL analysis of horticultural traits for watermelon [Citrullus lanatus (THUNB.) MATSUM & NAKAI] using RAPD, RFLP and ISSR markers. Theor. Appl. Genet. 106 (5), 779–785. doi: 10.1007/s00122-002-1030-1
Henderson, W. R., Scott, G. H., Wehner, T. C. (1998). Interaction of flesh color genes in watermelon. J. Heredity 89 (1), 50–53. doi: 10.1093/jhered/89.1.50
Henderson, W. R. (1989). Inheritance of orange flesh color in watermelon. Cucurbit Genet. Cooperative 12, 59–63.
Kosambi, D. D. (2016). “The estimation of map distances from recombination values,” in DD Kosambi (New Delhi: Springer), 125–130.
Letunic, I., Bork, P. (2018). 20 years of the SMART protein domain annotation resource. Nucleic Acids Res. 46 (D1), D493–D496. doi: 10.1093/nar/gkx922
Letunic, I., Doerks, T., Bork, P. (2015). SMART: recent updates, new developments and status in 2015. Nucleic Acids Res. 43 (D1), D257–D260. doi: 10.1093/nar/gku949
Li, H., Durbin, R. (2009). Fast and accurate short read alignment with Burrows-Wheeler transform. Bioinformatics 25 (14), 1754–1760. doi: 10.1093/bioinformatics/btp324
Li, H., Handsaker, B., Wysoker, A., Fennell, T., Ruan, J., Homer, N., et al. (2009). The sequence alignment/map format and SAMtools. Bioinformatics 25 (16), 2078–2079. doi: 10.1093/bioinformatics/btp352
Li, N., Shang, J. L., Wang, J. M., Zhou, D., Li, N. N., Ma, S. W. (2018). Fine mapping and discovery of candidate genes for seed size in watermelon by genome survey sequencing. Sci. Rep. 8, 1–11. doi: 10.1038/S41598-018-36104-W
Lister, C., Dean, C. (1993). Recombinant inbred lines for mapping RFLP and phenotypic markers in Arabidopsis thaliana. Plant J. 4 (4), 745–750. doi: 10.1046/j.1365-313X.1993.04040745.x
Liu, S., Gao, P., Wang, X. Z., Davis, A. R., Baloch, A. M., Luan, F. S. (2015). Mapping of quantitative trait loci for lycopene content and fruit traits in Citrullus lanatus. Euphytica 202 (3), 411–426. doi: 10.1007/s10681-014-1308-9
Liu, S., Gao, P., Zhu, Q. L., Luan, F. S., Davis, A. R., Wang, X. L. (2016). Development of cleaved amplified polymorphic sequence markers and a CAPS-based genetic linkage map in watermelon (Citrullus lanatus [Thunb.] Matsum. and Nakai) constructed using whole-genome re-sequencing data. Breed. Sci. 66 (2), 244–259. doi: 10.1270/jsbbs.66.244
Lv, P., Gu, H. (2013). Studies on carotenoids in watermelon flesh. Agric. Sci. 4 (7A), 13–20. doi: 10.4236/as.2013.47A003
Madeira, F., Park, Y. M., Lee, J., Buso, N., Gur, T., Madhusoodanan, N., et al. (2019). The EMBL-EBI search and sequence analysis tools APIs in 2019. Nucleic Acids Res. 47 (W1), W636–W641. doi: 10.1093/nar/gkz268
Marcotte, E. M., Pellegrini, M., Yeates, T. O., Eisenberg, D. (1999). A census of protein repeats. J. Mol. Biol. 293 (1), 151–160. doi: 10.1006/jmbi.1999.3136
McKenna, A., Hanna, M., Banks, E., Sivachenko, A., Cibulskis, K., Kernytsky, A., et al. (2010). The genome analysis toolkit: a MapReduce framework for analyzing next-generation DNA sequencing data. Genome Res. 20 (9), 1297–1303. doi: 10.1101/gr.107524.110
Neff, M. M., Turk, E., Kalishman, M. (2002). Web-based primer design for single nucleotide polymorphism analysis. Trends In Genet. 18 (12), 613–615. doi: 10.1016/S0168-9525(02)02820-2
Petersen, T. N., Brunak, S., von Heijne, G., Nielsen, H. (2011). SignalP 4.0: discriminating signal peptides from transmembrane regions. Nat. Methods 8 (10), 785–786. doi: 10.1038/nmeth.1701
Poole, C. (1944). Genetics of cultivated cucurbits. J. Heredity 35 (4), 122–128. doi: 10.1093/oxfordjournals.jhered.a105364
Porter, D. (1937). Inheritance of certain fruit and seed characters in watermelons. Hilgardia 10 (12), 489–509. doi: 10.3733/hilg.v10n12p489
Ringli, C., Keller, B., Ryser, U. (2001). Glycine-rich proteins as structural components of plant cell walls. Cell. Mol. Life Sci. 58 (10), 1430–1441. doi: 10.1007/Pl00000786
Robinson, R., Munger, H., Whitaker, T., Bohn, G. (1976). Genes of the Cucurbitaceae. Hortscience 11, 554–568.
Rychlik, W. (2007). OLIGO 7 primer analysis software. Methods Mol. Biol. 402, 35–60. doi: 10.1007/978-1-59745-528-2_2
Shang, J. L., Li, N., Li, N. N., Xu, Y. Y., Ma, S. W., Wang, J. M. (2016). Construction of a high-density genetic map for watermelon (Citrullus lanatus L.) based on large-scale SNP discovery by specific length amplified fragment sequencing (SLAF-seq). Sci. Hortic. 203, 38–46. doi: 10.1016/j.scienta.2016.03.007
Shimotsuma, M. (1963). Cytogenetical studies in the Genus Citrullus: VII. inheritance of several characters in watermelons. Jpn. J. Breed. 13 (4), 235–240. doi: 10.1270/jsbbs1951.13.235
Thorvaldsdottir, H., Robinson, J. T., Mesirov, J. P. (2013). Integrative genomics viewer (IGV): high-performance genomics data visualization and exploration. Briefings In Bioinf. 14 (2), 178–192. doi: 10.1093/bib/bbs017
Toll-Riera, M., Rado-Trilla, N., Martys, F., Alba, M. M. (2012). Role of low-complexity sequences in the formation of novel protein coding sequences. Mol. Biol. Evol. 29 (3), 883–886. doi: 10.1093/molbev/msr263
Voorrips, R. E. (2002). MapChart: software for the graphical presentation of linkage maps and QTLs. J. Heredity 93 (1), 77–78. doi: 10.1093/jhered/93.1.77
Wehner, T. C. (2002). Vegetable cultivar descriptions for North America - List 26 - 2002. Hortscience 37 (1), 15–78. doi: 10.21273/HORTSCI.37.1.15
Wootton, J. C., Federhen, S. (1993). Statistics of local complexity in amino acid sequences and sequence databases. Comput. Chem. 17 (2), 149–163. doi: 10.1016/0097-8485(93)85006-X
Yandell, B. S., Mehta, T., Banerjee, S., Shriner, D., Venkataraman, R., Moon, J. Y., et al. (2007). R/qtlbim: QTL with Bayesian interval mapping in experimental crosses. Bioinformatics 23 (5), 641–643. doi: 10.1093/bioinformatics/btm011
Yi, N. J., Shriner, D., Banerjee, S., Mehta, T., Pomp, D., Yandell, B. S. (2007). An efficient Bayesian model selection approach for interacting quantitative trait loci models with many effects. Genetics 176 (3), 1865–1877. doi: 10.1534/genetics.107.071365
Keywords: watermelon, flesh color, QTL, fine mapping, marker-assisted selection, candidate gene, carotenoids
Citation: Li N, Shang J, Wang J, Zhou D, Li N and Ma S (2020) Discovery of the Genomic Region and Candidate Genes of the Scarlet Red Flesh Color (Yscr) Locus in Watermelon (Citrullus Lanatus L.). Front. Plant Sci. 11:116. doi: 10.3389/fpls.2020.00116
Received: 27 August 2019; Accepted: 27 January 2020;
Published: 19 February 2020.
Edited by:
Nicolas Rispail, Spanish National Research Council (CSIC), SpainReviewed by:
Umesh K. Reddy, West Virginia State University, United StatesCopyright © 2020 Li, Shang, Wang, Zhou, Li and Ma. This is an open-access article distributed under the terms of the Creative Commons Attribution License (CC BY). The use, distribution or reproduction in other forums is permitted, provided the original author(s) and the copyright owner(s) are credited and that the original publication in this journal is cited, in accordance with accepted academic practice. No use, distribution or reproduction is permitted which does not comply with these terms.
*Correspondence: Na Li, bGluYTIzNDFAMTYzLmNvbQ==; Shuangwu Ma, bWFzaHVhbmd3dUBjYWFzLmNu
†These authors have contributed equally to this work
Disclaimer: All claims expressed in this article are solely those of the authors and do not necessarily represent those of their affiliated organizations, or those of the publisher, the editors and the reviewers. Any product that may be evaluated in this article or claim that may be made by its manufacturer is not guaranteed or endorsed by the publisher.
Research integrity at Frontiers
Learn more about the work of our research integrity team to safeguard the quality of each article we publish.