
94% of researchers rate our articles as excellent or good
Learn more about the work of our research integrity team to safeguard the quality of each article we publish.
Find out more
ORIGINAL RESEARCH article
Front. Plant Sci. , 11 February 2020
Sec. Aquatic Photosynthetic Organisms
Volume 11 - 2020 | https://doi.org/10.3389/fpls.2020.00048
 Antoine Jaussaud1†
 Josselin Lupette1,2†
 Juliette Salvaing1
 Juliette Jouhet1Olivier Bastien1
 Marina Gromova3*
 Eric Maréchal1*
Diatoms are unicellular heterokonts, living in oceans and freshwaters, exposed to frequent environmental variations. They have a sophisticated membrane compartmentalization and are bounded by a siliceous cell-wall. Formation of lipid droplets (LDs), filled with triacylglycerol (TAG), is a common response to stress. The proteome of mature-LDs from Phaeodactylum tricornutum highlighted the lack of proteins involved in early-LD formation, TAG biosynthesis or LD-to-LD connections. These features suggest that cytosolic LDs might reach a size limit. We analyzed the dynamics of LD formation in P. tricornutum (Pt1 8.6; CCAP 1055/1) during 7 days of nitrogen starvation, by monitoring TAG by mass spectrometry-based lipidomics, and LD radius using epifluorescence microscopy and pulse field gradient nuclear magnetic resonance. We confirmed that mature LDs reach a maximal size. Based on pulse field gradient nuclear magnetic resonance, we did not detect any LD-LD fusion. Three LD subpopulations were produced, each with a different maximal size, larger-sized LDs (radius 0.675 ± 0.125 µm) being generated first. Mathematical modeling showed how smaller LDs are produced once larger LDs have reached their maximum radius. In a mutant line having larger cells, the maximal size of the first LD subpopulation was higher (0.941 ± 0.169 µm), while the principle of stepwise formation of distinct LD populations was maintained. Results suggest that LD size is determined by available cytosolic space and sensing of an optimal size reached in the previous LD subpopulation. Future perspectives include the unraveling of LD-size control mechanisms upon nitrogen shortage. This study also provides novel prospects for the optimization of oleaginous microalgae for biotechnological applications.
Diatoms constitute a major group of unicellular photosynthetic heterokonts (or stramenopiles), living in oceans and freshwaters, predicted to be responsible for up to 20–25% global primary productivity, a contribution equivalent to that of all terrestrial rain forests (Field et al., 1998; Mann, 1999). Diatom anatomy has unique features including the presence of a rigid cell wall made of silica, called a frustule (De Tommasi et al., 2017). Centric diatoms are radially symmetric, such as the model species Thalassiosira pseudonana (Armbrust et al., 2004), whereas pennate diatoms are mainly based on a bilateral symmetry, such as the model species Phaeodactylum tricornutum (Bowler et al., 2008). Since P. tricornutum can grow without added silicate (Lewin, 1958) the fusiform or triradiate cell shape relies on the stiffness of a cell wall made of polysaccharides, predominantly a linear poly-α-(1→3) mannan decorated with sulfate ester groups and β-D-glucuronic residues, ultimately strengthened by the presence of silica (Le Costaouec et al., 2017).
Like most photosynthetic eukaryotes living in an environment subjected to frequent variations, diatoms have to cope with abiotic stresses of very diverse natures. An intense remodeling of glycerolipids leading to the formation of lipid droplets (LDs) is a common feature of the response of phytoplankton to stresses such as nutrients' starvation (Nguyen et al., 2011; Abida et al., 2015; Popko et al., 2016), high temperature (Yao et al., 2012; Alboresi et al., 2016), high light (Alboresi et al., 2016), exposure to nitric oxide (Dolch et al., 2017), hydrogen peroxide (Burch and Franz, 2016; Collins et al., 2016; Conte et al., 2018) or to a variety of chemicals (Kim et al., 2017; Wase et al., 2017; Conte et al., 2018; Wase et al., 2018). Glycerolipids consist of a three-carbon glycerol backbone (numbered sn-1, 2, and 3) esterified to fatty acids (FAs) at positions sn-1 and sn-2, which sn-3 position can be linked to a polar head. They make the bulk of cell membranes and each subcellular compartment contains a very precise glycerolipid composition. The nature of the polar head defines glycerolipid classes, such as the phospholipid phosphatidylcholine (PC) or the betain lipid diacylglyceryl hydroxymethyltrimethyl-β-alanine (DGTA), usually synthesized in the endoplasmic reticulum (ER) or the glycolipids monogalactosyldiacylglycerol (MGDG), digalactosyldiacylglycerol (DGDG) or sulfoquinovosyldiacylglycerol (SQDG) synthesized in plastids (Boudiere et al., 2012; Boudiere et al., 2014; Petroutsos et al., 2014; Li-Beisson et al., 2019). Stress-induced remodeling corresponds therefore to changes in the proportions of different glycerolipid classes, of the FAs contained in each class and sometimes modification of the subcellular location of these lipids within the cell. The most spectacular change is the production of triacylglycerol (TAG), by addition of a third FA at the sn-3 position of glycerol instead of a polar head. TAG destabilizes membranes and accumulates inside LDs (Figure 1), together with other neutral lipophilic components that can include sterol derivatives or carotenoids (Lupette et al., 2019).
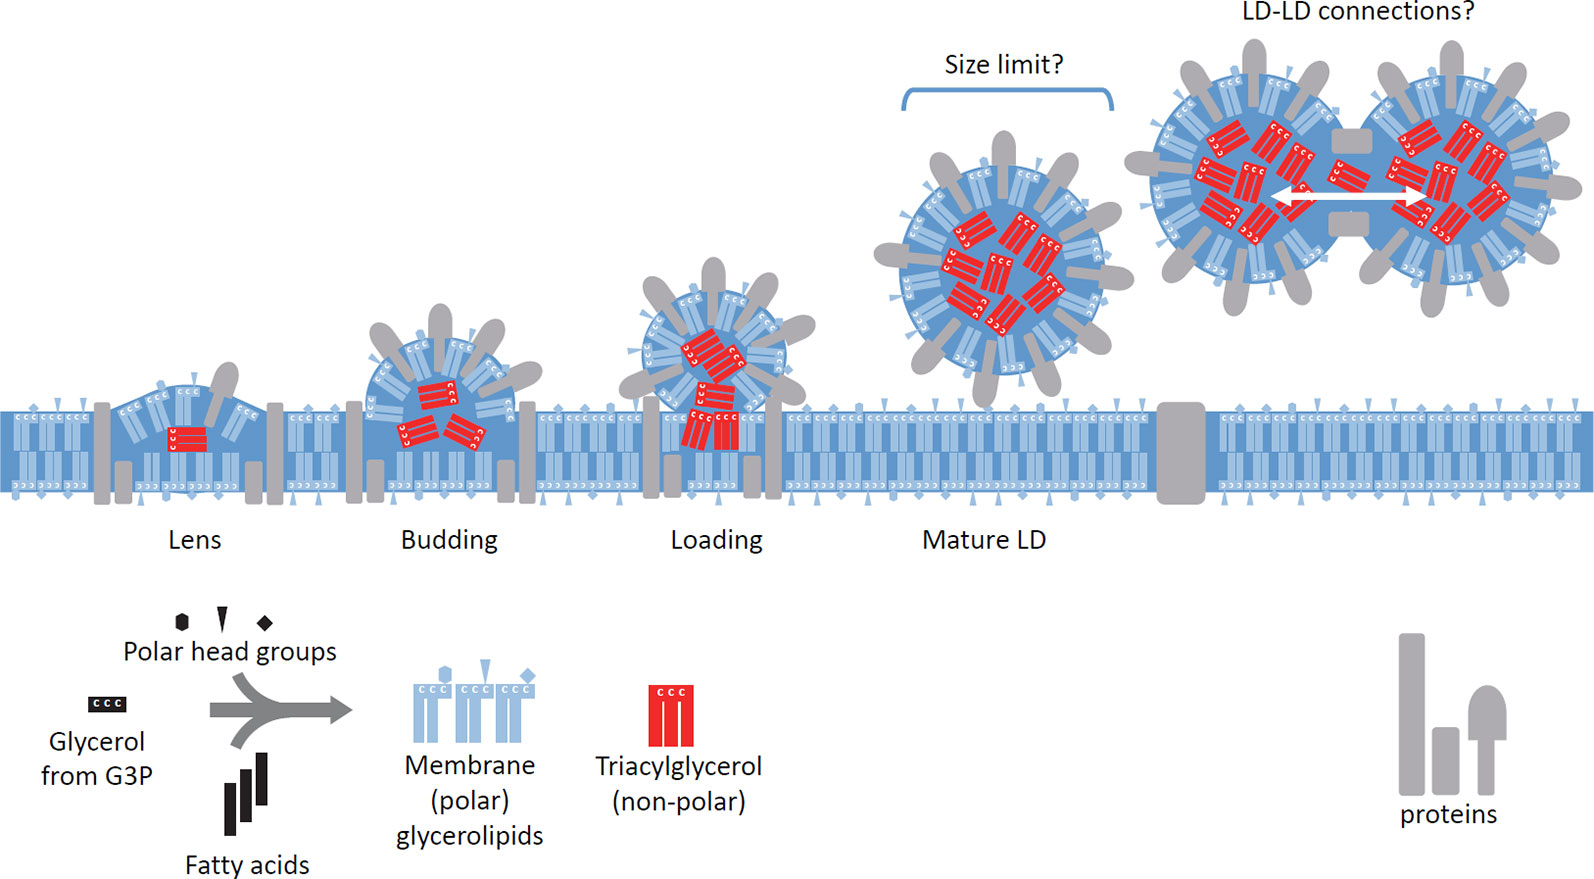
Figure 1 Stepwise biogenesis of lipid droplets in Phaedoactylum. The precise membrane platform producing cytosolic lipid droplets (LDs) in Phaeodactylum is still unknown, but proteomic and lipidomic analyses suggest a location at the outermost membrane of the plastid (epiplastidial membrane or EpM) or at the vicinity of the EpM. LDs are sub-spherical organelles loaded with triacylglycerol (TAG, non-polar glycerolipid), shown in red. TAG does not form lipid bilayers like other polar glycerolipids, shown in blue. The initial step (Lens) involves multiple proteins, including, on the one hand, enzymes producing TAG using de novo synthesized diacylglycerol or recycling available polar glycerolipids, and on the other hand, multiple structural proteins making a boundary to this LD-forming platform, like SEIPIN. Membrane thickening leads to the formation of a LD primordium (Budding), and the activity of TAG-synthesizing enzymes leads to the formation of a sub-spherical structure (Loading). The absence of homologues of proteins usually involved in LD biogenesis in late stages (Mature LDs) suggests that the LD is not connected anymore to its biogenetic platform. It is not known whether a size limit determines the production of mature LDs. The existence of connections between LDs by proteins that would act like CIDE proteins described in other eukaryotes, ensuring a mobility of TAG molecules from one LD to another, is also unknown.
Recent lipidomic and proteomic study of the purified LD of nitrogen-starved P. tricornutum has allowed reconstructing basic features of the architecture of this organelle and has pointed some membrane compartments that could be involved in its biogenesis and function (Lupette et al., 2019). Since TAG derives from membrane glycerolipids, LD biogenesis requires a membrane for its initial formation by budding. In yeast or mammals, LD buds from the outer leaflet of the ER (Pol et al., 2014; Wilfling et al., 2014; Walther et al., 2017), whereas in photosynthetic algae such as Chlamydomonas, LD biogenesis involves the chloroplast envelope (Nguyen et al., 2011). Diatoms have a much more sophisticated intracellular membrane architecture, with a chloroplast acquired following a secondary endosymbiosis, known as a “secondary” or “complex plastid” (Janouskovec et al., 2010; Flori et al., 2016; Fussy and Obornik, 2018) (Figure 2). This secondary plastid is delineated by four membranes, the outermost one, or epiplastid membrane (EpM) being continuous with the nuclear envelope and therefore connected to the endomembrane system, including the ER (Flori et al., 2016; Cavalier-Smith, 2018) (Figure 2). Through this connection, the ER could possibly contribute to the lipid biogenesis of the EpM, by supplying some lipids necessary to build up this membrane (Petroutsos et al., 2014; Abida et al., 2015). The second outermost membrane, or periplastidial membrane has no apparent continuity with other cell systems and no hypothesis is currently proposed regarding its lipid biogenesis. A vesicular network was shown to protrude from the periplastidial membrane and a membrane contact site with the nuclear inner envelope membrane has been observed (Figure 2) (Flori et al., 2016; Cavalier-Smith, 2018); the function of these structures is still unknown. The two innermost membranes correspond to the outer and inner envelope membranes (oEM and iEM) of the symbiont's chloroplast (Figure 2). In plants and photosynthetic cells containing simple plastids, the oEM and iEM have the equipment required for an autonomous synthesis of plastid glycerolipids, and this is possibly the case in diatoms (Boudiere et al., 2012; Boudiere et al., 2014; Petroutsos et al., 2014; Li-Beisson et al., 2019).
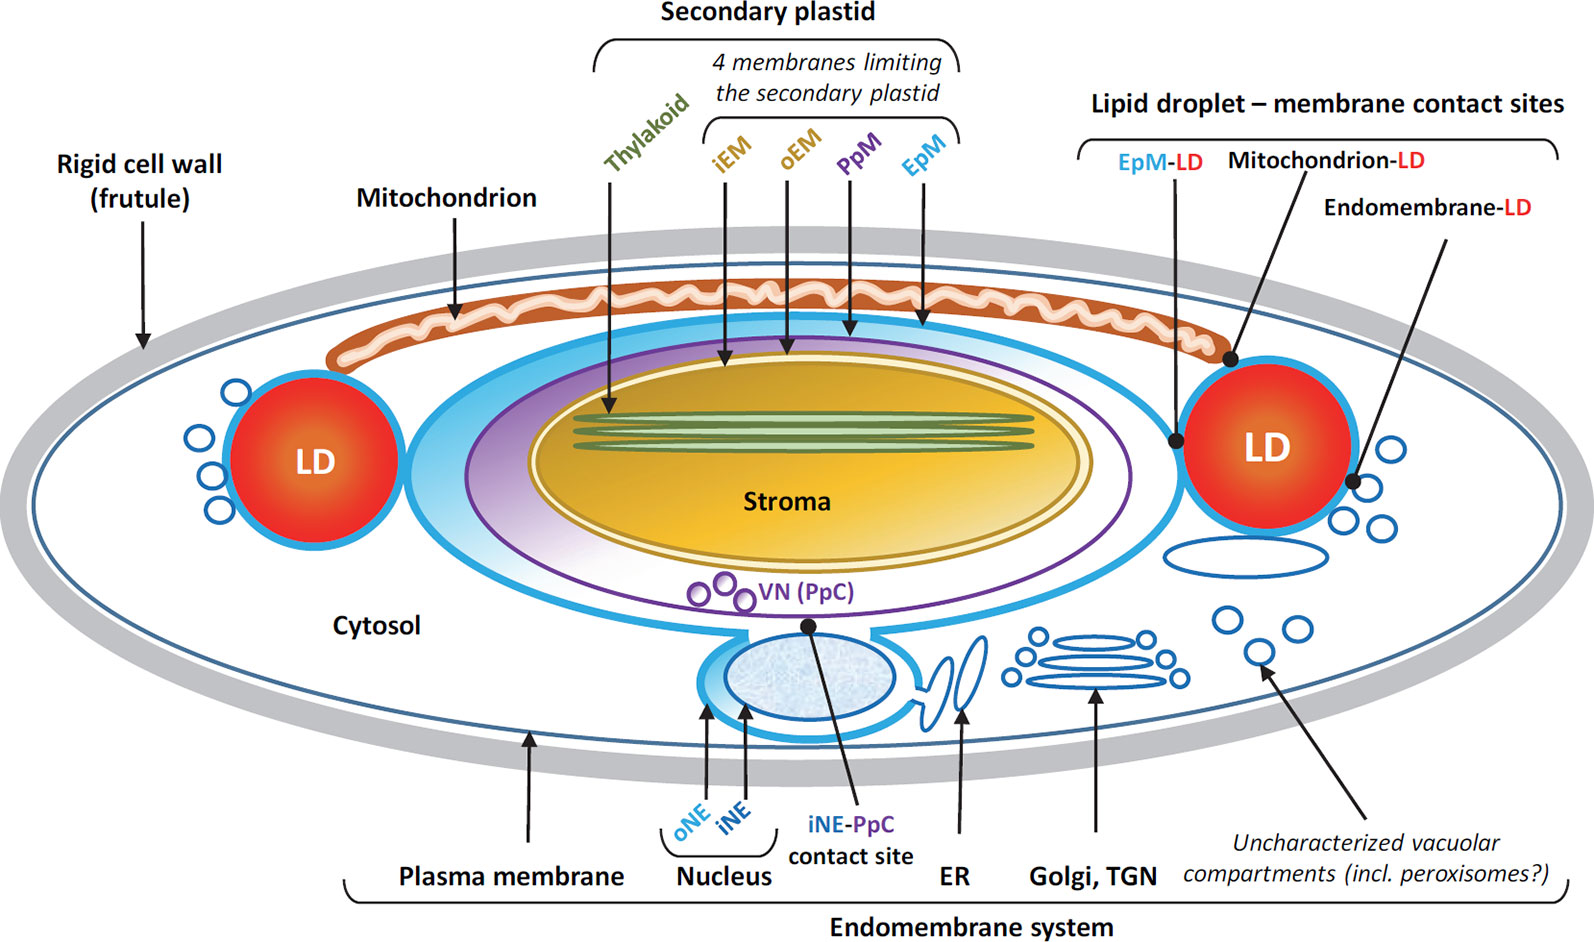
Figure 2 Membrane compartmentalization and lipid droplet (LD)-membrane contacts in the pennate diatom Phaeodactylum. Diatoms contain a secondary plastid deriving from a secondary endosymbiosis. Four membranes limit this plastid, from inside to outside: the inner (iEM) and outer envelope membranes (oEM), the periplastidial membrane (PpM), and the epiplastidial membrane (EpM). The PpM generates a vesicular network (VN) in the periplastidial compartment (PpC), with unknown function. The EpM is continuous with the outer nuclear envelope (oNE). At the level of the isthmus between the secondary plastid and the nucleus, a direct contact occurs between the PpM and the inner nuclear envelope (iNE). LDs, shown in red, are located in the cytosol on each side of the elongated plastid. Direct contact sites between LDs and membranes are observed with the EpM, the mitochondrion and uncharacterized endomembranes. It is likely that the EpM-LD contact site corresponds to the LD-forming platform, whereas LD-mitochondrion and LD-endomembrane contact sites correspond to catabolic platforms where fatty acids hydrolyzed from triacylglycerol might be exported for downstream degradation by beta-oxidation, or recycling for other purposes. The whole cell is bounded by a rigid cell wall, or frustule.
Electron microscopy images of cells of nitrogen-starved P. tricornutum show tight connections between LDs and the EpM (LD-EpM contact sites), endomembrane vesicles (LD-endomembrane contact sites) and the mitochondria outer envelope membrane (LD-mitochondria contact sites) (Flori et al., 2016) (Figure 2). LD-mitochondria contacts are necessary for the consumption of FAs, via β-oxidation following TAG hydrolysis, and they are therefore involved in LD degradation rather than biogenesis. Based on proteins detected in the LD of P. tricornutum and on the composition of the monolayer of polar glycerolipids limiting this organelle, containing lipids deriving from the plastid, i.e. SQDG, and from the ER, i.e. PC and DGTA (Lupette et al., 2019), the biogenesis of LDs is likely dependent on a biosynthesis platform at the surface of the EpM or in a endomembrane compartment in the vicinity of the EpM.
The proteome of mature LDs from nitrogen-starved P. tricornutum poses questions regarding LD homeostasis. They lack protein markers of LD early formation (such as the P. tricornutum SEIPIN orthologue, Phatr3_J47296 (Lu et al., 2017)) or enzymes involved in TAG biosynthesis (such as diacylglycerol acyltransferases, DGATs, or PC:diacylglycerol acyltransferases, PDATs) (Lupette et al., 2019). In numerous eukaryotes including insects, mammals and plants (Bouvier-Nave et al., 2000; Kuerschner et al., 2008; Stone et al., 2009; Wilfling et al., 2013; Ayme et al., 2014) mature LDs were shown to contain the machinery to synthesize TAGs, keeping therefore their ability to expand over time (Yu and Li, 2017). Missing this equipment, mature LDs from diatoms may reach a size limit (Figure 1). In organisms such as yeast, connections with the ER remain and proteins from mature LDs can relocate to the ER membrane (Jacquier et al., 2011). We still do not know whether such connections are functional in mature LDs from diatoms and Figure 1 illustrates the case of a physical separation. Nevertheless, based on LD proteome data, contact sites may exist with the EpM, however these LD-EpM contact sites do not contain TAG synthesizing enzymes (Lupette et al., 2019), which seems contradictory with a role in LD formation. Mature LD-EpM contact sites could possibly operate in a distinct function at late stages, even TAG hydrolysis, as suggested by the presence of a TAG lipase in the EpM, OmTGL, Phatr3_J37711 (Li et al., 2018). Multifunctional LD-membrane contact sites can indeed operate differently, in different metabolic rewiring contexts (Schuldiner and Bohnert, 2017).
LD fusion is also known to occur in multiple eukaryotes, by the action of Cell death-inducing DFF45-like effector (CIDE) family proteins including CIDE-A, CIDE-B, and CIDE-C/Fsp27 (Gao et al., 2017; Yu and Li, 2017; Lv et al., 2019). No CIDE homologue sequence could be identified in the genome of P. tricornutum but the presence of structural proteins promoting LD fusion cannot be excluded (Figure 1).
In this study we addressed the control of the size of LDs induced by nutrient stress in P. tricornutum. We used a pulse field gradient nuclear magnetic resonance (PFG-NMR) method to detect whether mature LDs could be connected by physical bridges allowing LD-to-LD TAG mobility, or ultimately LD-LD fusions. We then analyzed the dynamics of LD size following nitrogen depletion and developed a mathematical model relating LD size limit to constraints dictated by cell geometry and available cytosolic volume.
To follow the dynamics of LD production, we used nitrogen starvation as a model condition. As reported previously (Abida et al., 2015) a 00N10P ESAW medium, providing ten times the requested amount of phosphate (Pi) needed for P. tricornutum growth, is used to define a nitrogen-depleted condition. It ensures that no exhaustion of Pi occurred during the experiment. Consistently with past studies, during 7 days of nitrogen starvation, cell proliferation (growth) of P. tricornutum was slower than in nitrogen-rich conditions, the photosynthetic capacity of P. tricornutum cells decreased significantly and non-polar lipid accumulation, based on Nile Red staining, increased over time (Supplemental Figures S1A–C). Non-photochemical quenching (NPQ) processes help to regulate and protect photosynthesis in environments in which light energy absorption exceeds the capacity for light utilization (Muller et al., 2001). In nitrogen-depleted condition, the NPQ value increased consistently (Supplemental Figure S1D).
Glycerolipids from P. tricornutum cells were extracted and the total amount of FAs was quantified, showing a regular increase (Supplemental Figure S2A). In P. tricornutum, main FAs usually contain from 14 carbons and no unsaturations, i.e. 14:0, up to 20 carbon and five double bonds, i.e. 20:5. In the course of the experiment, the proportions of short and medium chain FAs, i.e. 14:0, 16:0, and 16:1 increased, whereas the proportion of polyunsaturated and long chain FAs, i.e. 16:3, 18:3, and 20:5 decreased (Supplemental Figure S2B), reflecting the expected increase in TAG enriched in 16:0 and 16:1.
The content of each glycerolipid class was determined, using liquid chromatography coupled to tandem mass spectrometry (Figure 3). In the first 3 days (from day 0 to 3), the amount per million cells of major membrane lipids from photosynthetic membranes, i.e. SQDG, MGDG, and DGDG as well as PC, synthesized in the endomembrane system, increase, incorporating FAs, possibly due to an increase in FA synthesis and/or a decrease in their degradation following nitrogen removal (Supplemental Figure S2A). In parallel, TAG accumulates (Figure 3A). Following this first stage (from day 4 to 7), the quantity per million cells of all these polar lipids decreased, whereas TAG accumulated further, reflecting an arrest of polar lipid synthesis and/or a recycling from polar lipids to TAG (Figure 3A). When considering the percentages of the different glycerolipid classes, the proportions of all membrane lipids (with the noticeable exception of DGDG) decreased from the first day of nutrient removal (P-value < 0.05 based on a student's t-test), at the expense of TAG, indicating that the accumulation of TAGs is faster than the transient increase of each membrane lipid (Figure 3B). This intense remodeling of membrane and storage glycerolipids is consistent with the functional impairment of the photosynthetic membranes we observed, correlating with the decrease of the photosynthetic capacity, and the accumulation of neutral lipids monitored using Nile Red staining.
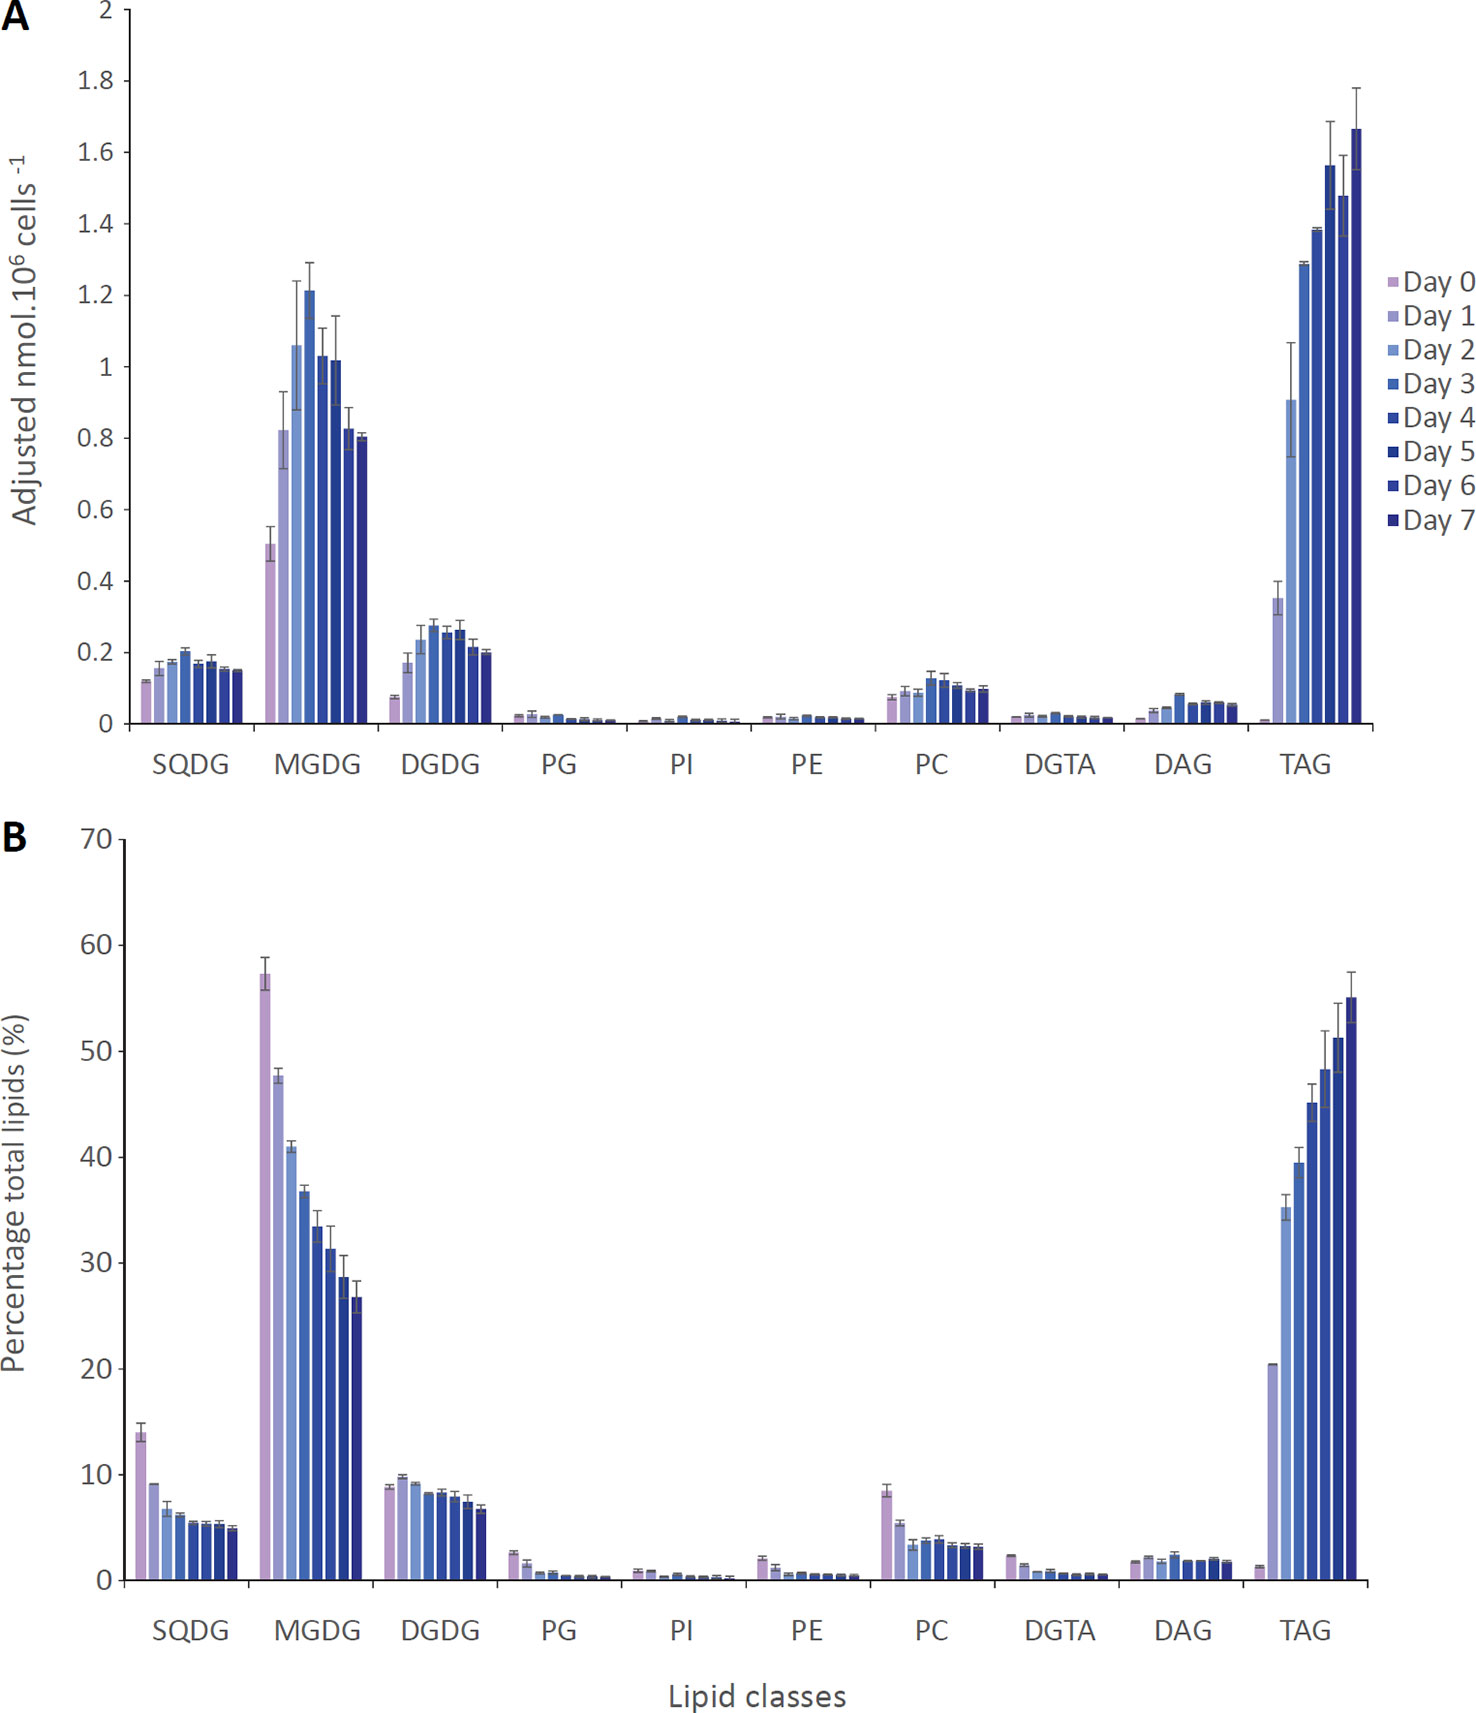
Figure 3 Lipid remodeling in Phaeodactylum tricornutum cells grown in nitrogen-depleted condition for 7 days. P. tricornutum cells were cultivated in 00N10P ESAW medium as described in the Methods section. (A) Quantification of each lipid class in nmol per million of cells. (B) Relative proportions of each lipid class in percentage of total glycerolipids. Purple bars correspond to day 0, whereas each day of the time course corresponds to bars from light to dark blue. DAG, diacylglycerol; DGDG, digalactosyldiacylglycerol; DGTA, diacylglyceryl hydroxymethyltrimethyl-β-alanine; MGDG, monogalactosyldiacylglycerol; PC, phosphatidylcholine; PE, phosphatidylethanolamine; PG, phosphatidylglycerol; PI, phosphatidylinositol; SQDG, sulfoquinovosyldiacylglycerol; TAG, triacylglycerol. Data are the average of 3 independent experiments. Error bars show standard deviations.
Based on the staining of LDs by Nile Red, we observed P. tricornutum cells by epifluorescence microscopy and measured the size (radius) of LDs in three independent biological triplicates. For each day, there was no statistical difference in size distribution (based on student's t-tests), allowing the analysis of a consolidated distribution of LD sizes measured in 40, 141, 333, 305, 418, 509, and 373 LDs at day 1 to 7, respectively. No cell contained any visible LD at day 0 (Figure 4A). Histograms were based on rounded values at the nearest 0.03 µm value. We also visualized cells by confocal microscopy at day 0, and from day 3 to day 6 to detect possible variabilities in cell and LD morphologies (Figure 4B).
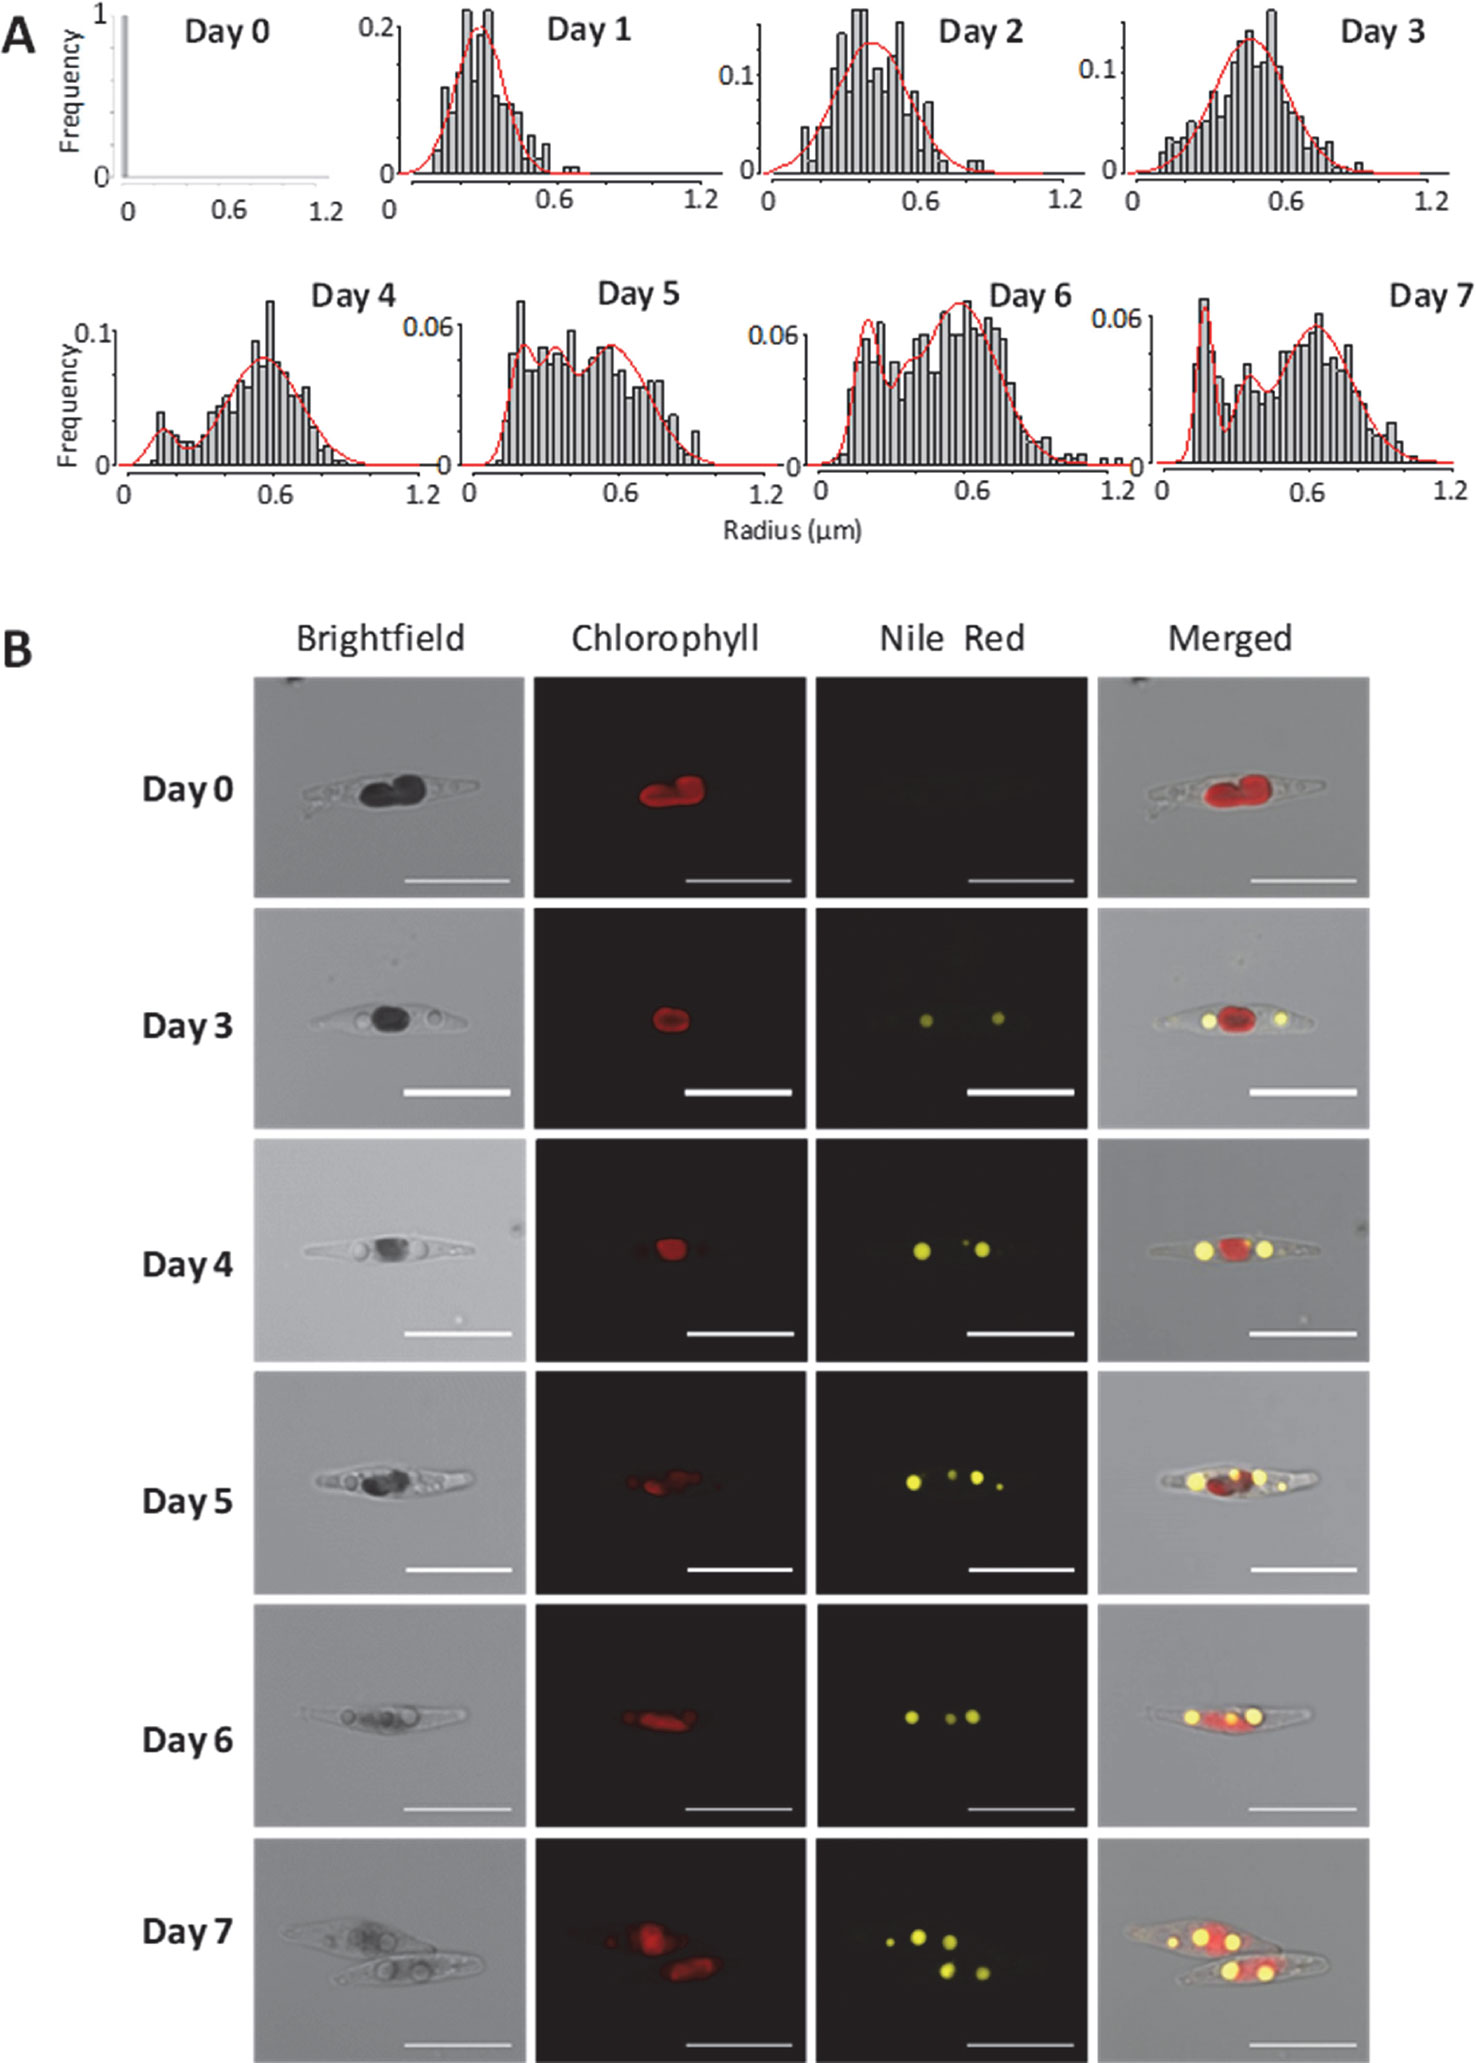
Figure 4 Size of Lipid droplets (LDs) in Phaeodactylum tricornutum cells grown in nitrogen-depleted conditions for 7 days. LDs size was determined with an epifluorescence microscope as described in the Methods section. LD measurements were performed on 40, 141, 333, 305, 418, 509, and 373 LDs at day 1 to 7, respectively. The curves shown in red correspond to the predictions based on the mathematical model described at the end of the manuscript. (A) Distribution of LD radius measurements. Histograms were based on rounded values to nearest 0.03 µm value. The curve in red shows the predictive model obtained in this work, at the corresponding time value. (B) Confocal imaging of representative cells. In red, autofluorescence of chlorophyll (secondary plastid in central position within the cells); in yellow, Nile red staining of LDs.
In the first 3 days, the population of LDs seemed homogenous, with a regular shift of the size (radius value) distribution, from an inexistent radius measurement (day 0) to approximately 0.45 µm (day 1 to 3). At day 4 the overall size distribution shifted to higher radius values, but a second population seemed to appear in lower radius ranges. At day 5, the distribution was broadly dome-like shaped. At day 6, two major populations of radius distributions seemed to appear more distinctly. At day 7, three populations seem to be clearly present with smaller, intermediate and higher radius values (Figure 4A). In all samples, the shape of the LDs remained subspherical, with some LDs apparently disconnected (distant) from the secondary plastid, supporting the rupture of direct contact with the EpM, in some of the mature LDs (Figure 4B). This analysis of LD size distribution shows therefore that the biogenesis of LDs following a shortage of nitrogen is not a continuous and even process of LD budding, but an ordered production of LD subpopulations, reaching a size limit, with at least three waves during the time of observation, over 7 days.
We used a PFG-NMR method previously applied to the determination of TAG mobility inside LDs of seeds (Gromova et al., 2015). This non-invasive approach allows analyzing in a short time the samples containing hundreds of millions of cells. PFG-NMR method is based on measurements of the apparent diffusion coefficient (Dmeas) of species (Tanner and Stejskal, 1968), which can differ from the self-diffusion coefficient (Dself) in the case of restricted diffusion. The diffusion delay during which the molecular random motion is analyzed, here that of TAG molecules, is termed Δ. For different values of Δ, the conditions of free or restricted diffusion can be fulfilled (Figure 5A), and different values of Dmeas are obtained (Dmeas = Dself for short Δ and Dmeas < Dself for longer Δ). More precisely, these conditions of confined diffusion depend on diffusion time, TAG viscosity and also on the size of confining volume (i.e. LD volume). In the case of confined diffusion, the parameter Dmeas x Δ corresponding to mean squared displacement of TAG molecules, reaches its limit value (Figure 5B), and allows to determine the mean radius of the cell regions in which TAG are confined (Tanner and Stejskal, 1968) (Figure 5B). As these measurements are based on the attenuation of the spin-echo signal of TAG, and this attenuation is quite small (few percent only) for studied LD size and available field gradient strength, one needs a quite good signal to noise ratio of TAG NMR signal. Consequently, these measurements were performed on algae samples which accumulated a substantial amount of TAG i.e. at the third, fourth, fifth, sixth, and seventh day of the nitrogen starvation. For all samples a plateau values in Dmeas xΔ = f(Δ) plots were observed (Supplemental Figure 3S) and the mean Radius values were calculated (Figure 5C).
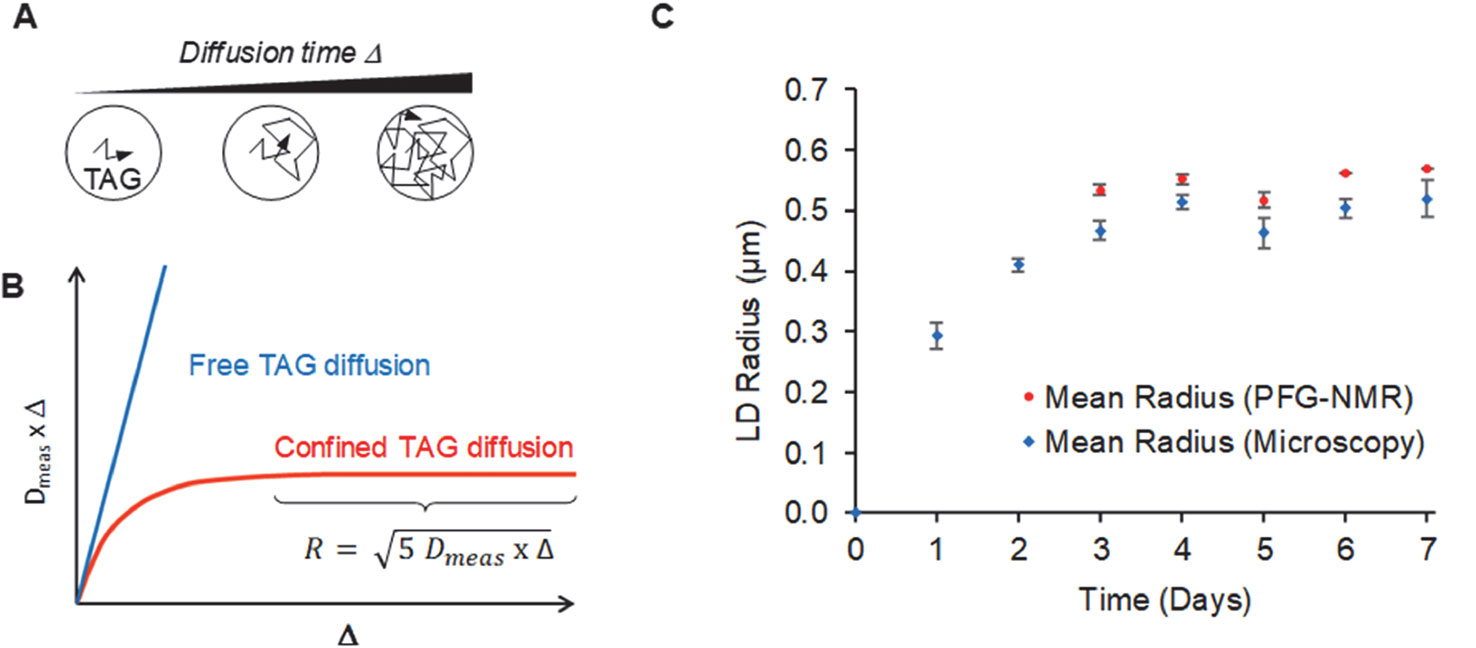
Figure 5 Analysis of TAG confinement inside Phaeodactylum tricornutum cells using 1H PFG-NMR. (A) Schematic definition of Δ, the diffusion delay during which a TAG molecular diffusion is observed. Either TAG molecules can diffuse freely, or TAG molecules are confined inside a three dimensional cellular territory, shown here as subspherical. (B) Principle of the determination of the size of the cellular territory in which TAG molecules are mobile. When increasing the diffusion delay, either Dmeas xΔ is a linear function of Δ indicating that TAG is freely mobile without any obstacle, or it reaches a plateau, allowing the determination of the mean radius of the cellular territory inside which TAG is confined. (C) Comparison of the mean radius of lipid droplets (LDs) from nitrogen-depleted Phaeodactylum tricornutum measured by the analysis of cells by epifluorescence microscopy and by PFG-NMR The measurements of LD radiuses based on PFG-NMR analyses were performed at day 3, 4, 5, 6 and 7 (red points) and compared with values determined with an epifluorescence microscope (blue points). The number of LDs measured in epifluorescence measurements was 40, 141, 333, 305, 418, 509, and 373, for day 1 to 7, respectively. Error bars for Microscopy measurements correspond to standard deviations for mean radiuses calculated in biological triplicates. Error bars for NMR measurements correspond to standard deviations of radius measurements in biological triplicates.
Using PFG-NMR method, we could first determine that TAG molecules are confined inside three-dimensional cellular territories, which themselves do not manifest any displacement at the scale of diffusion time Δ. Secondly, the estimated NMR Radius values are very close to those obtained by direct measurements of LDs using epifluorescence microscopy (Figure 5C). As expected, NMR Radius values are slightly higher than those obtained by microscopy, because NMR describes a “volume weighted” distribution of LDs (the NMR signal for a given LD being proportional to the number of TAG molecules inside it). The PFG-NMR approach is also expected to be reliable and very robust, because measurements are achieved using millions of cells. It is interesting to note, that the slight decrease in value of the mean radius of LDs observed at day 5 is confirmed here, whereas the two measurements were performed on distinct aliquot fractions. Moreover, the very close values of LD mean size estimated by NMR and by microscopy suggest that the 3D mobility of TAG molecules cannot exceed the volume of one mature LD. Thus, whereas the fusion of mature LDs has been reported in multiple eukaryotic systems (Gao et al., 2017; Yu and Li, 2017; Lv et al., 2019), no evidence could be obtained in P. tricornutum that LDs could be connected by bridges allowing LD-to-LD TAG mobility, or ultimately LD-LD fusions. This does not exclude that a portion of LDs may encounter some transient fusion events, but in that case, they would not permit massive movements of TAGs and be, therefore, extremely minor. This result is consistent with the absence of genes coding for homologs of Cell death-inducing DFF45-like effector (CIDE) family proteins (Gao et al., 2017; Yu and Li, 2017; Lv et al., 2019), although the presence of alternative LD fusion systems, operating in other physiological contexts, are not excluded.
Altogether, the analysis of LD size distribution in P. tricornutum following a shortage in nitrogen highlights the stepwise generation of subpopulations, at least three, marked by an increase in size (radius) over time reaching a maximum value. These subpopulations are structurally disconnected, without any evidence of LD-LD bridges that would allow the diffusion of TAG from one LD to another. From a structural point of view, P. tricornutum cells are very narrow, with a section measuring approximately 15 × 4 µm, containing an ellipsoid plastid of about 6 × 4 µm (Flori et al., 2016; Flori et al., 2018). Taking into account the nucleus and the mitochondria, a very small amount of free-space is left. As a consequence, produced LDs grow until they reach a size limited by cell packing with other membrane organelles and by the stiffness of the limiting cell wall. Considering this observation, and the fact that the mean size of LDs reaches an upper limit at the fourth day (Figure 5C), decreasing even slightly on the fifth day, one could assume that a maximum limit might also be reached for TAG accumulation. From the lipidomic profiling results (Figure 3), it is clear that the amount of TAG keeps increasing, even after the fourth day, showing inconsistency between Mean radius values for LDs and TAG amount.
The distribution of the LD radius (Figure 4) gives insight into a possible explanation for this incoherence. From day 1 to day 3, there is only one population of LDs, which radius increases regularly. From day 4 and after, an additional subpopulation of LD appears, apparently expanding in a more crowded cytosol and reaching therefore a smaller limit value. By multiplying the number of LDs in a same cell, more TAG can be stored, even if the mean LD size does not change.
These observations led to the following hypotheses, as working assumptions for mathematical simulations. In a first hypothesis an initial subpopulation of LDs (P1) appears early after nitrogen depletion and the corresponding LD size increases until reaching a maximum at about day 3, then a second subpopulation (P2) is produced at day 4, and a third population (P3) at day 6. The size of LDs in P2 and P3 increases until reaching different maxima. Specifically, the radius of LDs of subpopulation P2 reaches a maximum at about day 5, and the radius of LDs of subpopulation P3 at about day 7. In the second hypothesis (Figure 6A), an initial subpopulation of LDs (P1) appears early after nitrogen depletion and the corresponding LD size increases until reaching a maximum at day 3, then a second (P2) and a third (P3) subpopulations are produced at day 4 and the corresponding LDs increase in size until reaching different maxima at different time. Specifically, P2 and P3 appear at the same time but LDs from subpopulation P2 reach a maximum size at about day 3 whereas LDs from subpopulation P3 reach their maximum size at day 6. Based on our simulations, only this second hypothesis fitted with real data, and is therefore detailed below.
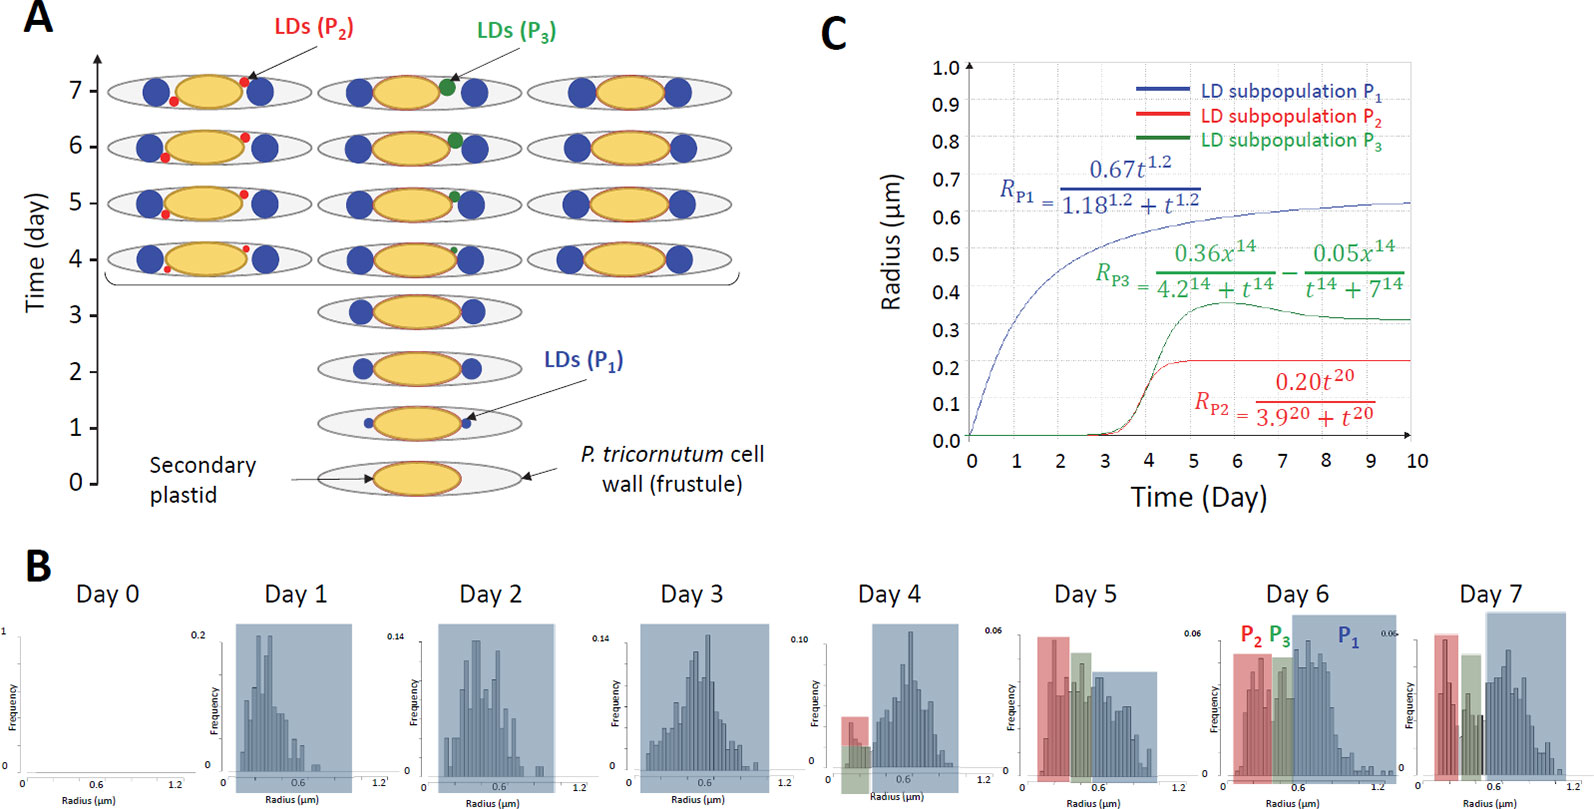
Figure 6 Assumptions for the mathematical simulation of LD dynamics in Phaeodactylum tricornutum cells. (A) Lipid droplet (LD) subpopulations. The hypothesis is that three distinct subpopulations of LDs are generated over time. P1 (in blue) is the first to appear following transfer of cells into a nitrogen-depleted environment. LDs reach a maximal mean radius at day 3. Then the biogenesis of novel LDs is triggered, generating two subpopulations, P2 (in red) and P3 (in green), which can be distinguished based on the maximal radius they reach, P2 with small LDs and P3 with LDs of intermediate maximal size. Since P3 reaches a higher mean radius than P2, we hypothesize that more cytosolic volume is available to allow LD loading with more TAG. (B) Highlighting of subpopulations in LD size distributions. P1, P2 and P3 LD subpopulations are highlighted in blue, red and green respectively. (C) Mathematical model. Parameters for the Hill's equations used to simulate the dynamics of P1, P2, and P3 were based on the mean, standard deviation and proportion of each subpopulation.
The main advantage of assuming that distinct subpopulations of LDs are generated is that it explains simply the apparent inconsistency of the increase in the amount of TAG inside cells containing a limited amount of large LDs, having a limited maximal mean radius (subpopulation P1). Indeed, additional TAG molecules can be loaded inside smaller LDs corresponding to P2 and P3 (Figure 6A, B). A possible explanation for LDs reaching a maximum radius is the exhaustion of free-space in the cytosol. P. tricornutum cells are very narrow organisms bounded by a rigid frustule and containing a secondary plastid, mitochondrion and nucleus which are tightly packed (Flori et al., 2016). Results presented here suggest that once P1 has filled available cytosolic space with large size LDs, new LD subpopulations, P2 and P3 are formed in different locations (Figure 6A).
The distribution of P1 from day 1 to day 3, and the distributions of the P2 and P3 subpopulations following day 4, appear to follow a Normal (or Gaussian) distribution (Figure 6B). We therefore simulated data evolution using the Hill's equation (Hill, 1910) (Figure 6C), with the following equation for a given subpopulation of LDs:
With RLD the radius at time t, Rmax the size limit, h the slope of the curve and t1/2 the time requested to reach Rmax/2. Based on this general formula and using observed Rmax values for the three subpopulations, P1, P2 and P3 respectively:
The standard deviations are:
The simulation of LD size distribution (Supplemental video 1) is illustrated at day 6 in Table 1 and is shown in Figure 4A, as a red curve superimposed to the histograms showing the experimental values from day 0 to day 7.
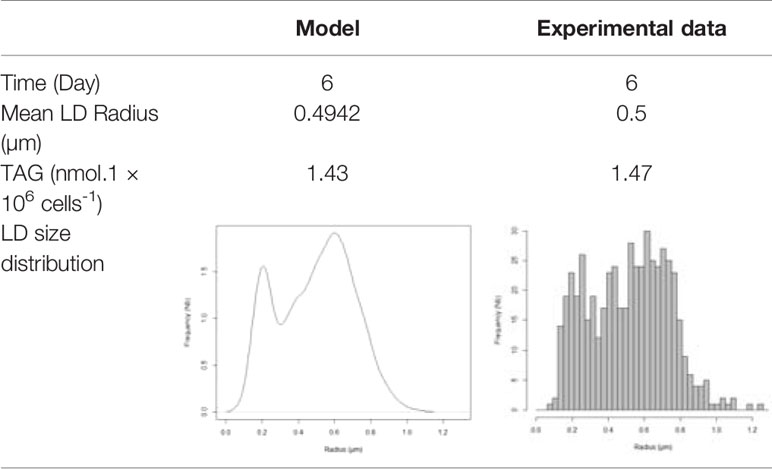
Table 1 Comparison of predicted and experimental LD size distribution in Phaeodactylum tricornutum cells at day 6, following a depletion of nitrogen in the growth medium.
When computing mean LD radiuses at day 1 to 7, the model fits linearly to the experimental data with a coefficient of determination R2 of 99% (Figure 7A). Using the model radius of LDs, it is possible to calculate the corresponding volume: the correlation between the volume predicted by the model and the experimental amount of TAGs is linear, with a coefficient of determination of 96%. Eventually, the correlation between the amount of TAGs predicted by the model based on the correspondence between volume of P1 LDs at day 2 with TAG quantification, and the experimental amount of TAGs is also linear, with a coefficient of determination of 95.6% (Figures 7B, C).
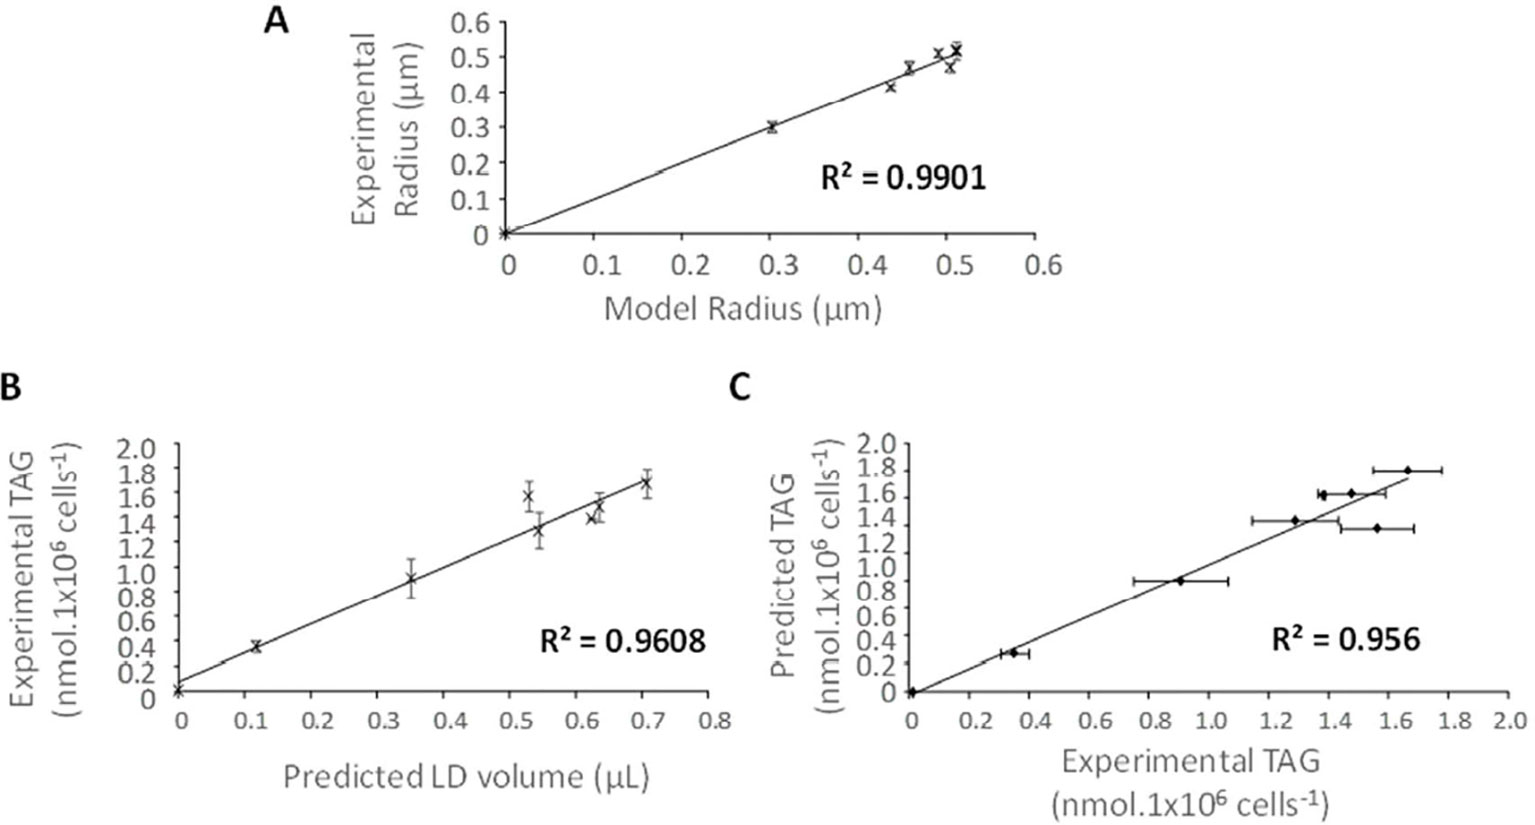
Figure 7 Comparison of the mathematical simulation of LD dynamics in Phaeodactylum tricornutum cells with experimental data. (A) Correlation between the mean LD radius predicted by the model and the mean LD radius obtained from experimental data. (B) Linear correlation between the amount of TAG per million cells and the LD volume predicted by the model. (C) Linear correlation between the amounts of TAG determined experimentally and that based on model prediction. Coefficients of determination (R2) are indicated based on linear regressions.
In the ‘jar of life' lesson, a popular metaphor of the way one should handle priorities in a lifetime, a jar is firstly filled with golf balls, then with pebbles and sand (Figure 8A). Similarly, LD biogenesis follows a stepwise generation of subpopulations in P. tricornutum, reaching large (P1), smaller (P2), and medium (P3) sizes, filling up the available cytosolic space. The radius of P1, P2 and P3 subpopulations reach an average of 0.675 ± 0.125, 0.195 ± 0.046, and 0.385 ± 0.053 µm at day 7, respectively. The lesson of the ‘jar of life' is that if one starts to fill the jar with sand, no more room will be available for pebble and golf balls. Since a sphere has the smallest surface-area-to-volume ratio, the storage of TAGs is the most efficient and less energy demanding in largest LDs (P1), leaving cytosolic space for further LDs (P2 and P3): the stepwise production of subpopulation is therefore the most efficient for diatoms to cope with long stress periods. Based on our observations and model, P2 and P3 are in fact a unique type of secondary LDs reaching distinct maximal sizes based on the cytosolic space left by P1.
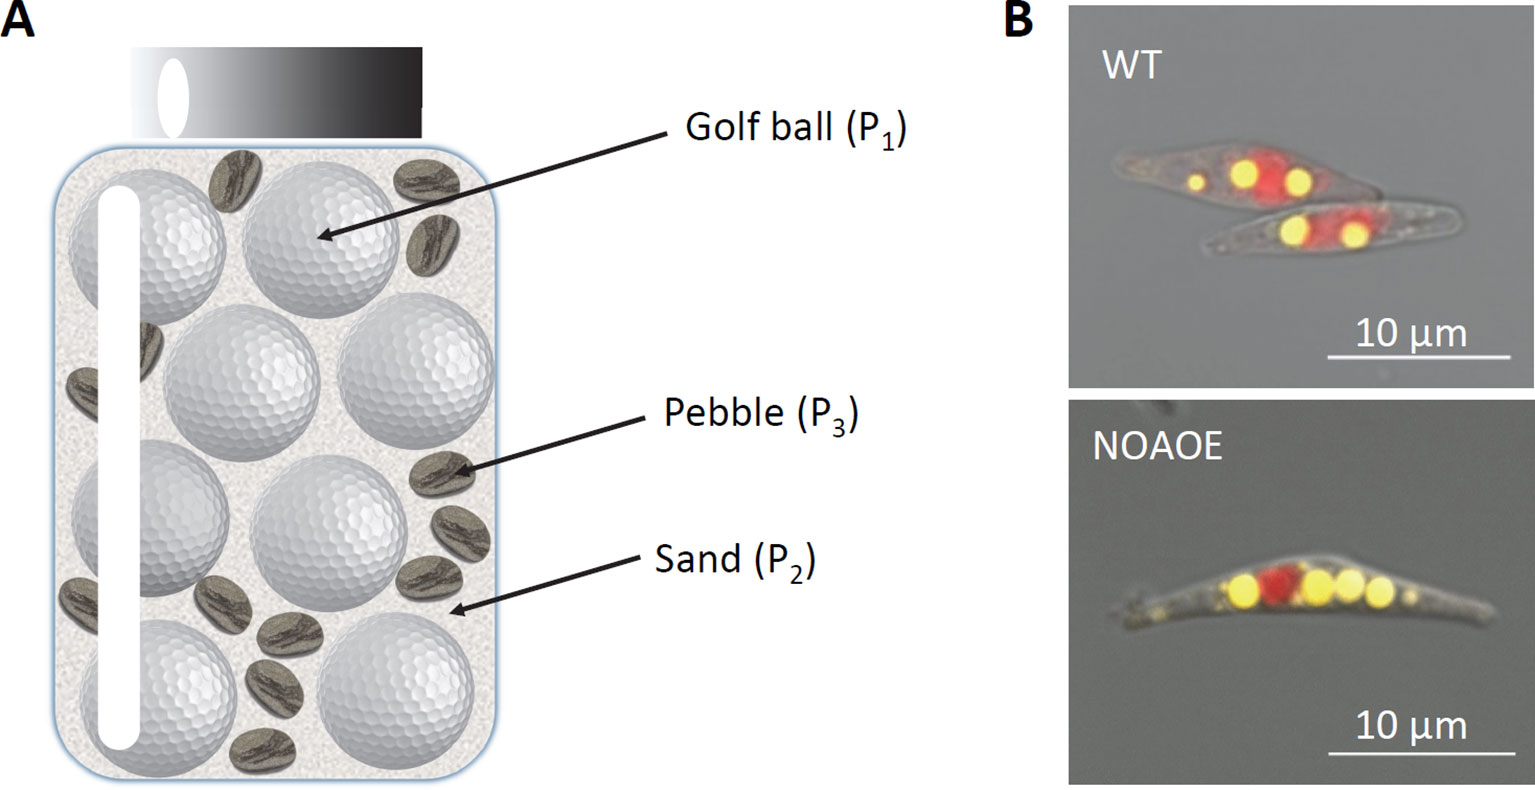
Figure 8 The “jar of life” model. (A) Filling of a jar with golf balls, pebbles and sand. In this famous illustration of the way to sort priorities, the most efficient way to fill a jar with golf balls, pebbles and sand is to begin with larger elements, i.e. golf balls, and finish with sand filling the interstices. (B) Impact of cell size on LD accumulation? In some mutants of P. tricornutum, such as NOA overexpressing lines (NOAOE), cells are larger. These lines have been shown to accumulate more TAG due to a combination of metabolic remodeling and transcriptional reprogramming promoting the synthesis of TAG. The proposed model suggests that their larger cells might contribute to the accumulation of more LDs.
Some P. tricornutum mutants accumulating more TAG, such as lines overexpressing the NOA gene (NOAOE) (Dolch et al., 2017), have larger cells than wild type (WT) (Figure 8B). The expression of NOA was correlated with nitric oxide (NO) emission within the cell, which triggered a transcriptional reprogramming and a metabolic rewiring diverting glycerolipid lipids toward TAG production. We sought whether, based on the present study, NOAOE larger cells could also accommodate LD subpopulations with distinct maximal sizes. The NOAOE mutant line was grown in nitrogen-depleted conditions for 7 days and the size of LDs was determined with an epifluorescence microscope on 327, 211, 194, 415, 438, 529, 508, and 565 LDs at day 0 to 7, respectively.
As expected, the NOAOE line contained a basal level of LDs at day 0 (Figure 9). Like in WT, three subpopulations were observed, but the P2 and P3 subpopulations appeared more rapidly, after 2 days rather than 3. The radius of the P1 subpopulation measured in NOAOE cells at day 7, with a mean value of 0.941 ± 0.169 µm, was 1.4 times higher than the radius of the P1 subpopulation in WT cells (p-value < 0.001). Likewise, the radius of the P3 subpopulation, with a mean value of 0.474 ± 0.078 µm, was 1.2 times higher than that of the P3 subpopulation in WT cells (p-value < 0.001). By contrast, the smaller sized P2 subpopulation had a similar size as that in WT, 0.184 ± 0.054 µm. This results confirms that, following the ‘jar of life' model, a first subpopulation of LDs fills up the available cytosolic volume, with a maximal radius determined by the size of the cell. Then smaller sized LDs are produced, filling up available interstices.
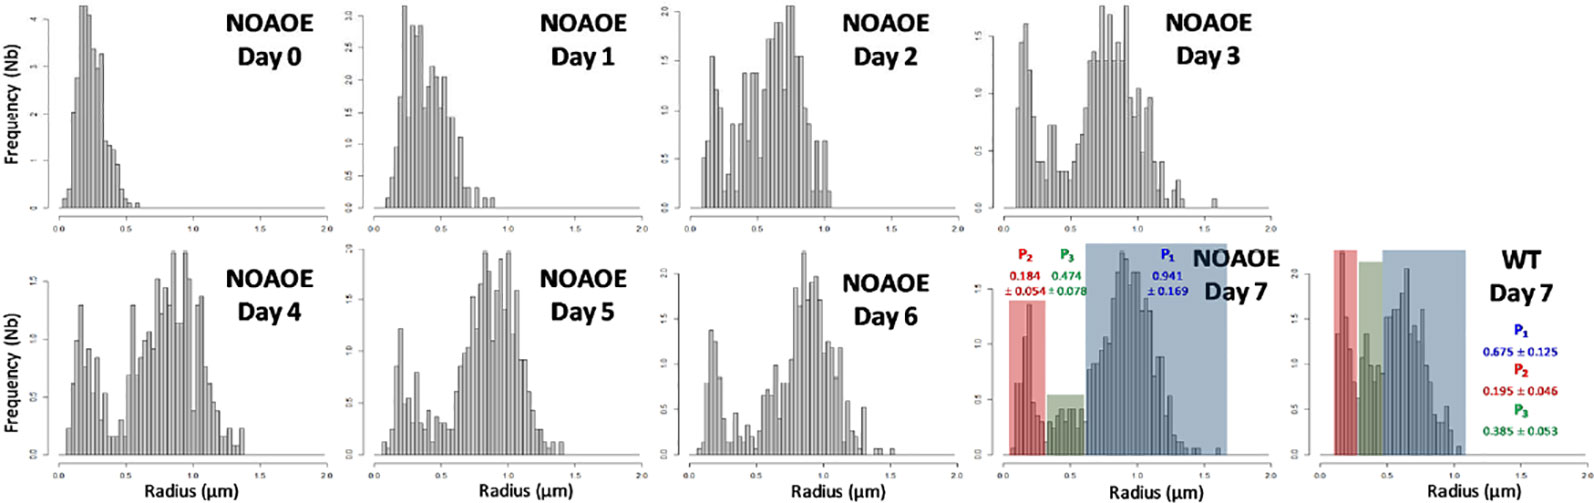
Figure 9 Size of Lipid droplets (LDs) in NOA overexpressing Phaeodactylum tricornutum cells (NOAOE) grown in nitrogen-depleted conditions for 7 days. The size of LDs was determined with an epifluorescence microscope as described in the Material and Methods. LD measurements were performed on 327, 211, 194, 415, 438, 529, 508, and 565 LDs at day 0 to 7, respectively. Histograms were based on LD radius values rounded to nearest 0.03 µm value. In graphs showing LD distribution at day 7 in WT and mutants cells, the subpopulations are highlighted as in Figure 6, with P1 in blue, P2 in red, and P3 in green. The radius mean values for each subpopulation are indicated in the corresponding color. While the mean size of the P2 subpopulation is similar between the mutant and WT (p-value = 0.14), there is a significant difference for both P1 and P3 (p-value < 0.001, student's test).
Altogether, this analysis of LD dynamics in P. tricornutum following a nitrogen depletion has highlighted key features of LD biogenesis in diatoms, that are consistent with the proteomic and lipidomic architecture recently described (Lupette et al., 2019). Consistently with the lack of TAG synthesizing enzymes in their proteome, such as DGATs or PDATs, mature LDs are not continuously loaded with TAG, do not expand further in size and reach a maximal radius after about 3 days of development. Consistently with the absence of any homologue of CIDE family proteins promoting LD fusion, PFG-NMR analyses of TAG confined diffusion do not show any LD-to-LD bridges or LD-LD fusions that could allow TAG mobility from one LD to another. Our results do not exclude the possibility of LD-LD fusions via an alternative mechanism occurring in other conditions.
In WT cells, we observed the stepwise biogenesis of subpopulations of LDs. The P1 subpopulation appearing first, consisted of LDs growing in size until reaching a maximal radius. Only after P1 LDs reached their size limit, at day 3 in WT cells, two subpopulations appeared, P2 and P3, of smaller maximal sizes. In a NOAOE mutant line having larger cells, this stepwise biogenesis of LDs was also observed, with NOAOE P1 LDs being consistently bigger compared to WT P1 LDs. It may be of interest to compare the size of LD subpopulations in other P. tricornutum accessions, differing from Pt1 8.6, and to compare fusiform LDs with those generated in triradiate or oval morphotypes. This process may be involved in the formation of LDs with larger sizes in other mutants or physiological contexts. In particular, it has been shown that blocking cell division in diatoms, led to the formation of larger cells, correlating with a higher TAG content (Kim et al., 2017; Conte et al., 2018).
The cellular factor(s) that prevents LD expansion, limiting the size of P1, P2 and P3 at distinct radius magnitudes, seem(s) to be under geometrical and mechanical constraints determined by P. tricornutum cellular anatomy, space availability in the cytosol and most importantly cell wall stiffness. It has been shown in animal cells that the Arf1/COPI protein machinery, known for its role in vesicle trafficking, could localize to cytosolic LDs and regulate their morphology and size (Thiam et al., 2013; Wilfling et al., 2014; Olzmann and Carvalho, 2019). In particular Arf1/COPI could lead to the budding of nano-LDs (∼60 nm diameter) from phospholipid-covered oil/water interfaces in vitro and were shown to be sufficient to bud nano-LDs from cellular LDs. This process was suggested to be correlated with surface tension in LDs of increasing size and to be associated with a binding of nano-LDs to the ER. Since the Arf1/COPI machinery was also detected in the proteome of P. tricornutum LDs (Lupette et al., 2019), the role it may play in the stepwise production of P2 and P3 subpopulations needs to be investigated. It will also be essential to analyze whether this stepwise biogenetic process operates in response to other stresses, in particular oxidative stresses that were previously shown to trigger the accumulation of smaller LDs containing distinct (more unsaturated) molecular species of TAGs (Lupette et al., 2018). It may be of interest to analyze whether cell space-availability also impacts the dynamics of accumulation of other carbon storage molecules such as carbohydrate polymers, and following which process.
Since oleaginous diatoms have attracted the attention for their potential as a feedstock for applications ranging from food, feed, cosmetics, to biofuels and green chemistry (Levitan et al., 2014; Lupette and Maréchal, 2018; Lupette et al., 2019), expansion of cell size might be considered for biotechnological developments. Future research should therefore focus on the determinant factors of LD-size control, cell shape and cell size in diatoms. It will be essential to evaluate whether this dynamic process of stress LD formation is conserved in other species or whether alternative strategies, including LD-LD fusion processes or mature LD expansion by associated TAG synthesizing enzymes, have been selected in other heterokont clades in the course of evolution.
Phaeodactylum tricornutum (Pt1) Bohlin Strain 8.6 CCMP2561 (Culture Collection of Marine Phytoplankton, now known as NCMA: National Center for Marine Algae and Microbiota) was used in all experiments. Some experiments were also performed with a mutant line overexpressing NOA (Dolch et al., 2017) and referred to as NOAOE. Pt1 and NOAOE cells were maintained and grown in a volume of 1 L in 2-L flasks at 20°C, in a modified ESAW (Enriched Seawater, Artificial Water) medium (NaCl 362.7 mM; Na2SO4 25 mM; KCl 8.03 mM; NaHCO3 2.067 mM; KBr 0.725 mM; H3BO3 0.372 mM; NaF 0.0657 mM; MgCl2 47.18 mM; CaCl2 9.134 mM; SrCl2 0.082 mM; Na2-glycerophosphate 21.8 µM; Na2SiO3 105.6 µM; disodium ethylenediaminetetraacetate dehydrate (Na2EDTA) 14.86 µM; Fe(NH4)2(SO4)2 5.97 µM; FeCl3 0.592 µM; MnSO4 2.42 µM; ZnSO4 0.254 µM; CoSO4 0.0569 µM; Na2MoO4 0.52 µM; H3BO3 61.46 µM; Na2SeO3 10 nM; biotin (vitamin H) 8.18 nM; cobalamin (vitamin B12) 2.94 nM; thiamine (vitamin B1) 0.594 µM) (Falciatore et al., 2000) using ten times enriched nitrogen and phosphate sources (10N10P containing 5.49 mM NaNO3 and 0.224 mM NaH3PO4) (Abida et al., 2015). Nitrogen starvation was performed by collecting cells from a 1-L culture by centrifugation at 3,000×g for 7 min, and resuspension in 100 ml in the same medium without any addition of NaNO3 (00N10P medium). This washing step was repeated three times and cells were then resuspended in 1 L of 00N10P medium, and cultivated for seven additional days. Cells were grown under gentle agitation (100 rpm) on a 12:12 light (40 μE m-2.s-1)/dark cycle. Growth was evaluated by cell counting using a TECAN infinite M1000Pro plate reader and determined following the equation y = 1.834.10-08 x + 0.03758, with x the absorbance at 730 nm and y the number of cells (Conte et al., 2018). All experiments were performed in biological triplicates and monitored using optical microscopy, confocal microscopy and NMR.
Accumulation of TAG droplets was monitored by Nile Red (Sigma Aldrich) fluorescent staining (excitation wavelength at λex max = 532 nm and emission at λem max = 565 nm), as previously described (Cooksey et al., 1987; Abida et al., 2015). In brief, cells were diluted and adjusted to a cell density that was linearly correlated with Nile Red fluorescence. Nile Red solution (40 μl of a 2.5 μg.ml-1 stock solution in DMSO) was added to 160 μl cell suspensions, in a well-96 black plate. Fluorescence was measured by spectrophotometry using a TECAN infinite M1000 PRO (λex = 530 nm).
Three independent biological replicates were subjected to a 7-day nitrogen depletion and analyzed every day to evaluate LD size distributions. For fluorescence microscopy analyses, 6 μl of cell culture stained with Nile Red were used. LDs were visualized using an epifluorescence microscope ZEISS Axio Scope A1 equipped with an EC Plan-NEOFLUAR objective (100x/1.3, oil immersion). Image captures were performed using a Zeiss AxioCam MRc 0.63x camera. Nile Red fluorescence was monitored by excitation at 488 nm and specific emission at 580 nm. Unstained algae cells have a common emission peak at 668 nm, corresponding to the auto fluorescence peak of chlorophyll (red). When stained with Nile Red, yellow fluorescence corresponds therefore to LDs. Acquisitions obtained by epifluorescence microscopy were saved under the Zeiss.czi format and imported with ImageJ 1.48v using the BIO-FORMATS plugins 5.7.2. The scale was predefined in the.czi format, allowing the measurement of LD diameters. Measurements were based on segments drawn from one side to the other of LDs. Data were stored and saved in.txt format and imported with Rstudio 1.1.423v. Diameters were divided by two and transformed into radiuses. Statistical analysis was performed using the computing environment R (https://www.R-project.org), with a significance level of 0.01. Means' comparisons were evaluated using both a Student's test (n = number of cells analyzed) and a multiple one-way analysis of variance. The latter was performed with a Bonferonni correction for each day in order to estimate the reliability of the replications. All experimental dataset were tested for normality test on the ANOVA residuals using the Shapiro-Wilk test (Taeger and Kuhnt, 2014). When required, a Bartlett test of homogeneity of variances was also performed. Even with classical data transformations, the LD size in day 4 did not meet ANOVA assumptions and so, the nonparametric counterpart of the one-way analysis of variance, the Kruskall-Wallis test, was applied. For confocal microscopy imaging, 3 µL of stained P. tricornutum suspensions were used. Observations were carried out using a Zeiss LSM800 confocal laser scanning microscope equipped with a Zeiss Plan-APO objective (x63/1.46, oil immersion) and enlarged four times. Nile Red fluorescence was monitored by excitation at 488 nm and capture zone ranging from 579 to 641 nm. Chlorophyll fluorescence was monitored by excitation at 488 nm and capture zone ranging from 650 to 700 nm. Bright field acquisitions are also performed.
The Fv/Fm ratio was used as an indicator of Photosytem II activity in a dark-adapted state. In vivo chlorophyll fluorescence was determined using a Speedzen MX fluorescence imaging system (JBeamBio) with settings previously described (Johnson et al., 2009; Allorent et al., 2013). To this end, a 140 µl volume of P. tricornutum culture was transferred to a transparent 96-well plate and dark-incubated for 15–30 min before measurements. Excitation was performed in the blue range (λ = 450 nm, F0). F0 corresponds to the steady state fluorescence in dark-adapted cultures, Fm to the maximal fluorescence after a saturating light pulse with green light (520 nm) of dark-adapted cultures, Fm' the same in light adapted cultures, and Fv the difference between Fm and F0. With these parameters, the maximum efficiency of energy conversion of photosystem II (PSII) can be calculated as Fv/Fm (Butler and Kitajima, 1975; Genty et al., 1990; Misra et al., 2012)V. A sequence of saturating flashes was applied on top of the actinic light to probe NPQ (Muller et al., 2001).
Whole cell lipids were extracted using the Folch method (Folch et al., 1957; Simionato et al., 2013). In brief, freeze-dried cells were suspended in 4 ml of boiling ethanol for 5 min to prevent lipid degradation, and lipids were extracted by addition of 2 ml methanol and 8 ml chloroform at room temperature. The mixture was then saturated with argon and stirred for 1 h at room temperature. After filtration through glass wool, cell debris were rinsed with 3 ml chloroform/methanol 2:1, v/v, and 5 ml of NaCl 1% were added to the filtrate to initiate phase separation. The chloroform phase was dried under argon before solubilizing the lipid extract in 1 mL of chloroform. Extracted lipids were dried under a flow of argon and conserved at -20°C until analyses. For each lipid extract, total glycerolipids were quantified from their FAs: in a 10 µl aliquot fraction a known quantity of saturated 15-carbon FA (15:0) was added and all FAs were methanolyzed into methyl esters (FAME) by a 1 hour incubation in 3 ml 2.5% H2SO4 in pure methanol at 100°C (Jouhet et al., 2003). The reaction was stopped by addition of 3 ml water, and 3 ml hexane was added for phase separation. After 20 min of incubation, the hexane phase was transferred to a new tube. FAMEs were extracted a second time via the addition, incubation and extraction of another 3 ml hexane. The combined collected hexane fractions (6 ml) were argon-dried and FAMEs were suspended in 40 µl hexane for analysis by gas chromatography coupled with flame ionization detection (GC-FID) (Perkin Elmer), using a BPX70 (SGE) column. FAMEs were identified by comparison of their retention times with those of standards (Sigma) and quantified by the surface peak method using 15:0 for calibration. Extraction and quantification were performed with three biological replicates. Glycerolipids were then analyzed and quantified by high-pressure liquid chromatography-tandem mass spectrometry (HPLC-MS/MS), with appropriate standard lipids (Jouhet et al., 2017). In brief, lipid extracts corresponding to 25 nmol of total FAs were dissolved in 100 µl of chloroform/methanol [2/1, v/v] containing 125 pmol of each internal standard. Internal standards used were phosphatidylethanolamine (PE) 18:0–18:0 and diacylglycerol (DAG) 18:0–22:6 from Avanti Polar Lipid, and SQDG 16:0-18:0 extracted from spinach thylakoid (Deme et al., 2014) and hydrogenated (Buseman et al., 2006). Lipids were then separated by HPLC and quantified by MS/MS. Lipid classes were separated using an Agilent 1200 HPLC system using a 150 × 3 mm (length × internal diameter) 5 µm diol column (Macherey-Nagel), at 40°C. The mobile phases consisted of hexane/isopropanol/water/1 M ammonium acetate, pH 5.3 [625/350/24/1, v/v] (A) and isopropanol/water/1 M ammonium acetate, pH 5.3 [850/149/1, v/v] (B). The injection volume was 20 µL. After 5 min, the percentage of B was increased linearly from 0 to 100% in 30 min and kept at 100% for 15 min. This elution sequence was followed by a return to 100% A in 5 min and an equilibration for 20 min with 100% A before the next injection, leading to a total runtime of 70 min. The flow rate of the mobile phase was 200 µl/min. The distinct glycerophospholipid classes were eluted successively as a function of the polar head group. Mass spectrometric analysis was performed on a 6460 triple quadrupole mass spectrometer (Agilent) equipped with a Jet stream electrospray ion source under following settings: drying gas heater at 260°C, drying gas flow at 13 L.min-1, sheath gas heater at 300°C, sheath gas flow at 11 L.min-1, nebulizer pressure at 25 psi, capillary voltage at ±5,000 V and nozzle voltage at ±1,000 V. Nitrogen was used as collision gas. The quadrupoles Q1 and Q3 were operated at widest and unit resolution respectively. PC and DGTA analyses were carried out in positive ion mode by scanning for precursors of m/z 184 and 236 respectively at a collision energy (CE) of 34 and 52 eV. SQDG analysis was carried out in negative ion mode by scanning for precursors of m/z -225 at a CE of -56eV. Phosphatidylethanolamine (PE), phosphatidylinositol (PI), phosphatidylglycerol (PG), MGDG, and DGDG measurements were performed in positive ion mode by scanning for neutral losses of 141, 277, 189, 179, and 341 Da at CEs of 20, 12, 16, 8, and 8 eV, respectively. DAG and TAG species were identified and quantified by multiple reaction monitoring (MRM) as singly charged ions [M+NH4]+ at a CE of 16 and 22 eV respectively. Quantification was done for each lipid species by multiple reaction monitoring (MRM) with 50 ms dwell time with the various transitions previously recorded (Abida et al., 2015). Mass spectra were processed using the MassHunter Workstation software (Agilent) for identification and quantification of lipids. Lipid amounts (pmol) were corrected for response differences between internal standards and endogenous lipids and by comparison with a qualified control (QC). QC extract correspond to a known P. tricornutum lipid extract qualified and quantified by thin-layer chromatography and gas-chromatography coupled to ion flame detection as described previously (Abida et al., 2015).
For NMR analyses of P. tricornutum LDs, three independent biological replicates were subjected to a 7-day nitrogen depletion. From day 3 to day 7, 100-ml cell culture samples were centrifuged at a maximum speed of 3,500×g and obtained pellets of about 200 µl were transferred gently into 5 mm Shigemi NMR tubes. The high cell concentration ensures the immobility of cells during NMR experiments. All PFG-NMR analyses were performed at 4°C with a Bruker AVANCE spectrometer operating at 500.18 MHz for 1H, and equipped with a 5 mm BBI-xyz-gradient probe. Measurements of average LD size were performed by PFG-NMR method as described previously (Gromova et al., 2015). The 1H diffusion filtered spectra were recorded using the standard stimulated echo pulse sequence with bipolar gradient (Wu et al., 1995). The diffusion coefficients of observed species were determined according to the Stejskal−Tanner equation:
Applied to LD size measurement, I and I0 were the integrals of TAG NMR signals with and without applied gradient, respectively. The parameter γ is the 1H gyromagnetic ratio. The main parameters of the experiment are on the one hand the strength (g) and the duration (δ) of field gradient pulses and on the other hand the diffusion delay Δ during which the molecular diffusion is observed. The delay τ is a short time interval between the two pulses in the bipolar gradient modules of the sequence. The parameters of NMR experiments were chosen in order to ensure the conditions of confined diffusion of TAG and the disappearance of water and cytoplasmic metabolites signals due to their higher diffusivity. The amplitude of the trapezoidal gradient pulses (g) was varied from 30 to 98% of the maximum amplitude of 0.48 T.m-1, the rise time and fall time of gradient pulses were equal to 10% of the total pulse duration. The experiments were carried out with δ = 5 ms, τ = 0.2 ms and Δ varying from 150 to 450 ms. At those values of Δ the conditions for confined diffusion of TAG were reached; consequently, the measurement of diffusion coefficient of TAG molecules (Dmeas) allowed to determine the mean radius of cell regions or territories in which TAG were confined (Tanner and Stejskal, 1968). For a given distribution of LD sizes, the measured radius rather represent the mean radius of volume-weighted distribution of spherical LD (Guillermo and Bardet, 2007). In this work, typically, 8 or 16 acquisition scans were performed for each of the 10 gradient values used to measure the echo attenuation and calculate Dmeas. For each algae sample, the Dmeas were determined for 5 to 7 different values of The amplitude of the PFG-NMR signal was measured by integrating a part of TAG (-CH2-)n protons signal between 1.4 and 1.1 ppm. The observed NMR signals of TAG in algae are widely broadened due to the heterogeneity of the sample. Nevertheless, this peak broadening does not prevent the measurement of TAG signal attenuation, since the TAG signal represent almost the only detected signal in algae diffusion filtered spectra recorded with appropriate choice of parameters (Supplemental Figures S3 and S4).
All datasets generated for this study are included in the article/Supplementary Material.
AJ and JL performed most of the experiments and contributed equally to this work. JS provided expertise in the analysis of mutant lines. JJ provided specific expertise in glycerolipid analyses. OB provided expertise in mathematical modelling and statistics. MG and EM conceived the project. All the authors contributed to the writing of the article.
This work was supported by a DRF Impulsion program from CEA (RMN-Biocar), a Flagship program from the CEA High Commissioner and the French National Research Agency (Oceanomics ANR-11-BTBR-0008, GlycoAlps ANR-15-IDEX-02, GRAL Labex ANR-10-LABEX-04, and EUR CBS ANR-17-EURE-0003).
The authors declare that the research was conducted in the absence of any commercial or financial relationships that could be construed as a potential conflict of interest.
The Supplementary Material for this article can be found online at: https://www.frontiersin.org/articles/10.3389/fpls.2020.00048/full#supplementary-material
Abida, H., Dolch, L. J., Mei, C., Villanova, V., Conte, M., Block, M. A., et al. (2015). Membrane glycerolipid remodeling triggered by nitrogen and phosphorus starvation in Phaeodactylum tricornutum. Plant Physiol. 167, 118–136. doi: 10.1104/pp.114.252395
Alboresi, A., Perin, G., Vitulo, N., Diretto, G., Block, M. A., Jouhet, J., et al. (2016). Light remodels lipid biosynthesis in nannochloropsis gaditana by modulating carbon partitioning between organelles. Plant Physiol. 171, 2468–2482. doi: 10.1104/pp.16.00599
Allorent, G., Courtois, F., Chevalier, F., Lerbs-Mache, S. (2013). Plastid gene expression during chloroplast differentiation and dedifferentiation into non-photosynthetic plastids during seed formation. Plant Mol. Biol. 82, 59–70. doi: 10.1007/s11103-013-0037-0
Armbrust, E. V., Berges, J. A., Bowler, C., Green, B. R., Martinez, D., Putnam, N. H., et al. (2004). The genome of the diatom Thalassiosira pseudonana: ecology, evolution, and metabolism. Science 306, 79–86. doi: 10.1126/science.1101156
Ayme, L., Baud, S., Dubreucq, B., Joffre, F., Chardot, T. (2014). Function and localization of the Arabidopsis thaliana diacylglycerol acyltransferase DGAT2 expressed in yeast. PloS One 9, e92237. doi: 10.1371/journal.pone.0092237
Boudiere, L., Botte, C. Y., Saidani, N., Lajoie, M., Marion, J., Brehelin, L., et al. (2012). Galvestine-1, a novel chemical probe for the study of the glycerolipid homeostasis system in plant cells. Mol. Biosyst. 8, 2023–2035. doi: 10.1039/c2mb25067e
Boudiere, L., Michaud, M., Petroutsos, D., Rebeille, F., Falconet, D., Bastien, O., et al. (2014). Glycerolipids in photosynthesis: composition, synthesis and trafficking. Biochim. Biophys. Acta 1837, 470–480. doi: 10.1016/j.bbabio.2013.09.007
Bouvier-Nave, P., Benveniste, P., Oelkers, P., Sturley, S. L., Schaller, H. (2000). Expression in yeast and tobacco of plant cDNAs encoding acyl CoA:diacylglycerol acyltransferase. Eur. J. Biochem. 267, 85–96. doi: 10.1046/j.1432-1327.2000.00961.x
Bowler, C., Allen, A. E., Badger, J. H., Grimwood, J., Jabbari, K., Kuo, A., et al. (2008). The Phaeodactylum genome reveals the evolutionary history of diatom genomes. Nature 456, 239–244. doi: 10.1038/nature07410
Burch, A. R., Franz, A. K. (2016). Combined nitrogen limitation and hydrogen peroxide treatment enhances neutral lipid accumulation in the marine diatom Phaeodactylum tricornutum. Biores. Technol. 219, 559–565. doi: 10.1016/j.biortech.2016.08.010
Buseman, C. M., Tamura, P., Sparks, A. A., Baughman, E. J., Maatta, S., Zhao, J., et al. (2006). Wounding stimulates the accumulation of glycerolipids containing oxophytodienoic acid and dinor-oxophytodienoic acid in Arabidopsis leaves. Plant Physiol. 142, 28–39. doi: 10.1104/pp.106.082115
Butler, W. L., Kitajima, M. (1975). Fluorescence quenching in photosystem II of chloroplasts. Biochim. Biophys. Acta 376, 116–125. doi: 10.1016/0005-2728(75)90210-8
Cavalier-Smith, T. (2018). Kingdom Chromista and its eight phyla: a new synthesis emphasising periplastid protein targeting, cytoskeletal and periplastid evolution, and ancient divergences. Protoplasma 255, 297–357. doi: 10.1007/s00709-017-1147-3
Collins, J. R., Edwards, B. R., Fredricks, H. F. (2016). LOBSTAHS: an adduct-based lipidomics strategy for discovery and identification of oxidative stress biomarkers. Anal. Chem. 88, 7154–7162. doi: 10.1021/acs.analchem.6b01260
Conte, M., Lupette, J., Seddiki, K., Mei, C., Dolch, L. J., Gros, V., et al. (2018). Screening for biologically annotated drugs that trigger triacylglycerol accumulation in the diatom Phaeodactylum. Plant Physiol. 177, 532–552. doi: 10.1104/pp.17.01804
Cooksey, K. E., Guckert, J. B., Williams, S. A., Callis, P. R. (1987). Fluorometric determination of the neutral lipid content of microalgal cells using Nile Red. J. Microbiol. Methods 6, 333–345. doi: 10.1016/0167-7012(87)90019-4
De Tommasi, E., Gielis, J., Rogato, A. (2017). Diatom Frustule Morphogenesis and function: a multidisciplinary survey. Mar Genomics 35, 1–18. doi: 10.1016/j.margen.2017.07.001
Deme, B., Cataye, C., Block, M. A., Marechal, E., Jouhet, J. (2014). Contribution of galactoglycerolipids to the 3-dimensional architecture of thylakoids. FASEB J. 28, 3373–3383. doi: 10.1096/fj.13-247395
Dolch, L. J., Lupette, J., Tourcier, G., Bedhomme, M., Collin, S., Magneschi, L., et al. (2017). Nitric oxide mediates nitrite-sensing and acclimation and triggers a remodeling of lipids. Plant Physiol. 175, 1407–1423. doi: 10.1104/pp.17.01042
Falciatore, A., Alcalà, M. R., Croot, P., Bowler, C. (2000). Perception of environmental signals by a marine diatom. Science 288, 2363. doi: 10.1126/science.288.5475.2363
Field, C. B., Behrenfeld, M. J., Randerson, J. T., Falkowski, P. (1998). Primary production of the biosphere: integrating terrestrial and oceanic components. Science 281, 237–240. doi: 10.1126/science.281.5374.237
Flori, S., Jouneau, P. H., Finazzi, G., Marechal, E., Falconet, D. (2016). Ultrastructure of the Periplastidial Compartment of the Diatom Phaeodactylum tricornutum. Protist 167, 254–267. doi: 10.1016/j.protis.2016.04.001
Flori, S., Jouneau, P. H., Gallet, B., Estrozi, L. F., Moriscot, C., Schoehn, G., et al. (2018). Imaging Plastids in 2D and 3D: confocal and electron microscopy. Methods Mol. Biol. 1829, 113–122. doi: 10.1007/978-1-4939-8654-5_7
Folch, J., Lees, M., Sloane Stanley, G. H. (1957). A simple method for the isolation and purification of total lipides from animal tissues. J. Biol. Chem. 226, 497–509.
Fussy, Z., Obornik, M. (2018). Complex endosymbioses I: from primary to complex plastids, multiple independent events. Methods Mol. Biol. 1829, 17–35. doi: 10.1007/978-1-4939-8654-5_2
Gao, G., Chen, F. J., Zhou, L., Su, L., Xu, D., Xu, L., et al. (2017). Control of lipid droplet fusion and growth by CIDE family proteins. Biochim. Biophys. Acta Mol. Cell Biol. Lipids 1862, 1197–1204. doi: 10.1016/j.bbalip.2017.06.009
Genty, B., Harbinson, J., Briantais, J. M., Baker, N. R. (1990). The relationship between non-photochemical quenching of chlorophyll fluorescence and the rate of photosystem 2 photochemistry in leaves. Photosynth Res. 25, 249–257. doi: 10.1007/BF00033166
Gromova, M., Guillermo, A., Bayle, P. A., Bardet, M. (2015). In vivo measurement of the size of oil bodies in plant seeds using a simple and robust pulsed field gradient NMR method. Eur. Biophys. J. Biophys. Lett. 44, 121–129. doi: 10.1007/s00249-015-1007-z
Guillermo, A., Bardet, M. (2007). In situ pulsed-field gradient NMR determination of the size of oil bodies in vegetable seeds. Analysis of the effect of the gradient pulse length. Anal. Chem. 79, 6718–6726. doi: 10.1021/ac070416w
Hill, A. V. (1910). The possible effects of the aggregation of the molecules of haemoglobin on its dissociation curves. J. Physiol. 40, IV–VII.
Jacquier, N., Choudhary, V., Mari, M., Toulmay, A., Reggiori, F., Schneiter, R. (2011). Lipid droplets are functionally connected to the endoplasmic reticulum in Saccharomyces cerevisiae. J. Cell Sci. 124, 2424–2437. doi: 10.1242/jcs.076836
Janouskovec, J., Horak, A., Obornik, M., Lukes, J., Keeling, P. J. (2010). A common red algal origin of the apicomplexan, dinoflagellate, and heterokont plastids. Proc. Natl. Acad. Sci. U. S. A 107, 10949–10954. doi: 10.1073/pnas.1003335107
Johnson, X., Vandystadt, G., Bujaldon, S., Wollman, F. A., Dubois, R., Roussel, P., et al. (2009). A new setup for in vivo fluorescence imaging of photosynthetic activity. Photosynth Res. 102, 85–93. doi: 10.1007/s11120-009-9487-2
Jouhet, J., Marechal, E., Bligny, R., Joyard, J., Block, M. A. (2003). Transient increase of phosphatidylcholine in plant cells in response to phosphate deprivation. FEBS Lett. 544, 63–68. doi: 10.1016/S0014-5793(03)00477-0
Jouhet, J., Lupette, J., Clerc, O., Magneschi, L., Bedhomme, M., Collin, S., et al. (2017). LC-MS/MS versus TLC plus GC methods: consistency of glycerolipid and fatty acid profiles in microalgae and higher plant cells and effect of a nitrogen starvation. PloS One 12, e0182423. doi: 10.1371/journal.pone.0182423
Kim, J., Brown, C. M., Kim, M. K., Burrows, E. H., Bach, S., Lun, D. S., et al. (2017). Effect of cell cycle arrest on intermediate metabolism in the marine diatom Phaeodactylum tricornutum. Proc. Natl. Acad. Sci. U. S. A 114, E8007–E8016. doi: 10.1073/pnas.1711642114
Kuerschner, L., Moessinger, C., Thiele, C. (2008). Imaging of lipid biosynthesis: how a neutral lipid enters lipid droplets. Traffic 9, 338–352. doi: 10.1111/j.1600-0854.2007.00689.x
Le Costaouec, T., Unamunzaga, C., Mantecon, L., Helbert, W. (2017). New structural insights into the cell-wall polysaccharide of the diatom Phaeodactylum tricornutum. Algal. Research-Biomass Biofuels Bioproducts 26, 172–179. doi: 10.1016/j.algal.2017.07.021
Levitan, O., Dinamarca, J., Hochman, G., Falkowski, P. G. (2014). Diatoms: a fossil fuel of the future. Trends Biotechnol. 32, 117–124. doi: 10.1016/j.tibtech.2014.01.004
Lewin, J. C. (1958). The taxonomic position of Phaeodactylum tricornutum. J. Gen. Microbiol. 18, 427–432. doi: 10.1099/00221287-18-2-427
Li, X. L., Pan, Y. F., Hu, H. H. (2018). Identification of the triacylglycerol lipase in the chloroplast envelope of the diatom Phaeodactylum tricornutum. Algal. Research-Biomass Biofuels Bioproducts 33, 440–447. doi: 10.1016/j.algal.2018.06.023
Li-Beisson, Y., Thelen, J. J., Fedosejevs, E., Harwood, J. L. (2019). The lipid biochemistry of eukaryotic algae. Prog. Lipid Res. 74, 31–68. doi: 10.1016/j.plipres.2019.01.003
Lu, Y., Wang, X., Balamurugan, S., Yang, W. D., Liu, J. S., Dong, H. P., et al. (2017). Identification of a putative seipin ortholog involved in lipid accumulation in marine microalga Phaeodactylum tricornutum. J. Appl. Phycol. 29, 2821–2829. doi: 10.1007/s10811-017-1173-8
Lupette, J., Maréchal, E. (2018). “Phytoplankton glycerolipids, challenging but promising prospects from biomedicine to green chemistry and biofuels,” in Blue Technologies: production and use of marine molecules. Eds. La Barre, S., Bates, S. S. (Weinheim, Germany: Wiley VCH), 191–215. doi: 10.1002/9783527801718.ch6
Lupette, J., Jaussaud, A., Vigor, C., Oger, C., Galano, J. M., Reversat, G., et al. (2018). Non-Enzymatic Synthesis of Bioactive Isoprostanoids in the Diatom Phaeodactylum following Oxidative Stress. Plant Physiol. 178, 1344–1357. doi: 10.1104/pp.18.00925
Lupette, J., Jaussaud, A., Seddiki, K., Morabito, C., Brugiere, S., Schaller, H., et al. (2019). The architecture of lipid droplets in the diatom Phaeodactylum tricornutum. Algal. Research-Biomass Biofuels Bioproducts 38, 101415. doi: 10.1016/j.algal.2019.101415
Lv, X., Liu, J., Qin, Y., Liu, Y., Jin, M., Dai, J., et al. (2019). Identification of gene products that control lipid droplet size in yeast using a high-throughput quantitative image analysis. Biochim. Biophys. Acta Mol. Cell Biol. Lipids 1864, 113–127. doi: 10.1016/j.bbalip.2018.11.001
Mann, D. G. (1999). The species concept in diatoms. Phycologia 38, 437–495. doi: 10.2216/i0031-8884-38-6-437.1
Misra, A. N., Misra, M., Singh, R. (2012). “Chlorophyll fluorescence in plant biology,” in Biophysics. Ed. Misra, A. N. (Rijeka, Croatia, InTech). 171–172. doi: 10.5772/35111
Muller, P., Li, X. P., Niyogi, K. K. (2001). Non-photochemical quenching. A response to excess light energy. Plant Physiol. 125, 1558–1566. doi: 10.1104/pp.125.4.1558
Nguyen, H. M., Baudet, M., Cuine, S., Adriano, J. M., Barthe, D., Billon, E., et al. (2011). Proteomic profiling of oil bodies isolated from the unicellular green microalga Chlamydomonas reinhardtii: with focus on proteins involved in lipid metabolism. Proteomics 11, 4266–4273. doi: 10.1002/pmic.201100114
Olzmann, J. A., Carvalho, P. (2019). Dynamics and functions of lipid droplets. Nat. Rev. Mol. Cell Biol. 20, 137–155. doi: 10.1038/s41580-018-0085-z
Petroutsos, D., Amiar, S., Abida, H., Dolch, L. J., Bastien, O., Rebeille, F., et al. (2014). Evolution of galactoglycerolipid biosynthetic pathways–from cyanobacteria to primary plastids and from primary to secondary plastids. Prog. Lipid Res. 54, 68–85. doi: 10.1016/j.plipres.2014.02.001
Pol, A., Gross, S. P., Parton, R. G. (2014). Review: biogenesis of the multifunctional lipid droplet: lipids, proteins, and sites. J. Cell Biol. 204, 635–646. doi: 10.1083/jcb.201311051
Popko, J., Herrfurth, C., Feussner, K., Ischebeck, T., Iven, T., Haslam, R., et al. (2016). Metabolome analysis reveals betaine lipids as major source for triglyceride formation, and the accumulation of sedoheptulose during nitrogen-starvation of phaeodactylum tricornutum. PloS One 11, e0164673. doi: 10.1371/journal.pone.0164673
Schuldiner, M., Bohnert, M. (2017). A different kind of love - lipid droplet contact sites. Biochim. Biophys. Acta Mol. Cell Biol. Lipids 1862, 1188–1196. doi: 10.1016/j.bbalip.2017.06.005
Simionato, D., Block, M. A., La Rocca, N., Jouhet, J., Marechal, E., Finazzi, G., et al. (2013). The response of Nannochloropsis gaditana to nitrogen starvation includes de novo biosynthesis of triacylglycerols, a decrease of chloroplast galactolipids, and reorganization of the photosynthetic apparatus. Eukaryot Cell 12, 665–676. doi: 10.1128/EC.00363-12
Stone, S. J., Levin, M. C., Zhou, P., Han, J., Walther, T. C., Farese, R. V., Jr. (2009). The endoplasmic reticulum enzyme DGAT2 is found in mitochondria-associated membranes and has a mitochondrial targeting signal that promotes its association with mitochondria. J. Biol. Chem. 284, 5352–5361. doi: 10.1074/jbc.M805768200
Taeger, D., Kuhnt, S. (2014). Statistical hypothesis testing with SAS and R. (Chichester, West Sussex: Wiley). doi: 10.1002/9781118762585
Tanner, J. E., Stejskal, E. O. (1968). Restricted Self-Diffusion of Protons in Colloidal Systems by Pulsed-Gradient Spin-Echo Method. J. Chem. Phys. 49, 1768–176+. doi: 10.1063/1.1670306
Thiam, A. R., Antonny, B., Wang, J., Delacotte, J., Wilfling, F., Walther, T. C., et al. (2013). COPI buds 60-nm lipid droplets from reconstituted water-phospholipid-triacylglyceride interfaces, suggesting a tension clamp function. Proc. Natl. Acad. Sci. U. S. A 110, 13244–13249. doi: 10.1073/pnas.1307685110
Walther, T. C., Chung, J., Farese, R. V., Jr. (2017). Lipid Droplet Biogenesis. Annu. Rev. Cell Dev. Biol. 33, 491–510. doi: 10.1146/annurev-cellbio-100616-060608
Wase, N., Tu, B., Allen, J. W., Black, P., Dirusso, C. (2017). Identification and metabolite profiling of chemical activators of lipid accumulation in green algae. Plant Physiol. 174, 2146–2165. doi: 10.1104/pp.17.00433
Wase, N., Black, P., Dirusso, C. (2018). Innovations in improving lipid production: Algal chemical genetics. Prog. Lipid Res. 71, 101–123. doi: 10.1016/j.plipres.2018.07.001
Wilfling, F., Wang, H., Haas, J. T., Krahmer, N., Gould, T. J., Uchida, A., et al. (2013). Triacylglycerol synthesis enzymes mediate lipid droplet growth by relocalizing from the ER to lipid droplets. Dev. Cell 24, 384–399. doi: 10.1016/j.devcel.2013.01.013
Wilfling, F., Thiam, A. R., Olarte, M. J., Wang, J., Beck, R., Gould, T. J., et al. (2014). Arf1/COPI machinery acts directly on lipid droplets and enables their connection to the ER for protein targeting. Elife 3, e01607. doi: 10.7554/eLife.01607
Wu, D. H., Chen, A. D., Johnson, C. S. (1995). An Improved Diffusion-Ordered Spectroscopy Experiment Incorporating Bipolar-Gradient Pulses. J. Magnetic Resonance Ser. A 115, 260–264. doi: 10.1006/jmra.1995.1176
Yao, S., Brandt, A., Egsgaard, H., Gjermansen, C. (2012). Neutral lipid accumulation at elevated temperature in conditional mutants of two microalgae species. Plant Physiol. Biochem. 61, 71–79. doi: 10.1016/j.plaphy.2012.09.007
Keywords: diatoms, Phaeodactylum, Triacylglycerol, lipid droplet, lipids
Citation: Jaussaud A, Lupette J, Salvaing J, Jouhet J, Bastien O, Gromova M and Maréchal E (2020) Stepwise Biogenesis of Subpopulations of Lipid Droplets in Nitrogen Starved Phaeodactylum tricornutum Cells. Front. Plant Sci. 11:48. doi: 10.3389/fpls.2020.00048
Received: 22 November 2019; Accepted: 14 January 2020;
Published: 11 February 2020.
Edited by:
Koichiro Awai, Shizuoka University, JapanReviewed by:
Changcheng Xu, Brookhaven National Laboratory (DOE), United StatesCopyright © 2020 Jaussaud, Lupette, Salvaing, Jouhet, Bastien, Gromova and Maréchal. This is an open-access article distributed under the terms of the Creative Commons Attribution License (CC BY). The use, distribution or reproduction in other forums is permitted, provided the original author(s) and the copyright owner(s) are credited and that the original publication in this journal is cited, in accordance with accepted academic practice. No use, distribution or reproduction is permitted which does not comply with these terms.
*Correspondence: Marina Gromova, bWFyaW5hLmdyb21vdmFAY2VhLmZy; Eric Maréchal, ZXJpYy5tYXJlY2hhbEBjZWEuZnI=
†These authors have contributed equally to this work
Disclaimer: All claims expressed in this article are solely those of the authors and do not necessarily represent those of their affiliated organizations, or those of the publisher, the editors and the reviewers. Any product that may be evaluated in this article or claim that may be made by its manufacturer is not guaranteed or endorsed by the publisher.
Research integrity at Frontiers
Learn more about the work of our research integrity team to safeguard the quality of each article we publish.