- 1Nutrient Cycling, Rhizosphere Ecology Laboratory, Department of Crop and Soil Sciences, Washington State University, Pullman, WA, United States
- 2College of Agricultural, Consumer, and Environmental Sciences, Urbana, IL, United States
- 3School of Economic Sciences, Washington State University, Pullman, WA, United States
Improvements in market value of hard red spring wheat (HRS, Triticum aestivum L.) are linked to breeding efforts to increase grain protein concentration (GPC). Numerous studies have been conducted on the identification, isolation of a chromosome region (Gpc-B1) of Wild emmer wheat (Triticum turgidum spp. dicoccoides) and its introgression into commercial hard wheat to GPC. Yet there has been limited research published on the comparative responsiveness of these altered lines and their parents to varied N supply. There is increased awareness that wheat genetic improvements must be assessed over a range of environmental and agronomic management conditions to assess stability. We report herein on economically optimal yield, protein and nitrogen use efficiency (NUE) component responses of two Pacific Northwestern USA cultivars, Tara and Scarlet compared to backcrossed derived near isolines with or without the Gpc-B1 allele. A field experiment with 5 N rates as whole plots and 8 genotypes as subplots was conducted over two years under semi-arid, dryland conditions. One goal was to evaluate the efficacy of the Gpc-B1 allele under a range of low to high N supply. Across all genotypes, grain yield responses to N supply followed the classic Mitscherlich response model, whereas GPC followed inverse quadratic or linear responses. The Gpc-B1 introgression had no major impact on grain protein, but grain N and total above ground crop N yields demonstrated quadratic responses to total N supply. Generally, higher maximum grain yields and steeper rise to the maxima (Mitscherlich c values) were obtained in the first site-year. Tara required less N supply to achieve GPC goals than Scarlet in both site-years. Genotypes with Gpc-B1 produced comparable or slightly lower Mitscherlich A values than unmodified genotypes, but displayed similar Mitscherlich c values. Target GPC goals were not achieved at economic optimal yields based on set wheat pricing. Economic optimization of N inputs to achieve protein goals showed positive revenue from additional N inputs for most genotypes. While N uptake efficiency did not drop below 0.40, N fertilizer-induced increases in grain N harvest correlated well with unused post-harvest soil N that is potentially susceptible to environmental loss.
Introduction
Global wheat (Triticum aestivum L.) production and consumption continues to rise (USDA FAS, 2020) as wheat continues to be a major source of human calories and protein (Mondal et al., 2016). Wheat has been the dominant crop in the inland Pacific Northwest (iPNW) USA since farming began in the late 1800’s (Pan et al., 2017). Grain protein and N use responsiveness to N management in hard red wheats is well recognized (Belete et al., 2018), leading to specific unit N recommendations by wheat class (Koenig, 2005; Brown et al., 2005; Jones and Olson-Rutz, 2012; Franzen, 2018). A tremendous range in grain protein concentration (GPC) can be seen with variable N fertilizer management (Walsh et al., 2018; Beres et al., 2018). This experiment focused on recropped wheat in the transition zone of eastern Washington state, between wheat-fallow and continuous cropping agroecological zones. Recropping hard red spring wheat (HRS) after winter wheat is a strategy for crop intensification for diversifying the system and markets (Pan et al., 2017).
Economically optimal N supply is dictated by the shape of yield-protein and N use efficiency responses to N supply, the relative prices of wheat and N fertilizer, and the market premium:discount prices for GPC of hard red wheat (Baker et al., 2004). In the U.S., hard red wheat grain price premiums and discounts are often assessed at the grain elevator, based on GPC. Bekkerman (2018) used differences between prices for hard red spring wheat futures contracts on the Minneapolis Grain Exchange (MGEX) and hard red winter wheat futures contracts on the Kansas City Board of Trade (KCBT) to study how the market values protein. He found that the long-run average spread is approximately $23.15/Mg. These economic analyses indicate that building grain protein through N fertilization is not always profitable, however, depending on external factors such as the cash price of wheat, availability of high-protein wheat, and the cost of N fertilizer. As a result, improving grain protein to enhance end-use quality has long been a breeding goal in wheat breeding programs.
Improvements in wheat production and quality, and improved water and nutrient use can be achieved through integrated, environmentally-targeted cultivar selection and management efforts (Hatfield and Walthall, 2015). DePauw and Townley-Smith (1988) determined that environment and management typically overshadow genetic effects on GPC. While GPC has long-been recognized as an important grain end-use quality attribute and economic market factor, breeding improvements in wheat grain concentration has progressed slowly (Carter et al., 2012; Tabbita et al., 2017).
Wheat genetic heritability of nitrogen use efficiency (NUE) physiological traits that contribute to high NUE and grain protein (Hawkesford, 2012), particularly for low N environments, has been reviewed by Dawson et al. (2008). For example, genetic variation for wheat N uptake (Johnson et al., 1967) and translocation efficiency (Cox et al., 1986) are well established. In addition, genetic variability for post-anthesis N uptake was early recognized (Clarke et al., 1990). Early wheat breeding efforts connected high grain protein with genetic improvement of nitrate reductase activity, N uptake and translocation of the hard red winter wheat cultivar Lancota (Johnson and Mattern, 1968). Loffler and Busch (1982) correlated grain yield with harvest index and N harvest index of hard red spring wheat varieties, but GPC was negatively correlated with harvest index, and not significantly correlated with N harvest index.
Avivi (1978) identified a gene associated with high GPC in wild emmer wheat (Triticum turgidum spp. dicoccoides). Joppa and Cantrell (1990) substituted chromosomes from the wild emmer wheat into the durum wheat cultivar Langdon, producing high GPC lines. A genomic region was mapped as a QTL in a recombinant inbred line of this cultivar (Joppa et al., 1997) and then mapped as a single Mendelian locus designated as DIC Gpc-B1 (Olmos et al., 2003). Introgression of this region into tetraploid and hexaploid wheat increased GPC (Joppa et al., 1997; Mesfin et al., 2000, Distelfeld et al., 2007).
Tabbita et al. (2017) reviewed 25 studies conducted over 10 years characterizing the allelic variation of Gpc-B1 and its effects on wheat yield and quality. Studies were conducted over a globally diverse range of wheat genetic backgrounds and environments. A few studies linked Gpc-B1 related increases in GPC to accelerated leaf senescence (Uauy et al., 2006; Carter et al., 2012) and more efficient N remobilization from leaves (Kade et al., 2005). Yet, the surveyed papers generally lacked examination of how genotypes with Gpc-B1 respond to a wide range of N supply. Moll et al. (1982) defined a statistical evaluation of genotypic variation of nitrogen use efficiency (NUE) and its mathematical relationship to NUE components: N uptake efficiency (NUPE; crop N/N supply) and N utilization efficiency (NUTE; grain yield/crop N). Their analysis of corn genotypes suggested that variation in N utilization contributed to genetic differences at low N supply, whereas variation in N uptake efficiency was the major source of NUE genetic variation at high N supply. Dawson et al. (2008) suggested the possibility of developing wheat cultivars with high NUE in low N environments, when high remobilization of leaf N into grain will be critical. Therefore, the objectives of this research were to determine whether introgressing Gpc-B1 into two commercial hard red spring wheat cultivars would improve yield, protein and NUE component responsiveness over a wide range of N supply, while reducing economically optimal N requirements.
Materials and Methods
Experimental Conditions
This experiment was conducted over two years near Dusty in 2004 and Endicott Washington, U.S in 2005 under semi-arid, dryland conditions. The soil at Dusty, WA was an Onyx silt loam (coarse-silty mixed mesic Cumulic Haploxerolls) soil type, that received 378 mm of annual precipitation. The soil at Endicott, WA was an Athena silt loam (fine-silty mixed mesic Pachic Haploxerolls) that received 424 mm of precipitation. Genotypes were direct seeded into winter wheat stubble from fields yielding 4,200 and 3,600 kg ha-1 in the first and second site-years, respectively. Fall pre-fertilization soil sampling consisted of triplicate samples taken to 120 cm depths in each replicate block, and 30 cm depth increments were composited by replicate for determination of 1 M KCl exchangeable NH4+-N and NO3–N. Samples were taken with a tractor (John Deere 5425, Moline, IL)-mounted hydraulic probe (Giddings, Windsow, CO). Additional general soil fertility tests were performed on the 0-30 cm samples. Samples were stored at -15.6°C prior to inorganic N determination using flow injection autoanalysis (Quickchem 8000 Series FIA+ system, Lachat Instruments, Loveland, CO). Soil nitrate-N was measured at each depth, and soil ammonium-N was measured in the 0-30 cm samples. Net mineralization was estimated as only 17 kg N ha-1 following winter wheat stubble, and when added to the residual mineral N resulted in estimated soil N supplies of 46 and 39 kg N ha-1 in the first and second site-years, respectively.
Plant Germplasm and DNA Marker Analyses
Recurrent parents included the hard red spring wheat cultivars Scarlet (Kidwell et al., 1999), which was developed for the semi-arid region of Eastern Washington and Tara 2002, herein referred to as Tara (Kidwell et al., 2002), which was released for production in the high rainfall regions of the PNW. The donor parents were hard red spring wheat cultivar Glupro and ND683 from North Dakota (Mesfin et al., 1999; Khan et al., 2000). The high GPC region was incorporated into Scarlet and Tara using DNA markers to select for the presence of the region (Carter et al., 2012). At the time, Scarlet was a high yielding hard red spring wheat cultivar in the production region (Burns, 2002), and Tara was released based on its improved yield potential and superior end-use quality. The goal was to recover lines nearly identical (near isolines) to Scarlet and Tara with the addition of the high GPC segment from Glupro. The HRS wheat cultivar Glupro was used as the donor parent for the DIC Gpc-B1 allele. Isolines included three BC5F5 marker-assisted backcross (MAB)-derived genotypes with the DIC Gpc-B1 allele and three with the recurrent parent allele at the Gpc-B1 locus. The backcross introgression process using DNA marker analysis to assay for the presence of the DIC Gpc-B1 was described by Carter et al. (2012). The eight genotypes evaluated in this study were Tara, 3512-26T, 3586-6G/T, 3512-1G, Scarlet, 1519-16S, 1553-25G, 1584-12G where crosses with Gpc-B1 have the letter G behind the cultivar; T or S indicates a near isoline of Tara or Scarlet and G/T represents the heterogeneous population.
Experimental Design
A split-plot, randomized complete block field experiment with five fertilizer nitrogen (Nf) rates (0, 45, 90, 135, 179 kg N ha-1) as whole plots randomized in four replicate blocks. Eight genotypes were randomized as subplots within each N rate main plot. A basal fall application of 45 kg urea-N ha-1 was topdressed over all N fertilized plots and the remaining urea N fertilizer was applied in spring at planting, 10 cm below the seed. Row spacing was 18.5 cm in plots with 2.1 m x 12.2 m dimensions. Spring wheat lines were planted in late March at a 5 cm depth at a seeding rate of 78 kg ha-1 using a no-till drill (Fabro Ltd., Swift Current, SK, Canada).
Sampling and Data Collection
Two, 1-m rows of plant material were hand-harvested at physiological maturity in early August. Grain was harvested a week later with a small-plot combine (Wintersteiger Inc., Salt Lake, UT, USA), After collection, samples were dried at 65°C, heads were threshed and the grain was dried, weighed, and ground with a Udy mill (Udy Corp., Fort Collins, CO) to <0.5 mm. The stover was ground <2 mm Wiley mill (Thomas Scientific, Swedesboro, NJ) for nitrogen analysis. Plant samples were evaluated for nitrogen, sulfur and carbon with the above ground biomass and grain analyzed separately using a dry combustion analyzer (Leco Corp., St. Joseph, MI, USA). The GPC was calculated as GPC = grain N (g/100g) * 5.7.
Data Analysis
All data were subjected to analysis of variance using PROC MIXED procedure to compare means of the dependent variables in this study (SAS Institute Inc., 2013).
Replicate data of yield response to total N supply in individual site years were best fitted to the Mitscherlich growth factor response model using Sigmaplot (Systat Software, Inc., San Jose, CA). The Mitscherlich yield response to total N supply model (Pan et al., 2016) is defined as:
Where: Y = Gw, grain yield; X = Ns, N supply; A = maximum yield; c = efficiency constant.
Grain protein concentration (GPC), grain N yield, and above-ground crop N responses to N supply were all best-fitted with quadratic equations:
Total N supply estimated as described below (Huggins and Pan, 1993):
The regression analyses for the Mitscherlich-modeled yield and the quadratic-modeled crop N responses included virtual observations of zero yield and zero crop N at zero N supply, added for each genotype x N supply block replicate.
N use efficiency, grain N harvest efficiency and their components were defined (Moll et al., 1982) using grain weight (Gw), above-ground crop N uptake (Nt), and grain N (Ng) as the following ratios:
N use efficiency (NUE) = Gw/Ns
N uptake efficiency (NUPE) = Nt/Ns
N utilization efficiency (NUTE) = Gw/Nt
Nitrogen harvest index (NHI) = Ng/Nt
Nitrogen harvest efficiency (NHE) = Ng/Ns
where:
These use efficiencies and components were statistically analyzed for main effects of genotype, N rate, year, and genotype × N rate.
Economic Optimization of N Inputs
Mitscherlich equations (Eq. 1) identified c and A values for each genotype’s response to N supply in each year. These response models were then used with a fixed N and grain prices to obtain initial estimates of economically optimal N rates (EONR), supply (EONS), yield (EOY) and the corresponding unit N requirement (UNR) according to Fiez et al. (1995) as
with no initial consideration of market valuation of protein. Economic optimal nitrogen rates (EONR) and total nitrogen supplies (EONS) required to achieve economic optimal grain yields (EOY) were determined by plotting a constant value (i.e. current market prices) of fertilizer N inputs (X$) at US $1.03 (kg Nf) –1 vs. wheat grain (Y$) at $0.23 (kg grain) –1 where dY$/dX$ = 0.23/1.03. This current market price was set as the base grain price for wheat at 140 g protein kg-1, which is a typical target GPC for U.S. hard red spring wheat. Net revenue is defined here as revenue over Ns cost at the optimum. Price discounts for low protein wheat were then applied to determine the adjusted economic value of grain produced at the initial EONS. Since none of the genotypes achieved this target GPC at EONS the grain prices were then adjusted with discounts, $0.009 kg-1 subtracted from the base price for each 2.5 g protein kg-1 below 140 g protein kg-1. The net revenue was then determined from the amount of additional N fertilizer required above the EONS to achieve the market target of 140 g protein kg-1. Premiums ($0.009 kg-1) were also added to the base wheat price (reported at 140 g protein kg-1) for each 2.5 g above 140 g kg-1 protein achieved when N supply was increased above that required to achieve 140 g protein kg-1.
Net revenue to farmers, assuming fertilizer N rate was the only varying management variable, was calculated as
Results
Grain Yield, Grain N Yield, Crop N, and GPC Responses
Increased N supply significantly increased grain yield with a diminishing slope best represented by the Mitcherlich model, and it also increased GPC by inverse quadratic functions in both site-years (Figures 1 and 2; Tables 1 and S1). The Mitscherlich efficiency coefficient “c”, which describes the steepness of the approach to maximum “A” did not statistically vary among genotypes or by site-year (Table 1). Supplying fertilizer N up to an additional 179 kg N ha-1 enabled us to establish maximum grain yields not limited by N supply in both site-years, whereas excess N continued to increase GPC past the point of maximum yield. Modeled grain yield plateaus (A values) in the first site-year ranged from 2651to 2889 kg ha-1, whereas yield plateaus in the second-site year were significantly lower based on pair-wise t tests, ranging from 2310 to 2497 kg ha-1 (Figures 1 and 2; Table 1). Supplying the lowest N rate input, 45 kg N ha-1, increased yield compared to the no N fertilizer control, while only maintaining or decreasing GPC (Figures 1 and 2). The increase in GPC was steeper once optimal grain yield was achieved, as GPC levels of 16 to 17 g (100 g)-1 were reached at the highest N supply (Figures 1 and 2).
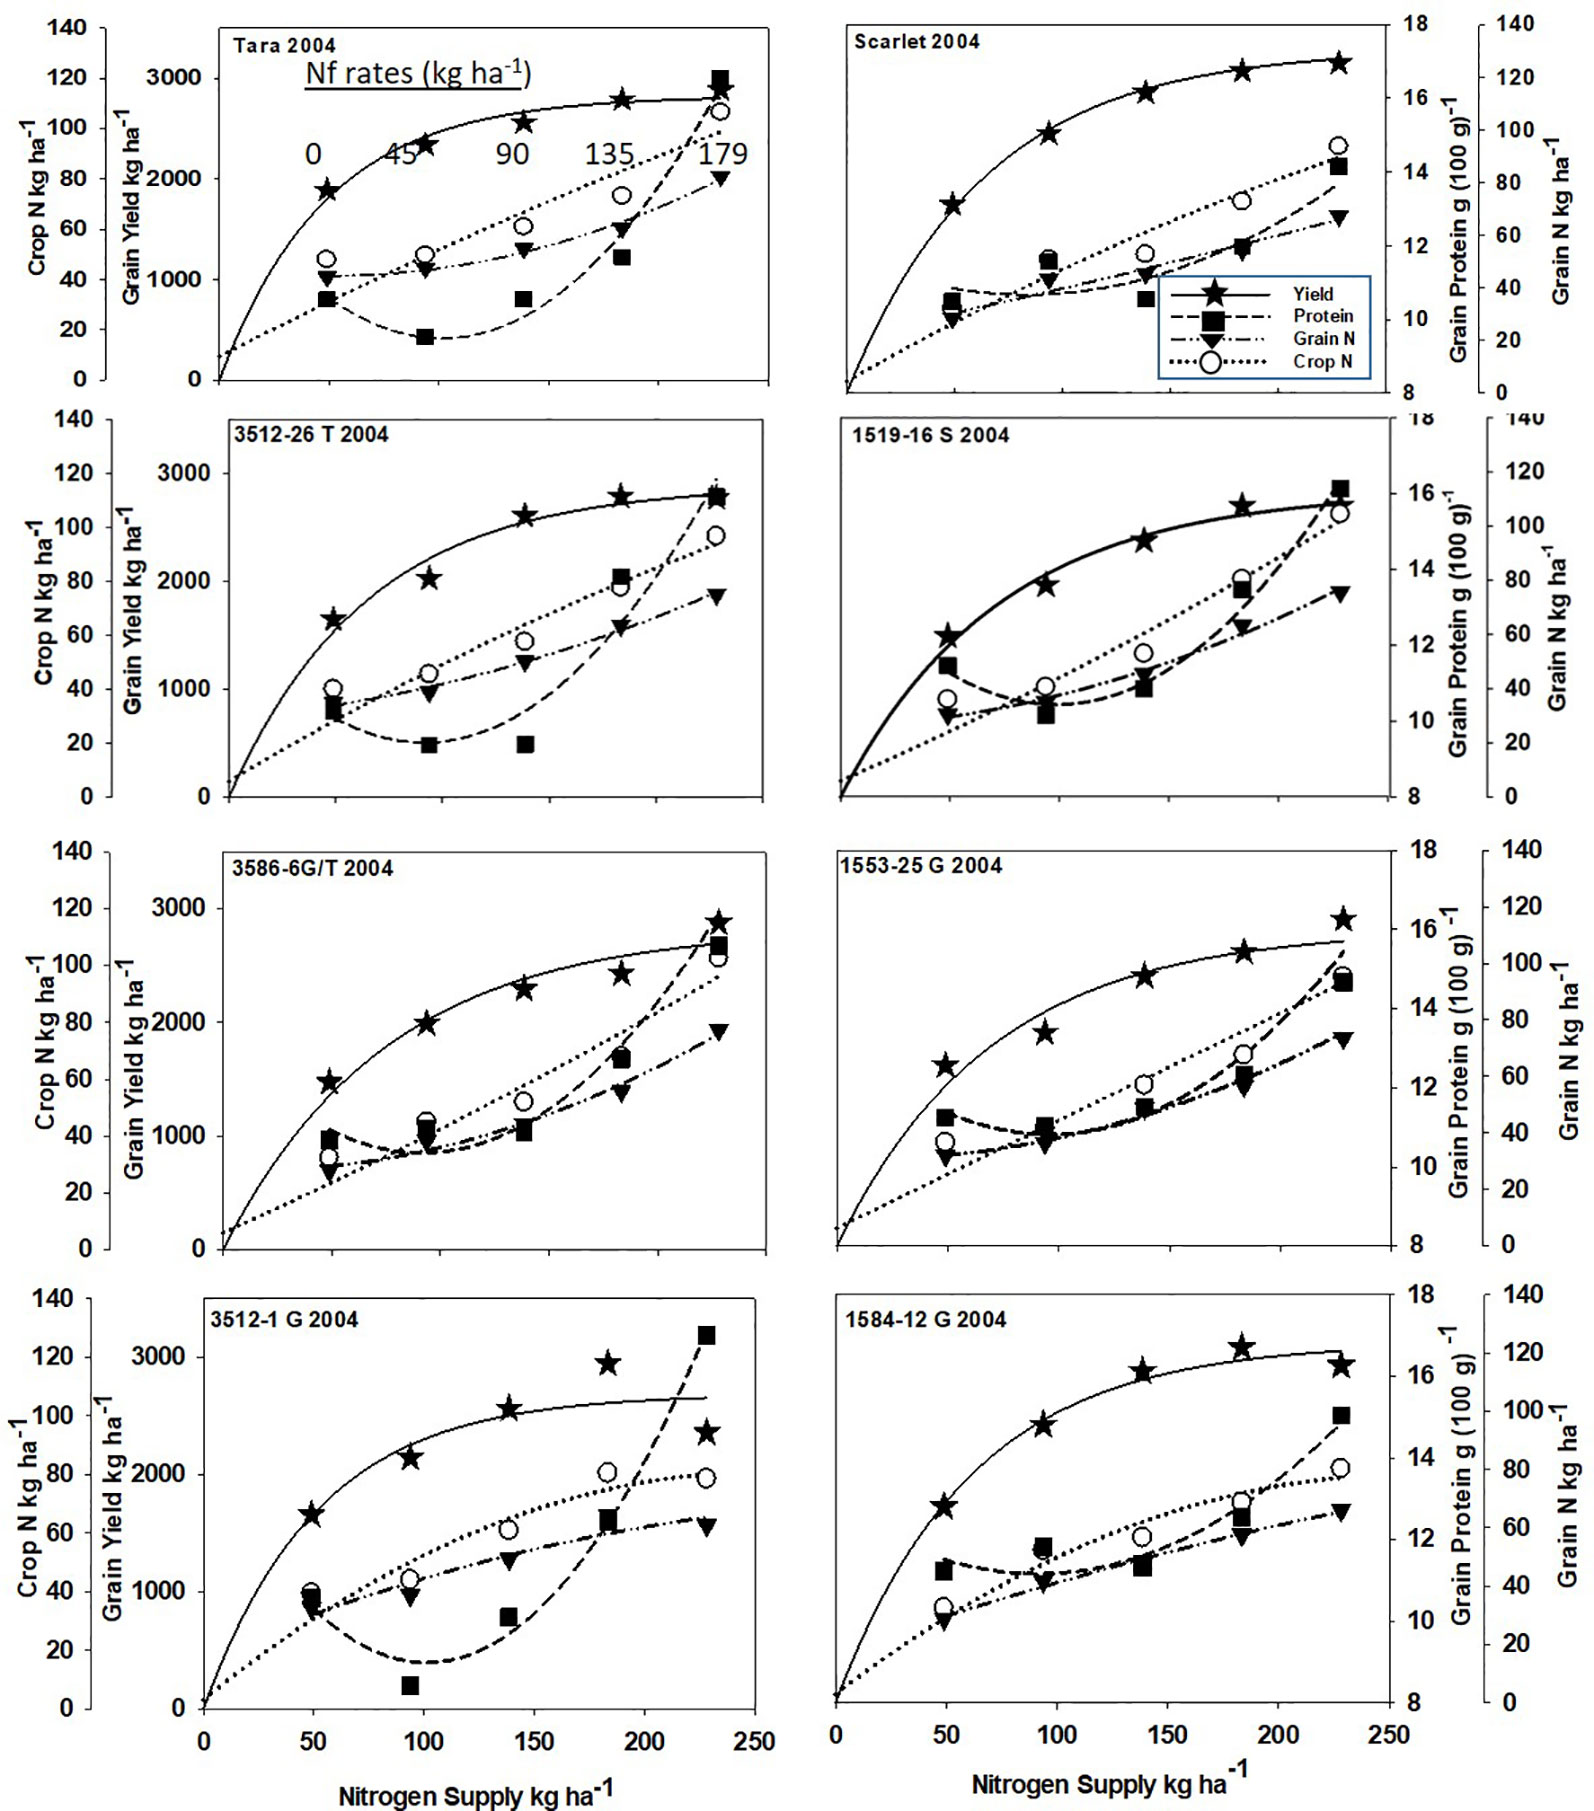
Figure 1 Grain yield, grain N concentration, grain N yield, and crop N responses to increasing N supply at Dusty WA in 2004 of HRS cultivar Tara and its derivatives 3512-26T, 3586-6G/T, 3512-1G; HRS cultivar Scarlet and its derivatives 1519-16S, 519-16S, 1553-26G and 1584-12G. Symbols represent means of 4 N rate replicates. Regression coefficients of responses modeled on entire datasets of each dependent variable are presented in Tables 1 and S1.
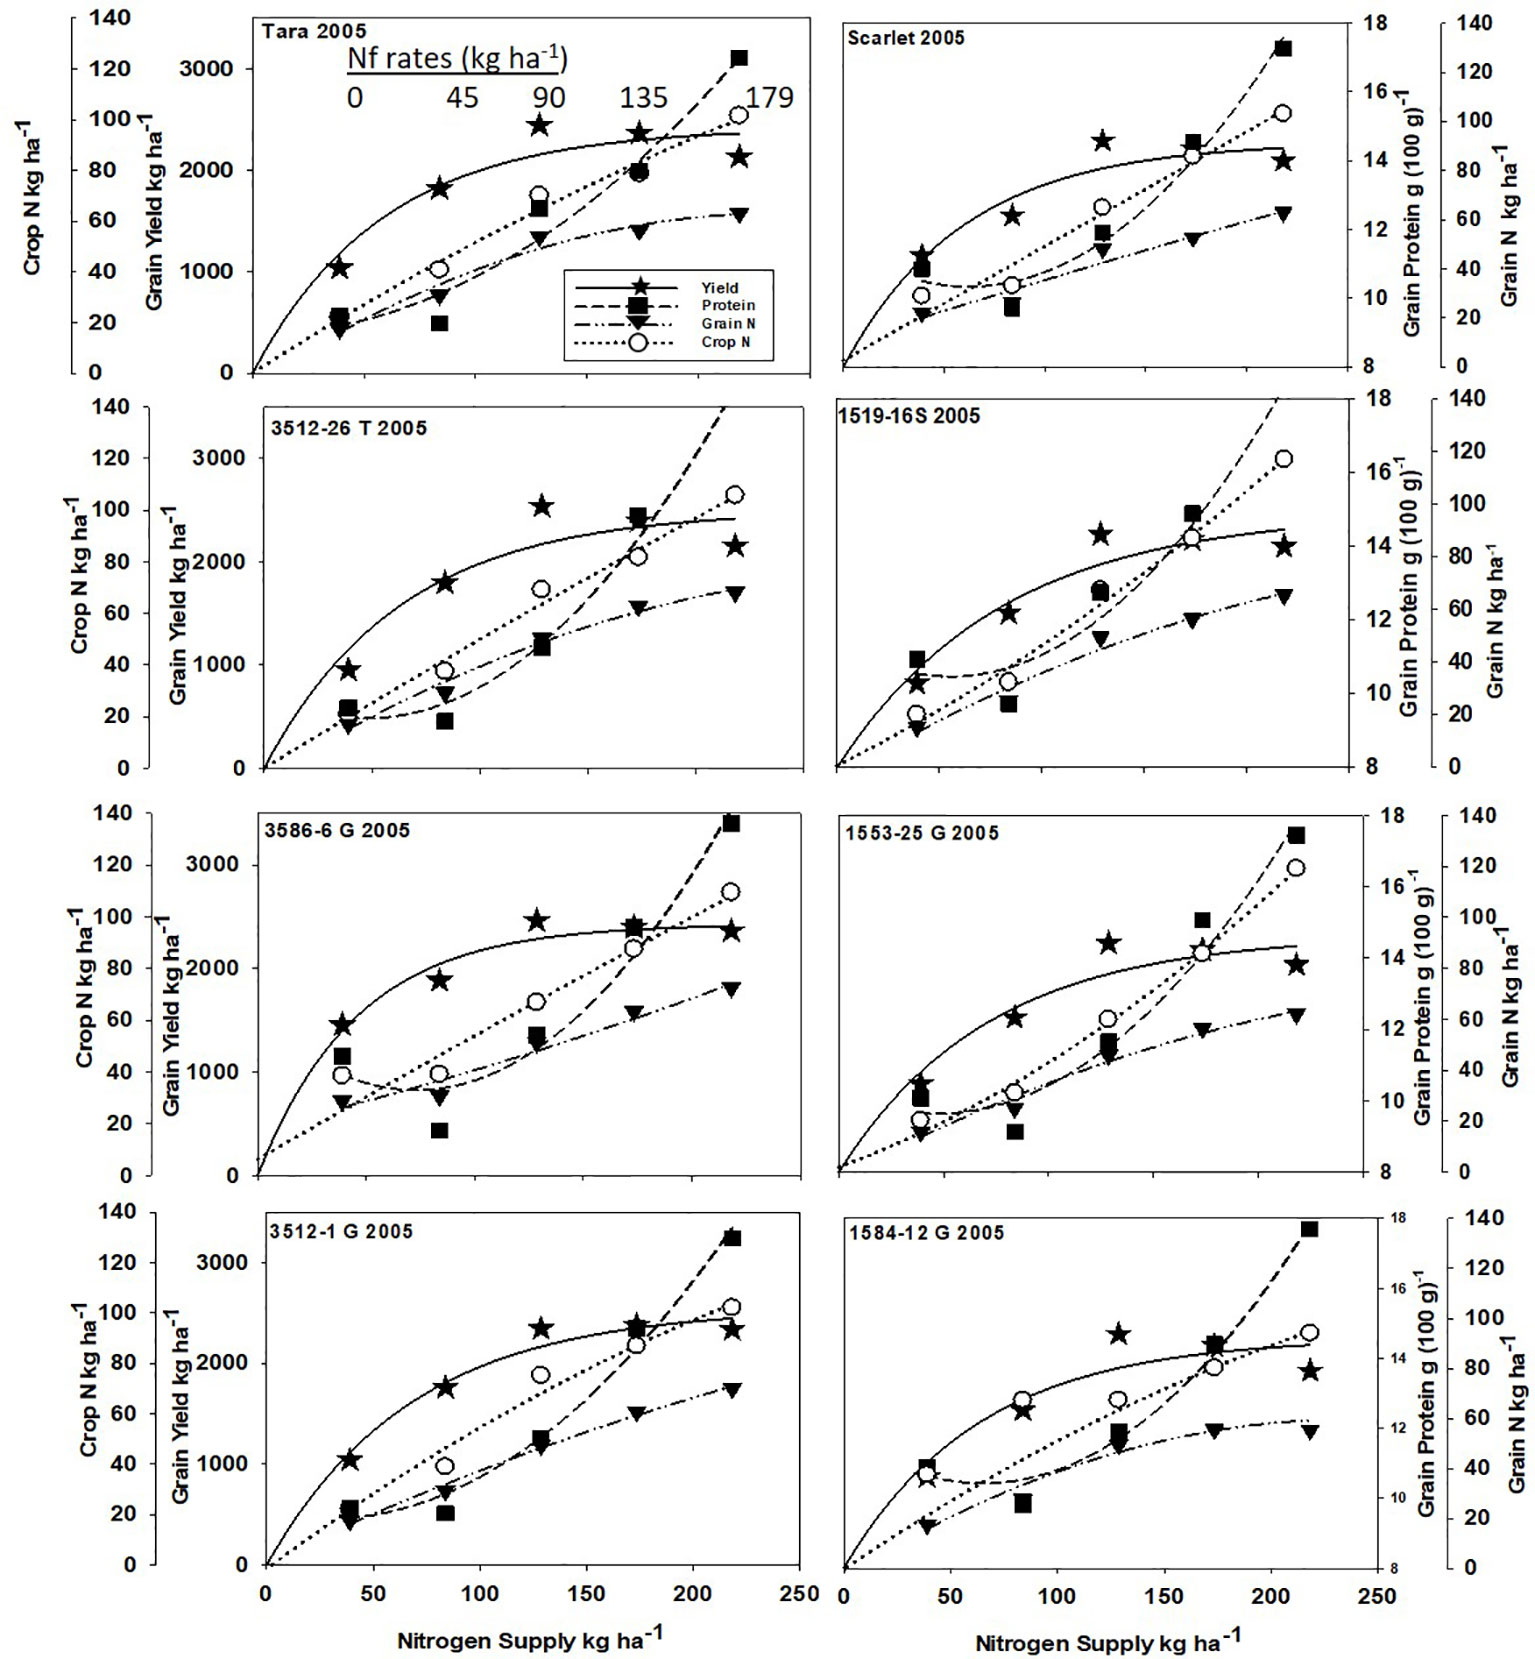
Figure 2 Grain yield, grain N concentration, grain N yield, and crop N responses to increasing N supply at Endicott WA in 2005 of HRS cultivar Tara and its derivatives 3512-26T, 3586-6G/T, and 3512-1G; HRS cultivar Scarlet and its derivatives 1519-16S, 1519-16S, 1553-26G and 1584-12G. Symbols represent means of 4 N rate replicates of each dependent variable. Regression coefficients of responses modeled on entire datasets are presented in Tables 1 and S1.
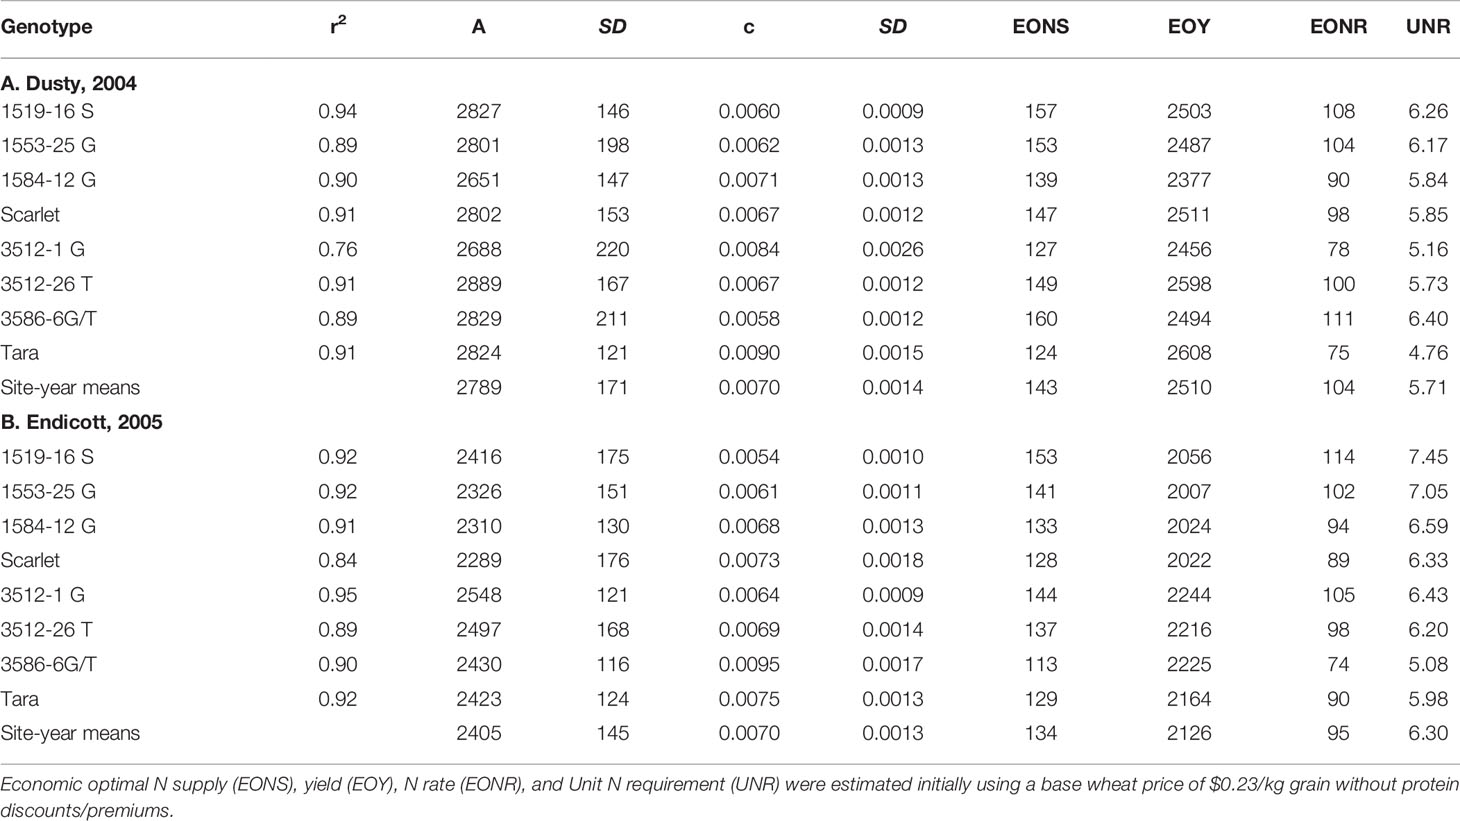
Table 1 Mitscherlich model correlation coefficients, A and c parameters with their standard errors for yield response to N supply of all genotypes, shown in Figures 1 and 2.
Analysis of variance revealed site-year, N rate and genotype were significant for all crop parameters except crop N, which was not different across genotypes (Table S2). No significant interactions were detected between N rate and genotype. Backcross derived near isolines with the Gpc-B1 region did not have significantly higher GPC averages than their recurrent parent at the economically optimal N supply and yield when the grain protein premium was not considered (Table 2).
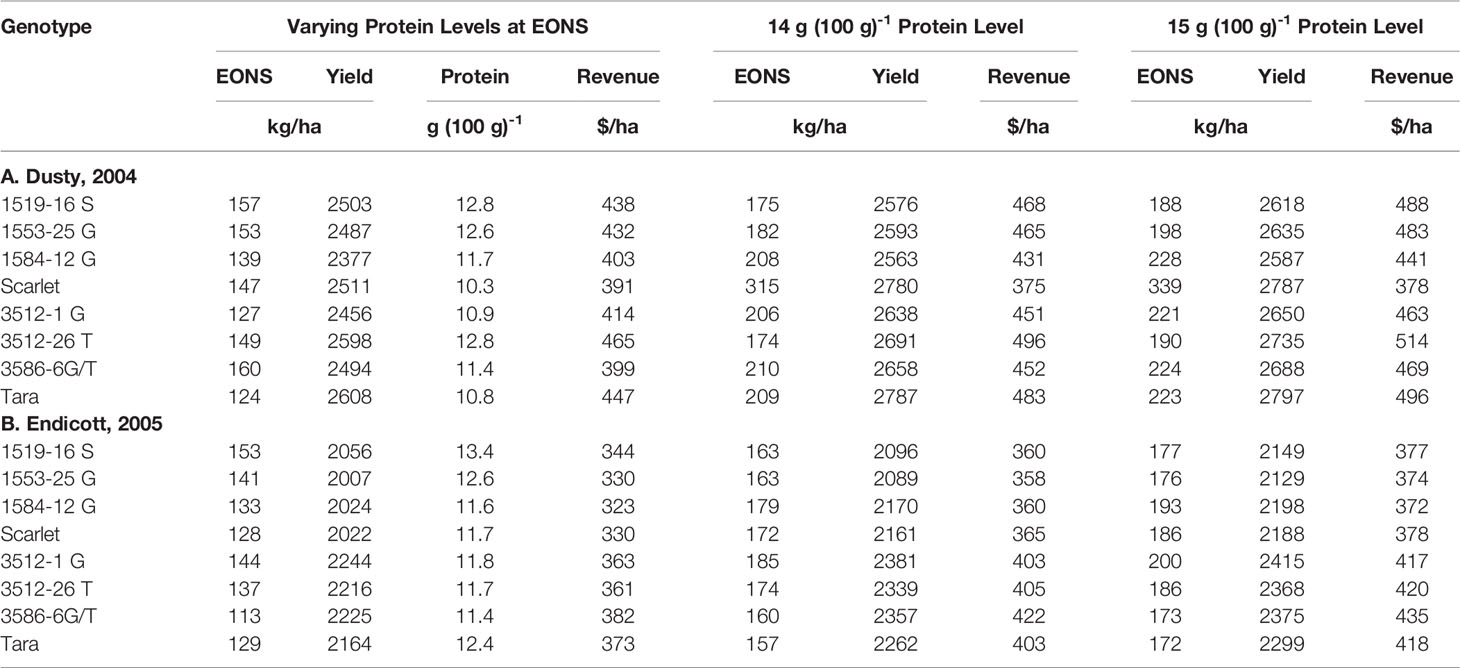
Table 2 Grain protein and net revenue generated from EONS and yields described in Table 1, and higher EONS required to generate higher net revenues calculated when meeting 14 and 15 g (100 g)-1 protein goals as protein price premiums are accounted.
Crop N and Grain N Yields
Crop and grain N responses to increasing N supply were best fitted by quadratic response functions (Figures 1 and 2; Table S1). Crop N functions were near linear, as illustrated by larger, linear coefficients that were more frequently significant than the smaller, more frequently non-significant quadratic coefficients (Table S1). In comparison, grain N accumulated with lower slopes (Figures 1 and 2) over the range of N rates, illustrating greater proportion of crop N stored in the straw with increasing N supply.
Economic Optimization
Mitscherlich response functions were initially used with fixed N and grain prices to estimate economically optimal N rates (EONR), supply (EONS), yield (EOY), and the corresponding unit N requirement (UNR), all initially ignoring market valuation of protein (Table 1). While EOYs were lower in the second vs. first site-year, the EONS values were only slightly lower, thus resulting in higher UNRs in the second site-year. Derivatives of Tara and Scarlet generally exhibited higher EONS and UNR than their parents in both years. Nevertheless, 3586-6 G/T was an exception in the second site-year, exhibiting lower EONS and UNR than Tara.
Since high protein goals were not achieved with the initial EONS that was estimated without regard to protein premiums or discounts, we used the Mitscherlich yield and quadratic GPC functions to assess the net revenues obtained with additional N fertilizer additions beyond the initial EONS that elevated both yield and GPC (Table 2). While the higher N fertilizer investment per unit yield did not pay off for Scarlet in the first site-year due to a more gradual increase in GPC beyond the EONS required to achieve the initial EOY, overall net revenues of $25 and $ 37 ha-1 were obtained with increased Ns to achieve 14 and 15 g protein (100 g)-1 for Scarlet and its derivatives averaged over both site-years (Table 2). In contrast, higher net revenues of $39 and $54 ha-1 were obtained as Ns was increased to achieve 14 and 15 g protein (100 g) -1 for Tara and its derivatives averaged over both site-years. Comparing N supply required to achieve these protein goals of the base cultivars in the high yielding first site-year, Scarlet required 315 and 339 kg Ns ha-1, while Tara only required 209 and 223 kg Ns ha-1 (Table 2). Similarly in the lower yielding second site-year, Scarlet required 172 and 186 kg Ns ha-1, while Tara only required 157 and 172 kg Ns ha-1 to achieve protein goals of 14 and 15 g protein (100 g)-1, respectively.
NUE and Components
Analysis of variance revealed site-year and N rate effects were significant for NUE, NUPE, and NUTE, but genotype only affected NUE and NHI (Table S2). No significant interactions were detected between N rate and genotype for NUE and its components. The interactions between genotype and N rate were largely non-significant, so main effects of genotype (Table 3) and N rate (Table 4) are presented. Tara exhibited higher NUE and NHE than its derivatives in the first site-year due to higher N uptake efficiency rather than higher NHI (Table 3). Yet in all other comparisons, the advanced lines were not significantly different than either parents for both site-years (Table 3). One exception was 3586-6 G/T in the second site-year was higher than its parent Tara in NUE and grain N accumulation efficiency, due to higher N uptake efficiency.
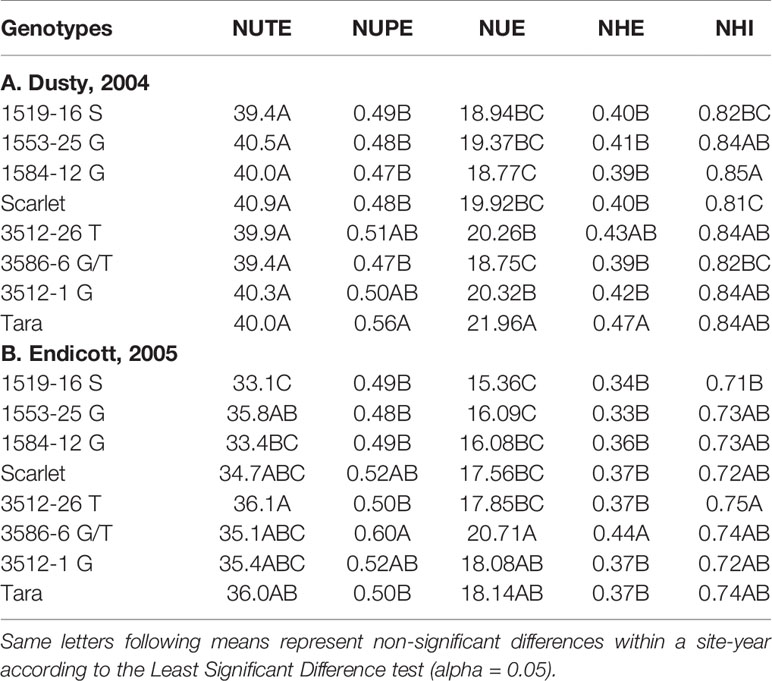
Table 3 Genotypic means averaged over all N rates for N utilization (NUTE), N uptake (NUPE), nitrogen use efficiency (NUE), grain N harvest efficiency (NHE), and N harvest index (NHI).
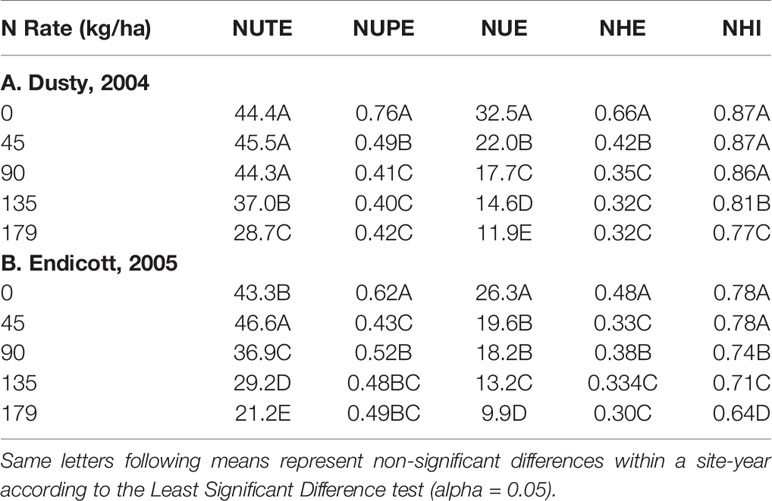
Table 4 N rate means averaged over all genotypes for N utilization (NUTE), N uptake (NUPE), nitrogen use efficiency (NUE), grain N harvest efficiency (NHE), and N harvest index (NHI).
The NUE averaged over all genotypes decreased with increasing applied N for both site-years, attributable to decreases in both NUPE and NUTE (Table 4). Similarly, NHE also decreased with increasing N rate, most attributable to decreased NUPE, and to lesser extent, reduced NHI (Table 4).
Tradeoffs Between Grain Protein Production and Unused Reactive Soil N
Unused reactive soil N left behind after harvest was calculated as the difference between N supply and crop N accumulation. A linear relationship between grain protein harvested and unused reactive N was observed in both site-years, without significant N supply x site-year interaction (Figure 3). Unused N increased by 0.41 kg N ha-1 per 1 kg protein ha-1 increase.
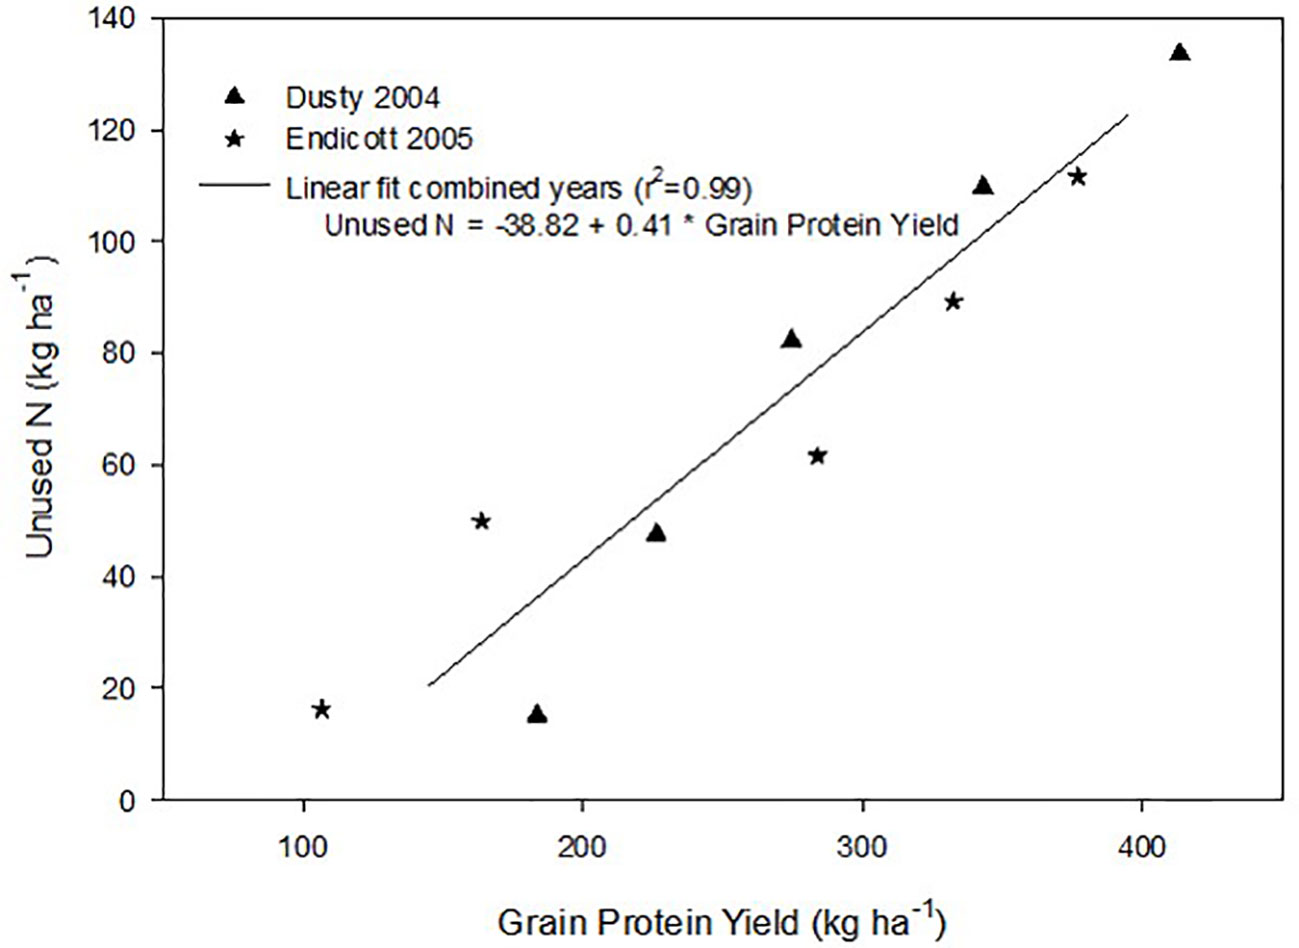
Figure 3 Linear relationship between the amount of unused soil N left behind after harvest and the grain protein yield produced at each N supply over two years. Mean data averaged over all genotypes and replicates in both site years are linearly regressed.
Discussion
Re-cropping hard red spring wheat after winter wheat replacing fallow is a strategy for crop intensification for diversifying the system and markets (Pan et al., 2017). However, this shortens the time of soil N mineralization that would otherwise add greater available mineral N during fallow. For example, diminished fertilizer N responses of canola were earlier observed following fallow in this region (Pan et al., 2016). Steeper initial yield responses to N fertilizer inputs were observed herein with recropped HRS, with diminishing returns with higher N inputs represented by the Mitscherlich model (Figures 1 and 2). The modest maximum grain yields (A values) were due to the low soil water and in-season precipitation following winter wheat compared to fallow in this transitional agroecological zone.
Before a season, farmers can impact the protein level of their wheat by genotype selection and management of nitrogen. Yield and nitrogen both impact profit, so an economically motivated farmer will apply N at rates that optimizes both yield and protein. Baker et al. (2004) found that it is not always profitable to use 14 g (100g)-1 as the base protein goal for fertilization. Depending upon the wheat price premium/discount and the cost of N, in some scenarios profit was greater with higher yield and lower than base protein levels.
The price of N fertilizer and the protein premium/discount were held constant at current levels to assess the economic (Table 1) and ecosystem (Figure 3) impacts from varying the N supply. The GPC ranged from 10.3 to 13.4 g (100g)-1 at solely yield-based EOYs (Table 2). The economic analysis that accounted for GPC premiums and discounts revealed greater economic returns from elevating N supply above that required to achieve the yield-based optimum (Table 2). Only Scarlet in the first site-year showed lower economic returns (Table 2) from raising the N supply to >300 kg N ha-1 necessary to achieve GPC of 14 g (100 g)-1 (Figure 1).
The Gpc-B1 introgression has been associated with earlier flag leaf senescence (Uauy et al., 2006) and greater N remobilization, along with higher N harvest index (Kade et al., 2005) that promotes higher GPC. However, as Carter et al. (2012) suggested, physiological benefit may have limited potential for improving GPC where spring wheat grain-filling periods are already shortened by environmental conditions in the inland Pacific Northwest.
Brevis and Dubcovsky (2010) demonstrated that Gpc-B1 introgression increased protein yield in common and durum wheat. In the present study, the physiological benefit was not observed at any level of N supply, from deficient to excessive. Varying N supply with the addition of fertilizer N within the two site-years had greater impact on protein, yield, N use and its components, and economic returns than introgression of the Gpc-B1 allele in these two hard red spring wheat cultivars. However, advanced Scarlet lines generally had higher GPC than advanced Tara lines at EONS determined on base yield price only (Table 2).
Maximizing protein-based economic returns with increased N supply can incur an environmental cost, demonstrated by decreased N use and its components with increased N supply (Table 4), as previously observed (Huggins and Pan, 1993). Application of fertilizer N required to produce >400 kg protein ha-1 also left >130 kg unused N ha-1 (Figure 3), representing increased reactive N remaining in the system that has potential for negatively impacting the environment. The presence of greater reactive N requires an N management accounting and reduction of fertilizer N inputs in the next crop cycle to avoid reactive N losses to the environment (Schlesinger, 2009; Snyder et al., 2014). Field-performance and grain-quality based selective breeding lead to the release of Tara (Kidwell et al., 2002) that improved the economic returns on N investments compared to the older Scarlet cultivar. These results stress the importance of further developing genotypes with increased yield and GPC potential. While the Gpc-B1 introgression did not further improve economically optimal yield and GPC of these hard red spring cultivars grown under these conditions, future research should further investigate new genotype × environment × soil interactions for improving N use efficiency, grain quality, and economic returns, while reducing reactive soil N.
Data Availability Statement
The datasets analyzed in this article are not publicly available. Requests to access the datasets should be directed to WP, d2xwYW5Ad3N1LmVkdQ==.
Author Contributions
WP prepared the initial journal manuscript, supervised data collection, analysis, and interpretation. KK developed the wheat genotypes, supervised field experimental design and maintenance, and manuscript editing. VM conducted economic analysis and manuscript editing. RB conducted experimental layout, soil and plant sample collection, Mitscherlich modelling and analysis of variance statistical evaluation. MA, graduate research assistant, organized literature review, initial methods description and draft dataset.
Funding
The authors thank the following sources of support: USDANIFA Award #2011-68002-30191 from the USDA National Institute of Food and Agriculture, USDA National Institute of Food and Agriculture, Hatch project 1014527.
Conflict of Interest
The authors declare that the research was conducted in the absence of any commercial or financial relationships that could be construed as a potential conflict of interest.
Supplementary Material
The Supplementary Material for this article can be found online at: https://www.frontiersin.org/articles/10.3389/fpls.2019.01790/full#supplementary-material
References
Avivi, L. (1978). “High protein content in wild tetraploid triticum dicoccoides Korn,” in Proceedings of the 5th International Wheat Genetics Symposium. Ed. Ramanujam, S. (New Delhi, India: Indian Society of Genetics and Plant Breeding (ISGPB)), 372–380.
Baker, D. A., Young, D. L., Huggins, D. R., Pan, W. L. (2004). Economically optimal nitrogen fertilizer for yield and protein in hard red spring wheat. Agron. J. 96, 116–123. doi: 10.2134/agronj2004.0116
Bekkerman, A. (2018). How much do markets value protein premiums? The MGEX-KCBT spread might help (AGECONMT: Montana State University).http://ageconmt.com/how-much-do-markets-value-protein-premiums-the-mgex-kcbt-spread-might-help/accessed 5/9/2019
Belete, F., Dechassa, N., Molla, N. A., Tana, T. (2018). Effect of split application of different N rates on productivity and nitrogen use efficiency of bread wheat (Triticum aestivum L.). Agric. Food Secur. 7, 92. doi: 10.1186/s40066-018-0242-9
Beres, B. L., Graf, R. J., Irvine, R. B., O’Donovan, J. T., Harker, K. N., Johnson, E. N., et al. (2018). Enhanced nitrogen management strategies for winter wheat production in the Canadian prairies. Can. J. Plant Sci. 98, 683–702. doi: 10.1139/cjps-2018-0157
Brevis, J. C., Dubcovsky, J. (2010). Effects of the chromosome region including the GPC-B1 locus on wheat grain and protein yield. Crop Sci. 50, 93—104. doi: 10.2135/cropsci2009.02.0057
Brown, B., Westcott, M., Christensen, N., Pan, B., Stark, J. (2005). Nitrogen management for hard red wheat protein enhancement (PNW Ext. Publ. 578:1–14. Pullman, WA. Washington State Univ.).
Burns, J. (2002). Wheat and Small Grains: 2002 variety testing data and maps. http://smallgrains.wsu.edu/variety/variety-2002-data/
Carter, A. H., Santra, D. K., Kidwell, K. K. (2012). Assessment of the effects of the Gpc-B1 allele on senescence rate, grain protein concentration and mineral content in hard red spring wheat (Triticum aestivum L.) from the Pacific Northwest Region of the USA. Plant Breed. 131, 62–68. doi: 10.1111/j.1439-0523.2011.01900.x
Clarke, J. M., Campbell, C. A., Cutforth, H. W., DePauw, R. M., Winkleman, G. E. (1990). Nitrogen and phosphorus uptake, translocation, and utilization efficiency of wheat in relation to environment and cultivar yield and protein levels. Can. J. Plant Sci. 70, 965–977. doi: 10.4141/cjps90-119
Cox, M. C., Qualset, C. O., Rains, D. W. (1986). Genetic variation for nitrogen assimilation and translocation in Wheat. III. Nitrogen translocation in relation to grain yield and protein. Crop Sci. 26, 737–740. doi: 10.2135/cropsci1986.0011183X002600040022x
Dawson, J. C., Huggins, D. R., Jones, S. S. (2008). Characterizing nitrogen use efficiency in natural and agricultural ecosystems to improve the performance of cereal crops in low-input and organic agricultural systems. Field Crop Res. 107, 89–101. doi: 10.1016/j.fcr.2008.01.001
DePauw, R. M., Townley-Smith, T. F. (1988). “Patterns of response for genotypes, grain yield and protein content in seven environments,” in Proc. 7th Int. Wheat Genet. Symp., July 13–18. Eds. Miller, T. E., Koebner, R. M. D. (Cambridge, UK: Institute of Plant Science Research), 993–997.
Distelfeld, A., Cakmak, I., Peleg, Z., Ozturk, L., Yazici, A. M., Budak, H., et al. (2007). Multiple QTL-effects of wheat GPC-B1 locus on grain protein and micronutrient concentrations. Physiol. Plant. 129, 635—643. doi: 10.1111/j.1399-3054.2006.00841.x
Fiez, T. E., Pan, W. L., Miller, B. C. (1995). Nitrogen efficiency analysis of winter wheat among landscape positions. Soil Sci. Soc. Am. J. 59, 1666–1671.
Franzen, D. W. (2018). Fertilizing hard red spring wheat and durum (Fargo, ND. North Dakota State University: North Dakota State University SF712 (revised).
Hatfield, J. F., Walthall, C. L. (2015). Meeting global food needs: realizing the potential via genetics × environment × management interactions. Agron. J. 107, 1215–1226. doi: 10.2134/agronj15.0076
Hawkesford, M. J. (2012). The diversity of nitrogen use efficiency for wheat varieties and the potential for crop improvement. Better Crops 96, 10–12.
Huggins, D. H., Pan, W. L. (1993). Component analysis of cropping system differences in nitrogen use efficiency. Agron. J. 85, 898–905. doi: 10.2134/agronj1993.00021962008500040022x
Johnson, V. A., Mattern, P. J. (1968). Improvement of wheat protein quality and quantity by breeding. Adv. Exp. Med. Biol. 105, 301–316. doi: 10.1007/978-1-4684-3366-1_16
Johnson, V. A., Mattern, P. J., Schmidt, J. W. (1967). Nitrogen relations during spring growth in varieties of Triticum aestivum L. differing in grain protein content. Crop Sci. 7, 664–667. doi: 10.2135/cropsci1967.0011183X000700060032x
Jones, C., Olson-Rutz, K. (2012). Practices to increase wheat grain protein (Bozeman, MT. Montana State University: Montana State University Extension EB0206).
Joppa, L. R., Cantrell, R. G. (1990). Chromosomal location of genes for grain protein content of wild tetraploid wheat. Crop Sci. 30, 1059–1064. doi: 10.2135/cropsci1990.0011183X003000050021x
Joppa, L. R., Du, C., Hart, G. E., Hareland, G. A. (1997). Mapping gene(s) for grain protein in tetraploid wheat (Triticum turgidum L.) using a population of recombinant inbred chromosome lines. Crop Sci. 37, 1586–1589. doi: 10.2135/cropsci1997.0011183X003700050030x
Kade, M. A., Barneix, J., Olmos, S., Dubcovsky, J. (2005). Nitrogen uptake and remobilization in tetraploid Langdon durum wheat and a recombinant substitution line with the high grain protein gene Gpc-B1. Plant Breed. 124, 343–349. doi: 10.1111/j.1439-0523.2005.01110.x
Khan, I. A., Procunier, J. D., Humphreys, D. G., Tranquilli, G., Schlatter, A. R., Marcucci-Poltri, S., et al. (2000). Development of PCR-based markers for a high grain protein content gene from Triticum turgidum spp dicoccoides transferred to bread wheat. Crop Sci. 40, 518–524. doi: 10.2135/cropsci2000.402518x
Kidwell, K. K., Shelton, G. B., Morris, C. F., Line, R. F., Miller, B. C., Davis, M. A., et al. (1999). Registration of Scarlet wheat. Crop Sci. 39, 1255. doi: 10.2135/cropsci1999.0011183X003900040056x
Kidwell, K. K., Shelton, G. B., DeMacon, V. L., Burns, J. W., Carter, B. P., Morris, C. F., et al. (2002). Registration of Tara 2002 wheat. Crop Sci. 42, 1746. doi: 10.2135/cropsci2002.1746a
Koenig, R. T. (2005). Dryland wheat Eastern Washington nutrient management guide (Pullman, WA Washington State University: Washington State University Extension EB1987E).
Loffler, C. M., Busch, R. H. (1982). Selection for grain protein, grain yield, and nitrogen partitioning efficiency in hard red spring wheat. Crop Sci. 22, 591–595.
Mesfin, A., Frohberg, R. C., Anderson, J. A. (1999). RFLP markers associated with high grain protein from Triticum turgidum L. var. dicoccoides introgressed into hard red spring wheat. Crop Sci. 39, 508–513.
Mesfin, A., Frohberg, R. C., Khan, K., Olson, T. C. (2000). Increased grain protein content and its association with agronomic and end-use quality in two hard red spring wheat populations derived from Triticum turgidum L. var. dicoccoides. Euphytica 116, 237–242. doi: 10.1023/A:1004004331208
Moll, R. H., Kamprath, E. J., Jackson, W. A. (1982). Analysis and interpretation of factors which contribute to efficiency of nitrogen-utilization. Agron. J. 74, 562–564. doi: 10.2134/agronj1982.00021962007400030037x
Mondal, S., Rutkoski, J. E., Velu, G., Singh, P. K., Crespo-Herrera, L. A., Guzmán, C., et al. (2016). Harnessing diversity in wheat to enhance grain yield, climate resilience, disease and insect pest resistance and nutrition through conventional and modern breeding approaches. Front. Plant Sci. 7, 991. doi: 10.3389/fpls.2016.00991
Olmos, S., Distelfeld, A., Chicaiza, O., Schlatter, A. R., Fahima, T., Echenique, V., et al. (2003). Precise mapping of a locus affection grain protein content in durum wheat. Theor. Appl. Genet. 107, 1243–1251. doi: 10.1007/s00122-003-1377-y
Pan, W. L., Maaz, T. M., Hammac, W. A., McCracken, V. A., Koenig, R. T. (2016). Mitscherlich-modeled, semi-arid canola nitrogen requirements influenced by soil N and water. Agron. J. 108, 884–894. doi: 10.2134/agronj2015.0378er
Pan, W. L., Schillinger, W. F., Young, F. L., Kirby, E. M., Yorgey, G. G., Borrelli, K. A., et al. (2017). Integrating historic agronomic and policy lessons with new technologies to drive farmer decisions for farm and climate: the case of inland Pacific Northwestern U.S. Front. Environ. Sci. 5 (76), 1–22. doi: 10.3389/fenvs.2017.00076
SAS Institute Inc. (2013). SAS/ACCESS® 9.4 Interface to ADABAS: Reference. Cary, NC: SAS Institute Inc.
Schlesinger, W. (2009). On the fate of anthropogenic nitrogen. PNAS 106, 203–208. doi: 10.1073/pnas.0810193105
Snyder, C. S., Davidson, E. A., Smith, P., Venterea, R. T. (2014). Agriculture: sustainable crop and animal production to help mitigate nitrous oxide emissions. Curr. Opin. Env. Sust. 9-10, 46–54. doi: 10.1016/j.cosust.2014.07.005
Tabbita, F., Pearce, S., Barneix, A. J. (2017). Breeding for increased grain protein and micronutrient content in wheat: ten years of the GPC-B1 gene. J. Cereal Sci. 73, 183–191. doi: 10.1016/j.jcs.2017.01.003
Uauy, C., Brevis, J. C., Dubcovsky, J. (2006). The high grain protein content gene Gpc-B1 accelerated senescence and has pleiotropic effects on protein content in wheat. J. Exp. Bot. 57, 2785—2794. doi: 10.1093/jxb/erl047
United States Department of Agriculture Foreign Agricultural Service (USDA FAS). (2020). Grain: world markets and trade. Global grain supply and use to expand. January 2020: 1–43. Available at: https://apps.fas.usda.gov/psdonline/circulars/grain.pdf.
Keywords: protein, wheat, Gpc-B1, nitrogen use efficiency, fertilizer, Mitscherlich, economics
Citation: Pan WL, Kidwell KK, McCracken VA, Bolton RP and Allen M (2020) Economically Optimal Wheat Yield, Protein and Nitrogen Use Component Responses to Varying N Supply and Genotype. Front. Plant Sci. 10:1790. doi: 10.3389/fpls.2019.01790
Received: 30 September 2019; Accepted: 20 December 2019;
Published: 25 February 2020.
Edited by:
Henning Kage, University of Kiel, GermanyReviewed by:
Klaus Sieling, University of Kiel, GermanyMamoru Okamoto, University of Adelaide, Australia
Copyright © 2020 Pan, Kidwell, McCracken, Bolton and Allen. This is an open-access article distributed under the terms of the Creative Commons Attribution License (CC BY). The use, distribution or reproduction in other forums is permitted, provided the original author(s) and the copyright owner(s) are credited and that the original publication in this journal is cited, in accordance with accepted academic practice. No use, distribution or reproduction is permitted which does not comply with these terms.
*Correspondence: William L. Pan, d2xwYW5Ad3N1LmVkdQ==
 William L. Pan
 Kimberlee K. Kidwell2
 Vicki A. McCracken