 Yanjing Guo1Jing Cheng1Yuping Lu1He Wang1Yazhi Gao1Jiale Shi1Cancan Yin1Xiaoxiong Wang1
 Shiguo Chen1*
 Reto Jörg Strasser1,2Sheng Qiang1*
- 1Weed Research Laboratory, Nanjing Agricultural University, Nanjing, China
- 2Bioenergetics Laboratory, University of Geneva, Geneva, Switzerland
Gliotoxin (GT) is a fungal secondary metabolite that has attracted great interest due to its high biological activity since it was discovered by the 1930s. It exhibits a unique structure that contains a N-C = O group as the characteristics of the classical PSII inhibitor. However, GT’s phytotoxicity, herbicidal activity and primary action targets in plants remain hidden. Here, it is found that GT can cause brown or white leaf spot of various monocotyledonous and dicotyledonous plants, being regarded as a potential herbicidal agent. The multiple sites of GT action are located in two photosystems. GT decreases the rate of oxygen evolution of PSII with an I50 value of 60 µM. Chlorophyll fluorescence data from Chlamydomonas reinhardtii cells and spinach thylakoids implicate that GT affects both PSII electron transport at the acceptor side and the reduction rate of PSI end electron acceptors’ pool. The major direct action target of GT is the plastoquinone QB-site of the D1 protein in PSII, where GT inserts in the QB binding niche by replacing native plastoquinone (PQ) and then interrupts electron flow beyond plastoquinone QA. This leads to severe inactivation of PSII RCs and a significant decrease of PSII overall photosynthetic activity. Based on the simulated modeling of GT docking to the D1 protein of spinach, it is proposed that GT binds to the-QB-site through two hydrogen bonds between GT and D1-Ser264 and D1-His252. A hydrogen bond is formed between the aromatic hydroxyl oxygen of GT and the residue Ser264 in the D1 protein. The 4-carbonyl group of GT provides another hydrogen bond to the residue D1-His252. So, it is concluded that GT is a novel natural PSII inhibitor. In the future, GT may have the potential for development into a bioherbicide or being utilized as a lead compound to design more new derivatives.
Introduction
Gliotoxin (GT), an alkaloid with a molecular mass of 326 Da, is the most important and well-known epipolythiodioxypipeazine (ETP)-type mycotoxin with biological active internal disulfide bridge (Smith et al., 2016). Since it was discovered by the 1930s, GT has been isolated from various fungal species, including Trichoderma, Aspergillus fumigatus, Eurotium chevalieri, Neosartorya pseudofischeri, some Penicillium spp., and Acremonium spp. Numerous studies show that GT processes medicinal properties, including immunosuppressive, antitumour, antibacterial, and antiviral activity. However, it was discarded from clinical practice for its toxicity. GT is also recognized for an antibiotic substance involved in biological control of plant disease because it can cause cytoplasmic leakage, inhibit the germination of sporangia and mycelia growth of some plant pathogenic fungi (Scharf et al., 2016). Several GT-producing strains of Trichoderma virens have been successfully commercialized as biopesticides and widely used in agriculture (Lumsden and Walter, 2003; Khan et al., 2011).
Previous references indicated that GT has multiple cellular effects because of its different action targets. Early in 1968, it was found that GT can prevent viral RNA replication due to the specific inhibition of reverse transcriptase (Miller et al., 1968). In eukaryotic cells, GT has been proven as inhibitor of several enzymes such as farnesyltransferase, geranylgeranyltransferase, nicotinamide adenine dinucleotide phosphate (NADPH) oxidase, alcohol-dehydrogenases, and nuclear factor-kappaB, causing apoptosis and necrosis in various cell types (Vigushin et al., 2004; Kim and Park, 2016; Scharf et al., 2016; Arias et al., 2018). Further evidence revealed that necrotic cell death induced by GT in murine thymocytes is associated with activation of a redox active calcium channel in the plasma membrane (Hurne et al., 2002). The inhibition of proteasome activity is one of the putative molecular targets of GT-mediated apoptosis in immune cells (Kroll et al., 1999; Dolan et al., 2015; Li et al., 2018). Based on the fact that the disulfide bridge of GT allows the cross linking with proteins and generates reactive oxygen species (ROS) through the redox cycling between reduced and oxidized forms, ROS is believed to be also responsible for DNA damage and apoptosis in cells of immune system (Harms et al., 2015; Nouri et al., 2015). Additionally, it is proposed that GT can perturb microfilament structure and induce cell detachment (Jordan and Pedersen, 1986). Recent work demonstrated that GT can target integrins to induce anoikis on lung epithelial cells (Haun et al., 2018).
However, at present very little attention is paid to the phytotoxicity of GT. It was reported that GT is inhibitory to root growth of clover and mustard accompanied by reduction in percentage germination of seeds (Wright, 1951). Similarly, GT shows potent growth inhibition against lettuce seedlings (Furuta et al., 1984; Haraguchi et al., 1992). Haraguchi et al. (1996; 1997) discovered that GT inhibits growth of cultured tobacco cells and pea seedling roots through the interference with the biosynthesis of branched-chain amino acids by reducing acetolactate synthase (ALS) activity. ALS is one of the targets of commercial herbicides. This means GT is possibly used to develop directly as a potential bioherbicide or design more novel derivatives as a template in the future. However, GT’s herbicidal activity, multiple primary action targets, and mechanistic details of certain physiological effects on plants are unclear.
The goal of this study is to evaluate the herbicidal activity of GT, probe its action targets on two photosystems, and tests two hypotheses as following. Firstly, GT can cause leaf lesion of various plant species, possessing excellent herbicidal activity. Secondly, GT is a novel natural photosynthetic inhibitor, decreasing PSII activity by binding to D1 protein. To prove these hypotheses, here phytotoxicity of GT to 10 different plant species was determined, and then chlorophyll (Chl) a fluorescence technique as an expeditious tool was utilized to identify and localize effects of GT on two photosystems. Finally, based on the structural information available from atrazine- and DCMU- binding to the reaction center of purple bacteria, a simulated modeling of GT interacting with the reaction center of spinach was constructed. Identification of the detailed molecular action targets of GT may help to design high-affinity GT-based derivatives, which is important for developing future new bio-based herbicides.
Materials and Methods
Plants and Chemicals
Ten species of plants (Table 1) were cultured in soil from seed for about 2 months in the greenhouse at 20–25 °C and illuminated for 12 h with approximate 200 µmol m−2s−1 white light.
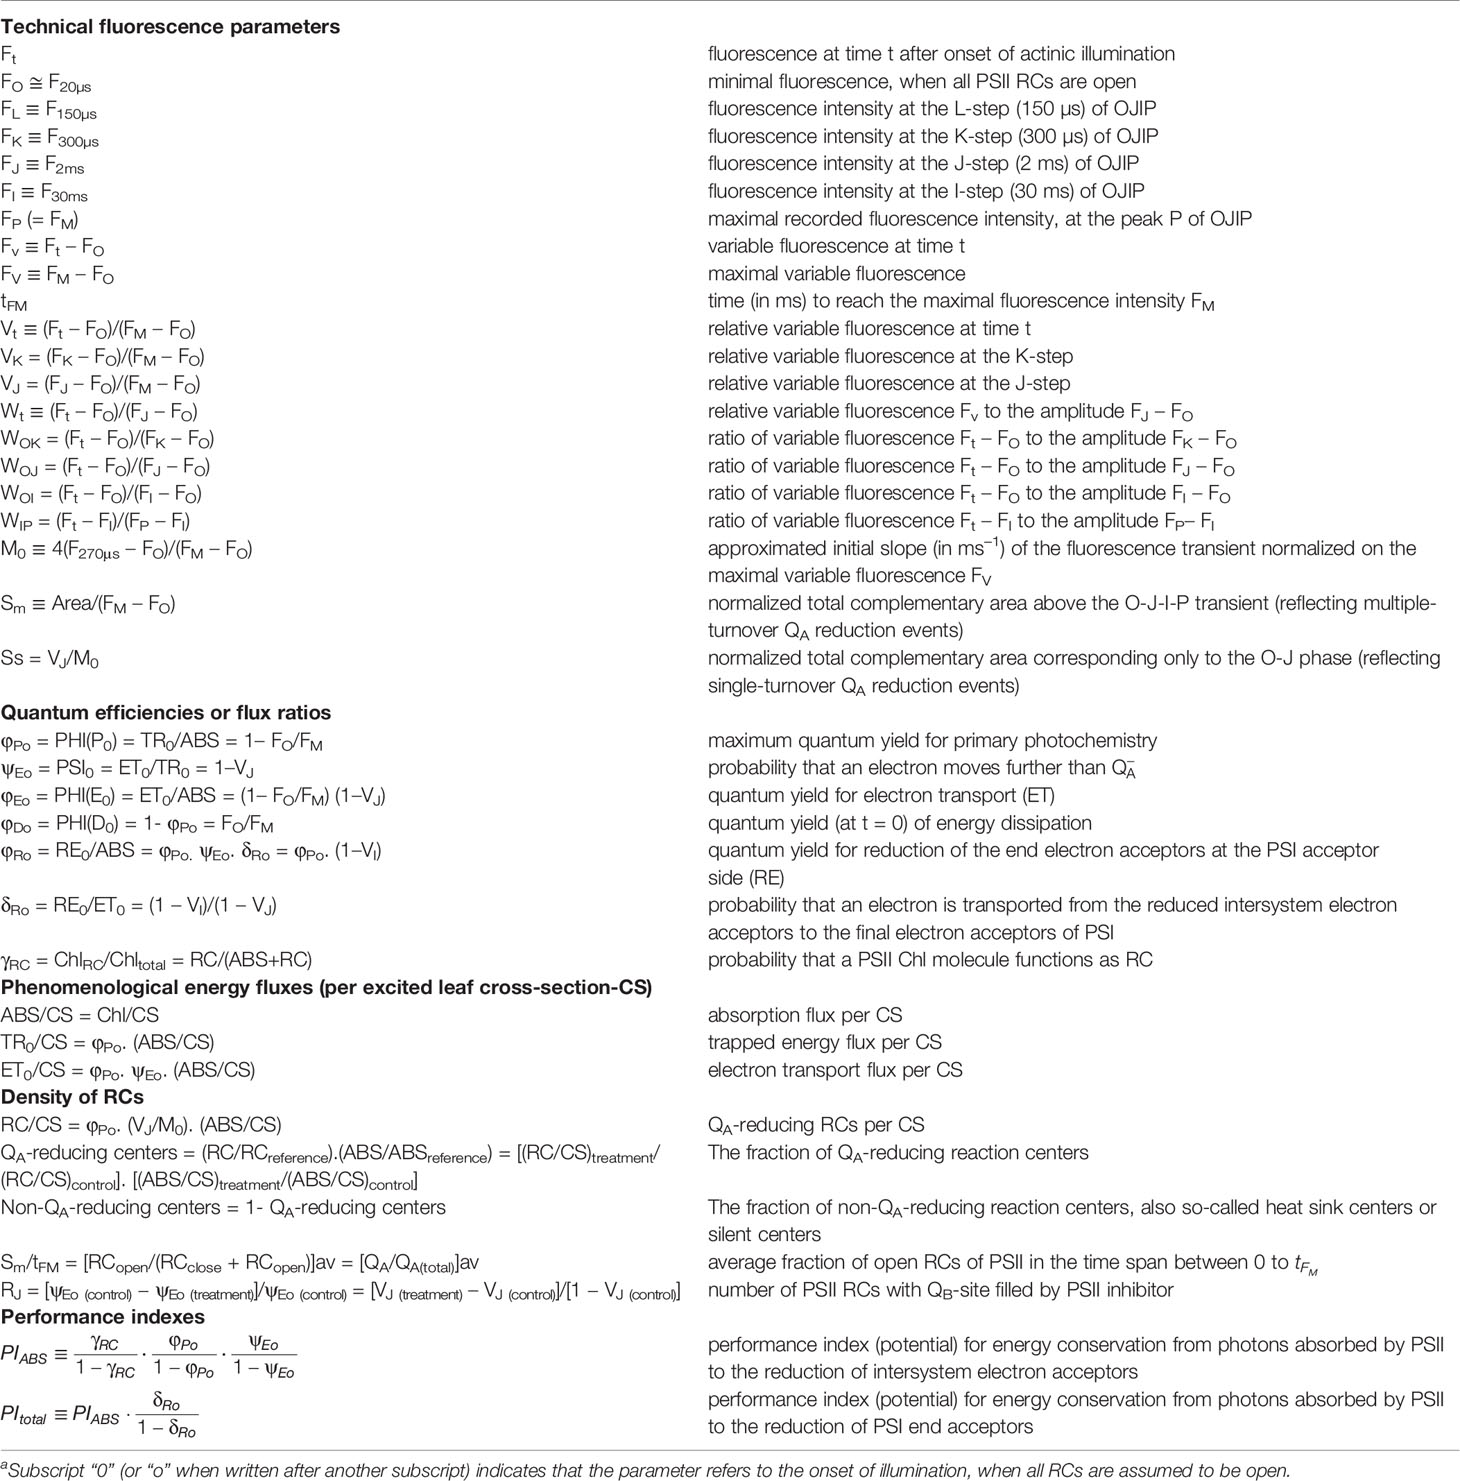
Table 1 Formulae and explanation of the technical data of the OJIP curves and the selected JIP-test parameters used in this studya.
The green alga, Chlamydomonas reinhardtii, was obtained from the Freshwater Algae Culture Collection at the Institute of Hydrobiology (FACHB-collection 2221, Chinese Academy of Science, China). Cells were grown at 25°C in liquid Tris-acetate-phosphate medium, shaken 3 to 4 times per day, under about 100 µmol m−2 s−1 white light (day/night, 12 h/12 h). The experiments were done with 3-day old cultures during their logarithmic growth phase (Gao et al., 2018).
Gliotoxin (CAS No. 7562-61-0), diuron (CAS No. 330-54-1, DCMU, 3-(3,4-Dichlorophenyl)-1,1-dimethylurea), methyl viologen (CAS No. 75365-73-0, MV, 1,1’-dimethyl-4,4’-bipyridinium-dichloride), and dimethyl sulphoxide (CAS No. 67-68-5, DMSO) were obtained from Sigma-Aldrich, and other common chemical reagents used in this work were purchased from Amresco. The Gliotoxin, DCMU and MV stock solutions were prepared in 100% DMSO and diluted in distilled water as required. The final concentration of DMSO in every experiment was less than 1% (v/v).
Phytotoxicity Assay
The detached-intact leaves from 10 species of plants were rinsed with sterilized water, subsequently blotted-dry with sterile paper, and then placed in Petri dishes with wet filter paper. Leaves were punctured using a needle from their margin on the abaxial side. A 10 µl of 1% DMSO (mock) or GT solution at different concentrations (100, 500, and 1,000 µM) was dripped onto the punctured wound of leaves. All Petri dishes were placed in a growth chamber for 96 h at 25°C under around 200 μmol m−2s−1 white light (day/night, 12h/12h). The diameter of leaf lesions was measured with calipers. Each mean value was obtained from at least fifteen leaf samples.
Measurement of PSII Oxygen Evolution Rate
The rate of oxygen evolution of PSII was measured using a Clark type oxygen electrode (Hansatech Instruments Ltd., King’s Lynn, UK) according to Chen et al. (2007). C. reinhardtii cells were resuspended in Buffer A with a 0.65 A750, and then GT and DCMU were individually added into 2 ml suspensions with the indicated concentrations. After the cells were incubated for 3 h in darkness at 25°C, treated-cells containing 45 µg chlorophylls were added into the reaction medium including 50 mM Hepes-KOH buffer (7.6), 4 mM K3Fe(CN)6, 5 mM NH4Cl, 1 mM p-Phenylenediamine. Cells were illuminated with 400 µmol photons m−2 s−1 red actinic light. The rate of oxygen evolution was measured during the first three minutes after onset of illumination.
Chl a Fluorescence Imaging
Chl a fluorescence imaging was determined using a pulse-modulated Imaging-PAM M-series fluorometer (MAXI-version, Heinz Walz GmbH, Effeltrich, Germany) in three independent experiments (Gao et al., 2018). C. reinhardtii cells were harvested and resuspended in Buffer A (20 mM HEPES-KOH pH 7.5, 350 mM sucrose, and 2.0 mM MgCl2) with a 0.65 A750. 200 μl of cell suspensions with 1% DMSO (mock), GT (10, 50, and 100 µM) were added into the 96-well black microtiter plate, incubating for 2.5 h under 100 µmol m−2 s−1 white light at 25°C. Subsequently, the samples were placed under the imaging system camera for 0.5 h dark-adaptation after focusing of the camera. Images of fluorescence were recorded at 0.25 µmol m−2 s−1 measuring light, 110 µmol m−2 s−1 actinic light, and 6,000 µmol m−2 s−1 saturation pulse light. In the absence of actinic illumination, on application of a weak measuring light and saturation pulse, the minimum fluorescence yield (FO) and the maximum fluorescence yield (FM) were determined respectively, from which the FV/FM was calculated. The fluorescence yield (FS) was determined after the addition of actinic light. During 315 s of actinic illumination, the maximum fluorescence yield in the light-adapted state (FM′) was determined during the repeated saturation pulse light for 0.8 s at intervals of 20 s. The electron transport rate (ETR), effective quantum yield (Yield), and photochemical quenching coefficient (qP) were also calculated automatically based on FO, FM, FS, and FM′.
Chl a Fluorescence Rise Kinetics OJIP and the Modulated 820 Nm Reflection (MR820)
Chl a fluorescence rise kinetics OJIP were measured with a Handy PEA instrument (Plant Efficiency Analyser, Hansatech Instruments Ltd., King’s Lynn, UK). Samples were always kept in darkness for 0.5 h before the measurements and were illuminated with continuous red light (650 nm peak wavelength, 3,500 µmol photons m−2 s−1 maximum light intensity). The experiment was repeated three times with at least 15 repetitions. For C. reinhardtii, 1 ml of cells in Buffer A with 0.65 A750 were treated with 1% DMSO (mock), GT (10, 50, and 100 μM) and 1 μM DCMU for 2.5 h under 100 µmol m−2 s−1 white light at 25°C. The samples were collected by centrifugation and resuspended in 20 µl Buffer A. After 0.5 h dark-adaptation, 20 µl suspensions were filtered onto glass microfiber filter (diameter 25 mm, GF/C, Whatman), and then positioned immediately above the PEA sensor head by a leaf clip to obtained the fluorescence data. For thylakoids of spinach (Spinacea oleracea), thylakoids were isolated according to the method of Chen et al. (2008). Before the fluorescence OJIP curves measurements, 1% DMSO (mock), GT (50, 100, 200, and 400 μM) and 1 μM DCMU were added to thylakoid suspensions with 100 μg Chl ml−1 and incubated for 0.5 h in complete darkness at 25 °C.
The fluorescence rise kinetics OJIP curves were analyzed by the JIP-test based on the model of “Theory of Energy Fluxes in Biomembranes” (Strasser et al., 2004). The JIP-test defines the specific (per reaction center, RC) and the phenomenological (per excited cross-section, CS) energy fluxes of the absorbed light by the antenna pigments (ABS), the maximum energy trapping (TR0), the electron transport beyond QA- (ET0) and dissipation (DI0). Various JIP-test parameters used in this study are listed in Table 1.
The MR820 signal measurements of C. reinhardtii cells were performed using a Multifunctional-PEA fluorometer (Hansatech Instruments Ltd., King’s Lynn, UK). Further technical details were described in a reference by Gao et al. (2018). The raw data were transferred to the computer and the numerical processing of the MR820 signals were carried out by the in-house software M-PEA data Analyzer v.5.1.
Modeling of GT in the QB-Binding Site
Based on the assumption that the Dl protein is an equivalent of the L-subunit, the coordinates of the L-subunit of purple photosynthetic bacterial Rhodopseudomonas viridis obtained from Protein Data Bank (PDB entry 1PRC) were used as the templates for the Dl protein. The amino acid sequence information of target protein Dl of C. reinhardtii (Reference Sequence: NP_958413.1) and S. oleracea (Reference Sequence: NP_054912.1) was obtained from NCBI. Docking was performed with DS-CDocker implemented in Discovery Studio (version 3.5, BIOVIA, America). The modeling started from the crystal structure alignment of complexes of the bacterial Rps. viridis RC with atrazine (Lancaster and Michel, 1999; PDB entry 5PRC) and the crystal structure alignment of S. oleracea D1 protein (PDB entry 3JCU). The atrazine binding environment in the bacterial RC or atrazine, DCMU and toxin GT binding environment in S. oleracea D1 was further refined by molecular dynamics simulations. The structures of three ligands were constructed using ChemBioDraw Ultra 14.0 software (CambridgeSoft, America). The ligand structures were energetically minimized using MM2 energy minimizations in Chem3D Pro 14.0 (CambridgeSoft, America). All bound water and ligands were eliminated from the protein, and the polar hydrogens were added to the proteins in the processes of the above energy minimization and molecular refinement.
Results and Discussion
GT Caused Leaf Lesion of Various Monocotyledonous and Dicotyledonous Plants
It was proved that GT possesses growth inhibiting bioactivity (Wright, 1951; Furuta et al., 1984; Haraguchi et al., 1992; Haraguchi et al., 1996; Haraguchi et al., 1997). To further examine the phytotoxicity of GT to different plants, the leaf lesion formation was monitored. As shown in Figure 1, the ratio of lesions in the leaf blades of ten plant species exhibited a concentration-dependent increase after 96 h treatment with 100, 500, and 1,000 µM GT. The white leaf spot was observed in GT-treated five plants including Digitaria sanguinalis, Microstegium vimineum, Zea mays, Oryza sativa, and Nicotiana tabacum. GT caused brown leaf spot in another five plants including Solidago Canadensis, Ageratina adenophora, Youngia japonica, Oxalis corniculata, and Gossypium barbadense. In the case of 1% DMSO treatment (mock), no visible damage was found in the leaf blades in these ten plants. Such chlorosis or necrosis symptoms indicate that GT led to chlorophyll breakup and cell death.
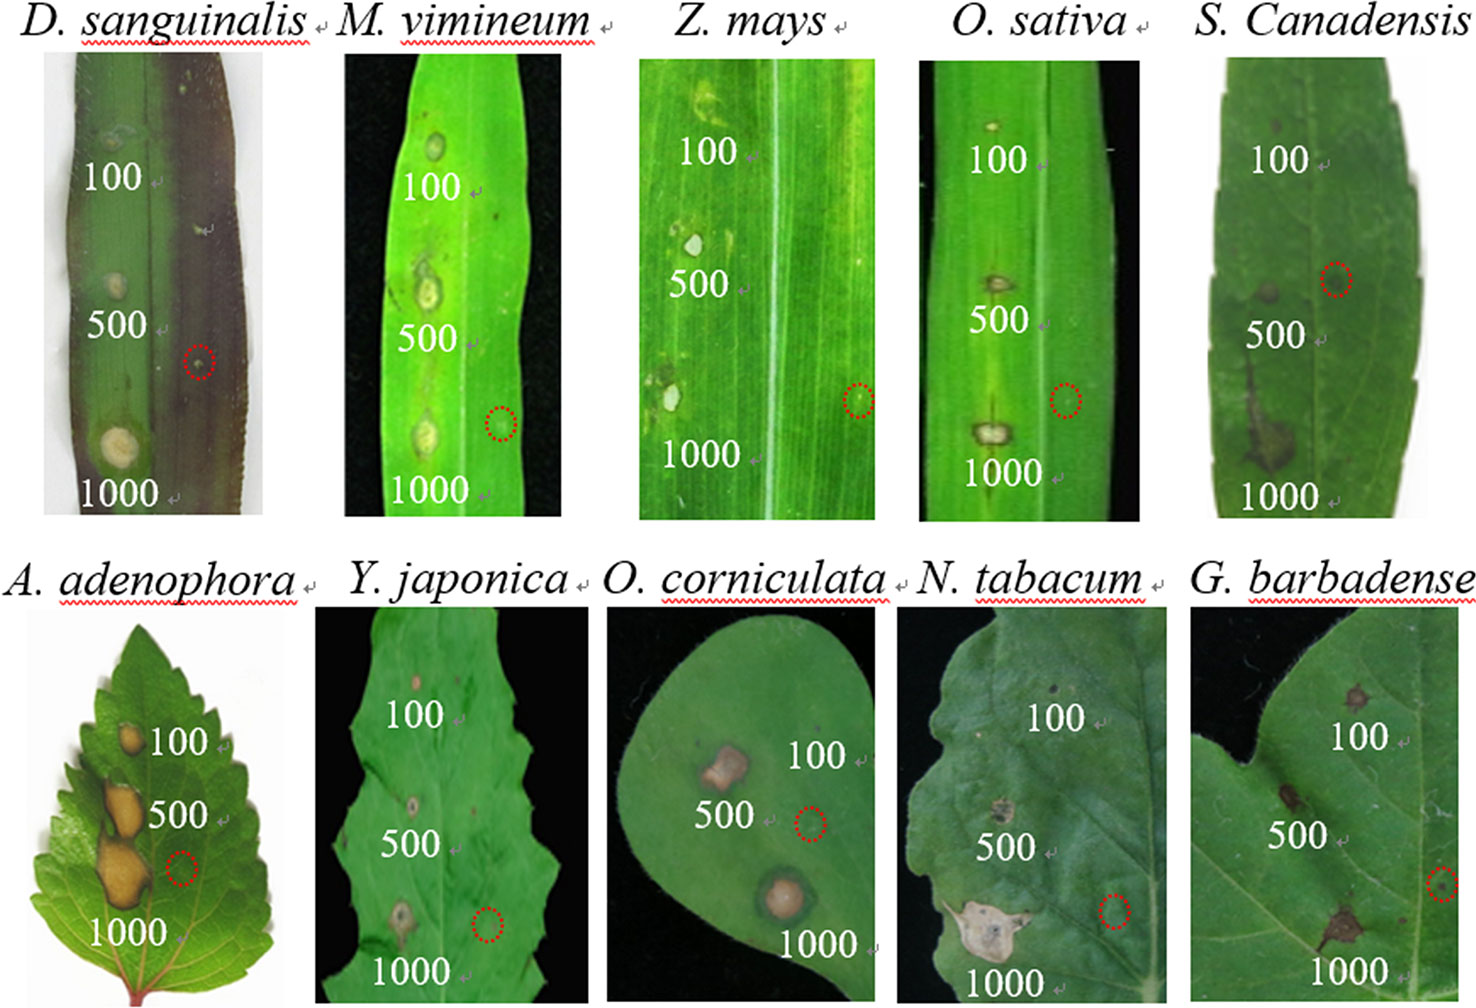
Figure 1 Disease development of the detached-leaves with Gliotoxin (GT). Leaves from 10 different plant species were treated without (1% DMSO as control, red circles on the right side) or with GT at various concentrations (100, 500, and 1,000 µM). Lesion photographs were taken at 96 h. Lesion diameter and pathogenicity level were analyzed in Table 2.
To further access pathogenicity level of GT, these ten plant species were classified into three categories according to the diameter of leaf lesions (Table 2). At 100 µM GT, A. adenophora leaves showed highly susceptible, where the diameter of the developed necrotic lesion in leaf blades was more than 3.0 mm. For lower susceptible D. sanguinalis, their leaves formed chlorotic lesions of less than 1.0 mm in diameter. The left eight species belonged to moderately susceptible category with leaf lesions between 1.0 and 3.0 mm in diameter, including monocotyledonous (e.g., M. vimineum, Z. mays, and O. sativa), and dicotyledonous plants (e.g., S. canadensis, Y. japonica, O. corniculata, N. tabacum and G. barbadense). Based on such standard, D. sanguinalis, O. sativa, G. barbadense leaves still show moderate pathogenicity level at higher concentrations of 500 even 1000 µM GT. Obviously, GT has good phytotoxicity to various monocotyledonous and dicotyledonous plants, leading to leaf lesion formation. It is also suggested that GT can damage photosynthetic tissues because chlorotic or necrotic lesions are evidence of chlorophyll destruction and cell death.
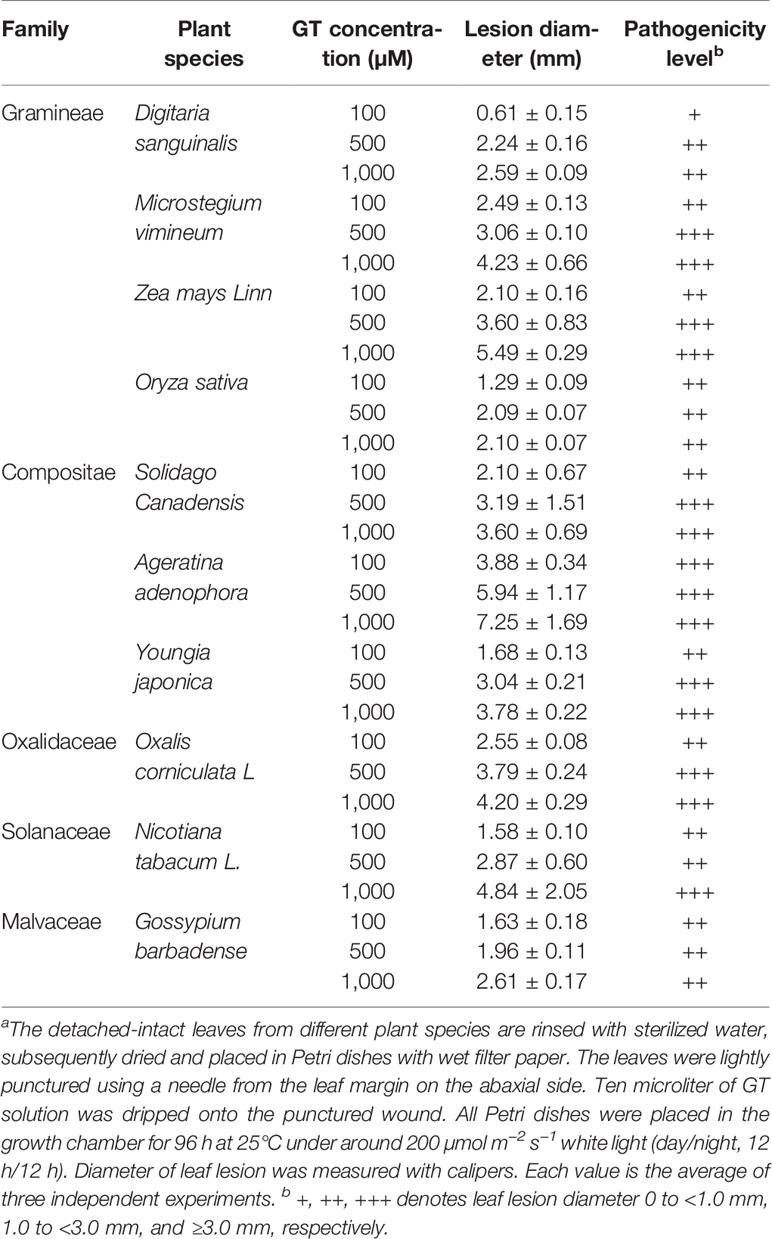
Table 2 Phytotoxicity of Gliotoxin (GT) to various plantsa.
GT Decreased the Oxygen Evolution Rate of C. reinhardtii
Influence of GT and DCMU on the rate of O2 evolution of C. reinhardtii cells is shown in Figure 2. DCMU inhibits O2 evolution much faster and at lower concentrations compared with GT. Almost 100% decrease in O2 evolution was observed in the case of 1 µM DCMU treatment. GT also caused a negative concentration-dependent effect on O2 evolution. More than 58% decrease in the O2 evolution rate had occurred when C. reinhardtii cells were exposed to 100 µM GT comparable to mock-treatment. The I50 (the concentration producing 50% inhibition) value of GT for the inhibition of O2 evolution in vivo was calculated to be around 60 µM. Clearly, GT is a weaker photosynthetic inhibitor relative to DCMU as an excellent photosynthetic inhibiting herbicide.
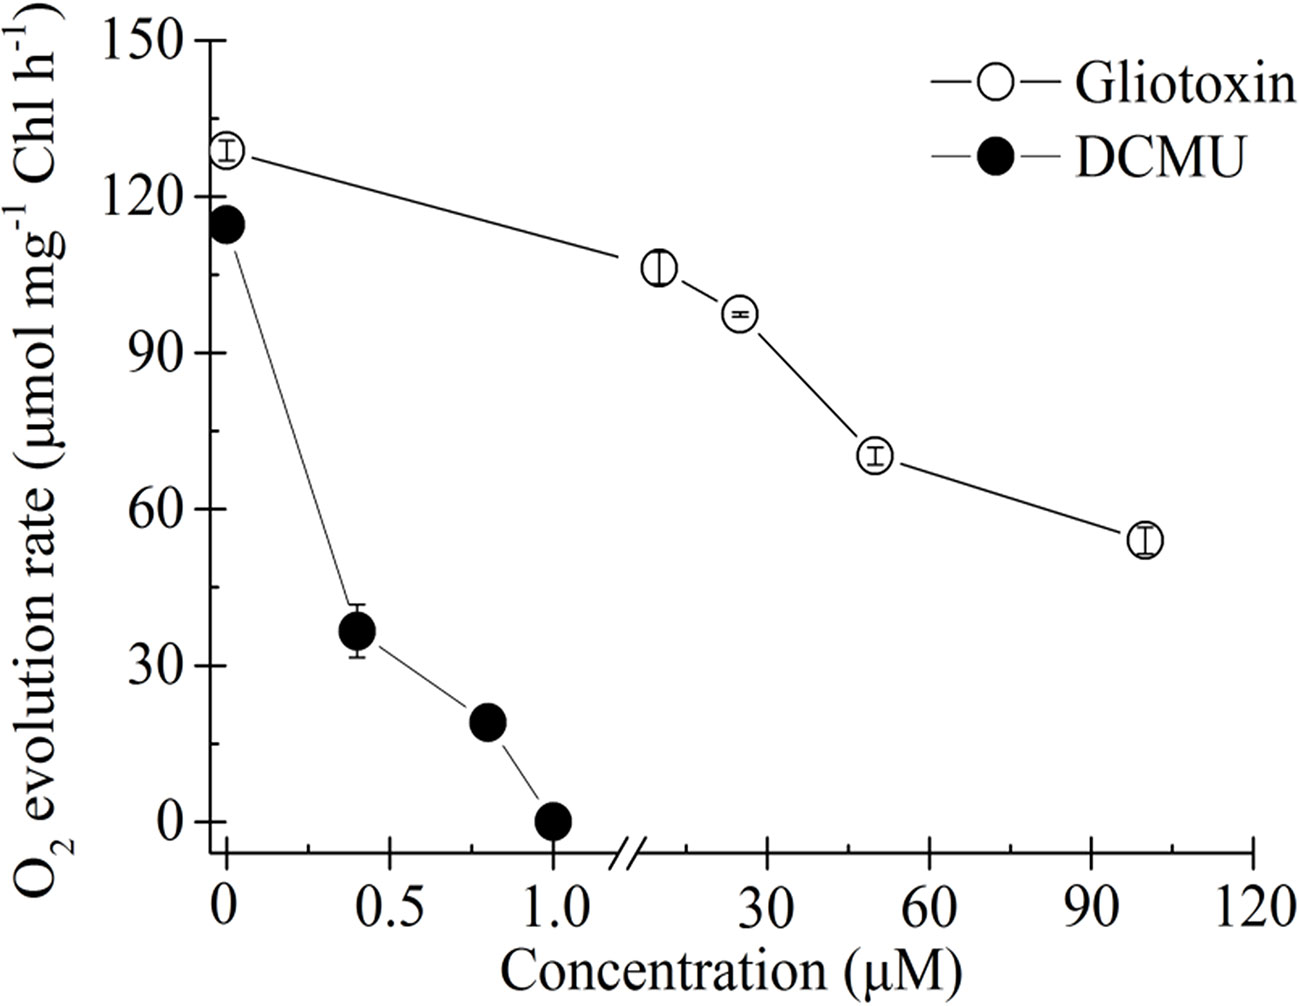
Figure 2 Effect of Gliotoxin (GT) and DCMU on the rate of O2 evolution of C. reinhardtii cells. H2O and p-phenylenediamine is the electron donor and acceptor, respectively. Data shown are mean values ± SE of 3 times independent measurements.
GT Inhibited Photosynthetic Activity of C. reinhardtii
Chlorophyll fluorescence is an indicator of plant photosynthetic activity. To test the effect of GT on photosynthesis of C. reinhardtii, the Imaging-PAM chlorophyll fluorometer was used to monitor the change of GT-induced fluorescence image parameters. As in Figure 3A, the representative color-coded images of four parameters, FO (when all PSII reaction centers are open after dark adaptation), FV/FM (the maximal PSII quantum yield), qP (the coefficient of photochemical quenching), and Yield (the effective PSII quantum yield), are shown after C. reinhardtii cells were treated with different concentrations of GT. It is observed that images of FO kept relatively stable in the presence of GT, images of FV/FM and Yield as well as qP also did not been affected in the case of 10 and 50 µM GT treatment. At 100 µM GT-treated C. reinhardtii cells, images of FV/FM and Yield faded from blue for mock to green, images of qP became purple colors from white colors. The results are strongly supported by the values of fluorescence parameters FV/FM, Yield and qP (Figure 3B). About 36% and 38% decrease in FV/FM and Yield, respectively, was observed relative to mock-treatment after 100 µM GT treatment, suggesting high concentration of GT declined the quantum efficiency of light energy transfer in PSII. The value of qP was 0.86 for mock-treatment, and was 0.60 for 100 µM GT-treatment. qP denotes the proportion of excitons captured by open traps and being concerted to chemical energy in the PSII reaction center (Krause and Weis, 1991). In addition, the parameter ETR, expressing the apparent rate of photosynthetic electron transport, exhibited a rapid concentration-dependent decrease by increasing of GT concentration (Figure 3B). After C. Reinhardtii cells were incubated by 10, 50, and 100 µM GT, the mean of ETR was declined by around 29%, 52.%, and 100% by comparison with mock-treatment, respectively. The I50 value for ETR is about 50 µM, which is closed to the I50 value for O2 evolution rate. An approximately linear lower in ETR and O2 evolution rate indicates that the inhibition of PSII electron transport should be the important action site of GT on photosynthetic apparatus. Considering above results, it is concluded that GT can affect photosynthesis of C. Reinhardtii mainly due to inhibiting PSII electron transport.
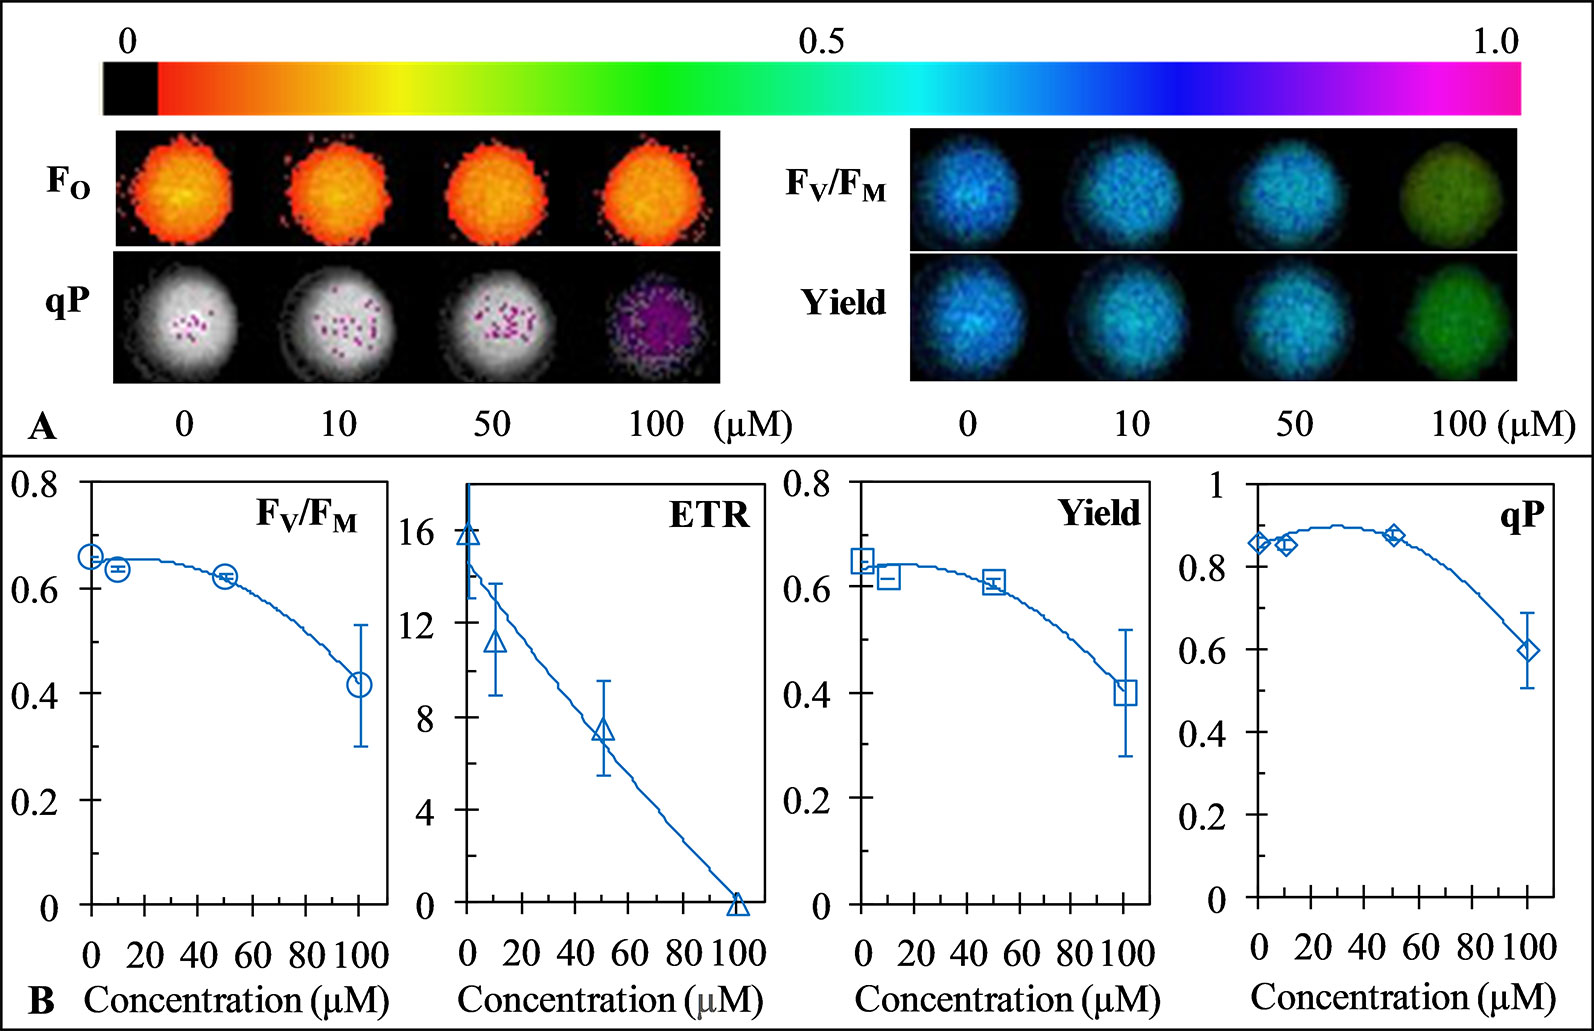
Figure 3 Effect of Gliotoxin (GT) on color fluorescence imaging (A) the value of the maximum quantum yield of PSII (FV/FM), electron transport rate (ETR), Yield and qP (B) of C. reinhardtii cells. Fluorescence images were indicated by color code in the order of black (0) through red, orange, yellow, green, blue, violet to purple (1). The number codes above images are marked from 0 to 1, showing the changes. Each value is the average ± SE of three independent experiments.
Action Sites of GT on Photosystem II and Photosystem I of C. reinhardtii
In the last two decades, fast chlorophyll a fluorescence rise kinetics OJIP and JIP-test analysis has been widely used to probe the structure, conformation and function of the photosynthetic apparatus (Strasser et al., 1995; Strasser et al., 2004). To further investigate the precise action sites of GT on photosynthesis, the fluorescence rise kinetics OJIP of C. reinhardtii cells were measured after GT treatment for 3 h with different concentrations (Figure 4).
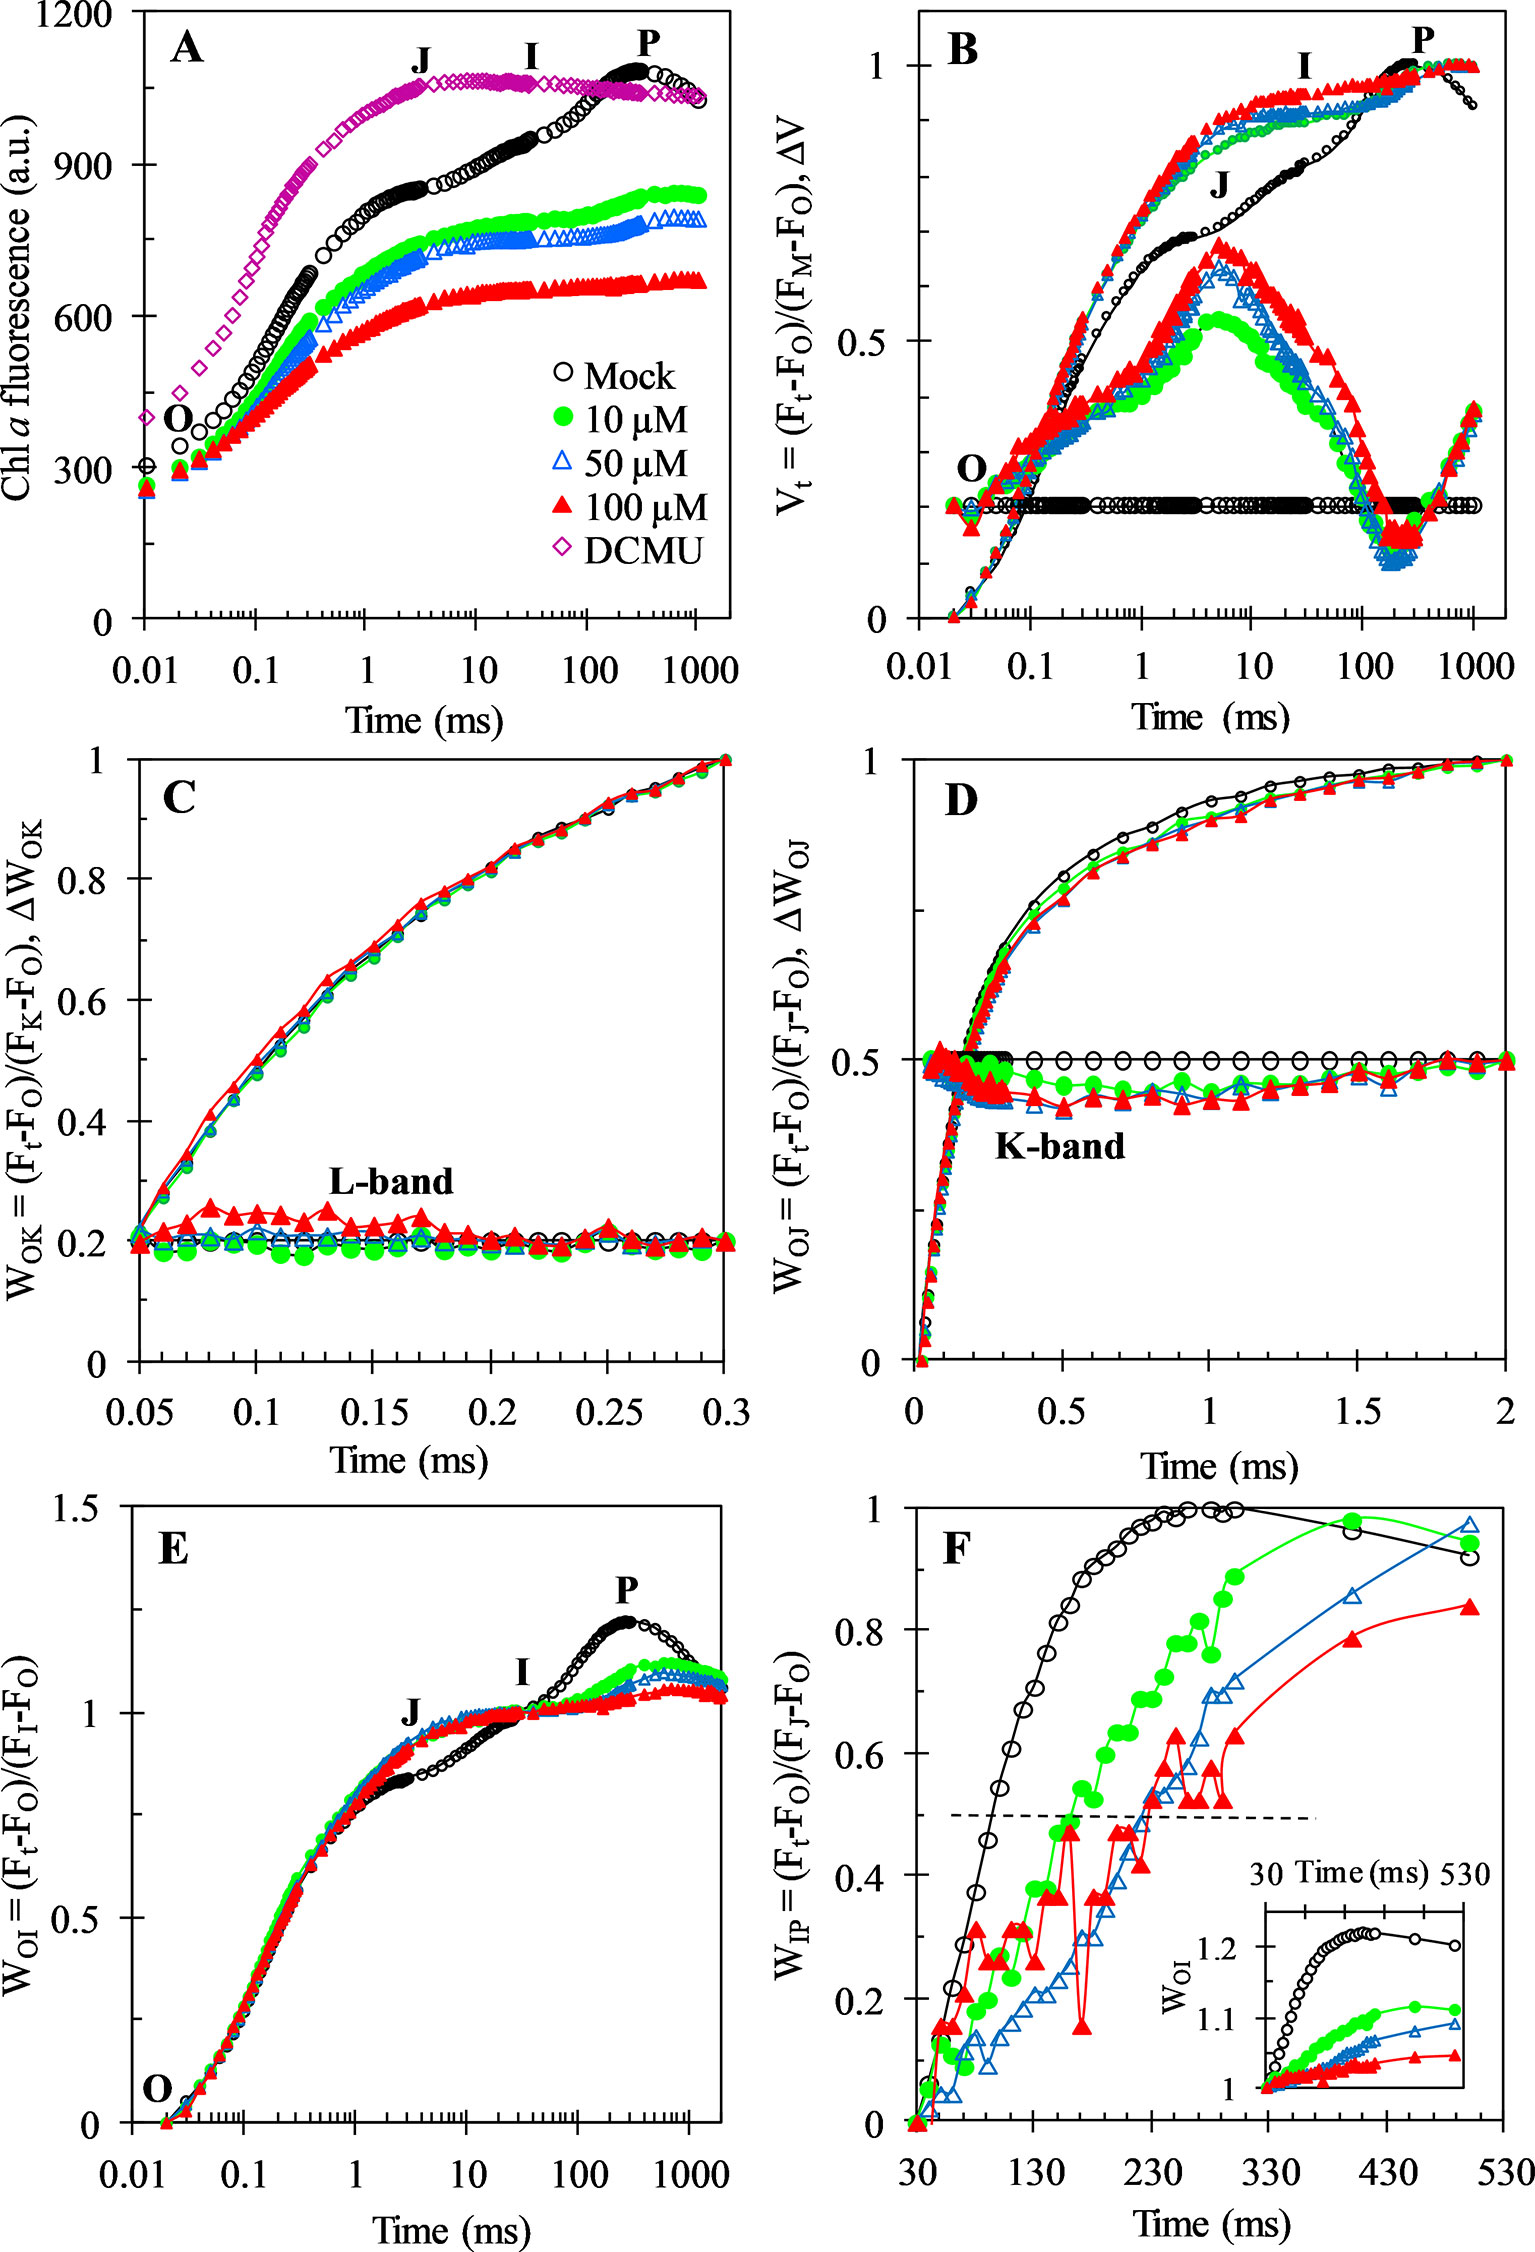
Figure 4 Chl a fluorescence rise kinetics of C. reinhardtii cells treated with 1% DMSO (mock), DCMU (1 μM), and Gliotoxin (GT) at the indicated concentrations. (A) Raw fluorescence rise kinetics. (B) Fluorescence rise kinetics normalized by FO and FM as Vt = (Ft − FO)/(FM−FO) (top), and ΔVt = Vt(treated) − Vt(control) (bottom). (C) Fluorescence rise kinetics normalized by FO and FK as WOK = (Ft − FO)/(FK − FO) (top), and the difference kinetics ΔWOK = WOK(treated) − WOK(control) (bottom). (D) Fluorescence rise kinetics normalized by FO and FJ as WOJ = (Ft − FO)/(FJ − FO) (top), and the difference kinetics ΔWOJ = WOJ(treated) − WOJ(control) (bottom). (E) Fluorescence rise kinetics normalized by FO and FI as WOI = (Ft − FO)/(FI − FO). (F) Fluorescence rise kinetics normalized by FI and FP as WIP = (Ft − FI)/(FP − FI) and WOI (≥1) in the insert, the half-times are shown by the crossing of the curves with the horizontal dashed line drawn at WIP = 0.5 (half rise). Each curve is the average of 30 measurements.
As shown in Figure 4A, the fluorescence rise OJIP curve of mock-treatment is a typical polyphasic O-J-I-P shape. GT and DCMU treatment led to a distinct change of the fluorescence rise OJIP curve of C. reinhardtii cells. After 1 μM DCMU treatment, the biggest change of fluorescence rise OJIP curve is that the J-step increased quickly equal to the P level (FM). A rapid rise of the level of J-step is a result of the large accumulation of QA- in PSII RCs, which attributes to the interruption of the electron flow from QA to QB (Strasser and Govindjee, 1992; Strasser et al., 2004). For GT, it is observed that the variable Chl fluorescence intensity (Ft) and FM decreased significantly, and the I- and P-steps disappeared gradually by increasing treatment concentration. A decrease in FM might be relative to the quenching of fluorescence, which is resulted from the presence of an oxidized plastoquinone pool or to the damage of the structure and function of PSII antennae (Tóth et al., 2005).
For investigation of the detailed effect of GT on Chl a fluorescence rise kinetics OJIP properties, the fluorescence curves were double normalized by FO and FM, and presented as relative variable fluorescence Vt (top) and ΔVt = Vt(treated) − Vt(control) (bottom) versus logarithmic time scale (Figure 4B, the “control” is the mock-treated samples). This allows to find richer information that usually were hidden in the actual fluorescence rise kinetics curve. The data from the Vt and ΔVt show that the most major effect of GT on the fluorescence rise kinetics is a rapid increase of the J-peak. This is equivalent to the DCMU behavior. To analyze GT-treated cells for events, reflected in the OK, OJ, OI, and IP phase, other normalizations of the fluorescence rise kinetics were also conducted (Figures 4C-F). In Figure 4C, the fluorescence rise kinetics data were double normalized by FO and FK as WOK (top) and plotted with ΔWOK = WOK(treated) − WOK(control) (bottom) to show L-band. The L-band is an indicator of the energetic connectivity or grouping of the PSII units, being higher when connectivity or grouping probability is lower (Strasser et al., 2004). Our data reveal that L-band is low sensitive to different concentration of GT. In Figure 4D, the fluorescence rise kinetics normalized by FO and FJ as WOJ in the linear time scale from 10 μs to 2 ms is presented. No clear effect on the OJ phase was observed after C. reinhardtii cells were incubated by GT. Based on the ΔWOJ = WOJ(treated) − WOJ(control), it is seen that GT just caused a very slight negative influence on the K-band (Figure 4D). The OJ phase is largely driven by primary photochemistry, the JP phase is dominated by the biochemical reaction (Strasser et al., 2004). So, it seems reasonable that the mainly influence of GT is on the biochemical reaction after QA not the primary photochemical reaction. Figure 4E shows that the fluorescence rise kinetics were double normalized by FO and FI as WOI. The J-peak of GT-treated curves exhibited a significant increase compared with that of mock. At the same time, the WOI (only the part ≥ 1 is shown), in the linear 30–530 ms time range, was also plotted in the insert in Figure 4F. The I-step reflects the kinetic bottleneck of the electron chain between PQH2 and cytochrome (cyt) b6f (Strasser et al., 2010). The IP phase is related to electron flow through PSI and inactive ferredoxin-NADP+-reductase (FNR) at the acceptor side of PSI (Schansker et al., 2005). It reflects the electron flow from PQ pool to the end electron acceptors at the PSI acceptor side. For each WOI curve, the maximal amplitude of the fluorescence rise from I- to P-step reflects the size of the pool of the end electron acceptors at PSI acceptor side (Yusuf et al., 2010; Chen et al., 2016). It is demonstrated that GT resulted in a decrease of this pool size since the WOI (≥ 1) curves of GT-treated samples have smaller IP amplitude compared to mock. To further assess the effect of GT on the IP phase, the fluorescence data were normalized by FI and FP, as WIP = (Ft – FI)/(FP – FI), and plotted in a linear time scale from 30 to 530 ms (Figure 4F). Yusuf et al. (2010) suggested that the reduction rate of PSI end electron acceptors’ pool in different treatments can be estimated by the half-time, which is the time point at WIP = 0.5 (half rise of the curves). A bigger (or less) value of the half-time means a lower (or higher) conduction rate. Here, it is observed that GT caused a distinct increase of the half times relative to mock. This indicates that GT can decline the rate of the reduction of the end electron acceptors on PSI possibly or/and inactivate FNR.
In Figure 5, several representative JIP-test parameters are presented for further analysis of the behavior of GT-treated C. reinhardtii cells. In these parameters, VK (relative variable fluorescence at the K-step) and VJ (relative variable fluorescence at the J-step) increased after GT treatment. However, combining with the stable parameter FK/FJ, it’s clear that the increase of VK is caused by the increase of FJ. Actually, GT has no significant influence on the K-step. It has been suggested that the K-step is a signal of the inactivation of the oxygen-evolving-complex (OEC) (Strasser et al., 2004). Thus, the major impact of GT is a rise of the J-step level, suggesting a large accumulation of QA- occurred in PSII RCs due to inhibition of PSII electron transfer activity. In fact, it is seen that all parameters involved electron transport, ET0/CS (electron transport flux per CS), φEo (the quantum yield for PSII electron transport), and ψEo (the probability that a trapped exciton moves an electron into the electron transport chain beyond QA), show dramatic reduction in the presence of GT. However, GT can’t inhibit entirely PSII electron transport activity in vivo. At 100 μM GT, φEo and ψEo just decreased by around 56% and 43% relative to the mock (Figure 5). Since GT blocked PSII electron transfer further than QA, inactivation events of PSII RCs are expected to happen. Data from Figure 5 show that the number of active PSII RCs per cross-section (RC/CS) decreased quickly after GT treatment. Sm/tFM, expressing the average fraction of open RCs of PSII in the time interval from 0 to tFM (Strasser et al., 2004), is shown. By increasing treatment concentration, an approximately linearly sharply decrease of Sm/tFM is observed. The Sm/tFM ratio of GT-treated cells was about 54% (10 μM), 62% (50 μM), and 74% (100 μM) lower than that of mock, respectively. This means that GT caused the faster closure of PSII RCs. The fraction of QA-reducing centers were also calculated according to the reference (Chen et al., 2014), as follow: QA reducing centers = [(RC/CS)treatment/(RC/CS)control]. [(ABS/CS)treatment/(ABS/CS)control]. It is found that the fraction of QA-reducing centers reduced quickly after 3 h treatment of GT with different concentrations (Figure 5). The data indicate that GT inactivated indeed the RCs of PSII in vivo. In contrast with QA-reducing centers, GT treatment increased the fraction of non-QA-reducing centers (data not shown). Non-QA-reducing centers, also so-called heat sink centers, are radiators and often are used to protect the system from over excitation and over reduction which would create dangerous ROS (Strasser et al., 2004; Chen et al., 2014).
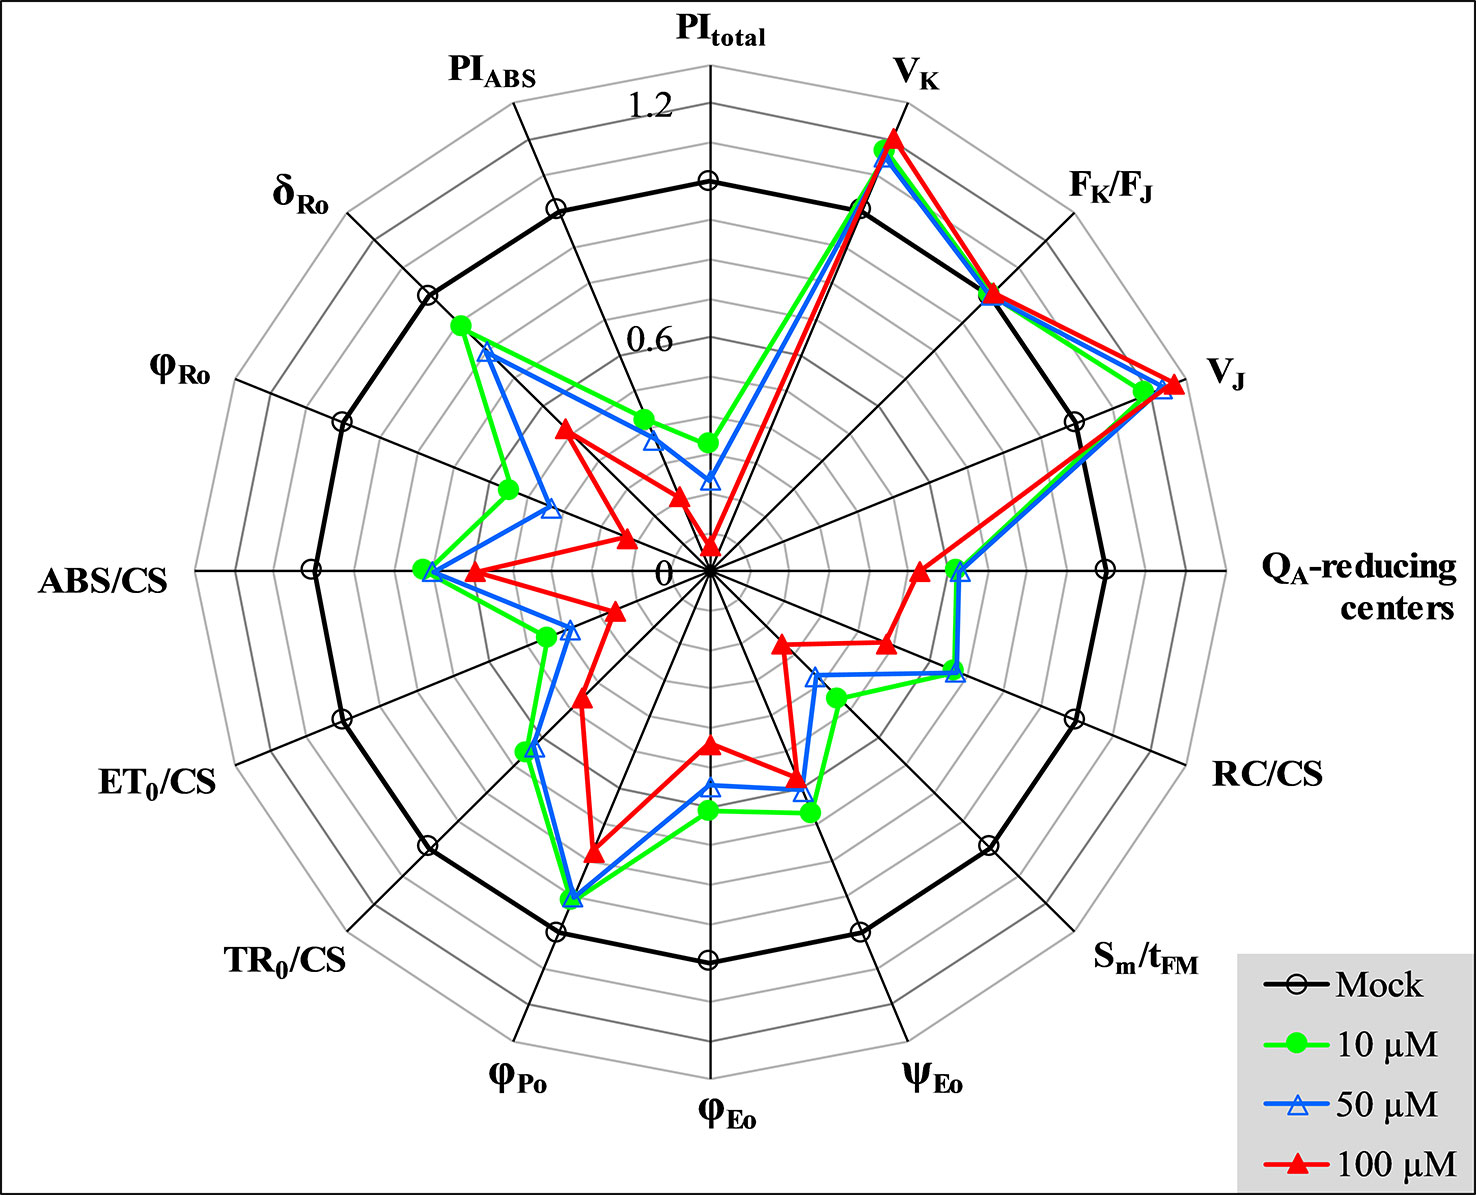
Figure 5 Spider plot presentation of selected parameters derived from JIP-test quantifying PSII behavior of C. reinhardtii cells treated with various concentrations of GT. Each parameter is expressed as fraction relatively to the values of the control (mock, back regular circle with value 100% = 1).
In addition, the maximum quantum yield of PSII primary photochemistry (φPo) shows a slight decrease after C. reinhardtii cells were treated with GT in vivo. The value of two parameters, ABS/CS and TR0/CS decreased greatly. ABS/CS refers to the total absorption flux per PSII cross-section, and can be taken as a measure for an average antenna size or chlorophyll concentration (Srivastava et al., 1998; Strasser et al., 2004). TR0/CS expresses the trapped energy flux per PSII cross-section, reflecting the specific rate of the exciton trapped by open RCs (Strasser et al., 2004). A significant decrease of ABS/CS and TR0/CS indicates that GT not only lowered the chlorophyll concentration, but damaged the conformation of the antenna pigment assemblies and reduced the efficiency of light energy transfer between antenna pigment molecules and from those to the PSII RCs. This might be also a possibility for decreasing of the variable Chl fluorescence intensity (Ft) and the FM value. With respect to the performance index PIABS, the parameter is a product of the three independent parameters φPo, ψEo, and γRC. Here, γRC is the fraction of RC chlorophyll in relation to total chlorophyll (Strasser et al., 2004; Table 1). So, PIABS is extremely sensitive to different stresses, expressing the overall photosynthetic activity of PSII (Strasser et al., 2004). When cells were exposed to 10, 50, and 100 μM GT, the value of PIABS decreased by 58%, 63%, and 79% compared to the mock, respectively. It is proved that GT can strongly inhibit PSII photosynthetic activity of C. reinhardtii. Moreover, PIABS is much higher sensitive to GT treatment than these three parameters (φPo, ψEo, and γRC) that contribute to this index and even PSII O2 evolution rate (Figures 2 and 5). This might be interpreted by the reason that the inhibition of PSII electron transfer activity is the dominant factor not the only one for the decrease of the overall photosynthetic activity of PSII after GT treatment.
After C. reinhardtii cells were treated with various concentrations of GT, both φRo and δRo show a significant decrease. The value of φRo reduced to 54% (10 μM), 44% (50 μM), and 23% (100 μM) of the mock, respectively (Figure 5). For 10 μM and 50 μM GT treated cells, δRo only lowered 12% and 20%. Under 100 μM GT treatment, δRo has 48% distinct decrease. φRo is the product of φPo, ψEo, and δRo, expressing that the quantum yield for the reduction of the end electron acceptors at the PSI acceptor side (Strasser et al., 2010). Here, δRo is given as δRo = RE0/ET0 = (1−VI)/(1−VJ). δRo is used as the probability that an electron is transported from the reduced intersystem electron acceptors to final electron acceptors of PSI (Strasser et al., 2010). A significant decrease of φRo and δRo suggests that GT inhibits the reduction of the end acceptors at the PSI electron acceptor side. This is well in agreement with that GT-treated cells have a smaller IP amplitude during Chl fluorescence transient (Figure 4F). Ceppi et al. (2012) suggested that the IP amplitude is a semiquantitative indicator for relative changes in the PSI content. A smaller IP amplitude is related to a loss of PSI content (Oukarroum et al., 2009; Ceppi et al., 2012). A decrease of PSI content is due to increased level of PSI produced oxygen radicals (Mittler, 2002; Oukarroum et al., 2009). A block of electron flow on the acceptor side of PSI will divert electrons from the PSI acceptor side, that normally goes to carbon fixation path, to reduce O2 generating ROS (Chen et al., 2012). Another possible explanation for the decrease in IP amplitude would seem to be a loss of cyt b6/f complexes. Because the loss of cyt b6/f complexes could make the rate limitation posed by the re-oxidation of PQH2 stronger and as a consequence shift the I-step up. This could also lead to a smaller IP amplitude not directly relative to a loss of PSI (Ceppi et al., 2012). The performance index PItotal incorporates two parameters PIABS and δRo, reflecting the whole photosynthetic activity of two photosystems (Strasser et al., 2010). Here, PItotal is the most sensitive JIP-test parameter. After cells were treated with 10, 50, and 100 μM GT, PItotal declined to about 33%, 24%, and 7% of mock.
Fluorescence rise from I- to P-step lasts normally from around 30 to 200 ms and is shown to parallel the re-reduction of plastocyanin (PC+) and PSI reaction center (P700+) (Strasser et al., 2010). Here, in order to further confirm the effect of GT on PSI, the modulated reflection at 820 nm (MR) of C. reinhardtii cells was determined. As shown in Figure 6A, a typical MR signal curve exhibits two phases: a fast decrease phase between MR0 (about 0.7 ms) and MRmin (about 10–200 ms), and a slow increase phase between MRmin (about 10–200 ms) and MRmax (about 1–2 s). The fast phase corresponds to the accumulation of PC+ and P700+. The transitory steady state of MR kinetics at the end of the fast phase, MRmin, appears due to the accumulation of PSII initiates electron transfer to PC+ and P700+ just compensates the further oxidation of PC and P700 by PSI activity. In other words, at the MRmin point the non-cycle electron flow through PSII and PSI achieved the balance level. Once the reduction rate overcomes the oxidation rate, the slow MR phase comes out. The slow phase corresponds to the net re-reduction of PC+ and P700+ by the intersystem electron carriers (Strasser et al., 2010; Goltsev et al., 2012). At 100 μM GT, 1 μM DCMU, and 200 µM MV, a similar the fast phase of MR/MR0 kinetics of cells was observed compared to mock, reflecting no effect on the capability of P700 to get oxidized. For MV as a PSI herbicide, it gets electrons from PSI electron transport chain at the nearly same rate as PSII is pumping them to the PSI (Schansker et al., 2005). Therefore, the MR signal of MV-treated cells remained the steady same level as the MRmin after the end of the fast MR phase (Figure 6B). However, the slow MR phase of DCMU-treated cells was losing, suggesting the complete disconnection of two photosystems (Figure 6B). In the presence of DCMU, the fast MR phase continnued to go down, revealing a further more oxidation of PC and P700. This is because that DCMU can prevent entirely PSII electron flow from reaching the PC and P700 and oxidating them (Schansker et al., 2003). A smaller slow MR phase reveals a lower rate of the net re-reduction of PC+ and P700+ in the case of GT with 100 and 200 μM. Obviously, unlike DCMU, GT could not completely inhibt electron flow from PQ at PSII acceptor side to PC+ and P700+ since the slow MR phase did not disappear. At higher concentration of 200 μM GT, a pronounced decrease of the fast MR phase was also observed, indicating the capability of P700 to get oxidized was markedly decreased (Figure 6B). Considering the decrease in the IP amplititude of OJIP curve, it is suggested that GT cause a loss of PSI active contents and disconnection of two photosystems.
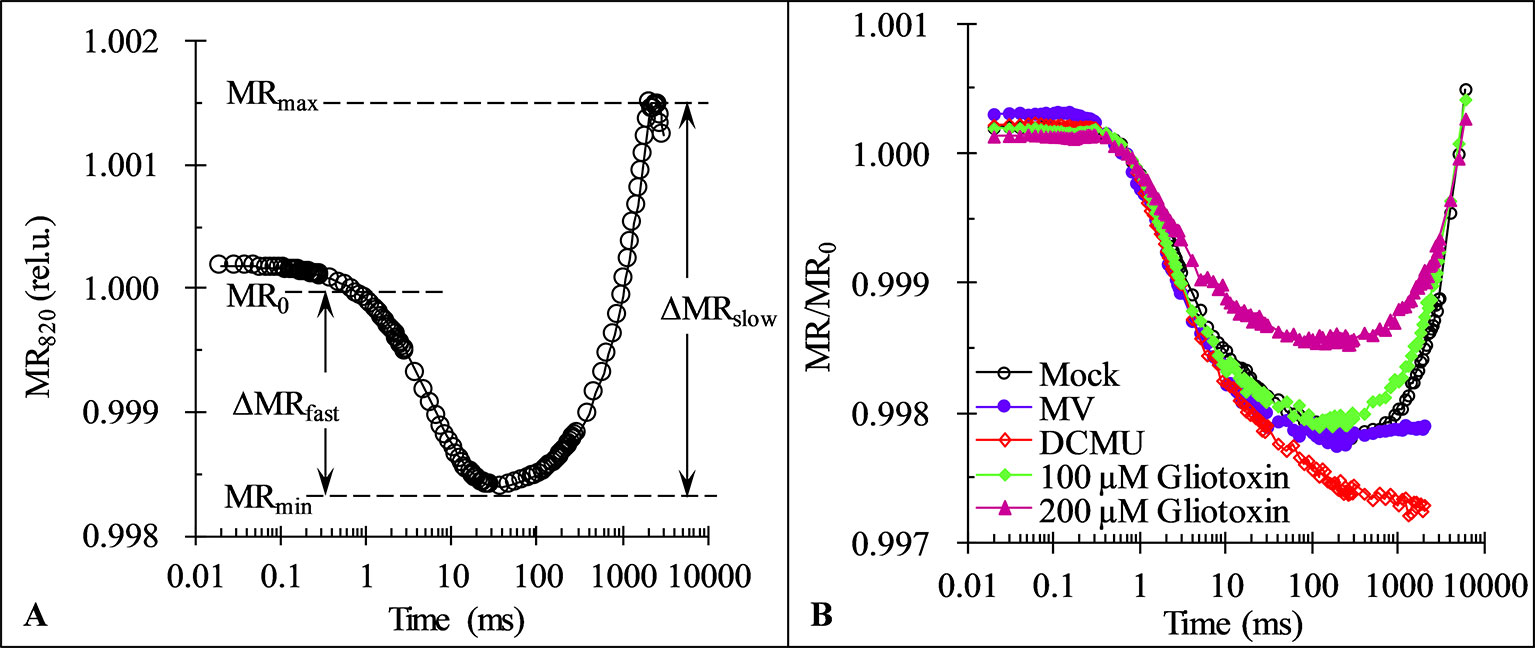
Figure 6 Effect of Gliotoxin (GT) on the kinetics of modulated reflection at 820 nm (MR). (A) A graphical definition of the characteristic parameters of the MR kinetics. Here, MR0 is the value at the onset of the actinic illumination (taken at 0.7 ms, the first reliable MR measurement), MRmin is the minimal signal reached during the fast phase between 0.7 ms and 10–200 ms, MRmax is the maximal signal reached by the end of the slow phase (usually taken at 1 to 2 s). (B) The MR induction curves of C. reinhardtii cells treated with 1% DMSO (mock), MV (200 µM), DCMU (1 μM), and GT (100, 200 µM). The plotted values are expresses by the MR/MR0 ratio. Each curve is the average of 30 measurements.
On the basis of above analysis of C. reinhardtii cells in vivo, it is concluded that the major action site of GT is the acceptor side of PSII, blocking electron transfer further than QA and then inactivating PSII RCs. In addition, GT can also destroy the antenna pigment assemblies and damage the reduction of the end acceptors at the PSI acceptor side.
Effects of GT on Photosystem II and Photosystem I of Spinach Thylakoids
To more in-depth investigate the direct action sites of GT on two photosystems, Chl fluorescence rise kinetics OJIP of spinach thylakoids were measured and analyzed. As C. reinhardtii cells in vivo, the best biggest change of the fluorescence rise OJIP curves of GT-treated thylakoids is a significant rise of the J-step level (Figures 7A, B). A similar effect of GT is also found on JIP-test parameters including φPo, ET0/CS, φEo, ψEo, Sm/tFM, PIABS, φRo, and δRo (Figures 5 and 7C). Moreover, the J-step level (VJ), PIABS, and Sm/tFM are linearly related to φEo by increasing of GT concentration (Figure 7E). Such results further prove that GT mainly inhibits the PSII overall activity by inactivating PSII RCs due to interruption of PSII electron transfer beyond QA at the acceptor side. Concerning the values of δRo, the inhibition of the reduction of the end acceptors at the PSI electron acceptor side is another action site of GT at high concentration above 100 μM. The conclusion is consistent with the previous analysis of the MR820 kinetics. However, unlike C. reinhardtii cells, evidence from ABS/CS and TR0/CS shows that no remarkable direct influence on the chlorophyll concentration and antenna pigment assemblies of PSII was observed in GT-treated spinach thylakoids (Figure 7C). Another expression ABS/RC, being taken a calculated average amount of chlorophyll which channels excitation energy into RC (Srivastava et al., 1998), also did not respond to different concentrations of GT treatment. Consequently, it is assumed that the damage of PSII antenna pigment assemblies in GT-treated C. reinhardtii cells in vivo might be an indirect effect of ROS production attributed to inactivation of PSII RCs and inhibition of the reduction of the end acceptors at the PSI acceptor side. It is further supported by the evidence from SDS-PAGE of thylakoid membrane proteins. After 50, 100, 200, and 400 μM GT treatment, the content of major PSI and PSII polypeptides, including PSI core peptide PsaA/B, D1/D2 dimer, PSII core antenna chl-binding protein (CP47, CP43, and CP29) and OEC 33 kD, did not show remarkable differences compared with the mock and DCMU treatment (see Figure S1). It is indicated that GT does not alter directly thylakoid polypeptide composition.
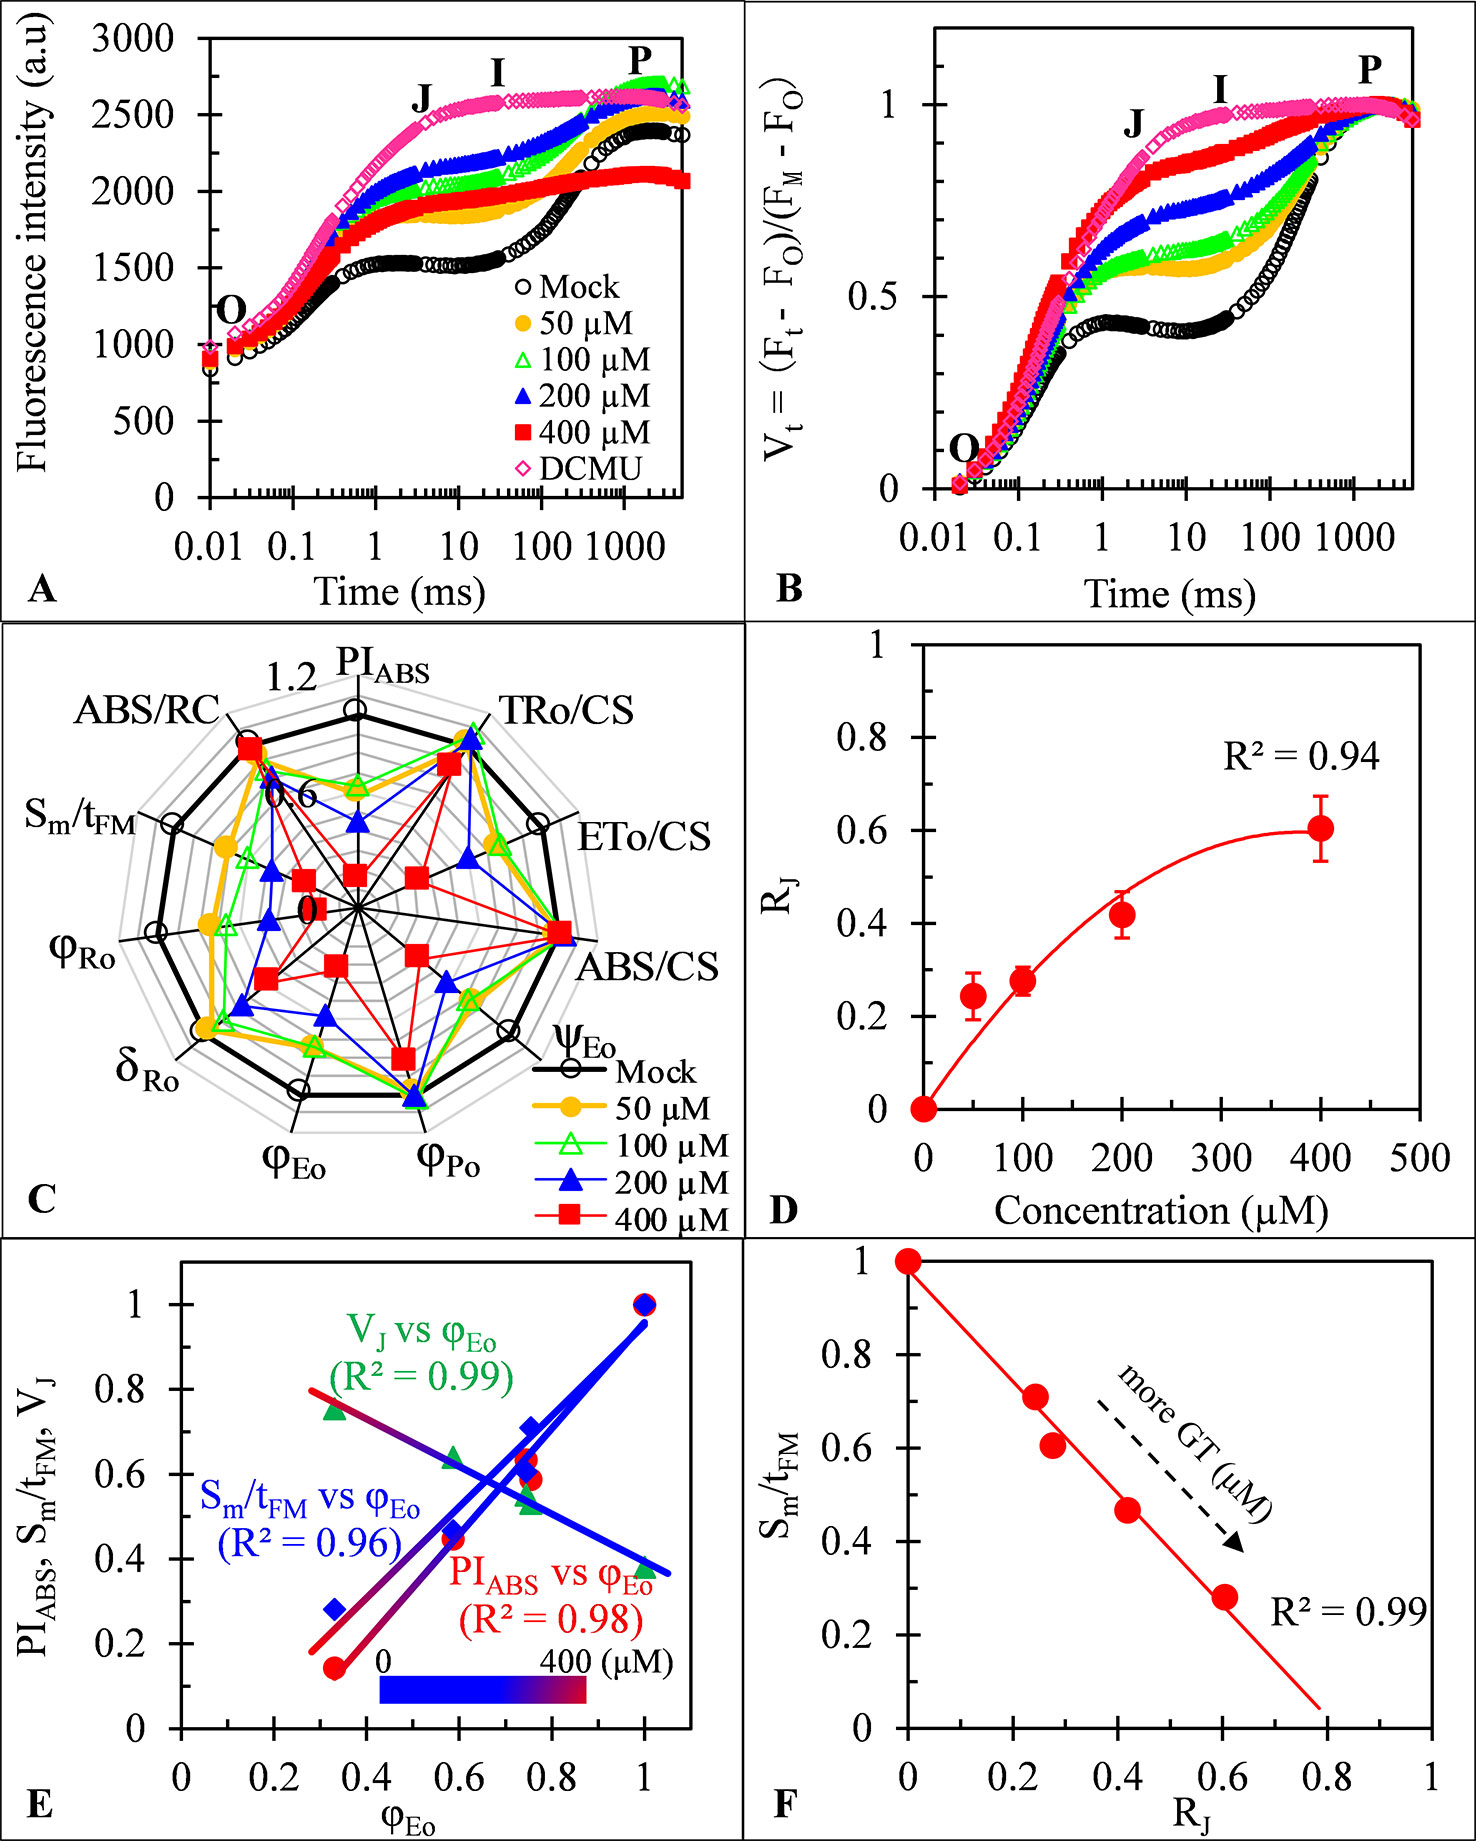
Figure 7 Effect of Gliotoxin (GT) on spinach thylakoids. (A) Raw fluorescence rise kinetics of thylakoids treated with 1% DMSO (mock), DCMU (1 μM), and GT at the indicated concentrations for 0.5 h. (B) Fluorescence rise kinetics normalized by FO and FM as Vt = (Ft − FO)/(FM−FO). (C) Radar plot presenting the JIP-test parameters from thylakoids with different concentrations of GT. (D) The concentration-dependent change of RJ. The parameter RJ reflects the number of PSII RCs with their QB site filled by PSII inhibitors (here is GT). (E) Analysis of the correlation for VJ, PIABS, and Sm/tFM versus φEo of spinach thylakoids treated with GT at different concentration (mock, 50, 100, 200, and 400 μM). (F) Analysis of the linear relationship between Sm/tFM and RJ after spinach thylakoids were treated with GT. Each value is the average of 30 measurements.
Previous evidence has tangibly demonstrated that PSII inhibiting herbicides lead to inactivation of PSII RCs for blocking electron flow beyond QA due to the QB-site of D1 protein occupying by herbicide molecules (Lazár et al., 1998; Oettmeier, 1999). Based on the JIP-test, the parameter RJ is derived, which represents the number of PSII RCs with QB-site filled by PSII inhibitor (Table 1; Lazár et al., 1998; Chen et al., 2014). The data in Figure 7D show that the value of RJ increases with the increasing concentration of GT. After spinach thylakoids were incubated with GT for 0.5 h, the amount of PSII RCs with QB-site filled by GT was about 24% (50 μM), 28% (100 μM), 42% (200 μM), and 60% (400 μM), respectively. There is a visible concentration-dependent enhancement of GT bound to PSII RCs. A highly negative correlation between Sm/tFM (average fraction of open PSII RCs) and RJ was observed in the presence of GT (Figure 7F). This suggests that GT-caused severe closure of PSII RCs is because of an enhancement of the number of PSII RCs with the QB-site filled with GT.
Obviously, one of the most important primary action sites of GT is perhaps the QB-site of PSII RCs. GT decreases the photosynthetic activity by inhibiting electron flow beyond QA at the acceptor side of PSII for its binding to the PSII RCs with QB-site.
GT Binding Niche At the QB-Site of the D1 Protein
Generally, herbicides that target PSII interrupt linear electron transport at the acceptor side of PSII by replacing with native PQ for the QB-site of D1 protein (Oettmeier, 1999). The D1 protein in higher plant is called L-subunit protein in the photosynthetic bacteria. It contains five trans-membrane α-helices and several short nonmembrane helices between the transmembrane helices (Xiong et al., 1996; Kamiya and Shen, 2003). The QB-site just falls between the helices IV and V of the D1 protein from phenylalanine (Phe211) to leucine (Leu275), which is also called the site of PSII herbicide binding (Xiong et al., 1996; Ke, 2001; Trebst, 2008).
Above evidence from Chl fluorescence rise kinetics shows that GT may be like DCMU to inhibit PSII electron transfer beyond QA by occupying the QB-site. In order to get further proof to support this hypothesis, GT was modeled its position in the QB-site at spinach D1 protein using Discovery Studio version 3.5. Meanwhile, to ensure reliability of this method, the simulated modeling of classical herbicide atrazine and DCMU binding to the QB-site was also established based on the available experimental and theoretical data. First, the standard modeling of atrazine to the QB-site was simulated according to the crystal structure information of complexes of the bacterial Rps. viridis RC with atrazine (5PRC) and spinach D1 protein (3JCU). It is found that a hydrogen bond can be formed between N-3 of the atrazine ring system and Ile224 of the L-subunit. A second hydrogen bridge between the ethylamino hydrogen (NH) of atrazine and Ser223 of the L-subunit is observed (Figures 8A, B, Table 3). Furthermore, Phe216 of the L-subunit is involved in atrazine binding by both π-electron systems (Figures 8A, B). In addition, four residues, L-His190, L-Asn213, L-Tyr222, and L-Gly225 of the ligand with atrazine are also identified. The results are quite matched with previous studies from X-ray crystal and resistance mutant reports (Oettmeier, 1999; Lancaster and Michel, 1999). Figure 8C depicts a homology sequence comparison between the L-subunit from Rps. viridis and the D1 protein from C. reinhardtii and spinach. The counterparts of L-Phe216, L-Ser223, and L-Ile224 in the L-subunit, as atrazine binding residues, are just D1-Phe255, D1-Ser264, and D1-Asn266 in the D1 protein. Thereinto, D1-Ser264 is the most important for atrazine resistance (Oettmeier, 1999). In modeling of atrazine docking to the D1 protein of spinach (3JCU), D1-Ser264 and D1-His252 are defined as the active sites (Figures 8A, B). D1-Ser264 interacting with atrazine is the same as L-Ser223 in the L-subunit. Interestingly, N-1 of the atrazine ring system also provides a weak hydrogen bond to D1-Ser264. Another hydrogen bond is formed between N-3 of the atrazine ring system and D1-His252 not D1-Asn266 corresponding L-Ile224 in the L-subunit.
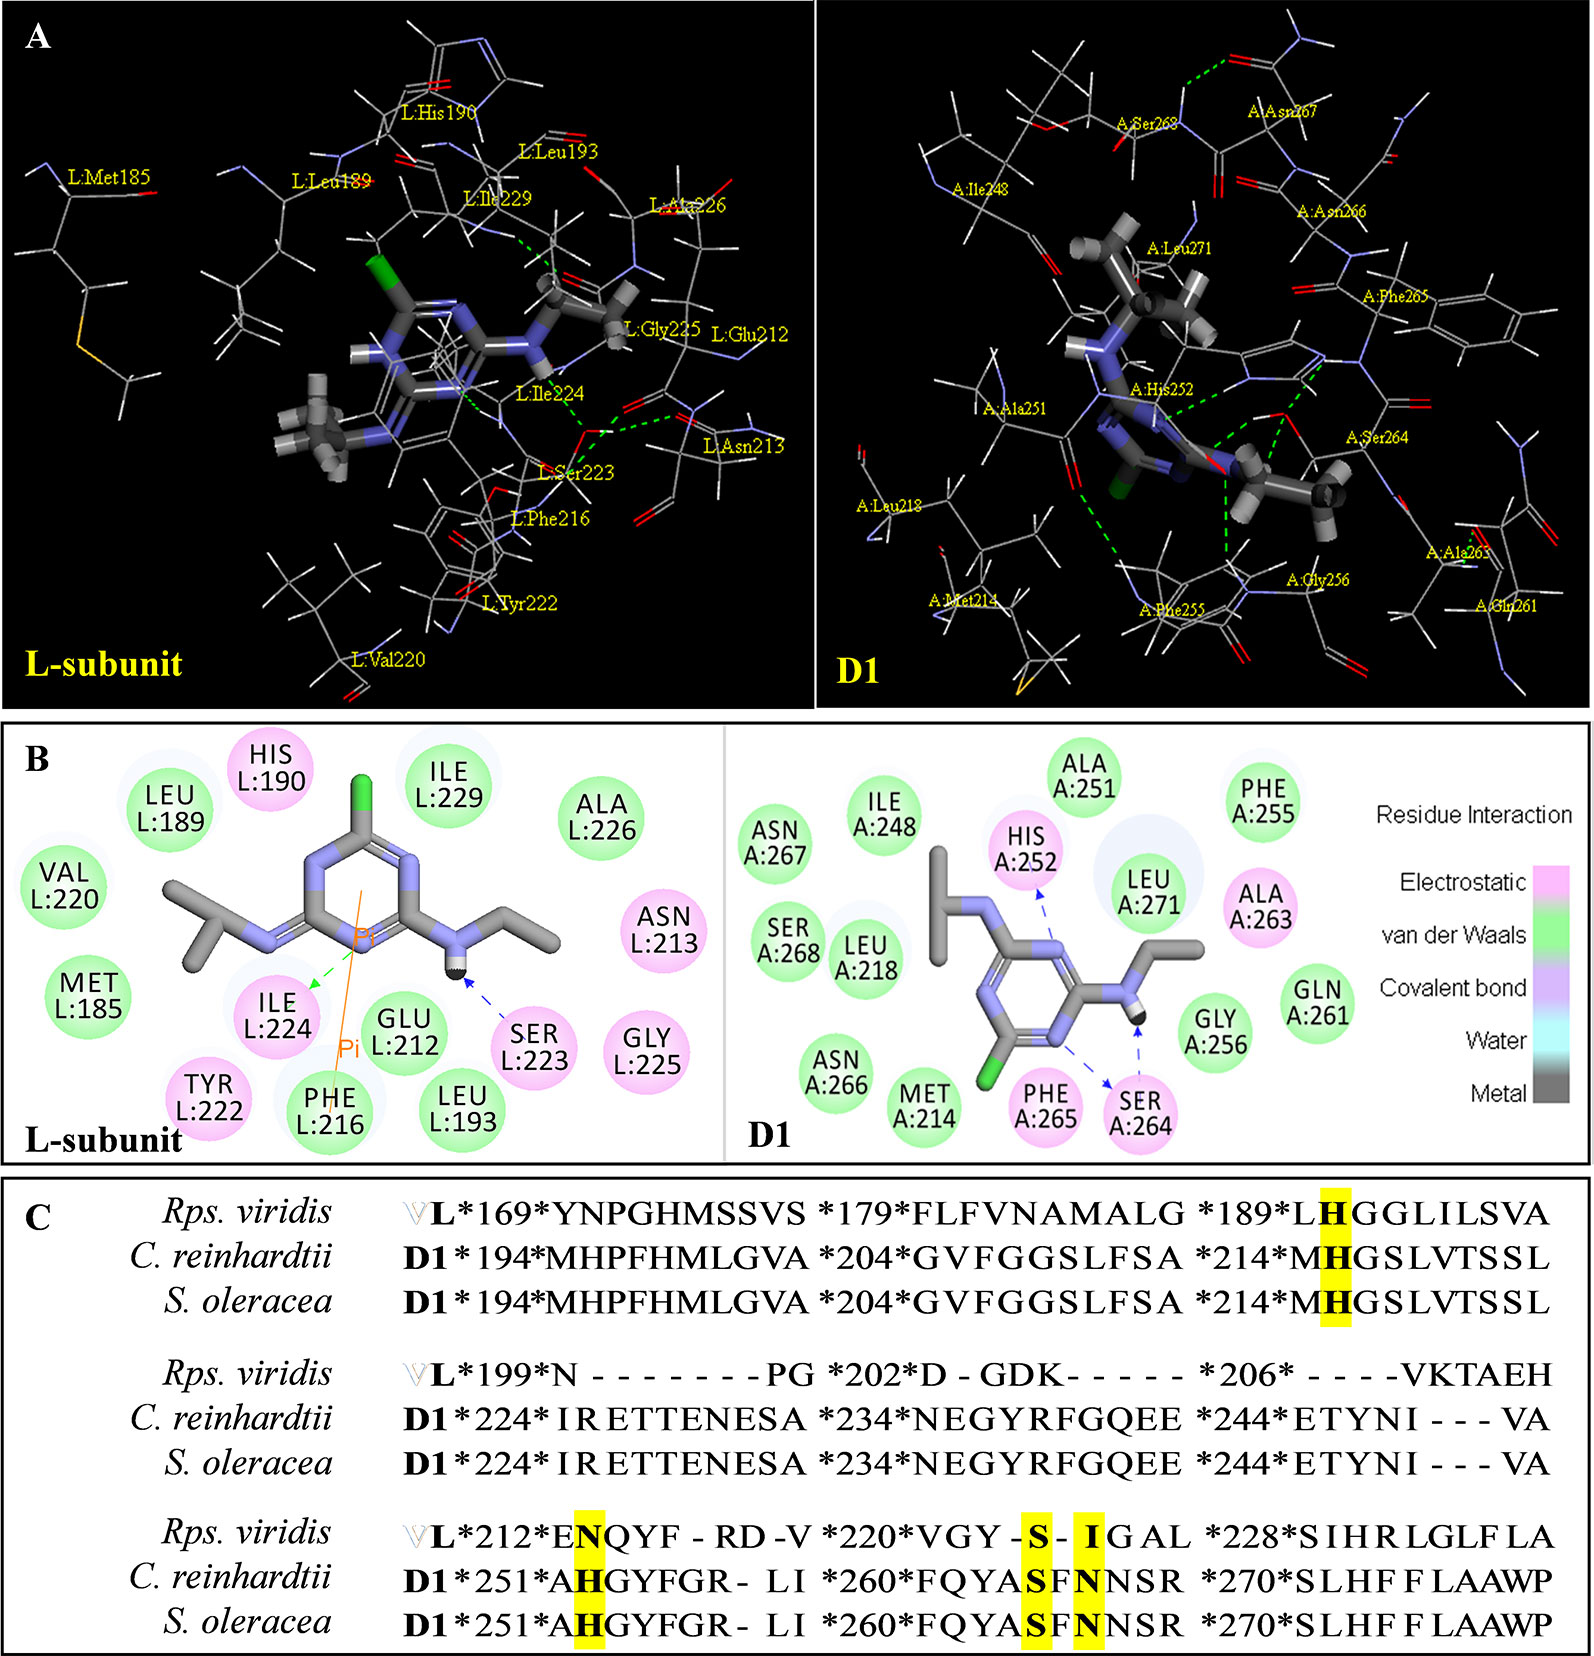
Figure 8 The simulated modeling of atrazine binding to the QB-site. (A) Stereo view of atrazine binding environment of the L-subunit of Rps. viridis (left) and the D1 protein of S. oleracea (right). (B) Hydrogen bonding interactions for atrazine binding to the QB niche. Here, carbon atoms are shown in grey, nitrogen atoms in blue, oxygen in red, chlorine in green, and hydrogen atoms in white. The possible hydrogen bonds are indicated by dashed lines. (C) Sequence alignment of the Dl protein of C. reinhardtii and S. oleracea with the L-subunit of the Rps. viridis RC. The bacterial L-subunit sequences are in upper case and the Dl sequence is in lower case.
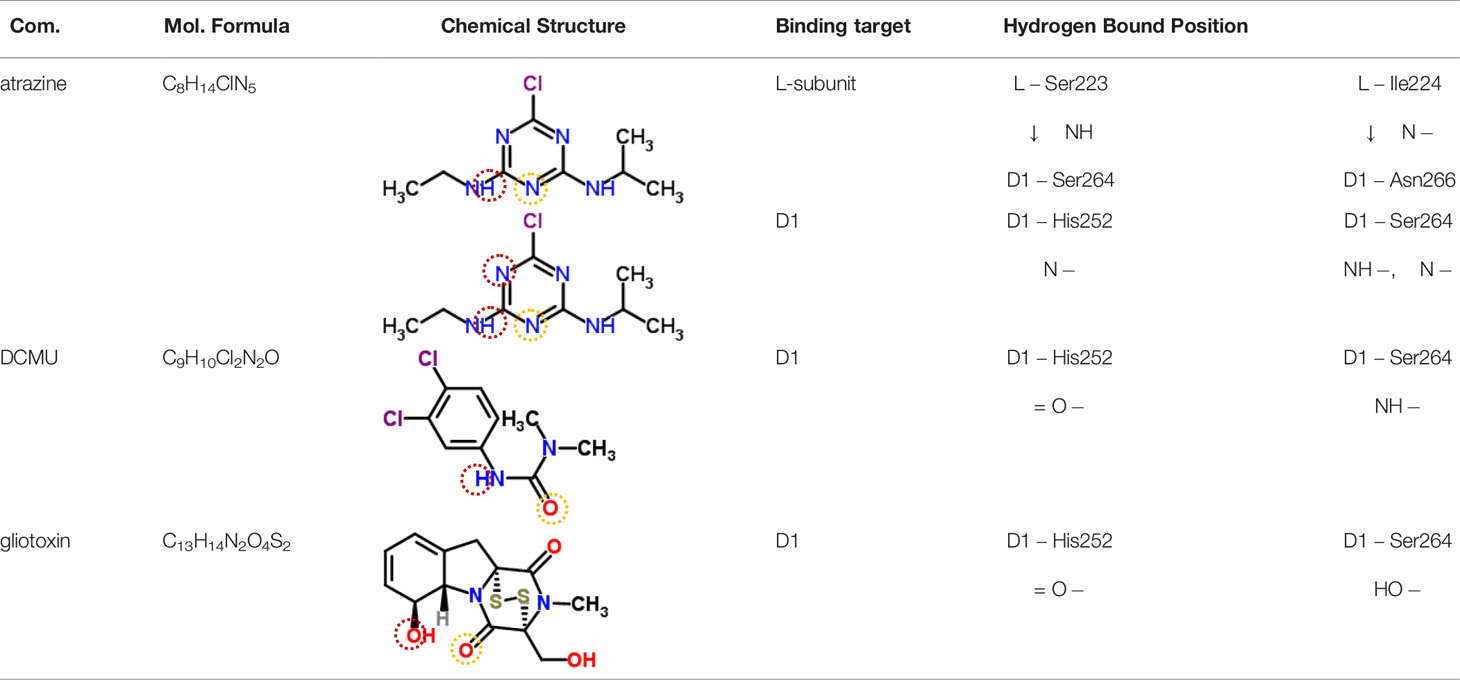
Table 3 Possible hydrogen bonding interactions for atrazine, DCMU and Gliotoxin (GT) binding to the L-subunit of Rh. viridis or the D1 protein of S. oleracea. The circle refers to the predicted atom position providing hydrogen bond with the indicated amino acid residue.
The binding modeling of the D1 protein from spinach (3JCU) docking with DCMU is also presented in Figure 9. The D1-Ser264 provides a hydrogen bond to the amide hydrogen of DCMU. Another hydrogen bond is found between the carbonyl group of DCMU and D1-His252 (Figure 9, Table 3). Previous modeling has shown that the protein binding environment for DCMU is overlapping with that for QB. The residues that appear to coordinate DCMU binding are Dl -Phe211, D1-Met214, D1-His215, D1-Val219, Dl-Phe232, D1-Tyr246, D1-Ala251, D1-His252, D1-Gly256, D1-Ala263, D1-Ser264, D1-Phe265, Dl-Asn266, and D1-Leu271 (Xiong et al., 1996). It is predicted that DCMU orients itself preferentially towards D1-Ser264 by a hydrogen bond (Trebst, 1987; Xiong et al., 1996).
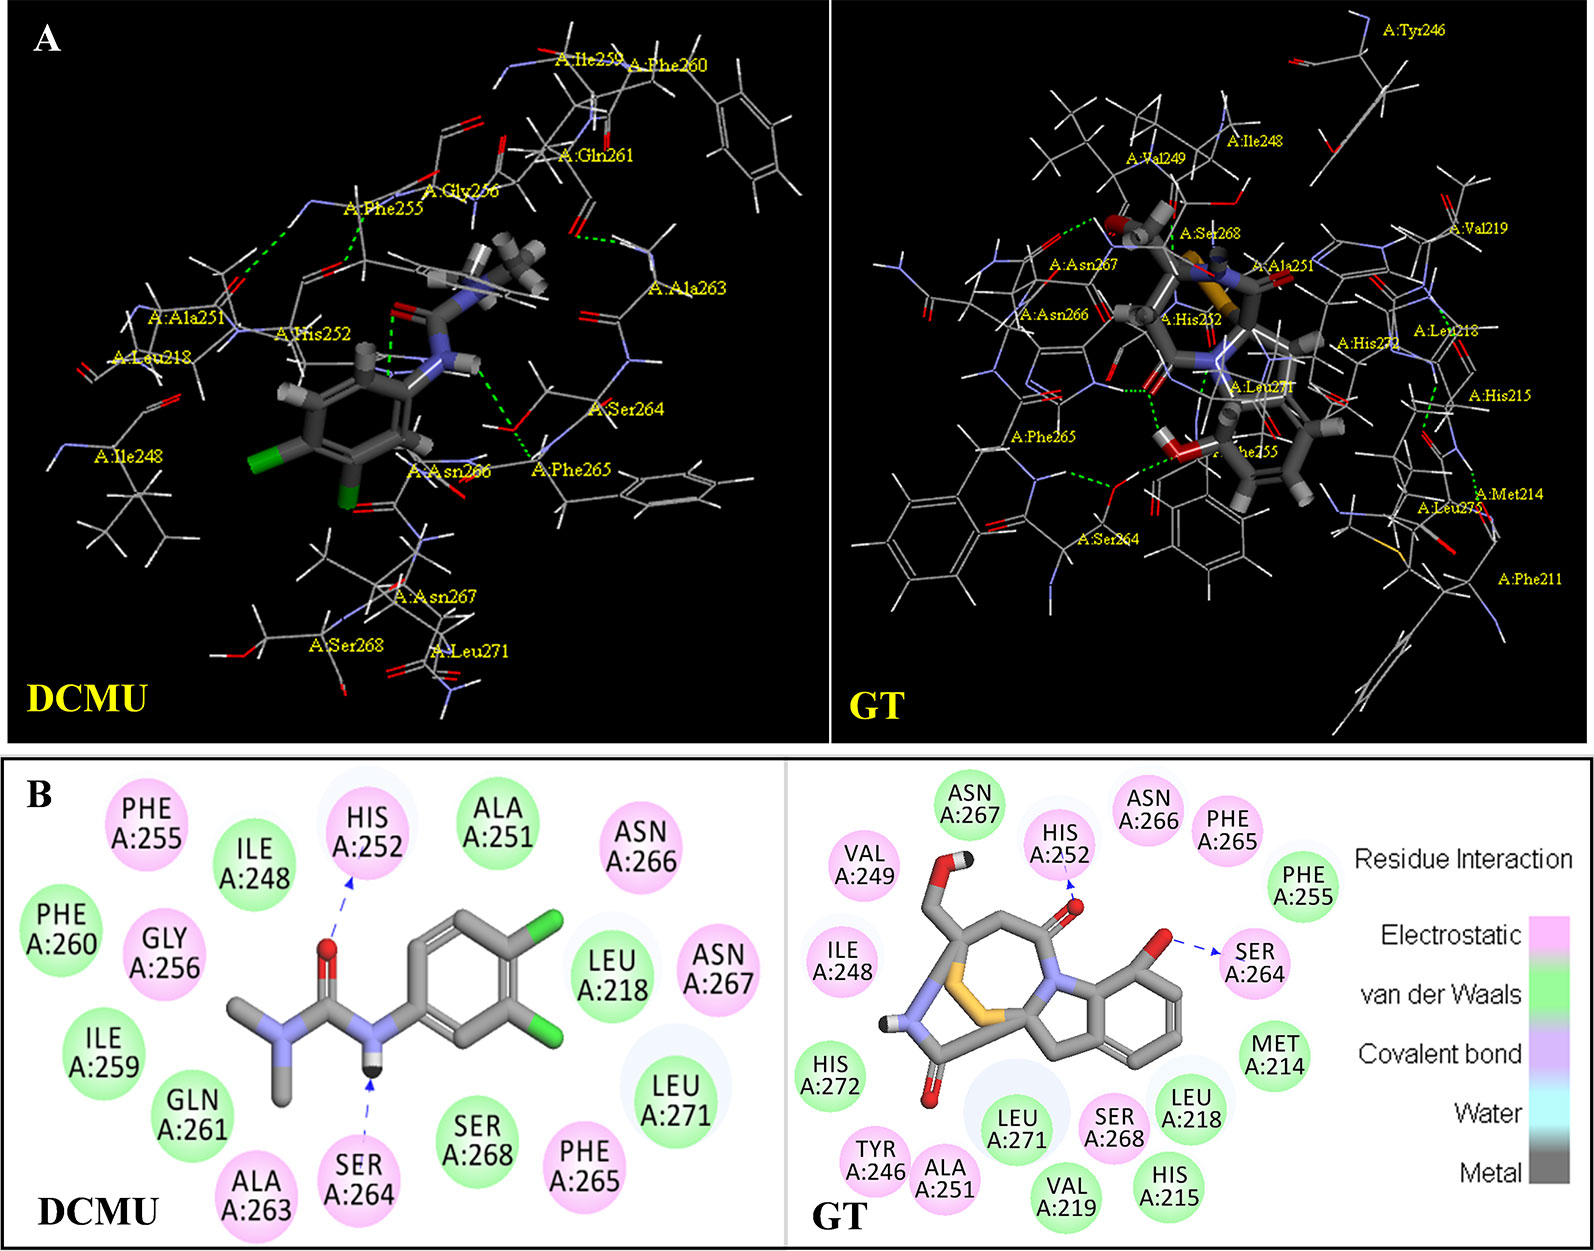
Figure 9 The simulated modeling of DCMU and Gliotoxin (GT) binding to the D1 protein of S. oleracea. (A) Stereo view of DCMU (left) and GT (right) binding environment of S. oleracea D1 protein. (B) Hydrogen bonding interactions for DCMU (left) and GT (right) binding to the D1 protein. Here, carbon atoms are shown in grey, nitrogen atoms in blue, oxygen in red, chlorine in green, and hydrogen atoms in white. The possible hydrogen bonds are indicated by dashed lines.
The modeling of GT docking to the QB-site was built on the basis of the available crystal structure alignment of spinach D1 protein (3JCU) through energy minimization and molecular dynamics simulations (Figure 9). In the modeling, Dl residues identified to be more likely related to the binding of GT are D1-Tyr246, D1-Ile248, D1-Val249, D1-Ala251, D1-His252, D1-S264, D1-Phe265, Dl-Asn266, and D1-Ser268. Here, it is predicted that hydrogen bonds are formed between D1-Ser264 and the aromatic hydroxyl oxygen of GT, and between D1-His252 and the 4-carbonyl group of GT. This exhibits somewhat different from DCMU. Additionally, the residues, D1-Met214, D1-His215, D1-Leu218, D1Val219, D1-Phe255, D1-Asn267, and D1-His272, are also found within the van der Waals contact sphere with GT. However, to further identify amino acids in the target which participate in GT binding, more experimental data based on the site directed mutant and X-ray structure are needed in the future.
It is well known that all PSII inhibitors share the same binding site on the D1 protein. However, each inhibitor has its characteristic orientation in the D1 protein. PSII inhibitors can be grouped into two families, the classical type with ureas and triazine, and the phenol type with ioxynil and dinoseb (Trebst, 1987). The ureas/triazine family inhibitors have the common structure group N-C = X, where X signifies N or O. They are more closely oriented toward D1-Ser264 in the QB binding niche. The phenolic inhibitors contain the aromatic hydroxyl group bearing nitro and/or halogen and/or nitrile substituent, binding to the QB-site via D1-His215 (Oettmeier et al., 1982; Trebst, 1987). GT belongs to the first family since it possesses the common characteristics group N-C = O like ureas/triazine type PSII inhibitors. The protein-binding environment of GT appears to be consistent with most existing data of the classical PSII inhibitors.
Conclusions
Above all presentations reveal that GT has excellent herbicidal potentiality attributed to its multiple effects on photosynthetic apparatus. The main action of GT is the arrest of photosynthesis by blocking electron flow beyond QA at the acceptor side of PSII and then inactivating PSII RCs. The primary direct target of GT is the QB-site of the D1 protein in PSII. Based on the modeling of GT docking to the D1 protein, it is assumed that GT binds to the QB-site by the hydrogen bonds between the aromatic hydroxyl oxygen of GT and the residue D1-Ser264, and between the 4-carbonyl group of GT and the residue D1-His252. It is clear that GT is a novel natural PSII inhibitor with the characteristics group N-C = O. Additionally, GT at high concentration can also inhibit PSI activity by decreasing the reduction of the end acceptors at the PSI acceptor side. So, it is concluded that GT may be an interesting structural framework of a potential photosynthetic inhibitor. However, further studies are needed to clarify and confirm the actual binding site for GT in PSII and PSI.
Data Availability Statement
All datasets generated for this study are included in the article/Supplementary Material.
Author Contributions
SC and SQ designed research. TGu, JC, YL, HW, YGa, JS, CY, and XW performed experiments. SC, YGu, JC, and RS analyzed data and wrote the paper.
Conflict of Interest
The authors declare that the research was conducted in the absence of any commercial or financial relationships that could be construed as a potential conflict of interest.
Acknowledgments
This work was supported by the National Key Research and Development Program (2017YFD0201300), the Foreign Expert Project (G20190010118) and the Fundamental Research Funds for the Central Universities (KYZ201530). The authors also wish to thank Bernal E. Valverde (Investigación y Desarrollo en Agricultura Tropical, Costa Rica) for helpful comments and improving the manuscript.
Supplementary Material
The Supplementary Material for this article can be found online at: https://www.frontiersin.org/articles/10.3389/fpls.2019.01688/full#supplementary-material
Figure S1 | SDS-PAGE analysis of spinach thylakoid polypeptides after GT treatment. Thylakoids with 100 μg Chl ml−1 were treated with 1% DMSO, 1 μM DCMU and different concentrations of GT for 0.5 h in the dark at 25 °C. Thylakoid membrane proteins were separated by gel electrophoresis. A total protein containing 15 μg chlorophylls was loaded onto the gel for each sample. SDS-PAGE containing 6 M urea was used with a slab gel containing 4% (stacking) and 12% (resolving) acrylamide. From left to right: maker (Thermo Scientific PageRuler Prestained Protein Ladder, No. 26616) (1), 1% DMSO (mock, 2), 50 μM GT (3), 100 μM GT (4), 200 μM GT (5), 400 μM GT (6), 1 μM DCMU (7) and water (8). CP and OEC indicate Chl a/b binding protein and oxygen evolving complex 33 kD, respectively. The similar result was repeated at least 3 times.
References
Arias, M., Santiago, L., Vidal-García, M., Redrado, S., Lanuza, P., Comas, L., et al. (2018). Preparations for invasion: modulation of host lung immunity during Pulmonary Aspergillosis by gliotoxin and other fungal secondary metabolites. Front. Immunol. 9, 2549. doi: 10.3389/fimmu.2018.02549
Ceppi, M. G., Oukarroum, A., Ççiek, N., Strasser, R. J., Schansker, G. (2012). The IP amplitude of the fluorescence rise OJIP is sensitive to changes in the photosystem I content of leaves: a study on plants exposed to magnesium and sulfate deficiencies, drought stress and salt stress. Physiol. Plant 144, 277–288. doi: 10.1111/j.1399-3054.2011.01549.x
Chen, S., Xu, X., Dai, X., Yang, C., Qiang, S. (2007). Identification of tenuazonic acid as a novel type of natural photosystem II inhibitor binding in QB-site of Chlamydomonas reinhardtii. Biochim. Biophys. Acta 1767, 306–318. doi: 10.1016/j.bbabio.2007.02.007
Chen, S., Yin, C., Dai, X., Qiang, S., Xu, X. (2008). Action of tenuazonic acid, a natural phytotoxin, on photosystem II of spinach. Environ. Exp. Bot. 62, 279–289. doi: 10.1016/j.envexpbot.2007.10.002
Chen, S., Yin, C., Strasser, R. J., Govindjee, Yang, C., Qiang, S. (2012). Reactive oxygen species from chloroplasts contribute to 3-acetyl-5-isopropyltetramic acid -induced leaf necrosis of Arabidopsis thaliana. Plant Physiol. Biochem. 52, 38–51. doi: 10.1016/j.plaphy.2011.11.004
Chen, S., Strasser, R. J., Qiang, S. (2014). In vivo assessment of effect of phytotoxin tenuazonic acid on PSII reaction centers. Plant Physiol. Biochem. 84, 10–21. doi: 10.1016/j.plaphy.2014.09.004
Chen, S., Yang, J., Zhang, M., Strasser, R. J., Qiang, S. (2016). Classification and characteristics of heat tolerance in Ageratina adenophora populations using fast chlorophyll a fluorescence rise O-J-I-P. Environ. Exp. Bot. 122, 126–140. doi: 10.1016/j.envexpbot.2015.09.011
Dolan, S. K., O’Keeffe, G., Jones, G. W., Doyle, S. (2015). Resistance is not futile: gliotoxin biosynthesis, functionality and utility. Trends Microbiol. 23, 419–428. doi: 10.1016/j.tim.2015.02.005
Furuta, T., Kigane, T., Suganoya, Y. (1984). Isolation of gliotoxin as lettuce seedling growth inhibit substance from the culture broth of Aspergillus fumigatus Fres. Bull. Fac. Agric. Tamagawa Univ. 24, 16–25.
Gao, Y., Liu, W., Wang, X., Yang, L., Han, S., Chen, S., et al. (2018). Comparative phytotoxicity of usnic acid, salicylic acid, cinnamic acid and benzoic acid on photosynthetic apparatus of Chlamydomonas reinhardtii. Plant Physiol. Biochem. 128, 1–12. doi: 10.1016/j.plaphy.2018.04.037
Goltsev, V., Zaharieva, I., Chernev, P., Kouzmanova, M., Kalaji, H. M., Yordanov, I., et al. (2012). Drought-induced modifications of photosynthetic electron transport in intact leaves: analysis and use of neural networks as a tool for a rapid non-invasive estimation. Biochim. Biophys. Acta 1817, 1490–1498. doi: 10.1016/j.bbabio.2012.04.018
Haraguchi, H., Hamatani, Y., Shibata, K., Hashimoto, K. (1992). An inhibitor of acetolactate synthase from a microbe. Biosci. Biotechnol. Biochem. 56, 2085–2086. doi: 10.1271/bbb.562085
Haraguchi, H., Hamatani, Y., Hamada, M., Fujii-Techino, A. (1996). Effect of gliotoxin on growth and branched-chain amino acid biosynthesis in plants. Phytochemistry 42, 645–648. doi: 10.1016/0031-9422(95)00982-5
Haraguchi, H., Yamano, K., Kusunoki, N., Fukuda, A. (1997). Effect of gliotoxin and related compounds on acetolactate synthase. J. Agric. Food Chem. 45, 2784–2787. doi: 10.1021/jf960842a
Harms, H., Orlikova, B., Ji, S., Nesaei-Mosaferan, D., Konig, G. M., Diederich, M. (2015). Epipolythiodiketopiperazines from the marine derived fungus Dichotomomyces cejpii with NF-kappaB inhibitory potential. Mar. Drugs 13, 4949–4966. doi: 10.3390/md13084949
Haun, F., Neumann, S., Peintner, L., Wieland, K., Habicht, J., Schwan, C., et al. (2018). Identification of a novel anoikis signalling pathway using the fungal virulence factor gliotoxin. Nat. Commun. 9, 3524. doi: 10.1038/s41467-018-05850-w
Hurne, A. M., Chai, C. L. L., Moerman, K., Waring, P. (2002). Influx of calcium through a redox-sensitive plasma membrane channel in thymocytes causes early necrotic cell death induced by the epipolythiodioxopiperazine toxins. J. Biol. Chem. 277, 31631. doi: 10.1074/jbc.m201699200
Jordan, T. W., Pedersen, J. S. (1986). Sporidesmin and gliotoxin induce cell detachment and perturb microfilament structure in cultured liver cells. J. Cell Sci. 85, 33–46. doi: 10.1083/jcb.103.31129
Kamiya, N., Shen, J. R. (2003). Crystal structure of oxygen-evolving photosystem II from Thermosynechococcus vulcanus at 3.7-Å resolution. Proc. Natl. Acad. Sci. U.S.A. 100, 98–103. doi: 10.1073/pnas.0135651100
Ke, B. (2001). “The stable primary electron acceptor QA and the second electron acceptor QB,” in Photosynthesis: Photobiochemistry and Photobiophysics. Ed. Ke, B. (New York-Boston-Dordrecht-London-Moscow: Kluwer Academic Publishers), 289–304.
Khan, M. R., Arshad Anwer, M., Shahid, S. (2011). Management of gray mold of chickpea, Botrytis cinerea with bacterial and fungal biopesticides using different modes of inoculation and application. Biol. Control 57, 13–23. doi: 10.1016/j.biocontrol.2011.01.004
Kim, Y., Park, S. J. (2016). Gliotoxin from the marine fungus Aspergillus fumigatus induces apoptosis in HT1080 fibrosarcoma cells by downregulating NF-κB. Fish. Aquat. Sci. 19, 35. doi: 10.1186/s41240-016-0036-6
Krause, G. H., Weis, E. (1991). Chlorophyll fluorescence and photosynthesis: the basics. Annu. Rev. Plant Physiol. Plant Mol. Biol. 42, 313–349. doi: 10.1146/annurev.pp.42.060191.001525
Kroll, M., Arenzana-Seisdedos, F., Bachelerie, F., Thomas, D., Friguet, B., Conconi, M. (1999). The secondary fungal metabolite gliotoxin targets proteolytic activities of the proteasome. Chem. Biol. 6, 689–698. doi: 10.1016/s1074-5521(00)80016-2
Lancaster, C. R. D., Michel, H. (1999). Refined crystal structures of reaction centres from Rhodopseudomonas viridis in complexes with the herbicide atrazine and two chiral atrazine derivatives also lead to a new model of the bound carotenoid. J. Mol. Boil. 286, 883–898. doi: 10.1006/jmbi.19982532
Lazár, D., Brokeš, M., Nauš, Dvorák, L. (1998). Mathematical modeling of 3-(3’,4’-dichlorophenyl)-1,1-dimethylurea action in plant leaves. J. Theor. Biol. 191, 79–86. doi: 10.1006/jtbi.19970566
Li, J., Zhang, Y., Santos, B. D. S. S. D., Wang, F., Ma, Y., Perez, C., et al. (2018). Epidithiodiketopiperazines inhibit protein degradation by targeting proteasome deubiquitinase Rpn11. Cell Chem. Biol. 25, 1350–1358. doi: 10.1016/j.chembiol.2018.07.012
Lumsden, R. D., Walter, J. F. (2003). “Development of the biocontrol fungus Gliocladium virens: risk assessment and approval for horticultural use,” in Biological Control: Benefits and Risks. Eds. Hokkanen, H. M. T., Lynch, J. M. (Cambridge, UK: Cambridge University Press), 263–269.
Miller, P. A., Milstrey, K. P., Trown, P. W. (1968). Specific inhibition of viral ribonucleic acid replication by Gliotoxin. Science 159, 431–432. doi: 10.1126/science.159.3813.431
Mittler, R. (2002). Oxidative stress, antioxidants and stress tolerance. Trends Plant Sci. 7, 405–410. doi: 10.1016/S1360-1385(02)02312-9
Nouri, M. A., Al-Halbosiy, M. M. F., Dheeb, B. I., Hashim, A. J. (2015). Aquat. J. King Saud Univ. Sci. 27, 193–197. doi: 10.1016/j.jksus.2014.12.005
Oettmeier, W., Masson, K., Johanningmeier, U. (1982). Evidence for two different herbicide-binding proteins at the reducing side of photosystem II. Biochim. Biophys. Acta 679, 376–383. doi: 10.1016/0005-2728(82)90157-8
Oettmeier, W. (1999). Herbicide resistance and supersensitivity in photosystem II. CMLS. Cell. Mol. Life Sci. 55, 1255–1277. doi: 10.1007/s000180050370
Oukarroum, A., Schansker, G., Strasser, R. J. (2009). Drought stress effects on photosystem I content and photosystem II thermotolerance analyzed using Chl a fluorescence kinetics in barley varieties differing in their drought tolerance. Physiol. Plant 137, 188–199. doi: 10.1111/j.1399-3054.2009.01273.x
Schansker, G., Srivastava, A., Govindjee, Strasser, R. J. (2003). Characterization of the 820-nm transmission signal paralleling the chlorophyll a fluorescence rise (OJIP) in pea leaves. Funct. Plant Biol. 30, 785–796. doi: 10.1071/FP03032
Schansker, G., Tóth, S. Z., Strasser, R. J. (2005). Methylviolegen and dibromothymoquinone treatments of pea leaves reveal the role of photosystem I in the Chl a fluorescence rise OJIP. Biochim. Biophys. Acta 1706, 250–261. doi: 10.1016/j.bbabio.2004.11.006
Scharf, D. H., Brakhage, A. A., Mukherjee, P. K. (2016). Gliotoxin—bane or boon? Environ. Microbiol. 18, 1096–1109. doi: 10.1111/1462-2920.13080
Smith, E. B., Dolan, S. K., Fitzpatrick, D. A., Doyle, S., Jones, G. W. (2016). Towards understanding the gliotoxin detoxification mechanism: in vivo thiomethylation protects yeast from gliotoxin cytotoxicity. Microb. Cell 3, 120–125. doi: 10.15698/mic2016.03.485
Srivastava, A., Jüttner, F., Strasser, R. J. (1998). Action of the allelochemical, fischerellin A, on photosystem II. Biochim. Biophys. Acta 1364, 326–336. doi: 10.1016/S0005-2728(98)00014-0
Strasser, R. J., Govindjee (1992). “The Fo and the O-J-I-P Fluorescence Rise in Higher Plants and Algae,” in Regulation of Chloroplast Biogenesis. Ed. Argyroudi-Akoyunoglou, J. H. (New York: Plenum Press), 423–426.
Strasser, R. J., Srivastava, A., Govindjee (1995). Polyphasic chlorophyll a fluorescence transient in plants and cyanobacteria. Photochem. Photobiol. 61, 32e42. doi: 10.1111/j.1751-1097.1995.tb09240.x
Strasser, R. J., Tsimilli-Michael, M., Srivastava, A. (2004). “Analysis of the Chlorophyll a Fluorescence Transient,” in Chlorophyll Fluorescence: A Signature of Photosynthesis. Eds. Papageorgiou, G. C., Govindjee (Netherlands: Kluwer Academic Publishers), 321–362.
Strasser, R. J., Tsimilli-Michael, M., Qiang, S., Goltsev, V. (2010). Simultaneous in vivo recording of prompt and delayed fluorescence and 820-nm reflection changes during drying and after rehydration of the resurrection plant Haberlea rhodopensis. Biochim. Biophys. Acta 1797, 1313–1326. doi: 10.1016/j.bbabio.2010.03.008
Tóth, S. Z., Schansker, G., Strasser, R. J. (2005). In intact leaves, the maximum fluorescence level (FM) is independent of the redox state of the plastoquinone pool: A DCMU-inhibition study. Biochim. Biophys. Acta 1708, 275–282. doi: 10.1016/j.bbabio.2005.03.012
Trebst, A. (1987). The three-dimensional structure of the herbicide binding niche on the reaction center polypeptides of photosystem II. Z. Naturforsch. 42C, 742–750. doi: 10.1515/znc-1987-0616
Trebst, A. (2008). “The mode of action of triazine herbicides in plants,” in The Triazine Herbicides 50 years Revolutionizing Agriculture. Eds. LeBaron, H. M., McFarland, J. E., Burnside, O. C. (San Diego: Elsevier), 101–110.
Vigushin, D. M., Mirsaidi, N., Brooke, G., Sun, C., Pace, P., Inman, L., et al. (2004). Gliotoxin is a dual inhibitor of farnesyltransferase and geranylgeranyltransferase I with antitumor activity against breast cancer in vivo. Med. Oncol. 21, 21–30. doi: 10.1385/mo:21:1:21
Wright, J. M. (1951). Phytotoxic effects of some antibiotics. Ann. Bot. 15, 493–499. doi: 10.1093/oxfordjournals.aob.a083294
Xiong, J., Jee, G., Subramaniam, S. (1996). Modeling of the D1/D2 proteins and cofactors of the photosystem II reaction center: Implications for herbicide and bicarbonate binding. Protein Sci. 5, 2054–2073. doi: 10.1002/pro.5560051012
Yusuf, M. A., Kumar, D., Rajwanshi, R., Strasser, R. J., Tsimilli-Michael, M., Govindjee, et al. (2010). Overexpression of g-tocopherol methyl transferase gene in transgenic Brassica juncea plants alleviates abiotic stress: physiological and chlorophyll a fluorescence measurements. Biochim. Biophys. Acta 1797, 1428–1438. doi: 10.1016/j.bbabio.2010.02.002
Keywords: chlorophyll a fluorescence (OJIP) transient, mycotoxin, action target, D1 protein, binding model
Citation: Guo Y, Cheng J, Lu Y, Wang H, Gao Y, Shi J, Yin C, Wang X, Chen S, Strasser RJ and Qiang S (2020) Novel Action Targets of Natural Product Gliotoxin in Photosynthetic Apparatus. Front. Plant Sci. 10:1688. doi: 10.3389/fpls.2019.01688
Received: 16 August 2019; Accepted: 29 November 2019;
Published: 17 January 2020.
Edited by:
Michael Moustakas, Aristotle University of Thessaloniki, GreeceReviewed by:
Marek Zivcak, Slovak University of Agriculture, SlovakiaRajagopal Subramanyam, University of Hyderabad, India
Copyright © 2020 Guo, Cheng, Lu, Wang, Gao, Shi, Yin, Wang, Chen, Strasser and Qiang. This is an open-access article distributed under the terms of the Creative Commons Attribution License (CC BY). The use, distribution or reproduction in other forums is permitted, provided the original author(s) and the copyright owner(s) are credited and that the original publication in this journal is cited, in accordance with accepted academic practice. No use, distribution or reproduction is permitted which does not comply with these terms.
*Correspondence: Shiguo Chen, chenshg@njau.edu.cn; Sheng Qiang, wrl@njau.edu.cn