 Yusuf Genc1,2
 Julian Taylor2
 Graham Lyons2
 Yongle Li2
 Judy Cheong1
 Marie Appelbee3†Klaus Oldach1†
 Tim Sutton1,2
- 1South Australian Research and Development Institute, Adelaide, SA, Australia
- 2School of Agriculture, Food and Wine, University of Adelaide, Adelaide, SA, Australia
- 3LongReach Plant Breeders, Adelaide, SA, Australia
Soil salinity and sodicity are major constraints to global cereal production, but breeding for tolerance has been slow. Narrow gene pools, over-emphasis on the sodium (Na+) exclusion mechanism, little attention to osmotic stress/tissue tolerance mechanism(s) in which accumulation of inorganic ions such as Na+ is implicated, and lack of a suitable screening method have impaired progress. The aims of this study were to discover novel genes for Na+ accumulation using genome-wide association studies, compare growth responses to salinity and sodicity in low-Na+ bread Westonia with Nax1 and Nax2 genes and high-Na+ bread wheat Baart-46, and evaluate growth responses to salinity and sodicity in bread wheats with varying leaf Na+ concentrations. The novel high-Na+ bread wheat germplasm, MW#293, had higher grain yield under salinity and sodicity, in absolute and relative terms, than the other bread wheat entries tested. Genes associated with high Na+ accumulation in bread wheat were identified, which may be involved in tissue tolerance/osmotic adjustment. As most modern bread wheats are efficient at excluding Na+, further reduction in plant Na+ is unlikely to provide agronomic benefit. The salinity and sodicity tolerant germplasm MW#293 provides an opportunity for the development of future salinity/sodicity tolerant bread wheat.
Highlight
A new bread wheat germplasm accumulates high levels of sodium, and yet is more tolerant to salinity and sodicity than the bread wheats with better sodium exclusion ability.
Introduction
Soil salinity and sodicity severely constrain crop production in Australia and worldwide. The total global area of saline and sodic soils is estimated to be around 830 million hectares, more than 6% of the world’s land (Martinez-Beltran and Manzur, 2005) and rising (Acosta-Motos et al., 2017; Bennett et al., 2013; Shrivastava and Kumar, 2015). Indeed, it is estimated that over 50% of global arable land will be salinized by 2050 (Jamil et al., 2011). Although the actual cost from lost agricultural production is hard to quantify, and varies with crop species, timing, duration, and severity of the stress, it is apparent that losses in yield and profit are significant (McDonald et al., 2012). Yield reductions of 50% in durum wheat under dryland salinity (James et al., 2012), 88% in bread wheat under high irrigation salinity (Jafari-Shabestari et al., 1995), and 70% under sodicity have been reported (Rengasamy, 2002). These studies highlight the scale of lost productivity on saline and sodic soils, and the great opportunity if yield in these environments can be improved.
When cropping on saline and sodic soils, there are limited options to raise productivity, and they are complementary (Singh et al., 2016): (i) soil management and (ii) plant breeding. Despite the potential of the plant breeding approach (Grewal et al., 2004; Genc et al., 2007; Munns et al., 2012), progress in breeding cereal cultivars with salinity or sodicity tolerance has been slow (Noble and Rogers, 1992; Shahbaz and Ashraf, 2013; Iqbal et al., 2014; Volkov and Beilby, 2017). This is often attributed to the genetic and physiological complexities of the salt tolerance trait, and lack of a reliable and rapid screening assay (Flowers, 2004; Colmer et al., 2005; Kumar and Mosa, 2015; Genc et al., 2016; Almeida et al., 2017). Moreover, elite germplasm may not include genes able to confer worthwhile salt/sodicity tolerance, and introgression from wild wheat relatives and/or genetic engineering may be required for step change progress to be achieved (Glenn et al., 1997; Wang et al., 2003; Colmer et al., 2005; Colmer et al., 2006; Wang et al., 2007; Shavrukov et al., 2009; Munns et al., 2012; Deinlein et al., 2014; Zhang et al., 2016).
An example of the use of a wild relative is the work of Richard James and his colleagues (James et al., 2012; Munns et al., 2012), who introgressed Na+ exclusion genes Nax1 and Nax2 from the diploid bread wheat ancestor Triticum monococcum L. (C68-101) into durum wheat Tamaroi. Nax1 removes Na+ from the xylem in roots and leaf sheaths, while Nax2 removes Na+ from xylem in the roots only (James et al., 2011). Tamaroi with Nax2 showed lower leaf Na+ concentration and achieved higher grain yield under salinity (Munns et al., 2012) and sodicity (Genc et al., 2016). These two genes were also transferred from durum wheat into bread wheat cv. Westonia, and subsequently shown to reduce leaf 3 Na+ concentration (James et al., 2011). Recent saline field trials with three Westonia-Nax2 and two Westonia-Nax1 lines indicated, compared to Westonia, 11% yield increase in 2009 but 6.5% decrease in 2011 in one of the Westonia-Nax2 lines (Westonia- Nax2-5924) (Tables S1 and S3; Setter et al., 2016). These results are not conclusive. Therefore, there is a need to verify the effects of these genes in bread wheat in controlled environment studies involving salinity and sodicity, especially as bread wheat has much greater Na+ exclusion than durum wheat (Genc et al., 2016). Despite their potential for improving salinity tolerance (reviewed in Colmer et al., 2006), wild relatives and landraces of bread wheat largely remain an untapped resource. In the early 2000s salinity tolerant bread wheat germplasm lines W4909 and W4910, derived from wild relatives, were developed by Richard Wang and his colleagues (Wang et al., 2003). However, these germplasm lines have not been exploited in breeding programs.
Sodicity, of which high Na+ is the key component, affects greater land area than salinity (Rengasamy and Olsson, 1991; Rengasamy, 2002; Rengasamy, 2006), but there has been little specific research on sodicity and mechanisms of tolerance (Pearson and Bernstein, 1958; Sharma, 1986, Sharma, 1991; Rajpar et al., 2004; Saqib et al., 2007). This is unsurprising as screening for sodicity tolerance has been difficult in laboratory or glasshouse environments (Singh et al., 2002), which are needed to test large numbers of accessions in a relatively controlled manner. Problems with current screening methods include (i) very high pH of sodic soils, hence difficulty of separating pH effects from those of Na+ toxicity, (ii) inability to control soil composition when sourced from field sites, and (iii) months of waiting before pH stabilizes, and thereafter the possibility of toxicity from excess salt (sodium bicarbonate) not adsorbed at cation exchange sites (Singh et al., 2002). A recently developed soil-based screening method, using Na+-humate as a surrogate for sodicity (Genc et al., 2016), avoids these issues and enables screening of a large number of accessions. We utilised this method in order to determine genotypic variation in Na+ exclusion in commercial bread wheat varieties and assess its importance to sodicity and salinity tolerance.
In efforts to develop selection tools that can be applied in breeding, genetic markers for the Na+ exclusion trait in cereals have been identified by QTL mapping of bi-parental populations (Genc et al., 2010; Shavrukov et al., 2011; Masoudi et al., 2015; Hussain et al., 2017). However, most of these genetic markers have not been implemented in breeding programs as they mostly represent small effect loci that require extensive validation in alternative genetic backgrounds under appropriate conditions. An alternative to aforementioned QTL mapping is association mapping or genome-wide association studies (GWAS). Two major advantages of association mapping over QTL mapping are (i) a much larger and more representative gene pool can be surveyed, and (ii) it bypasses the time-consuming and expensive process of constructing bi-parental mapping populations (Neumann et al., 2011). Although GWAS can be applied to a variety of plant species and conditions, only a few studies have reported on Na+ exclusion and/or salt tolerance in rice (Kumar et al., 2015; Patishtan et al., 2017; Shi et al., 2017), wheat (Turki et al., 2015; Oyiga et al., 2018), and barley (Long et al., 2013; Fan et al., 2016). Given these limited studies, there is clearly a role of GWAS to detect novel genes/alleles associated with salinity/sodicity tolerance, which can be deployed in breeding programs.
The aims of this study were to (i) identify novel genes/alleles for Na+ accumulation which may be involved in osmotic stress/tissue tolerance, (ii) compare growth responses to salinity and sodicity in low-Na+ bread wheat Westonia with Nax1 and Nax2 genes and high-Na+ bread wheat Baart-46, and (iii) evaluate growth responses to salinity and sodicity in bread wheats with varying leaf Na+ concentrations.
Materials and Methods
Plant Material
Experiment 1 included 100 bread wheat entries (Table S1) forming a diversity panel based on differential growth, yield, and Na+ exclusion (Richards et al., 1987; Shavrukov et al., 2006; Genc et al., 2007; James et al., 2011; Setter et al., 2016). Most entries were released Australian varieties dating back to 1901 and the remainder were historical varieties from Egypt, Germany, India, Mexico, and USA. Twelve durum wheat entries (Triticum turgidum subsp durum) were also included as checks. As durum wheats generally accumulate higher Na+ levels than bread wheats, we included two unique durum lines with low Na+ concentration (cv. Tamaroi with the Nax2 and breeding line WID902 with both Nax1 and Nax2). In Experiment 2, there were four bread wheat (Triticum aestivum L.) entries (Westonia, Westonia with Na+ exclusion gene Nax1 (Westonia-Nax1-5907), Westonia with Na+ exclusion gene Nax2 (Westonia-Nax2-5924), and Baart-46). The Nax1 (TmHKT1;4-A2) and Nax2 (TmHKT1;5-A) genes have been previously characterized (James et al., 2006; Byrt et al., 2007). As bread wheat cv. Westonia represents low Na+ wheat genotypes, a bread wheat genotype representing high-Na+ wheat genotypes, cv. Baart-46 (Genc et al., 2007), was also included for comparison. In experiment 3, there were 20 bread wheat entries (representing the range in leaf Na+ concentration in Experiment 1), four durum wheat entries, and a barley entry Clipper as checks. In Experiment 4, wheat lines cv. Mace, and doubled-haploid lines from a Mace/W4909 cross with low leaf Na+ concentration (MW#28 and MW#491), and high leaf Na+ concentration (MW#293 and MW#451) were used.
Growth Medium, Treatments, Seedling Establishment, and Growth Conditions
All four experiments used University of California potting mix, described previously (Genc et al., 2016), with biological replicates varying from four to nine. In Experiment 1, as plants were grown until heading to determine Na+ concentration in leaves at a single level of sodicity (8 g kg-1 Na+-humate), four plants per pot were grown in 3 kg capacity pots to enable testing of more wheat entries. There were four replications. In Experiment 2, there were five salinity (0, 50, 100, 150, and 200 mM NaCl) and four sodicity (2, 4, 8, and 16 g kg-1 Na+-humate) levels which were replicated four times. As plants were grown to maturity, 4 kg capacity pots were used as described in Genc et al. (2016). There were three plants per pot. In Experiment 3, as plants were grown to maturity, 4 kg capacity pots were used. There were four replications and three plants per pot grown under control, sodicity (8 g kg-1 Na+-humate), and salinity (100 mM NaCl). In Experiment 4, plants were grown to heading or maturity under control and salinity in 4 kg capacity pots. There were five (nutrient analysis) or nine (gene expression) replications, and three plants per pot. At heading, penultimate leaves were sampled for gene expression, while in the other set penultimate leaves were sampled for elemental analysis and plants were grown to maturity.
Plant Traits Measured
As described earlier (Genc et al., 2016), in all experiments the pots were weighed daily, and watered to field capacity (7.4%w/w) until heading and 10% thereafter with milli-Q water. Weekly incremental water uptake was used to estimate growth rates (a measure of osmotic stress tolerance; Munns and Tester, 2008) in Experiments 1 and 3 (Genc et al., 2016). At heading (main culm fully emerged), penultimate leaves were sampled for analysis of Na+, potassium (K+), calcium (Ca2+), magnesium (Mg2+), and Cl- (Genc et al., 2016). Handling of leaf samples and analytical methods used in nutrient analyses were described earlier (Genc et al., 2016). At maturity, grain yield per plant was determined. For across and within species comparisons, relative grain yield (the ratio of yield at an individual stress level to that under nil stress and expressed as percent) was also calculated.
Candidate Gene Selection, Primer Design, and Gene Expression in Penultimate Leaves Under Control and Salinity
Candidate genes and previously reported genes were selected based on published literature and findings of the present study (Table S2). Primers for qPCR were sourced from previous studies or designed against relevant cDNA sequences from NCBI (Table S2). Specific qPCR amplification was confirmed by obtaining a single distinct peak in melt curve analysis, and qPCR product sequencing.
Total RNA was isolated from penultimate leaves using Spectrum Plant Total RNA kit (Sigma) with an on-column DNase treatment. SuperScript III Reverse Transcriptase kit (Life Technologies) was used to synthesize the cDNA. The reaction contained 500 ng purified RNA from each sample in a final reaction volume of 20 µl, performed according to manufacturer’s instructions. The qPCR assays were prepared according to manufacturer’s instructions using PrecisionFAST qPCR mix (Primer Design Ltd). Amplification were performed in a QuantStudio 6 Flex Real-Time PCR System (Thermo Fisher) with 3 min of 95°C followed by 40 cycles of 3s at 95°C, 20s at 60°C, and fluorescent acquisition at 60°C, followed by melt curve analysis. Three wheat genes, encoding actin, glyceraldehyde 3-phosphate dehydrogenase (GAPDH), and elongation factor 1-alpha (EF1a) were used together for normalization of target gene expression. Purified PCR products of target genes, covering six orders of magnitude, were used to construct a standard curve in relation to the cycle threshold (Ct) value from which the actual copy number per microgram of RNA was obtained.
Experimental Design and Statistical Analysis
In Experiments 1 and 3 the number of pots required exceeded the size of a single growth room and consequently two growth rooms with identical settings were used (four replication in each experiment). Variety by treatment combinations were allocated to pots within each growth room using a randomized complete block design (RCBD) with two replicates. For Experiments 2 and 4, the variety by treatment combinations were allocated to pots in a single growth room using an RCBD with four replicates of each combination. To overcome the problem of variance heterogeneity, all leaf Na+ and some Cl- data were log-transformed prior to model fitting. For each experiment, analysis of measured elemental and grain yield related traits was conducted using linear mixed models that appropriately captured sources of treatment and variety variation as well as environmental variation associated with the experiments. In each model the fixed component contained term accounting for variety and treatment main effects as well as variety by treatment interaction effects. To appropriately account for extraneous variation, physical design constraints such as multiple growth rooms and replicates within growth rooms was accounted for using random effects. For any given trait, perceived observational outliers were down-weighted using a simple indicator covariate random effect term (Gumedze et al., 2010). From each of the fitted models best linear unbiased estimates (BLUEs) and standard errors for the variety by treatment interaction means were extracted for summary. For traits analysed from Experiment 1 the Honest Significant Difference (HSD) at P = 0.05 was used to control the familywise error rate when comparing between means. For traits analysed from Experiment 2, 3, and 4 where there was a reduced number of variety by treatment combinations, a Least Significant Difference (LSD) at P = 0.05 was calculated and used to compare variety by treatment means.
Similar to Genc et al. (2016), plant water uptake in Experiment 1 and 3 was statistically assessed using weekly incremental water use from 15 days of transplanting to heading of each variety. To determine differences in the rate of water use between the levels of salinity or sodicity treatments across varieties, a longitudinal regression analysis was conducted using a linear mixed model. In this model, the fixed component contained terms to model the intercept and linear slope of the water use over time for each of the variety by treatment combinations. Additional non-linearity was modelled using a random cubic smoothing spline term (Verbyla et al., 1999). For each model the estimated variety by treatment linear coefficients were extracted and an LSD at P = 0.05 was calculated to provide a comparison between estimates. Model based prediction curves of incremental water use were also calculated for graphical summary.
All linear mixed modelling of grain yield, elemental, and water use traits was computationally conducted using the flexible ASReml-R software (Butler et al., 2009) available as a package in the R statistical computing environment (R Core Team, 2018).
Genome-Wide Association Study and Identification of Candidate Genes
DNA of 100 bread wheat entries was extracted from leaf tissue using the phenol/chloroform extraction method (Williams et al., 2002) and genotyped with the 90K wheat SNP array (Wang et al., 2014). Population structure was estimated using ADMIXTURE (v1.23) software (Alexander and Lange, 2011) which uses a model-based algorithm to estimate the ancestry of individuals. Cross-validation was used to determine the most likely number of clusters to be used in the subsequent modelling. For the 100 bread wheat entries, the BLUEs of Na+ extracted from the fitted model of Experiment 1 were used in genome-wide association mapping, based on 41,035 SNP markers with minor allele frequency (MAF)>0.05 and <50% missing call rate. For each SNP, a mixed-linear model (MLM) was fitted where the fixed component of the model contained a numerical version of the SNP as well as a covariate to adjust for the confounding effects of population structure. The MLM also contained a random effect for the lines with an assumed variance structure equivalent to the kinship matrix centred using the IBS method and then compressed to optimum groups. This then allowed the P3D (population parameters previously determined) compressed MLM method to be used to speed up computation time (Zhang et al., 2010). From each of the fitted models, SNP effects were assessed using a significant p-value threshold set at P = 8.91e-5 equivalent to α level of 0.05 after adjusted Bonferroni correction using the simpleM method (Gao et al., 2008). Bonferroni correction assumes that the hypothesis tests are independent which is not true due to linkage disequilibrium among the SNP in GWAS study. Briefly, the simpleM method calculated the effective number of independent test using principal component analysis based on the SNP data. Subsequently, the number of test in the Bonferroni correction formula was replaced by the effective number of independent test. All genome wide association mapping and assessment was computationally conducted using TASSEL software (Bradbury et al., 2007). Based on the physical position of the markers and high confidence gene content in the Chinese Spring Reference Genome (IWGSC RefSeq v1.0), genes located within a 700 kb region flanking the significant SNP were reported. Genes were annotated using IWGSC RefSeq v1.0 annotation available in URGI (https://wheat-urgi.versailles.inra.fr/Seq-Repository/Annotations).
Results
Experiment 1. Genome-Wide Association Mapping of Na+ Accumulation in 100 Bread Wheat Entries
Given the benefits of Na+ exclusion under sodicity but not salinity observed in our initial study (Genc et al., 2016), here we screened a bread wheat diversity set under sodicity to determine genetic variation for Na+ exclusion. Figure 1 and Table S3 show that there is genetic variation in Na+ exclusion (P < 0.001), but almost all elite bread wheat entries had high Na+ exclusion (approx. <2,000 mg Na+ kg-1 DW), compared to typical durum wheat entries (approx. 15,000–30,000 mg Na+ kg-1 DW). Leaf Na+ concentrations in bread wheats varied from 50 mg kg-1 DW in Westonia-Nax2 to 2,800 mg kg-1 DW in cv. Olympic. The only exceptions to this were two bread wheat germplasm lines (MW#451 and MW#293; approx. >15,000 mg Na+ kg-1 DW) which grouped with the durum wheats. The presence of Na+ exclusion genes Nax1 and Nax2 in durum wheat (Nax1 and Nax2 in WID902; Nax2 in Tamaroi) was associated with much lower Na+ concentrations (approx. 600–4,000 mg kg-1 DW) than in durum wheats lacking these genes (Figure 1, Table S3).
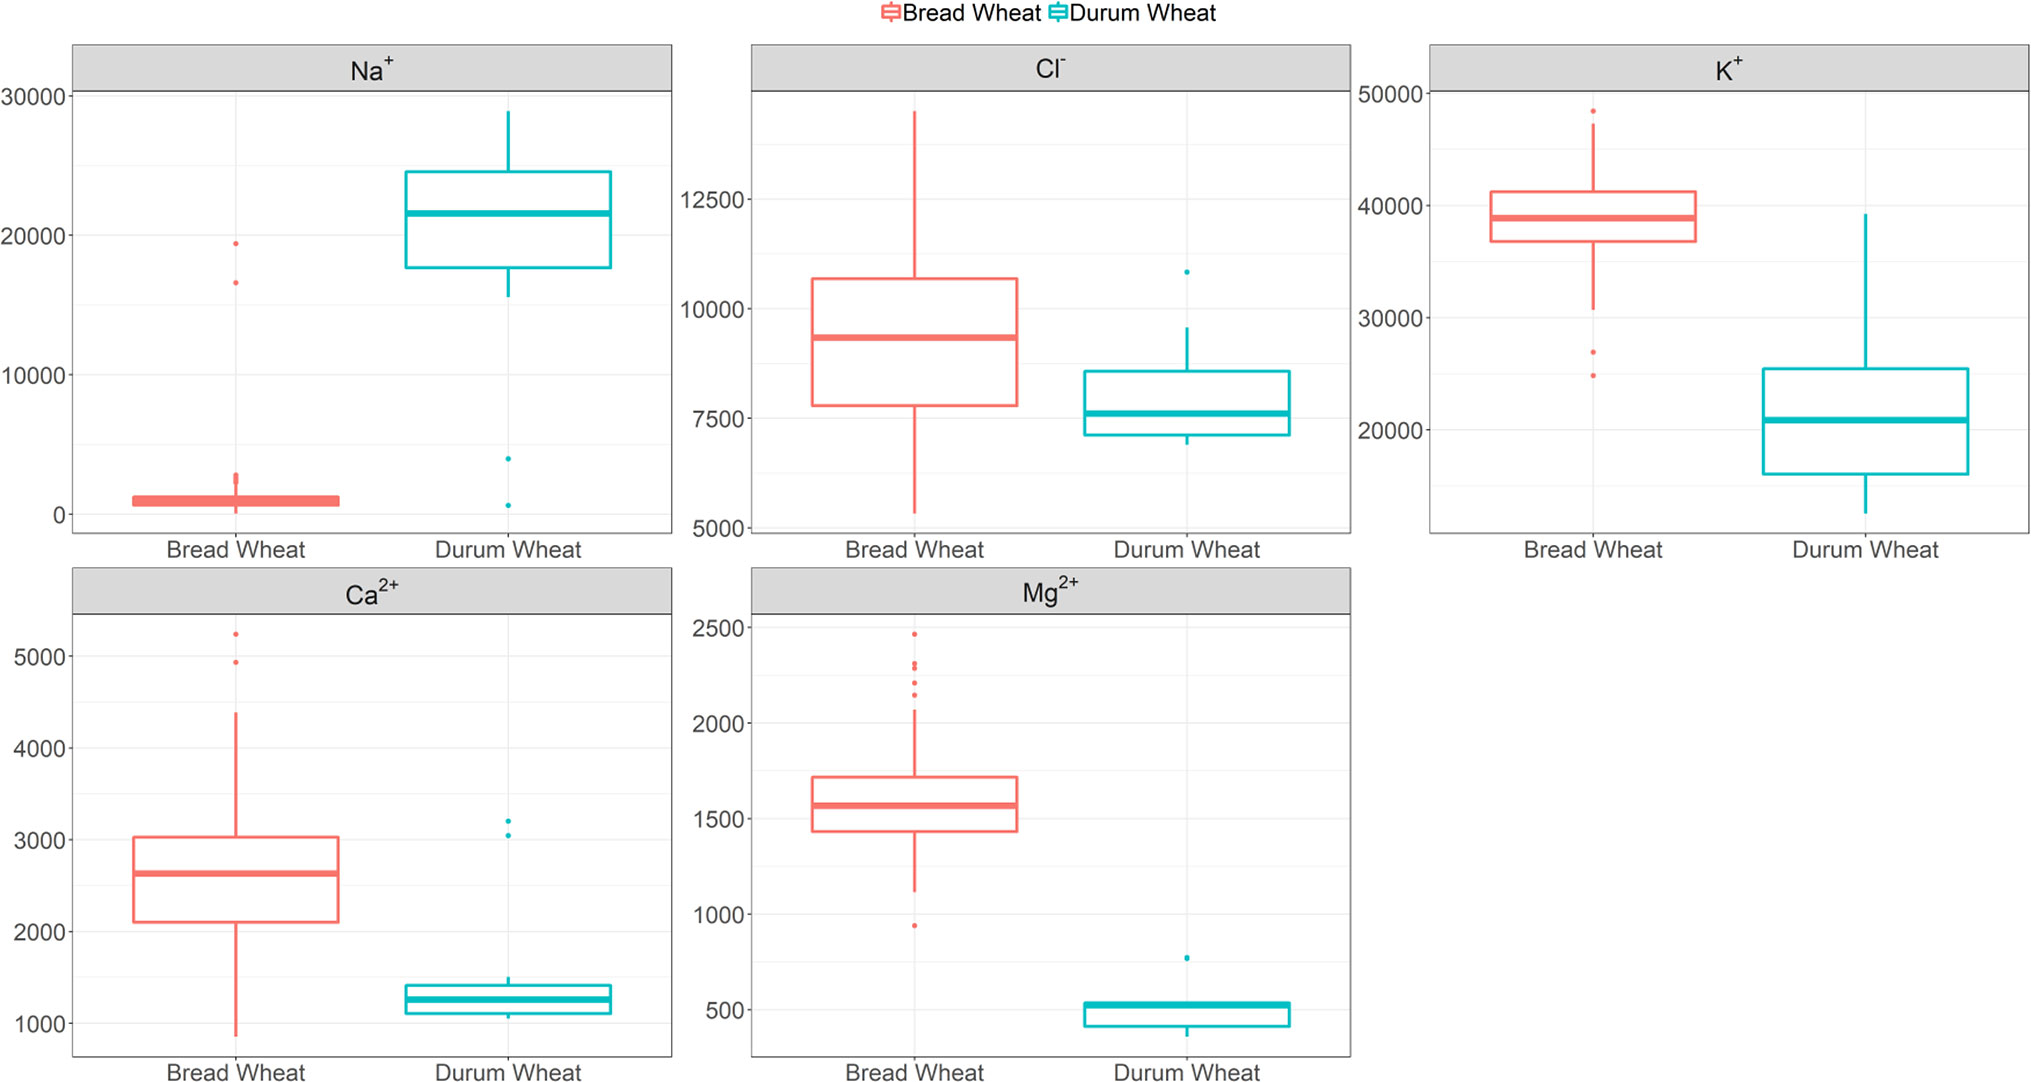
Figure 1 Boxplots of leaf Na+ (back-transformed), Cl-, K+, Ca2+ and Mg2+ concentrations (mg kg-1 DW) at heading in 100 bread wheat entries, 12 durum wheat entries and a barley cultivar grown under sodicity (8 g kg-1 Na+-humate) in Experiment 1 (n = 4). See Table S3 for individual responses. The box represents the middle 50% of the distribution (the median is drawn as the solid line within the box) with whiskers extending to the lowest/highest value within 1.5* IQR (Inter-Quartile Range). Values outside this range are plotted separately.
Calcium, K+, and Mg2+ concentrations varied significantly amongst the bread wheat entries (850–5,240, 24,820–48,400, and 940–2,460 mg kg-1 DW, respectively), but variations were much lower than those observed for Na+ concentration, and values were lower in durum wheats (Figure 1, Table S3).
Single Nucleotide Polymorphism Markers Significantly Associated With Na+ Concentration in 100 Bread Wheat Entries
Genome-wide association mapping was performed with 41,035 SNP markers (MAF > 5%) in 100 bread wheat entries taking population structure effect (K = 3) into account (Figure S1). We identified nine SNPs significantly (P-value < 8.91e-5) associated with leaf Na+ concentration (log-transformed) (Table S4, Figure 2). Using the IWGSC RefSeq v1.0, seven SNPs were mapped to chromosomes 2A, 2B, 2D, 4B, 4D, 5B, and 7A We examined the high confidence (HC) genes located within 700Kb left and right of each significant SNP, and identified four candidate genes with potential functions in Na+ accumulation/exclusion. These were calcium-transporting ATPase (TraesCS4D01G343200.1), Na(+)/H(+) antiporter NhaB (TraesCS4D01G344200.1), AquaporinTIF1-4 (TraesCS4D01G344300.1), and Aquaporin PIP2 (TraesCS4B01G362300.1). It is notable that MW#451 and MW#293 contain the rare alleles that gave rise to extremely high Na+ concentrations (allele effects for SNPs shown in Table S5). We did not identify any mapped significant SNPs in proximity to the Na+ exclusion genes Nax1 (2A) and Kna1 (4D; TaHKT1;5-D) which is homologous to Nax2 in the diploid bread wheat ancestor T. monococcum.
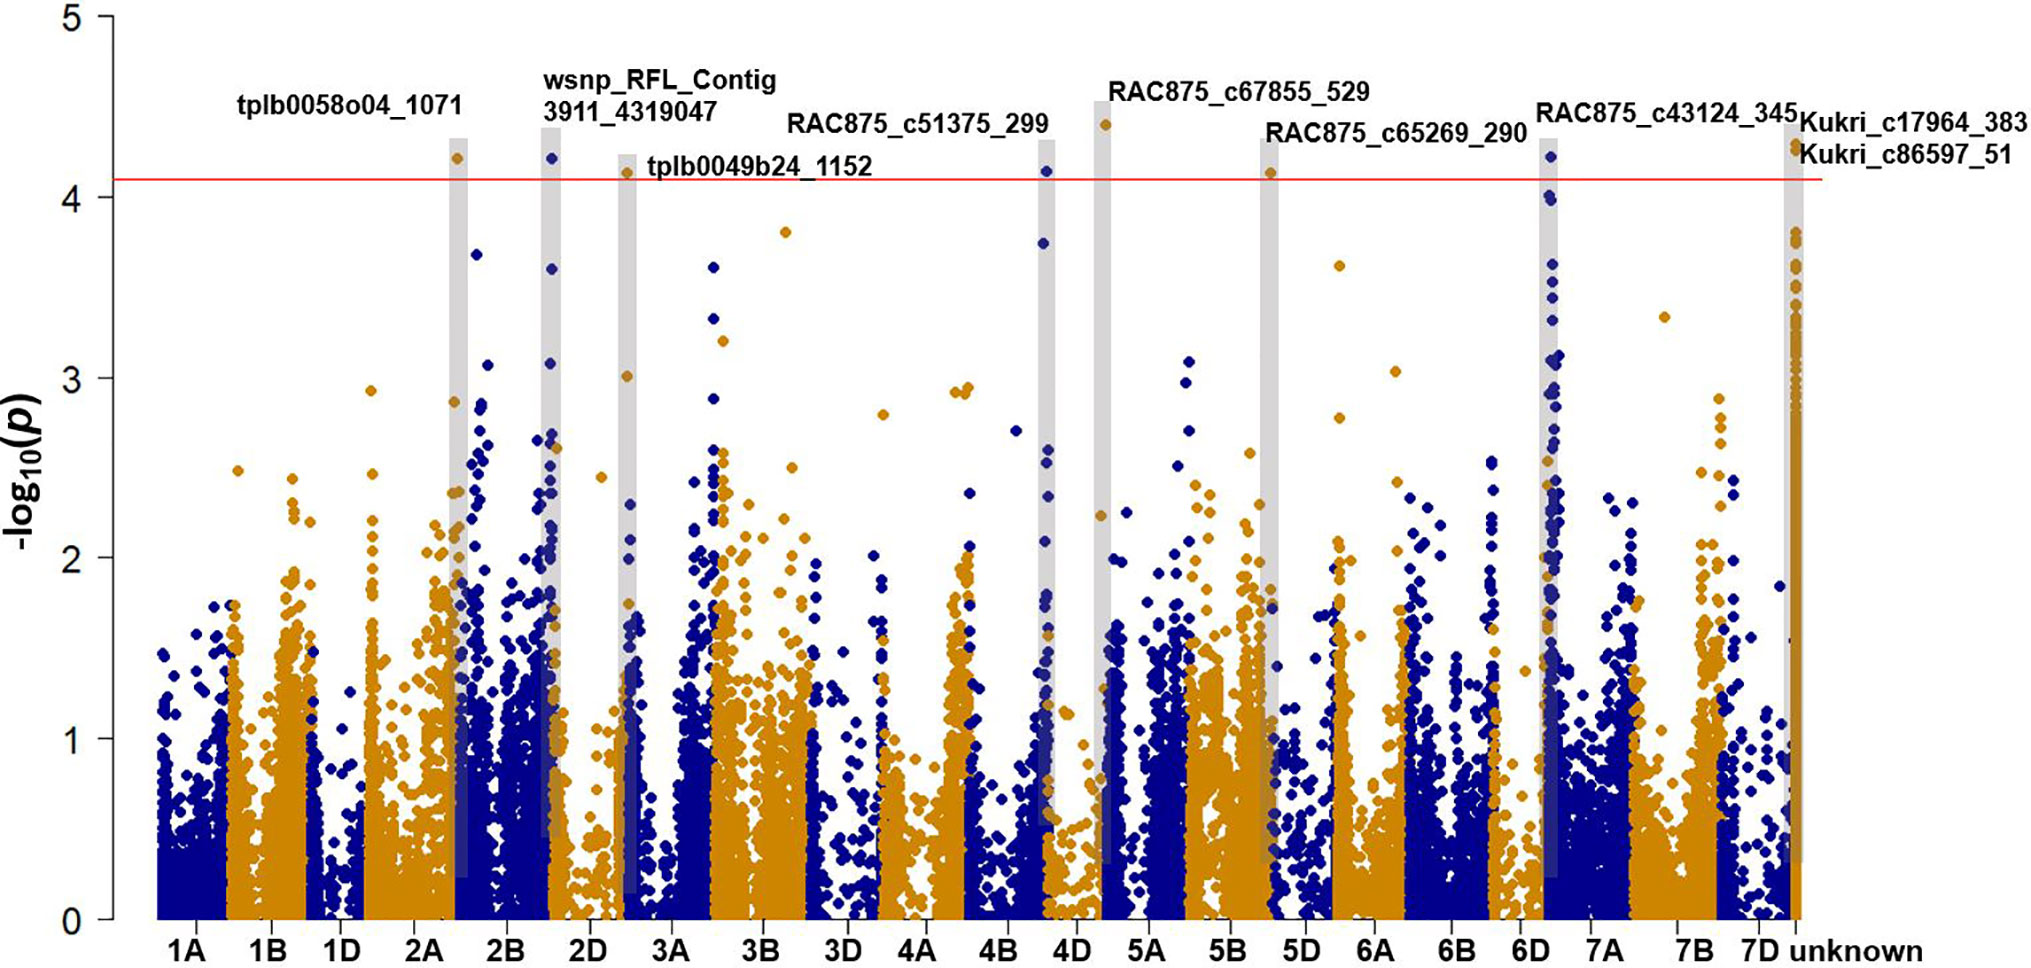
Figure 2 Manhattan plot showing the association signals for leaf Na+ concentration using 100 bread wheat entries grown under sodicity (8 g kg-1 Na+-humate) in Experiment 1 (n = 4). The x-axis indicates the physical location of SNP markers along each wheat chromosome; the y-axis shows the P-value of SNP markers for the association test on a log scale. The horizontal red line indicates the significance threshold (P-value = 8.91e-5). The marker names of SNPs above the threshold are shown.
Experiment 2. Growth Responses of Westonia, Westonia-Nax1, Westonia-Nax2, and Baart-46 Under a Range of Salinity and Sodicity
Given the lack of SNPs associated with Nax genes observed in Experiment 1, we proceeded with a phenotype experiment to investigate further.
A regression analysis of weekly incremental water use indicated that all wheat lines had reduced water uptake and consequently reduced growth rates under increasing salinity and sodicity (Figure S2, Table S6), and reductions were greater under salinity than sodicity. Under salinity, there were no differences amongst the Westonia lines, while Baart-46 had higher growth rates than the Westonia lines until 100 mM NaCl was reached. Under sodicity, Westonia-Nax1 had higher growth rate than Westonia-Nax2 at 8 g kg-1 soil Na+-humate, but there were no other significant differences amongst Westonia lines at other levels. Baart-46 had higher growth rates than Westonia lines at all levels of sodicity (Table S6).
Penultimate leaf Na+ concentrations were higher under sodicity than salinity (Figure 3, Tables S7 and S8). Baart-46 maintained higher Na+ concentrations than Westonia and Nax lines under both stresses (Figure 3, Tables S7 and S8). As compared to Westonia, the presence of Nax1 and Nax2 genes was associated with reduced Na+ concentrations (Figure 3, Tables S7 and S8). Reductions were similar for both genes, and became more pronounced at higher rates of salinity and sodicity, reaching maxima of 72–82% and 32–34% reductions at 8 g kg-1 Na+-humate and 100 mM NaCl, respectively. Chloride concentrations were much higher under salinity than sodicity, and higher in Baart-46 than Westonia and Nax lines, the latter group being similar to each (Figure 3, Tables S7 and S8). For other cations, Ca2+ concentrations were lower under sodicity than salinity, Mg2+concentrations were similarly low under both salinity and sodicity, while K+ concentrations remained unaffected, either by salinity or sodicity (Table S7). The most notable genetic differences were higher K+, and lower Ca2+ and Mg2+ in Baart-46 than the other three lines under salinity and sodicity. Reduced Na+ concentrations in the Westonia Nax lines was not accompanied by higher grain yield, with small grain yield increases observed only under moderate salinity and low sodicity (6–9% at 50 mM NaCl and 5–10% at 2 g kg-1 Na+-humate) (Table 1). At these salinity and sodicity rates, despite much higher Na+ concentrations than Westonia and Nax lines, cv. Baart-46 was similar or higher for grain yield (Table 1; Figure 3). There were no other notable differences in salinity or sodicity tolerance (relative grain yield %) amongst the four bread wheat lines and salinity/sodicity rates (Table 1).
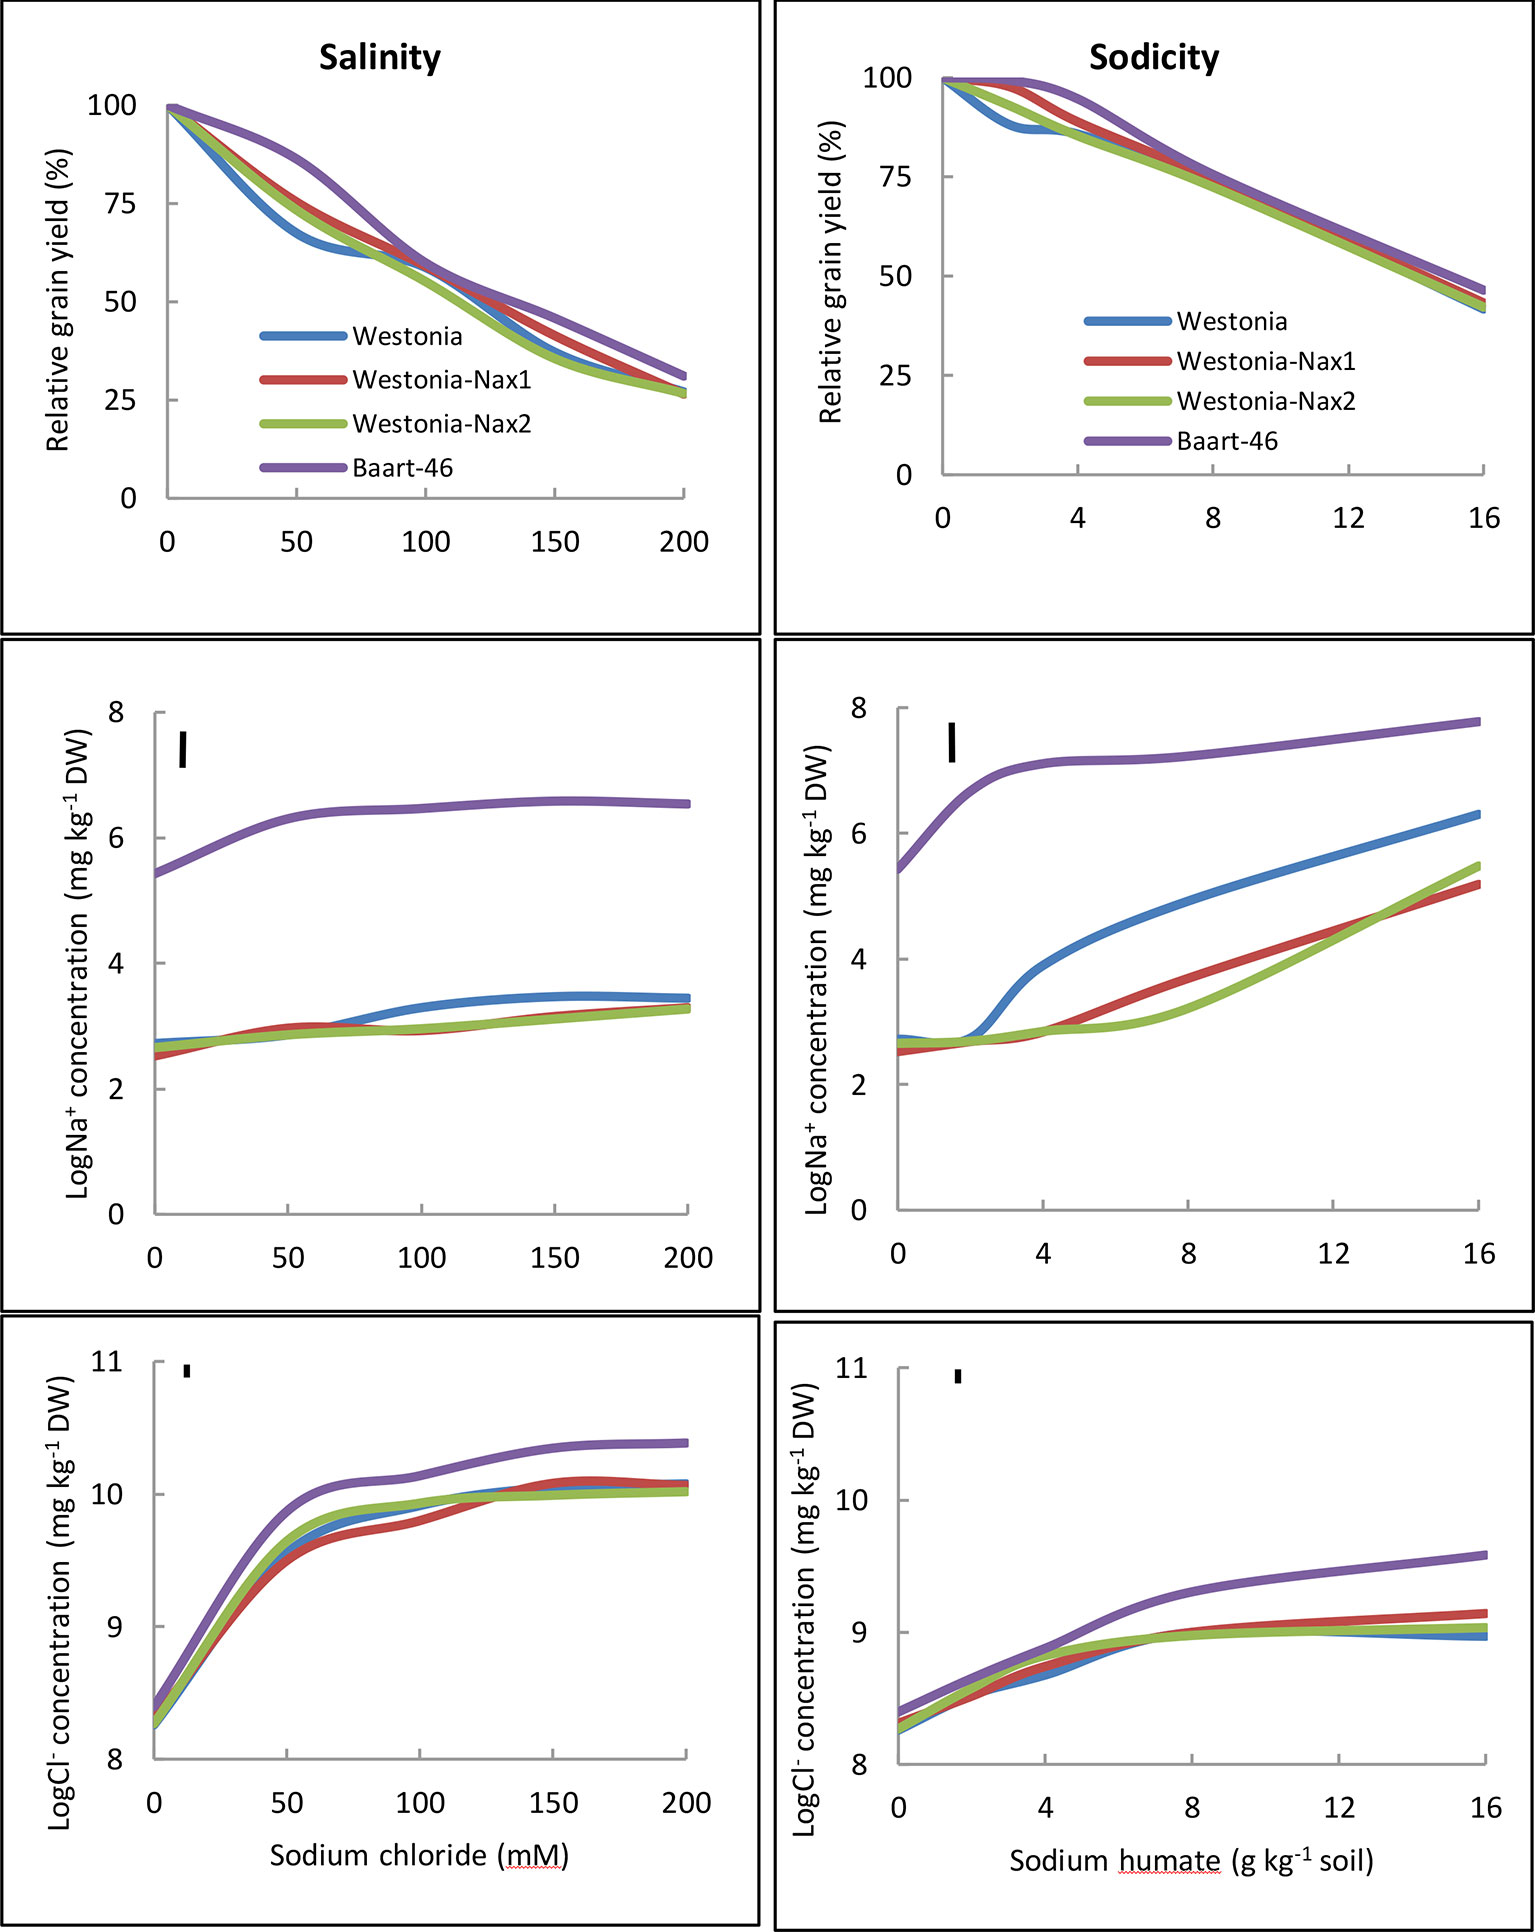
Figure 3 Relative grain yield (%) (salinity or sodicity tolerance), and best linear unbiased estimates for leaf Na+ and Cl- concentrations in wheat cv. Westonia, Westonia-Nax1, Westonia-Nax2 and Baart-46 under different levels of salinity (left panels) and sodicity applied as Na+ humate (right panels) in Experiment 2 (n = 4). The vertical bars indicate Least Significant Difference test value at P = 0.05 for variety x treatment interaction. See Table S8 for back-transformed Na+ and Cl-concentrations for comparisons with published data.
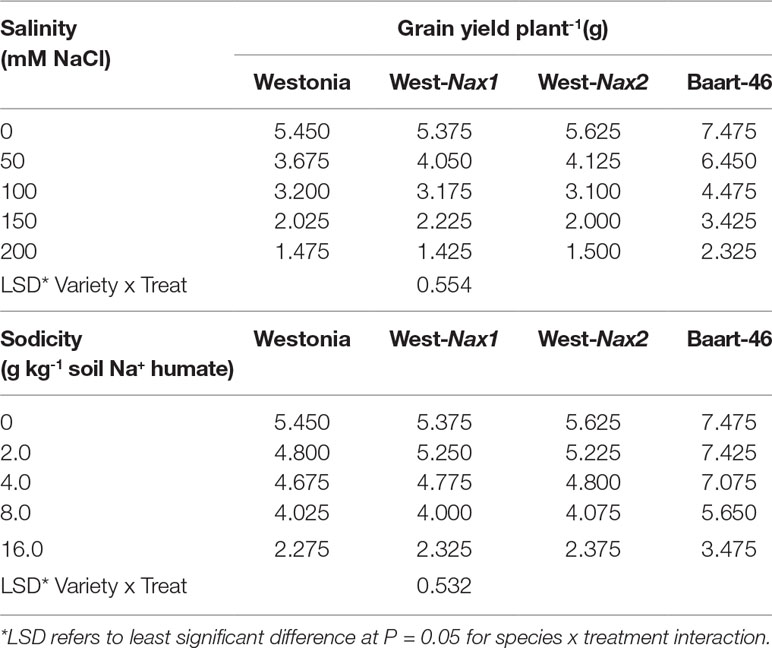
Table 1 Best linear unbiased estimates for grain yield in bread wheat Triticum aestivum L.) cv. Westonia, Westonia-Nax1, Westonia-Nax2, and Baart-46 under different levels of salinity and sodicity in Experiment 2 (n = 4).
Experiment 3. Effects of a Wide Range of Na+ Exclusion on Salinity and Sodicity Tolerance in 20 Bread Wheats, Three Durum Wheats, and a Barley Entry
To expand our investigation in Experiment 2, we studied a wider range of germplasm.
Regression analyses of incremental water use up to heading stage indicated that growth rates were reduced significantly by salinity and sodicity in all bread wheats, durum wheats, and barley cv. Clipper, with a much lower reduction occurring in bread wheat germplasm line MW#293 which had the highest growth rate under salinity and sodicity (Table S9, Figure S3). The Nax2 gene in durum wheat Tamaroi was associated with a non-significant increase in growth rate under sodicity, while there was no benefit under salinity. Barley cv. Clipper had generally higher growth rates than the averages of bread wheats under salinity and sodicity. There were also differences in growth rates under control.
Salinity and sodicity increased leaf Na+ concentrations in all entries, and concentrations were higher under sodicity than salinity (Table 2). Amongst the commercial wheats, older cultivars such as Federation and Baart-46 had higher Na+ concentrations (approx. 430–460 and 1,700-1,800 mg kg-1 DW under salinity and sodicity) than modern cultivars (approx.< 400 and 1,200 mg kg-1 DW under salinity and sodicity) (Table 2). However, none of the cultivars had Na+ concentrations as high as the two novel germplasm lines (MW#451 and MW#293) derived from wild relatives of bread wheat (Thinopyrum junceum and Aegilops speltoides) (back-transformed averages of these two lines; approx. 5,600 and 13,000 mg Na+ kg-1 DW under salinity and sodicity, respectively) (Table 2). There was a significant correlation between Na+ concentration under salinity and sodicity (r = 0.984, df = 18, P < 0.01) (Figure 4). Barley entry Clipper had Na+ concentrations (approx. 7,000 and 17,000 mg kg-1 DW under salinity and sodicity) as high as those in high-Na+ wheat germplasm lines MW#293 and MW#451, while durum wheats Yawa and Tamaroi had overall the highest Na+ concentrations (approx. 6,700 and 11,400 under salinity; 20,600 and 32,700 mg kg-1 DW under sodicity, respectively). As expected, concentrations of Cl- rose significantly under salinity in all entries, and the increases were similar for the three species (Table 2).
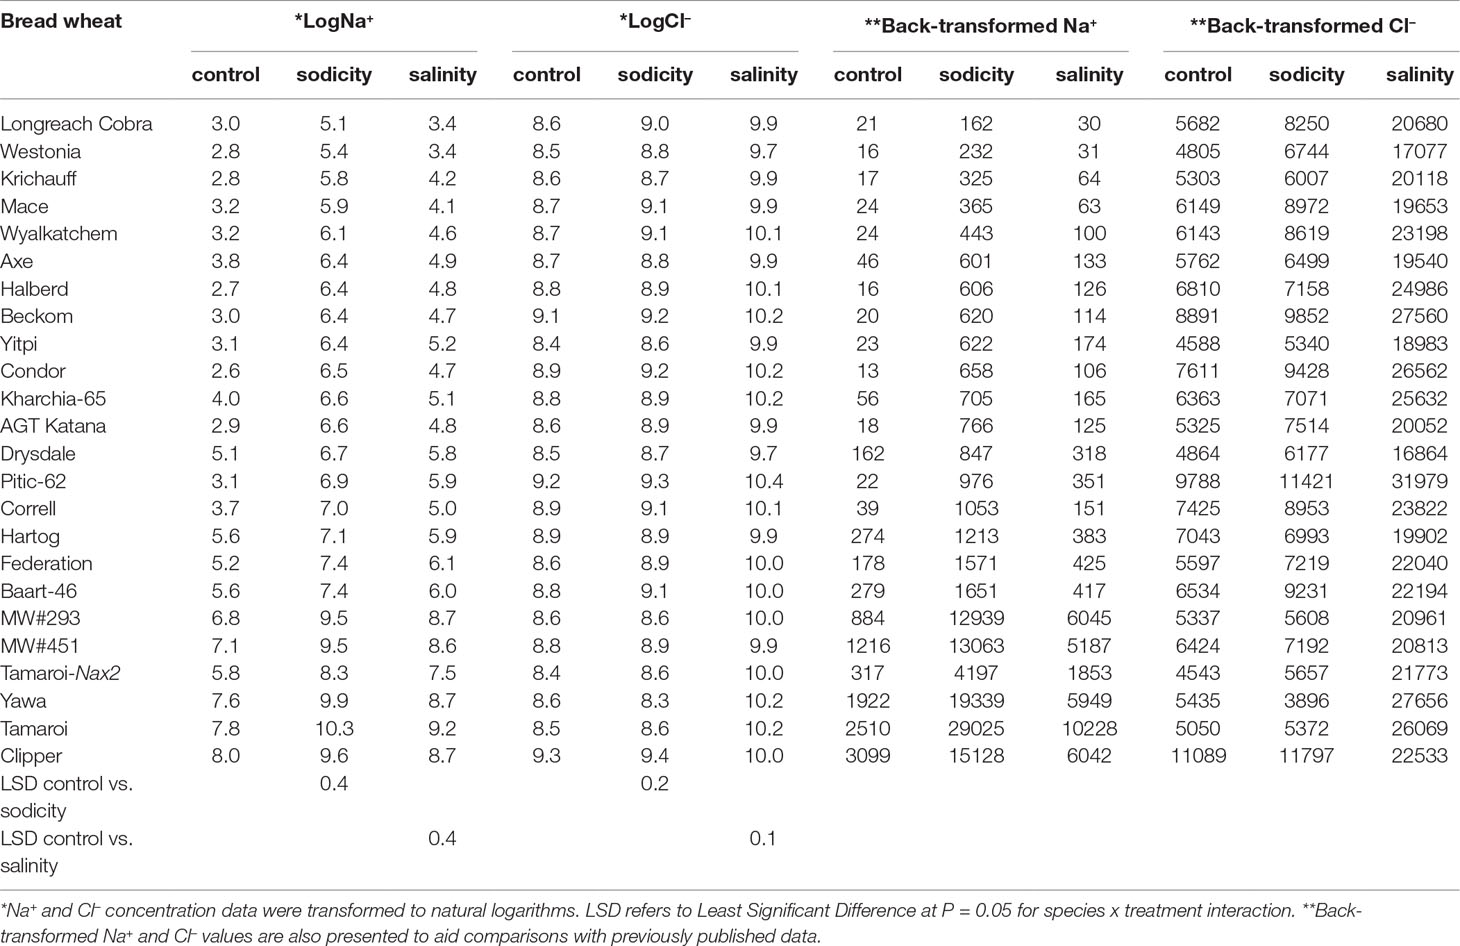
Table 2 Best linear unbiased estimates for leaf Na+and Cl- concentrations (mg kg-1 DW) in 20 bread wheat entries (Triticum aestivum L.), three durum wheat entries (Triticum turgidum subsp durum cv. Tamaroi, Tamaroi-Nax2, and Yawa), and one barley cultivar (Hordeum vulgare L.cv. Clipper) under control, salinity (100 mM NaCl), and sodicity (8 g kg-1 Na+-humate) in Experiment 3 (n = 4).
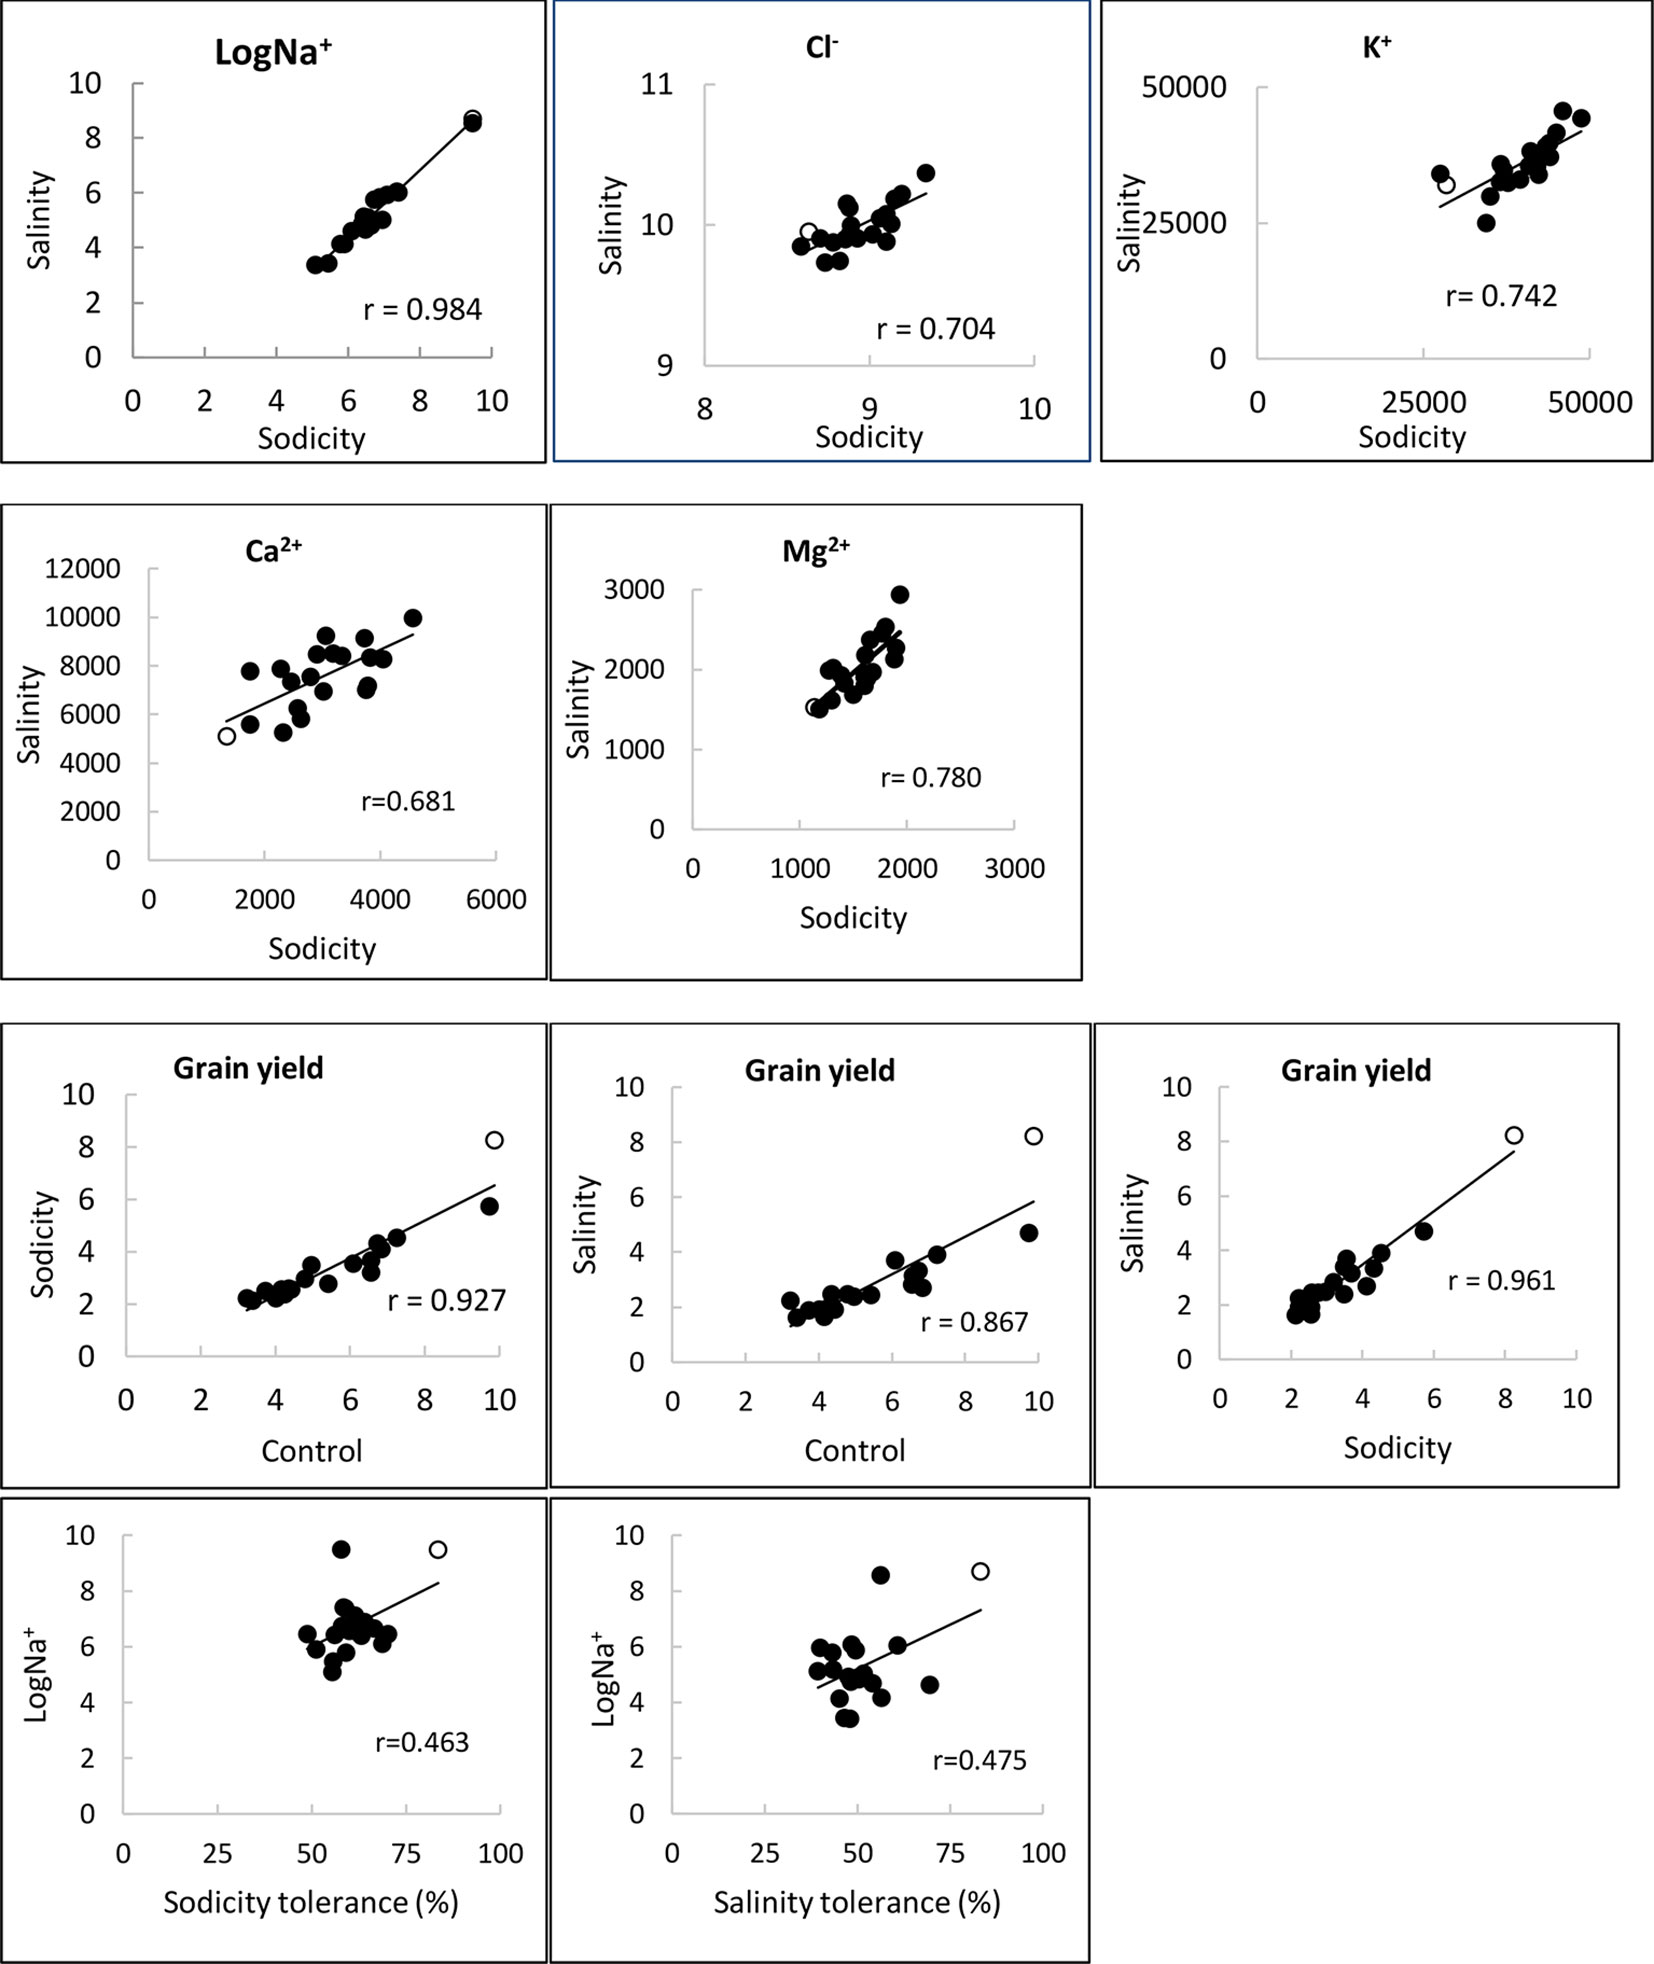
Figure 4 Relationships of Na+, Cl-, K+, Ca2+ and Ma2+ concentrations (mg kg-1 DW), and grain yield (g plant-1) under control, salinity (100 mM NaCl) and sodicity (8 g kg-1 Na+-humate) in 20 bread wheat entries in Experiment 3 (n = 4) (r = 0.561,df = 18, P < 0.01). MW#293 is shown as an empty circle.
The other cations measured were K+, Ca2+, and Mg2+. Reduced concentrations of K+ and Ca2+ under sodicity and salinity were moderate, while Mg2+ was significantly reduced, especially under sodicity (Tables S9 and S10). Durum wheats Yawa and Tamaroi and barley entry Clipper exhibited mild Mg2+ deficiency symptoms under sodicity. There were significant correlations between salinity and sodicity for concentrations of K+, Ca2+, and Mg2+ (Figure 4).
Bread wheat entries varied in grain yield under control, sodicity and salinity (3-, 4-, and 5-fold, respectively; Figure 5). Axe produced the lowest, while germplasm line MW#293 produced the highest grain yield under all conditions and doubled the grain yield of almost all other entries under salinity and sodicity (Figure 5). There was a close correlation between grain yield produced under control and either salinity or sodicity (r = 0.867 and r = 0.927 when comparing control vs salinity or control vs sodicity) (Figure 4). The correlation was even greater when grain yields were compared between salinity and sodicity (r = 0.961, df = 18, P < 0.01) (Figure 4). Depending on wheat entries, tolerance (relative grain yield %) was higher, lower, or similar between salinity and sodicity (Figure 5). Similar to water use, the most noteworthy effects were the higher sodicity tolerance in Tamaroi-Nax2 compared to Tamaroi, and the highest salinity and sodicity tolerance in MW#293 (Figure 5). There was a modest positive correlation between leaf Na+ concentration and salinity or sodicity tolerance (Figure 4; df = 18, P < 0.05; r = 0.475 and r = 0.463 for sodicity and salinity respectively). However, this relationship was greatly influenced by the inclusion of MW#293. When MW#293 was omitted from the analyses, there were no correlations.
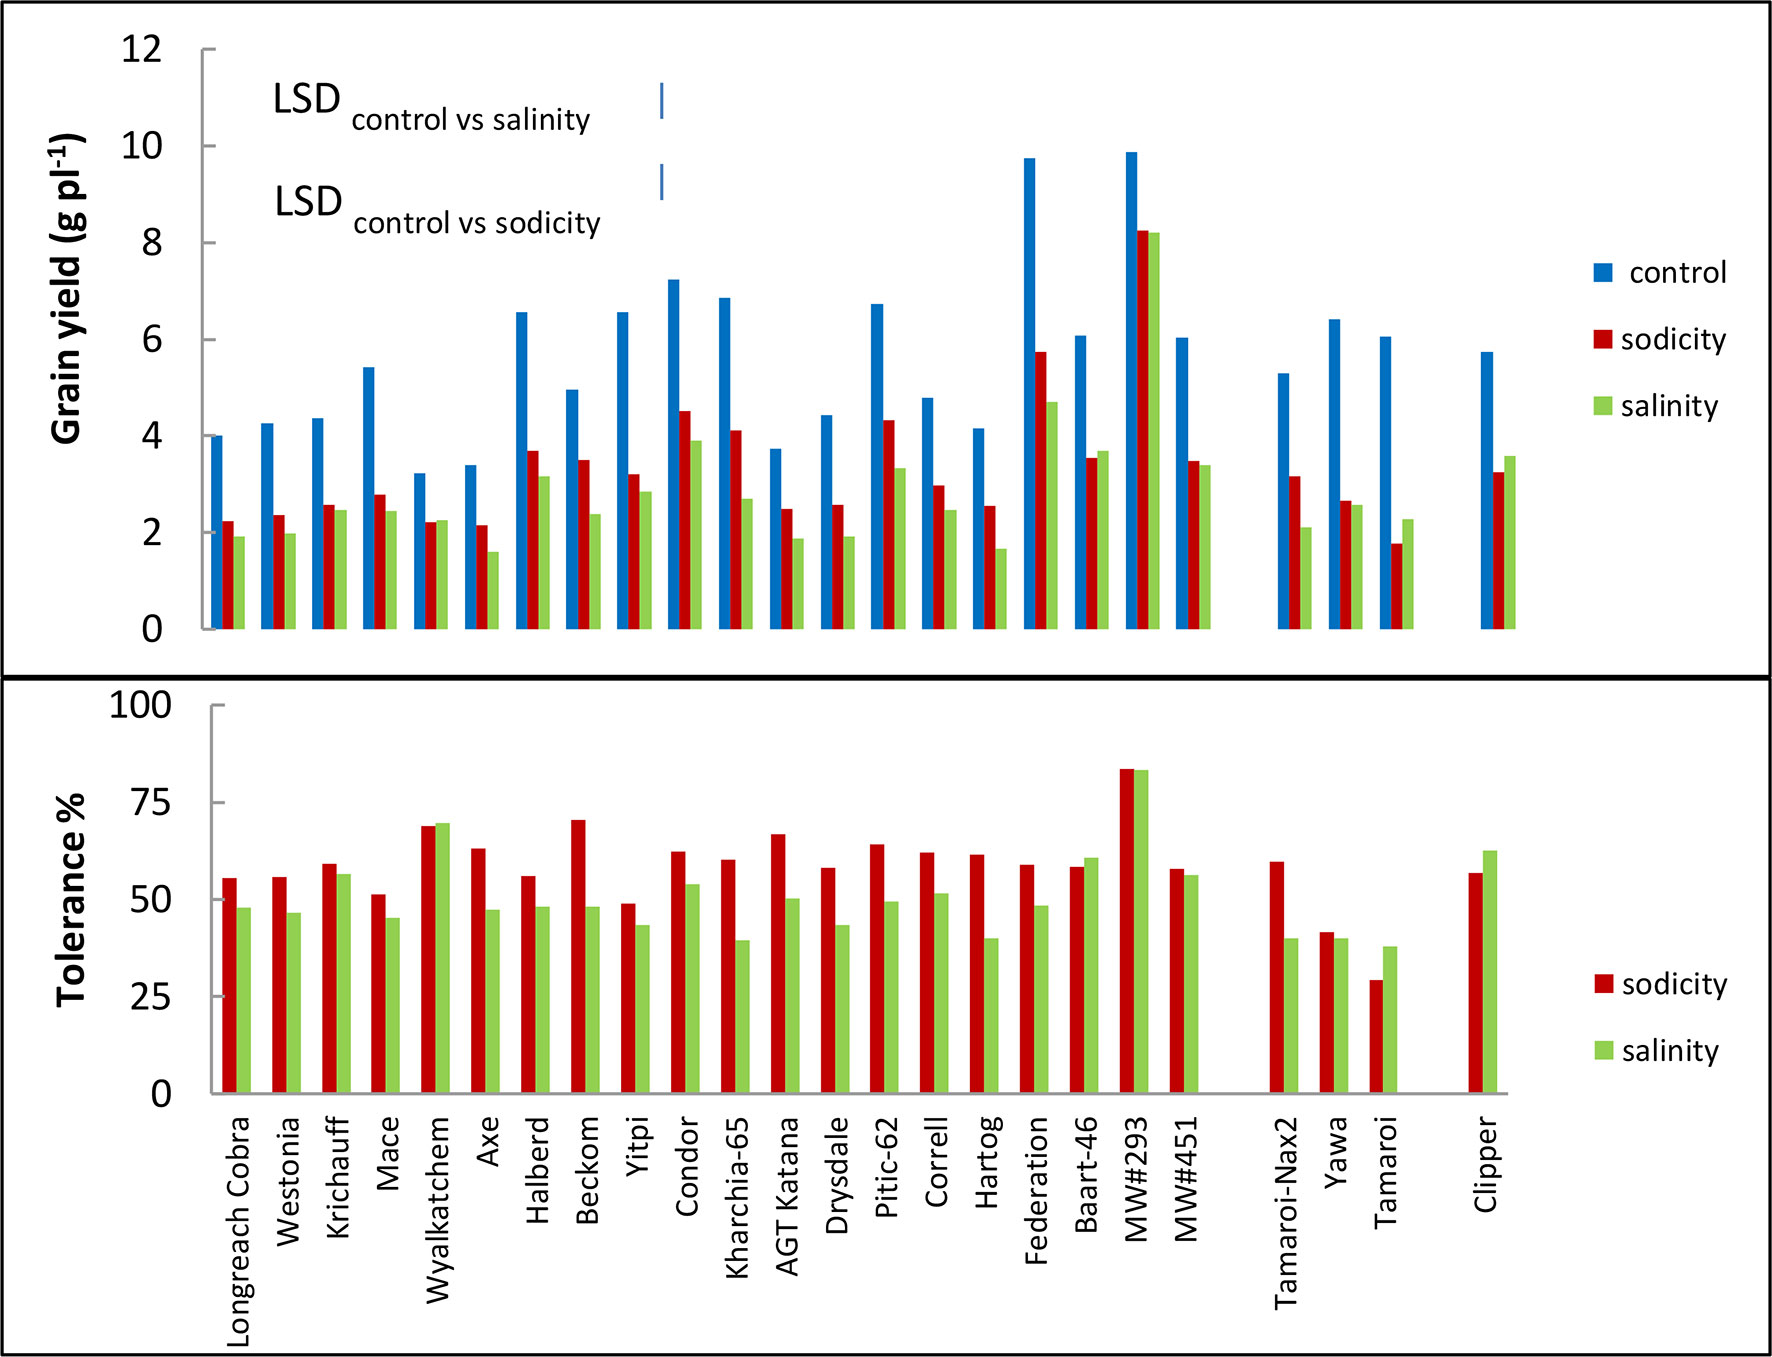
Figure 5 Best linear unbiased estimates for grain yield, and tolerance (grain yield under sodicity or salinity as a percentage of grain yield under control) of 20 bread wheat entries (Triticum aestivum L.), three durum wheat entries (Triticum turgidum subsp durum cv. Tamaroi, Tamaroi-Nax2 and Yawa) and one barley (Hordeum vulgare L. cv. Clipper) in Experiment 3 (n = 4). The vertical bars indicate Least Significant Difference test value at P = 0.05 for variety x treatment interaction. Entries are ordered in ascending order of leaf Na+ concentration.
Experiment 4. Grain Yield, Leaf Element Concentration, and Expression Profiling of Selected Genes of Interest
The five wheat lines varied significantly in grain yield under control and salinity; higher yielding lines under control were also higher yielding under salinity (Figure 6). Mace was the lowest yielding, while MW#293 the highest. Salinity tolerance measured as relative grain yield (%) ranged from 47% in Mace to 81% in MW#293. Salinity increased leaf Na+ concentrations significantly but mainly in MW#451 and MW#293 (approx. 7,770 and 8,400 mg kg-1 DW, respectively), almost two orders of magnitude higher than for Mace, MW#28, and MW#491 (35, 122 and 124 mg kg-1 DW, respectively) (Figure 6). In agreement with Experiment 3, Cl- concentrations increased significantly under salinity (Figure 6). Despite differences across wheat lines and treatments, leaf Ca2+, K+, and Mg2+ concentrations were all above the critical levels for deficiency thus indicating adequate nutrition (Figure S4, Reuter and Robinson, 1997).
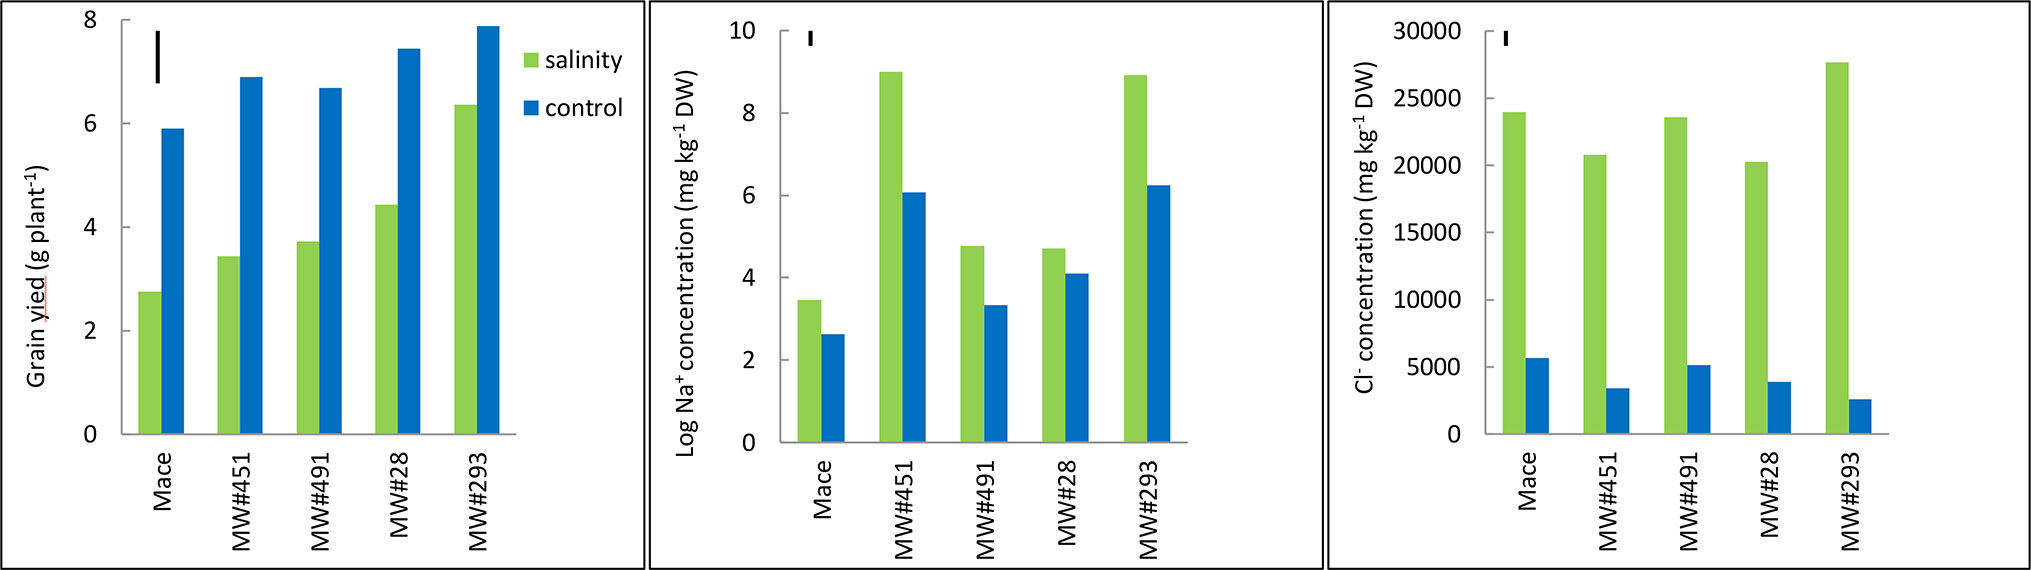
Figure 6 Best linear unbiased estimates for grain yield, and leaf Na+ and Cl- concentrations at heading in bread wheat cv. Mace, and two low-Na+ (MW#28 and MW#491) and two-high Na+ (MW#293 and MW#451) doubled-haploid lines selected from a cross between Mace and high-Na+ germplasm W4909 (n = 5). Sodium concentration data were transformed to natural logarithms. The vertical bars indicate Least Significant Difference test value at P = 0.05 for variety x treatment interaction. Wheat lines are ordered in ascending order of salinity tolerance (ratio of grain yield under salinity to grain yield under control, expressed as percent).
A number of genes were selected for analysis of gene expression (Table S2). These included: Three candidate genes identified by GWAS in Experiment 1, five previously published genes that were differentially expressed under control and salt, and between the parental line W4909 (high-Na+ bread wheat) and cv. Chinese Spring (low-Na+ bread wheat) (Mott and Wang, 2007), and the Nax1 (TmHKT1;4-A2) gene (Tounsi et al., 2016). One of the three candidate genes (calcium-transporting ATPase) and Nax1 gene had very low levels of expression, data not shown, while two candidate genes (Na+/H+ antiporter NhaB and Aquaporin TIF1-4) were differentially expressed between wheat lines and treatments. Na+/H+ antiporter NhaB was highly expressed in low-Na+ wheat lines Mace, MW#28, and MW#491, while very low expression levels were observed in high-Na+ wheat lines MW#293 and MW#451 (Figure S5). Wheat lines showed similar expression levels under control and salinity, with the notable exception of MW#491 showing higher expression under salinity (Figure S5). Aquaporin TIF1-4 levels were higher in wheat line Mace than the other four wheat lines, and levels varied depending on treatments; lower (Mace and MW#451), higher (MW#293), or no change (MW#28 and MW#451) under salinity (Figure S5). Of the five previously reported genes, four (Na+/H+ antiportersNHX1 and NHX2, putativehigh affinity potassium transporter, and vacuolar pyrophosphatase [TaAVP1] similar to AVP1) were differentially expressed between wheat lines and treatments (Figure S5). The main effects were (i) higher expression of putative high-affinity potassium transporter and NHX2 in MW#293 and (ii) higher expression of NHX1 in MW#451 under salinity, and (iii) lower expression of AVP1 like gene in MW#451 and MW#293 under both control and salinity (Figure S5). Moreover, the probe set Ta.22954.1.S1_at showed very low levels of expression in the present study (data not shown); in contrast to an 8-fold higher expression in high-Na+ bread wheat germplasm line W4909 (parental line of MW#293) compared with low-Na+ Chinese Spring bread wheat under salinity (Table S2 in Mott andWang 2007).
Discussion
Sodium Exclusion in Bread Wheat and Its Relationship With Salinity and Sodicity Tolerance as Measured by a Novel Screening Method
Our results, along with other studies (e.g. Paull et al., 1994), demonstrate that whilst there is genetic variation for Na+ concentration in modern bread wheat (n = 98; Table S3, Figure 1), most wheats contain relatively low Na+ concentrations. In modern bread wheat we found no correlation between leaf Na+ concentration and either salinity or sodicity tolerance based on grain yield (n = 18; Experiment 3). In fact, wheat germplasm MW#293 carrying alien introgressions achieved the highest salinity tolerance despite having a 14-fold higher Na+ concentration (6,044 mg kg-1 DW) than the highest of the naturally occurring bread wheats (cv. Federation, 425 mg kg-1 DW) (Table S1). Similarly, under sodicity MW#293 had a 7-fold higher Na+ concentration (12,939 mg kg-1 DW) than the second highest bread wheat cv. Federation (1,651mg kg-1 DW), and still had the highest sodicity tolerance (Figure 5, Table 2). Despite the prevailing opinion that low Na+ confers tolerance, the results in Experiment 3 and other studies in wheat, barley, and maize show that low Na+ concentration is not necessarily associated with salinity tolerance (Rawson et al., 1988; Alberico and Cramer 1993; Cramer et al., 1994; Glenn et al., 1997; Brini et al., 2007; Genc et al., 2007; Ul Haq et al., 2014; Genc et al., 2016; Setter et al., 2016). This suggests that additional mechanisms (tissue tolerance/osmotic adjustment) need to be considered in order to breed salinity tolerant bread wheat.
Effects of Nax1 and Nax2 on Salinity and Sodicity Tolerance in Low-Na+ Bread Wheat Cv. Westonia
Our results confirm that Westonia-Nax1 and Westonia-Nax2 lines were lower in leaf Na+ concentration compared to Westonia, and showed slightly higher but non-significant grain yield increase at moderate salinity (50 mM NaCl) and low sodicity (2 g kg-1 Na+-humate) (Figure 3, Tables S7 and S8). However, compared to high-Na+ bread wheat Baart-46, Na+ concentrations of Westonia and Nax lines were low, and hence small differences in Na+ concentration between Westonia and the Nax lines are unlikely to make a difference to grain yield (Figure 3, Tables S7 and S8). This supposition is supported by two lines of evidence: In Experiment 2, Baart-46 had much higher Na+ concentration but yielded higher than the three Westonia lines at all levels of salinity and sodicity. Secondly, in saline field trials, only one Westonia-Nax2 line (5924) yielded higher (11%) in 2009 but lower (6.5%) in 2011 than Westonia, while the other four Westonia-Nax lines were, on average, no different to Westonia (Tables S1 and S3; Setter et al., 2016). The results indicate that transferring Nax1 and Nax2 genes into an already efficient Na+ excluding bread wheat confers little, if any, improvement in overall salinity tolerance. Unlike low-Na+ bread wheat, when the Nax2 gene was introduced into high-Na+ durum wheat cv. Tamaroi, a significant yield increase was reported under salinity in the field (Munns et al., 2012) and under sodicity in the growth room (Genc et al., 2016). The differences between the Na+ excluding abilities of bread and durum wheats are attributed to modern bread wheats possessing homologs of the Na+ exclusion genes Nax1 and Nax2 and/or other Na+ exclusion genes (Byrt et al., 2007; cf. Genc et al., 2010; Hussain et al., 2017; Oyiga et al., 2018), while durum wheats are thought to lack such genes. Hence, the introduction of Nax type genes is more useful in durum wheat backgrounds.
SNPs and Candidate Genes for Na+ Accumulation, and Their Relationships With Salinity Tolerance
Of the nine SNPs significantly associated with leaf Na+ concentration, seven were mapped to chromosomes 2A, 2B, 2D, 4B, 4D, 5B, and 7A, while the rest could not be assigned to a particular chromosome (Table S4), hence there is limited discussion with published studies. Using the latest available Chinese Spring Reference Genome (IWGSC RefSeq v1.0), we compared the physical position of previously reported SNPs (Oyiga et al., 2018) to the seven mapped SNPs in the present study. It appears that all seven SNPs are novel. Four candidate genes with putative functions in the regulation of Na+ concentration were identified in close physical location to these significant SNPs, of which two were significantly different between treatments and wheat lines in the gene expression study (Table S2, Figure S5).
Some of the genes described in this study (NHX1 and NHX2, TaAVP1, putative high-affinity potassium transporter) have been previously reported (Mott and Wang, 2007), while others were identified for the first time (Table S2). Contrary to no differences in Mott and Wang (2007), NHX1 and NHX2 expression levels varied between treatments and wheat lines (Figure S5). Like Adem et al. (2017), we found no correlation between expression levels of NHX genes and grain yield. However, other studies have found that increased expression of NHX genes can enhance growth under saline conditions (Apse et al., 1999; Zhang et al., 2001; Bayat et al., 2011). Non-significant expression levels observed for vacuolar pyrophosphatase gene were in contrast to findings of Mott and Wang (2007), who reported higher expression in high-Na+ germplasm line W4909 than low-Na+ Chinese Spring bread wheat under control and salinity, but much greater expression levels under control. In transgenic barley, AVP expression was correlated with shoot biomass and grain yield (Schilling et al., 2014), while in our study there was no evidence for this. Putative high-affinity transporter, a candidate gene for osmoregulation (Mott and Wang, 2007), had higher expression under salinity in MW#293 only (Figure S5), and this was in contrast to higher expression levels in low Na+ Chinese Spring bread wheat than in high Na+ germplasm W4909 in Mott and Wang (2007). In addition, candidate genes were identified that showed similarity to an Na+/H+ antiporter NhaB, aquaporin TIF1-4, and aquaporin PIP2. In Escherichia coli, NhaB was one of the Na+/H+ antiporters identified and characterized as a sodium pump (Pinner et al., 1992). Although this gene is uncharacterised in plants, its similarity to a well-characterised Na+-H+ exchanger family gene, NHX7 (SOS1) (Chanroj et al., 2012), indicates that it could be involved in limiting root uptake of Na+ and/or expelling Na+ from the leaf tissue. It is possible that in high Na+ lines alien introgression has contributed an alternative allele or null at this locus, or altered the expression of this gene resulting in higher leaf Na+. As a consequence, this could contribute to tissue tolerance/osmotic adjustment in the plant and improve salt tolerance. As Na+/H+ antiporter NhaB is approximately 8.4 Mb away from the location of Kna1 (candidate gene TaHKT1;5-D and homologous to Nax2 gene) (TraesCS4D01G361300; 507,965,585-507,967,671), it could represent a novel candidate for Na+ exclusion in wheat. However, its expression levels did not correlate with grain yield in the present study.
Aquaporins, membrane channel proteins, are largely known for their roles in water uptake, and are also involved in the transport of small neutral solutes, gasses, and metal ion (Afzal et al., 2016). Aquaporins in higher plants are classified into five subfamilies; plasma membrane intrinsic proteins (PIPs), tonoplast intrinsic proteins (TIPs), nodulin-26 like intrinsic proteins (NIPs), small basic intrinsic proteins (SIPs), and X intrinsic proteins/uncharacterized-intrinsic proteins (XIPs) (references in Kapilan et al., 2018). Overexpression of the TIP genes were reported to increase salt and drought tolerance in Panax ginseng and Jatropha curcas (Peng et al., 2007; Khan et al., 2015). Similarly, PIPs were shown to be involved in salt and osmotic stress response in barley (Alavilli et al., 2016) and durum wheat (Ayadi et al., 2019). In the present study, although aquaporin TIF1-4 gene expression was higher in salinity tolerant high-Na line MW#293 under salinity, expression levels did not always correlate with leaf Na+ or grain yield.
The differences in gene expression between the present study and previous studies could be attributable to differences in the germplasm used and experimental variables. Analysis of the candidate genes identified across a tissue and time series would provide further information regarding spatial and temporal regulation that would assist with correlation to proposed function in salinity tolerance.
Potential of Tissue Tolerance/Osmotic Adjustment for Further Improvement of Salinity Tolerance in Bread Wheat
Tissue tolerance (the ability of an organ to maintain function in the presence of elevated tissue Na+ and Cl- concentrations) and osmotic adjustment (maintaining turgor by accumulating inorganic ions (mainly Na+, K+, Ca2+, and Cl-), organic acids, carbohydrates, and amino acids), are regarded as two of the three main mechanisms of salinity tolerance in plants (Munns and Tester, 2008). These two mechanisms are considered inseparable from one another (Munns et al., 2016), and less is known about their physiological and genetic aspects as compared to the Na+ exclusion mechanism. It has been reported that more tolerant species accumulate Na+ and Cl- in their roots and shoots similar to the external solution, thereby providing energy-efficient osmotic adjustment (Munns et al, 2016). As Na+ concentration is generally much lower in bread wheat than durum wheat, it is less efficient in adjusting its osmotic potential via inorganic ions (Na+, K+, and Cl-), and relies heavily on organic solutes instead (Cuin et al., 2009), which is energetically costly (Raven, 1985). There is now an opportunity to build the energy-efficient osmotic adjustment mechanism into modern bread wheat. In the present study, GWAS identified alleles of candidate genes from MW#451 and MW#293 associated with high leaf Na+ (Tables S4 and S5). This, together with gene expression data here (Figure S5) and elsewhere (Mott and Wang, 2007) indicate that these genes could be involved in tissue tolerance of wheat germplasm MW#293. Higher relative growth rates in MW#293 under salinity also points to better osmotic adjustment in this line. Taken together, tissue tolerance and osmotic adjustment are likely to contribute to higher salinity of MW#293.
A Novel Wheat Germplasm (MW#293) for Development of Future Salinity/Sodicity Tolerant Bread Wheat
MW#293 was derived from an earlier bread wheat germplasm line (W4909) developed by Richard Wang and his colleagues (Wang et al., 2003). W4909 is a product of three species [Triticum aestivum cv. Chinese Spring, Aegilops speltoides, and Thinopyrum junceum (sea wheatgrass)], and its ability to accumulate very high Na+ sodium has been demonstrated in independent studies (Wang et al., 2003; Genc et al., 2007; Mott and Wang, 2007). However, its salt tolerance is debatable as studies so far have produced variable results (Wang et al., 2003; Genc et al., 2007; Mott and Wang, 2007). In addition, the potential of high Na+ as a source of osmotic adjustment/tissue tolerance in a widely adapted and high yielding bread wheat has not been realized.
To introduce salt tolerance gene(s) of W4909 into a commercial bread wheat, we made a cross between a popular Australian bread wheat cv. Mace and W4909, and developed a doubled-haploid population (over 200 lines). As the population segregated for maturity and height markedly, a sub-selection of this population (n = 18), agronomically similar to commercial lines, was grown under control and salinity using the soil assay described in Genc et al. (2016). Of these 18 lines, MW#293 had the highest grain yield under both control and salinity, and doubled the grain yield of Mace under salinity despite having an 86-fold higher leaf Na+. When tested with 18 commercial wheats in Experiment 3 (which included Kharchia 65-one of the most sodicity- and salinity-tolerant landraces; Chhipa and Lal, 1985), MW#293 produced the highest grain yield under control, salinity and sodicity, and its grain yield under salinity was three times higher despite 35-100-fold higher leaf Na+ concentrations (under sodicity and salinity) than cv. Mace (Table 2). Mujeeb-Kazi and colleagues (2019, p. 52) make the important point that breeding wheat solely for salinity tolerance at the cost of yield loss in nonsaline soils is unsuitable for farmers: “Breeders need to develop cultivars with high yield potential under both stress and nonstress conditions”, in other words vigorous cultivars. In Experiment 4, MW#293 recorded 200-fold higher leaf Na+ concentration and 2-fold higher grain yield than cv. Mace (Figures 6 and 7). MW#293 also had the highest growth rates under salinity and sodicity (Table S9). These data suggest that MW#293 may have the ability to efficiently assimilate and sequester Na+ levels that can support high growth rates (Glenn et al., 1997). To our knowledge, such high Na+ accumulation together with high grain yield/growth rate in bread wheat has not been previously reported. This represents a new paradigm in breeding for salinity tolerance.
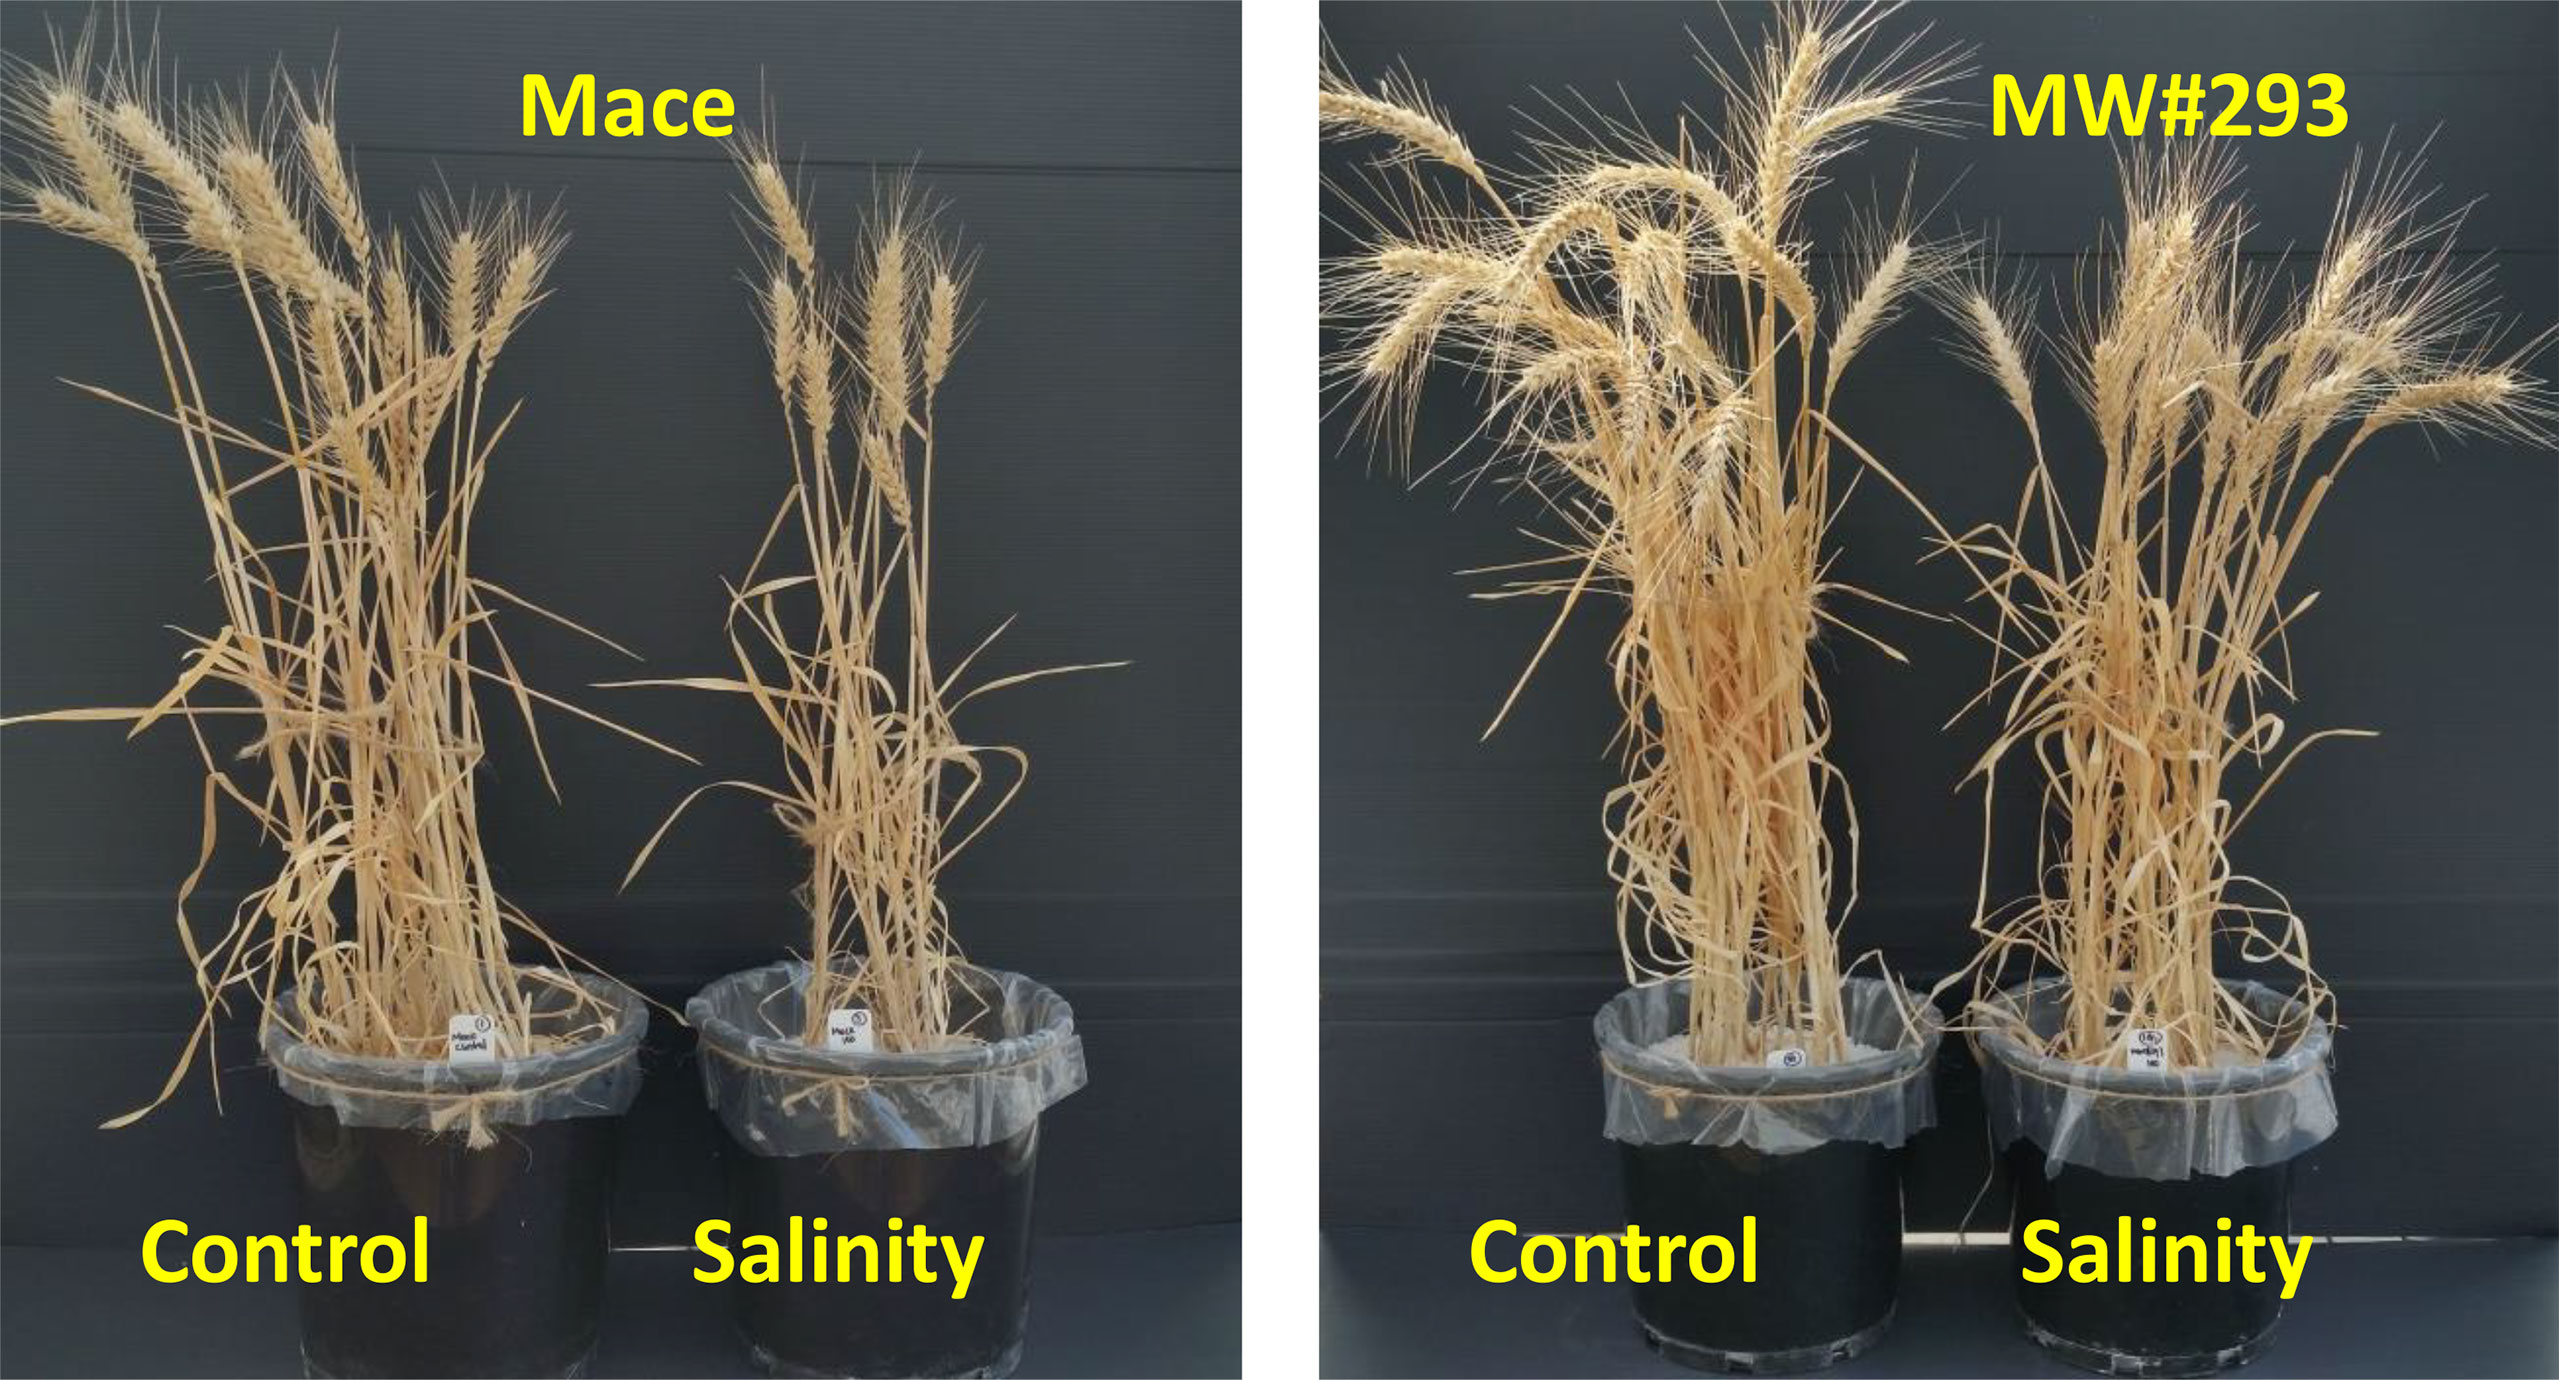
Figure 7 Representative pots of bread wheat (Triticum aestivum) cv. Mace and doubled-haploid line MW#293 grown under control and salinity (100 mM NaCl) in Experiment 4.
Conclusions
● Despite much higher leaf Na+ concentration, bread wheat germplasm MW#293 had higher grain yield under salinity and sodicity, in absolute and relative terms, than the other bread wheat entries tested.
● Despite a 10–14 fold variation in leaf Na+ concentration in modern bread wheats, there were no correlations between leaf Na+ concentration and either salinity or sodicity tolerance, thus demonstrating the limits of using leaf Na+ concentration alone as a selection parameter for salinity/sodicity tolerance.
● As modern bread wheats have an excellent Na+ exclusion ability, further investment in the Na+ exclusion mechanism is unlikely to improve sodicity/salinity tolerance significantly. Future efforts should focus on osmotic adjustment/tissue tolerance mechanisms.
● Genome-wide association mapping revealed novel genes associated with high Na+ accumulation, which may be involved in osmotic adjustment/tissue tolerance.
The salinity and sodicity tolerant germplasm MW#293 provides an opportunity for the development of future salinity/sodicity tolerant bread wheat.
Data Availability Statement
All datasets for this study are included in the manuscript/Supplementary Files.
Author Contributions
YG, MA, KO, and TS were involved in experimental design and the conceptualization of the project. YG and GL carried out phenotyping and drafted the manuscript. JT performed statistical analysis of the data and drafted the manuscript. YL performed GWAS and drafted the manuscript. JC performed gene expression and drafted the manuscript. All authors read and approved the final manuscript.
Funding
This work was supported by South Australian Research and Development Institute, The Waite Research Institute, The Yitpi Foundation, The Grains Research and Development Corporation, and The University of Adelaide.
Conflict of Interest
The authors declare that the research was conducted in the absence of any commercial or financial relationships that could be construed as a potential conflict of interest.
Acknowledgments
We dedicate this article to the late Professor Tony Rathjen (1940–2014) of The University of Adelaide, a revered plant breeder and lecturer whose legacy includes more than 25 wheat varieties and hundreds of influential agricultural scientists. Amongst many achievements, Tony made a significant contribution to research and breeding in the fields of salinity and sodicity. We thank Rana Munns and Richard James for providing the seeds of Tamaroi, Tamaroi-Nax2, Westonia, Westonia-Nax1, and Westonia-Nax2 (CSIRO Plant Industry); Brett Lobsey, Bethany Hallam, and Sally Norton for providing most of the seeds (Australian Grains Genebank); Mark Butt for providing the seed of WID902 and Nady Harris for DNA extraction (South Australian Research and Development Institute); Yuan Li for qPCR analysis (University of Adelaide); Matt Hayden and Kerrie Forrest for 90K SNP genotyping and their advice (Agriculture Victoria Research); John Gouzos for ICP-OES analysis (CSIRO Plant Industry) and Andrew VanderSluys for providing Na+- humate (Fertile Earth Agronomy); Julie Hayes (University of Adelaide) and Tim Colmer (University of Western Australia) for valuable comments on the manuscript; Frans Maathuis (University of York) and Toshio Yamaguchi (Niigata University of Pharmacy and Applied Life Sciences) for their advice. This work was supported by South Australian Research and Development Institute, The Waite Research Institute, The Yitpi Foundation, The Grains Research and Development Corporation, and The University of Adelaide.
Supplementary Material
The Supplementary Material for this article can be found online at: https://www.frontiersin.org/articles/10.3389/fpls.2019.01280/full#supplementary-material.
References
Acosta-Motos, J. R., Ortuna, M. F., Bernal-Vicente, A., Diaz-Vivancos, P., Sanches-Blanco, M. J., Hernandez, J. A. (2017). Plant responses to salt stress: adaptive mechanisms. Agronomy 7, 18. doi: 10.3390/agronomy7010018
Adem, G. A., Roy, S. R., Huang, Y., Chen, Z.-H., Wang, F., Zhou, M., et al. (2017). Expressing Arabidopsis thaliana V-ATPase subunit C in barley (Hordeum vulgare L.) improves plant performance under saline condition by enabling better osmotic adjustment. Funct. Plant Biol. 44, 1147–1159. doi: 10.1071/FP17133
Afzal, Z., Howton, T. C., Sun, Y., Mukhtar, M. S. (2016). The roles of aquaporins in plant stress responses. J. Dev. Biol. 4, 9. doi: 10.3390/jdb4010009
Alavilli, H., Awasthi, J. P., Rout, G. R., Sahoo, L., Lee, B.-H., Panda, S. K. (2016). Overexpression of a Barley Aquaporin Gene, HvPIP2;5 Confers Salt and Osmotic Stress Tolerance in Yeast and Plants. Front. Plant Sci. 7, 1566. doi: 10.3389/fpls.2016.01566
Alexander, D. H., Lange, K. (2011). Enhancements to the ADMIXTURE algorithm for individual ancestry estimation. BMC Bioinformatics 12, 246. doi: 10.1186/1471-2105-12-246
Alberico, G. J., Cramer, G. R. (1993). Is the salt tolerance of maize related to sodium exclusion? I. Preliminary screening of seven cultivars. J. Plant Nutr. 16, 2289–2303. doi: 10.1080/01904169309364687
Almeida, D. M., Oliveira, M. M., Saibo, N. J. M. (2017). Regulation of Na+ and K+ homeostasis in plants: toward improved salt stress tolerance in crop plants. Genet. Mol. Biol. 40, 326–345. doi: 10.1590/1678-4685-gmb-2016-0106
Apse, M. P., Aharon, G. S., Snedden, W. A., Blumwald, E. (1999). Salt tolerance conferred by overexpression of a vacuolar Na+/H+ antiport in. Arabidopsis. Sci. 285, 1256–1258. doi: 10.1126/science.285.5431.1256
Ayadi, M., Brini, F., Masmoudi, K. (2019). Overexpression of a wheat aquaporin gene, TdPIP2;1, enhances salt and drought tolerance in transgenic durum wheat cv. Maali. Int. J. Mol. Sci. 20, 2389. doi: 10.3390/ijms20102389
Bayat, F., Shiran, B., Belyaev, D. V. (2011). Overexpression of HvNHx2, a vacuolar Na+/H+ antiporter from barley, improves salt tolerance in Arabidopsis thaliana. Aust. J. Crop Sci. 5, 428–432.
Bennett, T. H., Flowers, T. J., Bromham, L. (2013). Repeated evolution of salt-tolerance in grasses. Biol. Lett. 9, 20130029. doi: 10.1098/rsbl.2013.0029
Bradbury, P. J., Zhang, Z., Kroon, D. E., Casstevens, T. M., Ramdoss, Y., Buckler, E. S. (2007). TASSEL: software for association mapping of complex traits in diverse samples. Bioinformatics 23, 2633–2635. doi: 10.1093/bioinformatics/btm308
Brini, F., Hanin, M., Mezghani, I., Berkowitz, G. A., Masmoudi, K. (2007). Overexpression of wheat Na+/H+ antiporter TNHX1 and H+-pyrophosphatase TVP1 improve salt- and drought-stress tolerance in Arabidopsis thaliana plants. J. Exp. Bot. 58, 301–308. doi: 10.1093/jxb/erl251
Butler, D. G., Cullis, B. R., Gilmour, A. R., Gogel, B. J. (2009). ASReml-R Reference Manual (Version 3). Queensland Department of Primary Industries. (Queensland, Australia)
Byrt, C. S., Platten, J. D., Spielmeyer, W., James, R. A., Lagudah, E. S., Dennis, E. S., et al. (2007). HKT1;5-like cation transporters linked to Na+ exclusion loci in wheat, Nax2 and Kna1. Plant Physiol. 143, 1918–1928. doi: 10.1104/pp.106.093476
Chanroj, S., Wang, G., Venema, K., Zhang, M. W., Delwiche, C. F., Sze, H. (2012). Conserved and diversified gene families of monovalent cation/H+ antiporters from algae to flowering plants. Front. Plant Sci. 3, 25. doi: 10.3389/fpls.2012.00025
Chhipa, B. R., Lal, P. (1985). Effect of soil salinity on yield, yield attributes and nutrient uptake by different varieties of wheat. Anal. Edaf. Agrobiol. 56, 1681–1691.
Colmer, T. D., Flowers, T. J., Munns, R. (2006). Use of wild relatives to improve salt tolerance in wheat. J. Exp. Bot. 57, 1059–1078. doi: 10.1093/jxb/erj124
Colmer, T. D., Munns, R., Flowers, T. J. (2005). Improving salt tolerance of wheat and barley: future prospects. Aust. J. Exp. Agric. 45, 1425–1443. doi: 10.1071/EA04162
Cramer, G. R., Alberico, G. J., Schmidt, C. (1994). Salt tolerance is not associated with sodium accumulation of two maize hybrids. Aust. J. Plant Physiol. 21, 675–692. doi: 10.1071/PP9940675
Cuin, T. A., Tian, Y., Betts, S. A., Chalmandrier, R., Shabala, S. (2009). Ionic relations and osmotic adjustment in durum and bread wheat under saline conditions. Funct. Plant Biol. 36, 1110–1119. doi: 10.1071/FP09051
Deinlein, U., Stephan, A. B., Horie, T., Luo, W., Xu, G., Schroeder, J. I. (2014). Plant salt-tolerance mechanisms. Trends Plant Sci. 19, 371–379. doi: 10.1016/j.tplants.2014.02.001
Fan, Y., Zhou, G., Shabala, S., Chen, Z.-H., Cai, S., Li, C., et al. (2016). Genome-wide association study reveals a new QTL for salinity tolerance in barley (Hordeum vulgare L.). Front. Plant Sci. 7. Article 946. doi: 10.3389/fpls.2016.00946
Flowers, T. J. (2004). Improving crop salt-tolerance. J. Exp. Bot. 55, 307–319. doi: 10.1093/jxb/erh003
Gao, X., Starmer, J., Martin, E. R. (2008). A multiple testing correction method for genetic association studies using correlated single nucleotide polymorphisms. Genet. Epidemiol. 32, 361–369. doi: 10.1002/gepi.20310
Genc, Y., Oldach, K., Taylor, J., Lyons, G. H. (2016). Uncoupling of sodium and chloride to assist breeding for salinity tolerance in crops. New Phytol. 210, 145–156. doi: 10.1111/nph.13757
Genc, Y., Oldach, K., Verbyla, A., Lott, G., Hassan, M., Tester, M., et al. (2010). Sodium exclusion QTL associated with improved seedling growth in bread wheat under salinity stress. Theor Appl. Genet. 121, 877–894. doi: 10.1007/s00122-010-1357-y
Genc, Y., McDonald, G. K., Tester, M. (2007). Re-assessment of tissue Na+ concentration as a criterion for salinity tolerance in bread wheat. Plant Cell Environ. 30, 1486–1498. doi: 10.1111/j.1365-3040.2007.01726.x
Glenn, E. P., Brown, J. J., Khan, M. J. (1997). Mechanisms of salt tolerance in higher plants, in Mechanisms of environmental stress resistance in plants. Eds. Basra, A. S., Basra, J. K. (Amsterdam, Netherlands: Harwood Academic Publishers), 83–110.
Grewal, H. S., Cornish, P., Norrish, S. (2004). Differential response of wheat cultivars to subsoil salinity/sodicity, in Proceedings of the 4th International Crop Science Congress. Brisbane, Australia 26 September–1 October 2004. Eds. T. Fischer, N. Turner, J. Angus, L. McIntyre, M. Robertson, A., Borrell, Lloyd, D. (Gosford, NSW, Australia: The Regional Institute Ltd.).
Gumedze, F. N., Welham, S. J., Gogel, B. J., Thompson, R. (2010). A variance shift model for detection of outliers in the linear mixed model. Comput. Stat. Data Anal. 54, 2128–2144. doi: 10.1016/j.csda.2010.03.019
Hussain, B., Lucas, S. J., Ozturk, L., Budak, H. (2017). Mapping QTLs conferring salt tolerance and micronutrient concentrations at seedling stage in wheat. Sci. Rep. 7, 15662. doi: 10.1038/s41598-017-15726-6
Iqbal, N., Umar, S., Nazar, R. (2014). Manipulating osmolytes for breeding salinity-tolerant plants, in Emerging technologies and management of crop stress tolerance, vol. 2. doi: 10.1016/B978-0-12-800875-1.00016-8
Jafari-Shabestari, J., Corke, H., Qualset, C. O. (1995). Field evaluatiuon to salinity stress in Iranian hexaploid wheat landrace accessions. Genet. Resour. Crop Evol. 42, 147–156. doi: 10.1007/BF02539518
Jamil, A., Riaz, S., Ashraf, M., Foolad, M. R. (2011). Gene expression profiling of plants under salt stress. Crit. Rev. Plant Sci. 30, 435–458. doi: 10.1080/07352689.2011.605739
James, R. A., Blake, C., Byrt, C. S., Munns, R. (2011). Major genes for Na+ exclusion, Nax1 and Nax2 (wheat HKT1;4 and HKT1;5) decrease Na+ accumulation in bread wheat leaves under saline and waterlogged conditions. J. Exp. Bot. 62, 2939–2947. doi: 10.1093/jxb/err003
James, R. A., Blake, C., Zwart, A. B., Hare, R. A., Rathjen, A. J., Munns, R. (2012). Impact of ancestral wheat sodium exclsuion genes Nax1 and Nax2 on grain yield of durum wheat on saline soils. Funct. Plant Biol. 39, 609–618. doi: 10.1071/FP12121
James, R. A., Davenport, R. J., Munns, R. (2006). Physiological characterisation of two genes for Na+ exclusion in durum wheat: Nax1 and Nax2. Plant Physiol. 142, 1537–1547. doi: 10.1104/pp.106.086538
Kapilan, R., Vaziri, M., Zwiazek, J. J. (2018). Regulation of aquaporins in plants under stress. Biol. Res. 51, 4. doi: 10.1186/s40659-018-0152-0
Khan, K., Agarwal, P., Shanware, A., Sane, V. A. (2015). Heterologous expression of two jatropha aquaporins imparts drought and salt tolerance and improves seed viability in transgenic Arabidopsis thaliana. PLoS ONE 10, e10128866. doi: 10.1371/journal.pone.0128866
Kumar, K., Mosa, K. A., (2015). Ion transporters. A decisive component of salt stress tolerance in plants, in Managing salt tolerance in plants. Eds. Wani, S. H., Hossain, M. A. (Boca Raton: CRC Press), 373–389. doi: 10.1201/b19246-21
Kumar, V., Singh, A., Mithra, S. V. A., Krishnamurthy, S. L., Parida, S. K., Jain, S., et al. (2015). Genome-wide association mapping of salinity tolerance in rice (Oryza sativa). DNA Research 22, 113-145. doi: 10.1093/dnares/dsu046.
Long, N. V., Dolstra, O., Malosetti, M., Kilian, B., Graner, A., Visser, R. G. F., et al. (2013). Association mapping of salt tolerance in barley (Hordeum vulgare L.). Theor Appl. Genet. 126, 2335–2351. doi: 10.1007/s00122-013-2139-0
Martinez-Beltran, J., Manzur, C. L. (2005). Overview of salinity problems in the world and FAO strategies to address the problem, in Proceedings of the international salinity forum (Riverside), 311–313.
Masoudi, B., Mardi, M., Hervan, E. M., Bihamta, M. R., Naghavi, M. R., Nakhoda, B., et al. (2015). QTL mapping of salt tolerance traits with different effects at the seedling stage of bread wheat. Plant Mol. Biol. Rep. 33, 1790–1803. doi: 10.1007/s11105-015-0874-x
McDonald, G. K., Taylor, J. K., Verbyla, A., Kuchel, H. (2012). Assessing the importance of subsoil constraints to yield of wheat and its implications for yield improvement. Crop Pasture Sci. 63, 1043–1065. doi: 10.1071/CP12244
Mott, I. W., Wang, R. R.-C. (2007). Comparative transcriptome analysis of salt-tolerant wheat germplasm lines using wheat genome arrays. Plant Sci. 173, 327–339. doi: 10.1016/j.plantsci.2007.06.005
Mujeeb-Kazi, A., Munns, R., Rasheed, A., Ogbonnaya, F. C., Ali, N., Hollington, P., et al. (2019). Breeding strategies for structuring salinity tolerance in wheat. Adv. Agron. 155, 121–187 doi: 10.1016/bs.agron.2019.01.005
Munns, R., James, R. A., Xu, B., Athman, A., Conn, S. J., Jordans, C., et al. (2012). Wheat grain yield on saline soils is improved by an ancestral Na+ transporter gene. Nat. Biotechnol. 30, 360–364. doi: 10.1038/nbt.2120
Munns, R., James, R. A., Gilliham, M., Flowers, T. J., Colmer, T. D. (2016). Tissue tolerance: an essential but elusive trait for salt tolerant crops. Funct. Plant Biol. 43, 1103–1113. doi: 10.1071/FP16187
Munns, R., Tester, M. (2008). Mechanisms of salinity tolerance. Ann. Rev. Plant Biol. 59, 651–681. doi: 10.1146/annurev.arplant.59.032607.092911
Neumann, K., Kobiljiski, B., Dencic, S., Varshney, R. K., Borner, A. (2011). Genome-wide associating mapping: a case study in bread wheat (Triticum aestivum L.). Mol. Breed. 27, 37–58. doi: 10.1007/s11032-010-9411-7
Noble, C. L., Rogers, M. E. (1992). Arguments for the use of physiological criteria for improving the salt tolerance in crops. Plant Soil 146, 99–107. doi: 10.1007/BF00012001
Oyiga, B. C., Sharma, R. C., Baum, M., Ogbonnaya, F. C., Léon, J., Ballvora, A. (2018). Allelic variations and differential expressions detected at quantitative trait loci for salt stress tolerance in wheat. Plant Cell Environ. 41, 919–935. doi: 10.1111/pce.12898
Patishtan, J., Hartley, T. N., Fonseca de Carvalho, R., Maathuis, F. J. M. (2017). Genome-wide association studies to identify rice salt-tolerance markers. Plant Cell Environ. 41, 970–982 doi: 10.1111/pce.12975
Paull, J. G., Liu, C.-Y., Rathjen, A. J. (1994). Genetic variation in accumulation of sodium by wheat grown under sodic conditions. Proceedings of the 7th assembly wheat breeding society of Australia. Adelaide, 25-30 September 1994. 229–232
Pearson, G. A., Bernstein, L. (1958). Influence of exchangeable sodium on yield and chemical composition of plants: II. Wheat, barley, oats, rice, tall fescue, and tall wheatgrass. Soil Sci. 86, 254–261. doi: 10.1097/00010694-195811000-00005
Peng, Y., Lin, W., Cai, W., Arora, R. (2007). Overexpression of a Panax ginseng tonoplast aquaporin alters salt tolerance, drought tolerance and cold acclimation ability in transgenic Arabidopsis plants. Planta 226, 729–740. doi: 10.1007/s00425-007-0520-4
Pinner, E., Padan, E., Schuldiner, S. (1992). Cloning, sequencing, and expression of the nhaB gene, encoding a Na+/H+ antiporter in Escherichia coli. J. Biol Chem. 267, 11064–11068.
R Core Team. (2018). R: a language and environment for statistical computing. (Vienna, Austria: R Foundation for Statistical Computing.) URL https://www.R-project.org/.
Rajpar, I., Sial, N. B., Talpur, U. (2004). Effect of soil sodicity on the growth, ion content and yield of wheat (Triticum aestivum L.). J. Appl. Sci. 4, 649–653. doi: 10.3923/jas.2004.649.653
Raven, J. A. (1985). Regulation of pH and generation of osmolarity in vascular plants-a cost-benefit analysis in relation to efficiency of use energy, nitrogen and water. New Phytol. 101, 25–77. doi: 10.1111/j.1469-8137.1985.tb02816.x
Rawson, H. M., Long, M. Y., Munns, R. (1988). Growth and development in NaC1-treated plants I. Leaf Na+ and C1- concentrations do not determine gas exchange of leaf blades in barley. Aust. J. Plant Physiol. 15, 519–527. doi: 10.1071/PP9880519
Rengasamy, P. (2002). Transient salinity and subsoil constraints to dryland farming in Australian sodic soils: an overview. Aust. J. Exp. Agric. 42, 351–361. doi: 10.1071/EA01111
Rengasamy, P. (2006). World salinization with emphasis on Australia. J. Exp. Bot. 57, 1017–1023. doi: 10.1093/jxb/erj108
Rengasamy, P., Olsson, K. A. (1991). Sodicity and soil structure. Aust. J. Soil Res. 29, 935–952. doi: 10.1071/SR9910935
Reuter, D. J., Robinson, A. D. (1997). Plant analysis. An interpretation manual. 2nd edn. (Australia: CSIRO) doi: 10.1071/9780643101265
Richards, R. A., Dennett, C. W., Qualset, C. O., Epstein, E., Norlyn, J. D., Winslow, M. D. (1987). Variation in yield of grain and biomass in wheat, barley and triticale in a salt-affected field. Field Crops Res. 15, 277–287. doi: 10.1016/0378-4290(87)90017-7
Saqib, M., Akhtar, J., Qureshi, R. H. (2007). Sodicity intensifies the effect of salinity on grain yield and yield components of wheat. J. Plant Nutr. 31, 689–701. doi: 10.1080/01904160801926640
Setter, T. L., Waters, I., Stefanova, K., Munns, R., Barrett-Lennard, E. G. (2016). Salt tolerance, date of flowering and rain affect the productivity of wheat and barley on rainfed saline land. Field Crops Res. 194, 31–42. doi: 10.1016/j.fcr.2016.04.034
Schilling, R. K., Marschner, P., Shavrukov, Y., Berger, B., Tester, M., Roy, S. J., et al. (2014). Expression of the Arabidopsis vacuolar H+-pyrophosphatase gene (AVP1) improves the shoot biomass of transgenic barley and increases grain yield in a saline field. Plant Biotechnol. J. 12, 378–386. doi: 10.1111/pbi.12145
Shahbaz, M., Ashraf, M. (2013). Improving salinity tolerance in cereals. Crit. Rev. Plant Sci. 32, 237–249. doi: 10.1080/07352689.2013.758544
Sharma, S. K. (1986). Mechanisms of tolerance in rice varieties differing in sodicity tolerance. Plant Soil 93, 141–145. doi: 10.1007/BF02377155
Sharma, S. K. (1991). Effect of exchangeable sodium on growth, yield and ionic relations in wheat genotypes differing in sodicity tolerance. Indian J. Plant Physiol. 34, 349–356.
Shavrukov, Y., Bowne, J., Langridge, P., Tester, M. (2006). Screening for sodium exclusion in wheat and barley. Proceedings of 13th agronomy conference, 10-14 September 2006, Perth, Western Australia
Shavrukov, Y., Shamaya, N., Baho, M., Edwards, J., Ramsey, C., Nevo, E., et al. (2011). Salinity tolerance and Na+ exclusion in wheat: variability, genetics, mapping populations and QTL analysis. Czech J. Genet. Plant Breed. 47, S85–S93. doi: 10.17221/3260-CJGPB
Shavrukov, Y., Langridge, P., Tester, M. (2009). Salinity tolerance and sodium exclusion in genus Triticum. Breed. Sci. 59, 671–678. doi: 10.1270/jsbbs.59.671
Shi, Y., Gao, L., Wu, Z., Zhang, X., Wang, M., Zhang, C., et al. (2017). Genome-wide association study of salt tolerance at the seed germination stage in rice. BMC Plant Biol. 17, 92. doi: 10.1186/s12870-017-1044-0
Shrivastava, S., Kumar, R. (2015). Soil salinity: A serious environmental issue and plant growth promoting bacteria as one of the tools for its alleviation. Saudi J. Biol. Sci. 22, 123–131. doi: 10.1016/j.sjbs.2014.12.001
Singh, R. K., Mishra, B., Chauhan, M. S., Yeo, A. R., Flowers, S. A., Flowers, T. J. (2002). Solution culture for screening rice varieties for sodicity tolerance. J. Agric. Sci. 139, 327–333. doi: 10.1017/S0021859602002447
Singh, Y. P., Mishra, V. K., Singh, S., Sharma, D. K., Singh, D., Singh, U. S., et al. (2016). Productivity of sodic soils can be enhanced through the use of salt-tolerant rice varieties and proper agronomic practices. Field Crops Res. 190, 82–90. doi: 10.1016/j.fcr.2016.02.007
Tounsi, S., Amar, S. B., Masmoudi, H., Sentenac, H., Brini, F., Very, A.-A. (2016). Characterization of two HKT1;4 transporters from Triticum monococcum to elucidate the determinants of the wheat salt tolerance Nax1 QTL. Plant Cell Physiol. 57, 2047–2057. doi: 10.1093/pcp/pcw123
Turki, N., Shehzad, T., Harrabi, M., Okuno, K. (2015). Detection of QTLs associated with salinity tolerance in durum wheat based on association analysis. Euphytica 20, 29–41. doi: 10.1007/s10681-014-1164-7
Ul Haq, T., Akhtar, J., Steele, K. A., Munns, R., Gorham, J. (2014). Reliability of ion accumulation and growth components for selecting salt tolerant lines in large populations of rice. Funct. Plant Biol. 41, 379–390. doi: 10.1071/FP13158
Verbyla, A. P., Cullis, B. R., Kenward, M. G., Welham, S. J. (1999). The analysis of designed experiments and longitudinal data by using smoothing splines. J. R. Stat. Soc. Ser. C Appl. Stat. 48, 269–311. doi: 10.1111/1467-9876.00154
Volkov, V., Beilby, M. J. (2017). Editoral: Salinity tolerance in plants: mechanisms and regulation of ion transport. Front. Plant Sci. 8. article 1795. doi: 10.3389/fpls.2017.01795
Wang, R. R.-C., Larson, S. R., Horton, W. H., Chatterton, N. J. (2003). Registration of W4909 and W4910 bread wheat germplasm lines with high salinity tolerance. Crop Sci. 43, 745–746. doi: 10.2135/cropsci2003.0746
Wang, R. R.-C., Li, X.-M., Hu, Z.-M., Zhang, J.-Y., Larson, S. R., Zhang, X.-Y., et al. (2007). Development of salinity-tolerant wheat recombinant lines from a wheat disomic line carrying a Thinopyrum junceum chromosome. Int. J. Plant Sci. 164, 25–33. doi: 10.1086/344556
Wang, S., Wong, D., Forrest, K., Allen, A., Chao, S., Huang, B. E., et al. (2014). Characterization of polyploid wheat genomic diversity using a high-density 90000 single nucleotide polymorphism array. Plant Biotechnol. J. 12, 787–796. doi: 10.1111/pbi.12183
Williams, K., Taylor, S., Bogacki, P., Pallotta, M., Bariana, H., Wallwork., H. (2002). Mapping of the root lesion nematode (Pratylenchus neglectus) reistance gene Rlnn1 in wheat. Theor Appl. Genet. 104, 874–879. doi: 10.1007/s00122-001-0839-3
Zhang, H. X., Hodson, J. N., Williams, J. P., Blumwald, E. (2001). Engineering salt-tolerant Brassica plants: Characterization of yield and seed oil quality in transgenic plants with increased vacuolar sodium accumulation. Proc. Nat. Acad. Sci. U. S. A. 98, 12832–12836. doi: 10.1073/pnas.231476498
Zhang, Z., Ersoz, E., Lai, C. Q., Todhunter, R. J., Tiwari, H. K., Gore, M. A., et al. (2010). Mixed linear model approach adapted for genome-wide association studies. Nat. Genet. 42, 355–360. doi: 10.1038/ng.546
Keywords: chloride, ionic, osmotic, salinity, sodicity, sodium, sodium humate, tolerance
Citation: Genc Y, Taylor J, Lyons G, Li Y, Cheong J, Appelbee M, Oldach K and Sutton T (2019) Bread Wheat With High Salinity and Sodicity Tolerance. Front. Plant Sci. 10:1280. doi: 10.3389/fpls.2019.01280
Received: 14 June 2019; Accepted: 13 September 2019;
Published: 22 October 2019.
Edited by:
Dean E. Riechers, University of Illinois at Urbana-Champaign, United StatesReviewed by:
Hikmet Budak, Montana State University, United StatesAwais Rasheed, Quaid-i-Azam University, Pakistan
Yuri Shavrukov, Flinders University, Australia
Copyright © 2019 Genc, Taylor, Lyons, Li, Cheong, Appelbee, Oldach and Sutton. This is an open-access article distributed under the terms of the Creative Commons Attribution License (CC BY). The use, distribution or reproduction in other forums is permitted, provided the original author(s) and the copyright owner(s) are credited and that the original publication in this journal is cited, in accordance with accepted academic practice. No use, distribution or reproduction is permitted which does not comply with these terms.
*Correspondence: Yusuf Genc, yusuf.genc@adelaide.edu.au
†Present address: Marie Appelbee, Australian Grain Technologies, Roseworthy, SA, Australia
Klaus Oldach, Breeding Technologies Cereals, KWS, Lochow GMBH, Einbeck, Germany