- 1College of Agronomy, Xinjiang Agricultural University, Ürümqi, China
- 2Department of Crop and Soil Sciences, Washington State University, Pullman, WA, United States, Affiliated with the Western Wheat Quality Laboratory
- 3National Wheat Improvement Center, Institute of Crop Science, Chinese Academy of Agricultural Sciences (CAAS), Beijing, China
- 4USDA-ARS Western Wheat Quality Laboratory, E-202 Food Science and Human Nutrition Facility East, Washington State University, Pullman, WA, United States
Peroxidase (POD) activity in wheat (Triticum aestivum L.) grain influences natural carotenoid pigment content and is associated with the color of flour, and processing and product quality. Here, we report the molecular characterization and physical mapping of POD genes in bread wheat. The complete genomic DNA (gDNA) sequence of two POD genes (TaPod-A2 and TaPod-D1), and the partial gDNA sequence of two additional POD genes (TaPod-A3 and TaPod-B1) from wheat were characterized using in silico cloning and validated through laboratory experiments. Using a set of 21 nullisomic-tetrasomic (NT) lines, six group-7 ditelosomic (Dt) lines, and 38 group-7 deletion (Del) lines of Chinese Spring (CS), TaPod-A2 and TaPod-D1 were found to be physically located on 0.73–0.83 and on the most distal 0.39 fraction arm length (FL) of 7AS and 7DS in cv. CS, respectively; whereas, TaPod-A3 and TaPod-B1 were assigned to the 0.40–0.49 and 0.40–0.48 FL of 7AL and 7BL, respectively. Based on single nucleotide polymorphisms (SNPs) of two alleles at the TaPod-D1 locus, two functional markers POD-7D1 and POD-7D6 were developed, amplifying 540- and 640-bp, fragments in varieties with higher and lower POD activities, respectively. A total of 224 wheat varieties were analyzed and showed a significant association between the polymorphic fragments and POD activity using POD-7D1 and POD-7D6 markers. The analysis of variance (ANOVA) indicated the average POD activities of 115 varieties with TaPod-D1a were significantly lower than 109 varieties with TaPod-D1b (P < 0.01). This study provides useful information of the POD genes in bread wheat, insight into wheat genome synteny and structure, gene-specific markers, and contributes a valuable resource for quality improvement in wheat breeding programs.
Introduction
Peroxidases (PODs) are heme-containing oxidoreductases, ubiquitous in plants and animals, and can oxidize various hydrogen donors at the expense of hydrogen peroxides (H2O2) (Hiraga et al., 2001; Jouili et al., 2011). Traditionally, the plant POD superfamily was classified into three types according to differences in primary structure and catalytic properties and denoted using Roman numerals: I, II, and III. Among higher plants, two POD classes are recognized: class I PODs (ascorbate POD, EC1.11.1.11), which are intracellular, and class III PODs (guaiacol POD, EC1.11.1.7), which are secreted into the vacuole, the cell wall, and the surrounding medium (Fraignier et al., 2000). The class III plant PODs (hydrogen donor: H2O2 oxidoreductase) are classical PODs of higher plants and have an affinity for guaiacol, which is catalyzed by the reduction of hydrogen PODs by taking electrons from hydrogen donor molecules (Hiraga et al., 2001; Delannoy et al., 2006; Csiszár et al., 2008; Shigeto and Tsutsumi, 2016). Previous studies proposed that PODs are not specific in their reactions, and can oxidize various phenols and aromatic amines of plant tissues by H2O2 (Gelinas et al., 1998; Feillet et al., 2000; Zhai et al., 2013). Hence, the plant PODs are involved in various physiological functions such as removal of hydrogen peroxides, senescence, oxidation of toxic reductants, lignin formation, pathogen defense, or insect attack (Yoshida et al., 2003; Maksimov et al., 2010).
Peroxidases are widely distributed in cereals (Zhai et al., 2013; Shigeto and Tsutsumi, 2016). Previous studies identified POD as being responsible for pigment degradation, especially ß-carotene and lutein oxidation (Iori et al., 1995; Fraignier et al., 2000). An abundance of hydrogen peroxide is produced during intermediate steps of substrate peroxidation in the POD pathway (Yoshida et al., 2003; Maksimov et al., 2010). This hydrogen peroxide can oxidize various natural carotenoid pigments such as ß-carotene and lutein in seeds; reduce the color of flour and ultimately deteriorate the quality of wheat-based end products (Kobrehel et al., 1974; Delcros et al., 1998). Conversely, POD can improve the rheological properties of flour doughs and the physical characteristics of gluten by oxidizing sulfhydryl (-SH) groups of cysteine to form intra- and intermolecular disulfide bonds, and can improve rheological properties of dough in bread making technology (Gelinas et al., 1998; Figueroa-Espinoza et al., 1999; Borrelli et al., 2003; Revanappa et al., 2014). POD action exerts significant effects on deteriorative changes in flavor, texture, nutritional value, and mouth feel of food products for human consumption (Burnette, 1977; Takasaki et al., 2005). Furthermore, POD activity can induce the development of undesirable pasta brownness (Taha and Sagi, 1987; Fraignier et al., 2000). A significant positive correlation (r = 0.84–0.97) was observed between the brown index of pasta products and POD activity (Iori et al., 1995; Hemalatha et al., 2007). Similarly, a high positive correlation (r = 0.81) was reported between darkening of chapattis and POD activity (Hemalatha et al., 2007). Furthermore, POD supplementation bleaches dough and increases dough tolerance to over-mixing (Hilhorst et al., 1999; Joye et al., 2009). POD seems to drive the formation of dityrosine bonds during bread making and can improve loaf volume and crumb structure (Joye et al., 2009). Particularly in soft wheat, POD is involved in arabinoxylan and protein cross-linking, which affects batter viscosity and processing quality (Bettge and Morris, 2007; Ramseyer et al., 2011a,b).
Feillet et al. (2000) showed that POD activity was influenced by genotype, environment, and genotype × environment. However, Kobrehel and Gautier (1974) suggested that POD is a genetic character, where different genomes control the synthesis of specific PODs in wheat, and environmental factors had a minor effect on the isozyme patterns. Common wheat showed the highest POD activity among the cereals and was three, six, and seven times higher than oat, rice, and maize, respectively (Maksimov et al., 2010). Žilić et al. (2010) reported that bread wheat showed a higher POD activity than durum wheat. In addition, a wide range of intervarietal variation has been reported between wheat varieties for POD activities (Honold and Stahmann, 1968; Borrelli et al., 2003; Hemalatha et al., 2007; Maksimov et al., 2010). These studies have shown that it is possible to change POD activity of wheat by genetic selection. By analyzing NT lines of cv. CS wheat by polyacrylamide-slab gel electrophoresis, Kobrehel and Feillet (1975) identified six POD isozymes (denoted a, b, c, d, e, and f) in bread wheat endosperm. Using NT lines of CS, POD a, c, and d were located on 7D, 4B, and 7A, respectively, whereas isozymes e and f appeared to be located on at least two different chromosomes. The POD isozymes showed a higher tissue-specificity but a lower substrate-specificity, and the embryo plus scutellum and the endosperm of durum wheat always presented different POD patterns (Fraignier et al., 2000). Bosch et al. (1987) also found that the embryo plus scutellum PODs were associated with 3AL, 3BL, and 3DS; whereas wheat endosperm PODs were associated with 4BL, 7AS, and 7DS. Recently, three major QTLs associated with POD activity (QPod.caas-3AL, QPod.caas-4BS, and QPod.caas-5AS) were detected and associated with a wide range of phenotypic variation (5.3–21.2%) across four environments using a recombinant inbred line (RIL) population (Doumai/Shi 4185) and the wheat 90 K single nucleotide polymorphism (SNP)-chip markers (Wei et al., 2015).
To date, several plant POD genes were cloned in rice (Passardi et al., 2004a,b), maize (Mika et al., 2008), barley (Johansson et al., 1992; Theilade and Rasmussen, 1992), wheat (Wei et al., 2015), and Arabidopsis thaliana (Tognolli et al., 2002). Plant PODs exist in numerous molecular forms. More than 138, 73, and 200 different sequences encoding POD genes have been identified in rice (Passardi et al., 2004a,b), A. thaliana (Tognolli et al., 2002), and maize (Mika et al., 2008), respectively. The barley PODs are coded for by more than four loci: one (seed POD) on chromosome 1, two on chromosome 2, and one on chromosome 5 (Johansson et al., 1992). A barley POD, Prx 5 (mRNA, GenBank accession number M73234), has been isolated from mature barley grains, and was RFLP-mapped on barley chromosome 3. Analyses of RNA and protein (Prx 5) were found only in the endosperm, and not expressed in leaves (Rasmussen et al., 1991). Theilade and Rasmussen (1992) purified a barley genomic DNA (gDNA) sequence (Prx 6.1, M83671) using a complementary DNA (cDNA) coding for POD in the barley seed, and Prx 6.1 was RFLP-mapped on chromosome 3. The other barley POD gene, Prx 6.2 (Z23131, unpublished) was located on chromosome 3.
Ten full-length cDNA encoding POD, TmPRX1 to TmPRX10 (GenBank accession numbers AY857755 to AY857764), were cloned from leaf epidermis of diploid wheat (Liu et al., 2005). These 10 POD genes are diverse and encode proteins of 312–357 amino acids (AAs) with a signal peptide based on bioinformatic analysis (Liu et al., 2005). Two common wheat cDNA sequences (AF525425 and AK331797) were found by a BLAST search using the rice gDNA sequence BN000552 as a probe. Wheat cDNA AF525425 and AK331797 showed 73.8 and 73.3% sequence identities with BN000552, respectively. The cDNA of Wheat POD-1 (WP1, HM138375) was amplified from immature seeds by RT-PCR (Shan et al., 2009). The cDNA of WP1 codes a protein of 358 AA, showing 100 and 89% sequence identity with AF525425 and barley POD 1 (BP1, M73234), respectively. Wei et al. (2015) cloned and characterized a complete genomic wheat POD DNA sequence of TaPod-A1, which is mapped on 3AL. Additionally, based on the SNPs of two alleles (TaPod-A1a and TaPod-A1b), two functional markers (POD-3A1 and POD-3A2) were developed, and were highly related to POD activity (Wei et al., 2015).
There is relatively little knowledge on the POD gDNA sequences in hexaploid wheat (T. aestivum). Further, the physical location of POD genes has not been identified further than the whole chromosome arm. Several wheat POD genes have been cloned and two complementary dominant sequence-tagged site (STS) markers were developed for QTL controlling POD activity. However, common wheat contains a large POD gene family, thus requiring that more POD genes be precisely localized so as to manipulate the POD activities and improve the end-use quality of wheat.
Hence, the objectives of the present study were threefold. The first objective was to clone POD genes by the method of in silico cloning in combination with PCR amplification based on two wheat full length cDNA sequences, AF525425 and AK331797. The second objective was to physically map the POD genes, using CS ditelosomic (Dt), NT, and the Del lines of Endo and Gill (1996). The third objective was to identify allelic variants on chromosome 7D and develop functional markers that can be used to characterize wheat varieties for POD activity based on allelic variants.
Materials and Methods
Plant Materials
The wheat variety Alpowa (PI 566596) was used for sequencing new POD genes. Alpowa is mainly a pastry wheat (soft white spring); however, its flour can be made into all types of soft wheat products, such as crackers and flatbreads.
For mapping EST-specific fragments, new POD genes, and gene-specific markers to individual chromosomes and arms, a set of Chinese Spring (CS) nullisomic-tetrasomic (NT) lines, and six group-7 CS Dt lines were used. Thirty-eight homozygous CS deletion (Del) lines for group-7 were used for sub-arm mapping and included 10 Del lines of chromosome 7AS (CS Del7AS), 16 Del lines of chromosome 7AL (CS Del7AL), nine Del lines of chromosome 7BL (CS Del7BL), and three Del lines of the short arm of chromosome 7D (CS Del7DS). Seed of these genetic stocks was acquired from Jon Raupp (Kansas State University) and were planted in the Plant Growth facility of Washington State University, Pullman, WA, United States. The bread wheat chromosome bin maps can be viewed at the group-7 long-arm and short-arm Dt lines in CS wheat1.
Field Trials and POD Activity Assay
For validation of gene-specific markers of the POD genes, during the 2012–2013 and 2013–2014 cropping seasons, 147 varieties from the Yellow and Huai Winter Wheat Region of China (YHRVWWR) were sown at Suixi in Anhui province and Anyang in Henan province, and 77 varieties of the Northern China Plain Winter Wheat Region (NWWR) were sown in Shijiazhuang and Beijing. All the field trials were conducted in randomized complete blocks with three replicates. Grains from two replicates were used for POD activity assay. Each plot comprised three 2-m rows spaced 20 cm apart. Wheat grain POD activity was assayed following Wei et al. (2015).
Peroxidase activity in wheat grain was tested by measuring increased absorbance at 470 nm using an Absorbance Microplate Reader (Molecular Devices SpectraMax 384 Plus, LLC, United States). Each sample was tested in duplicate. If the coefficient of variation (CV) was >10% for spectrophotometric assay of POD activity in the duplicates, a third test was conducted. For each data point, POD activity in wheat grain was tested in duplicate extracts of whole-wheat flour with parallel spectrophotometric measurements and average values are reported (Wei et al., 2015).
Strategies for Cloning and PCR Parameters
The corresponding gDNA sequence of rice POD gene PRX23 (GenBank accession BN000552) was used for a BLAST search against the wheat expressed sequence tag (EST) database in GenBank and Computational Biology and Functional Genomics (CBFG) Laboratory2. All ESTs in wheat sharing higher similarity with the reference gene (score > 390 bp, E value < 10–50, and identity > 85%) were subjected to overlapping sequence assembly. Six gene-specific primer sets, P1, P2, P3, P4, P5, and P6, were used to clone the whole coding sequence of POD genes. Primers were designed using the software Primer Premier Version 5.03. Each primer set was detected with a set of NT lines to confirm a chromosome specific location. gDNA was extracted from leaf tissue of individual seedlings about 2–3 weeks post emergence using a method modified from Riede and Anderson (1996).
PCR reactions were carried out in a total volume of 20 μL, including 250 μM of each deoxyribonucleotide triphosphate, 100 ng of gDNA, 8 pmol of each primer, 1x reaction buffer (10 mM Tris-Cl, 50 mM KCl, and 1.5 μM MgCl2, pH 8.5), 1 U Taq DNA polymerase (5 Primer Inc., Gaithersburg, MD, United States) (Geng et al., 2012). Temperature conditions for PCR were 94°C for 5 min, followed by 40 cycles of 94°C for 50 s, 62–64°C (Table 1) for 55 s and 72°C for 1 min, and a final 8 min elongation at 72°C. Amplified PCR fragments were visualized on 1–1.5% agarose gels.
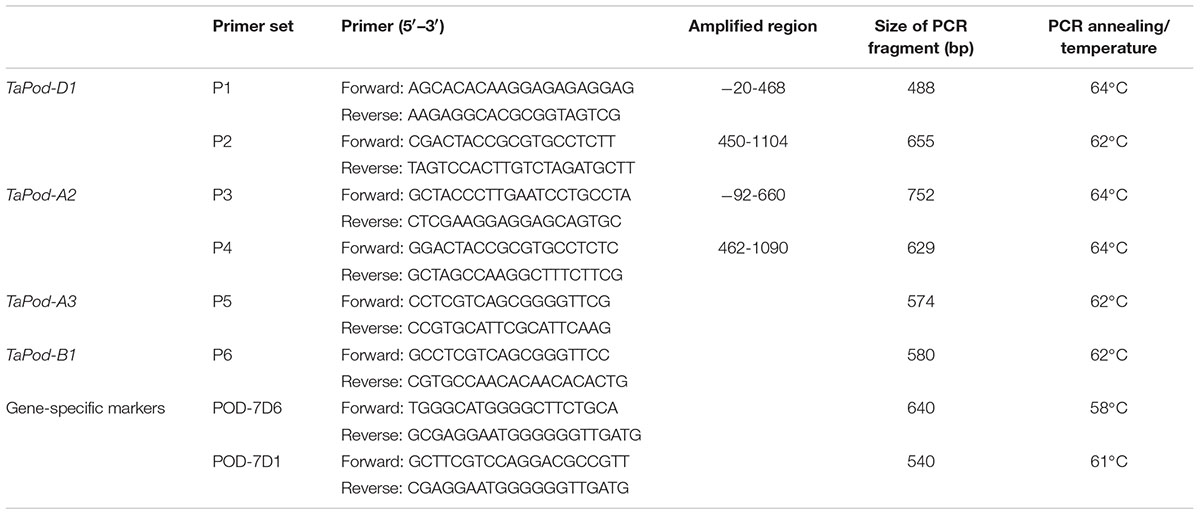
Table 1. The sequences of the primer sets used in the cloning of the POD genes along with their PCR profiles, product sizes.
DNA Sequencing and Analysis
Amplified PCR products were purified by ExoSAP-IT according to the manufacturer’s instructions. Sequencing was conducted with an Applied Biosystems 3100 Genetic Analyzer (PerkinElmer Applied Biosystems Division, Foster City, CA, United States), and sequencing reactions were carried out with the Big Dye Terminator Version 3.1 Cycle Sequencing Kit.
The wheat variety Alpowa was used for cloning the gDNA sequence of POD genes. Four varieties with a broad range of POD activities, Zhong 892, Zhou 8425B, Shi 4185, and Zhoumai 16, were used to identify allelic variants of the TaPod-D1 gene on chromosome 7D (Wei et al., 2015). Each primer set was verified to be chromosome-specific with CS NT lines. The sequence of gDNA and deduced AA for POD genes were compared with the software DNAMAN Version 7.0 (Lynnon Corporation, 20134). The AA sequences of cereal POD genes were subjected to the Conserved Domain Database5 for conserved domain analysis.
Sequence-Tagged Site (STS) Analysis
Using the newly developed gene-specific markers, six wheat varieties with higher and six with lower POD activities were amplified and sequenced. Two primer combinations were designed to detect variants among these varieties using the sequence divergence of the two alleles of the TaPod-D1 gene. The variation in POD activity was assumed to be associated with TaPod-D1, which was then verified on 224 Chinese wheat varieties. The PCR amplification conditions were 1 cycle of 94°C for 5 min, followed by 40 cycles of 94°C for 50 s, 58°C or 61°C (specific annealing temperature of each primer set is shown in Table 1) for 50 s 72°C for 55 s, and a final 8 min elongation at 72°C.
Statistical Analyses
Analysis of variance (ANOVA) was conducted using SAS version 9.2 (SAS Institute, Cary, NC, United States). For the 224 Chinese wheat varieties, the POD activity of each variety was determined in each of four environments and averaged to confirm the association between POD activities and allelic variants. The variation in POD activity among varieties with different PCR fragment profiles was analyzed using Fischer’s least significant difference (LSD).
Results
Characterization of Complete DNA Sequence of TaPod-D1 and TaPod-A2
Four common wheat cDNA sequences (AF525425, HM138375, AB518867, and AK331797) and one Triticum monococcum cDNA sequences (AY857762) were found through a BLAST search against the GenBank wheat EST database using the rice gDNA sequence BN000552 as a probe. AF525425, named WSP1, shared 100, 100, 93, and 54% sequence identify with HM138375, AB518867, AK331797, and AY857762, respectively (data not shown). Two T. monococcum ESTs (TC389044 and TC383617) were detected through a BLAST search against the CBFG Laboratory wheat EST database6. using the T. monococcum sequence of AY857762 as a probe. AY857762 shared 92 and 87% of sequence identity with TC389044 and TC383617, respectively.
Based on the SNPs and InDels among AF525425, AK331797, TC389044, and TC383617, six chromosome-specific primer combinations (designated P1, P2, P3, P4, P5, and P6) were developed (Table 1). Of them, P1 and P2 could be used to amplify the gDNA sequence of TaPod-D1, and were mapped on wheat chromosome 7D as identified using a set of NT lines (Supplementary Figures S1a,b). The upstream sequence of gDNA sequence of TaPod-D1 amplified by P1 demonstrated 100% identity with AF525425, while the downstream sequence of gDNA sequence of TaPod-D1 amplified by P2 demonstrated 100% identity with AF525425 (Table 1 and Figure 1). P1 and P2 produced PCR products of 488 and 655 bp, respectively. There were 19-bp overlaps between the PCR products produced by P1 and P2. The DNA sequence of TaPod-D1 was comprised 1124 bp, with an open reading frame (ORF) of 1077 bp, a 5′ untranslated region (UTR) of 20 bp, and a 3′ UTR of 27 bp. The predicted pre-protein sequence of TaPod-D1 consisted of 358 AAs, with a predicted molecular weight of ∼38.8 kDa (Figure 2).
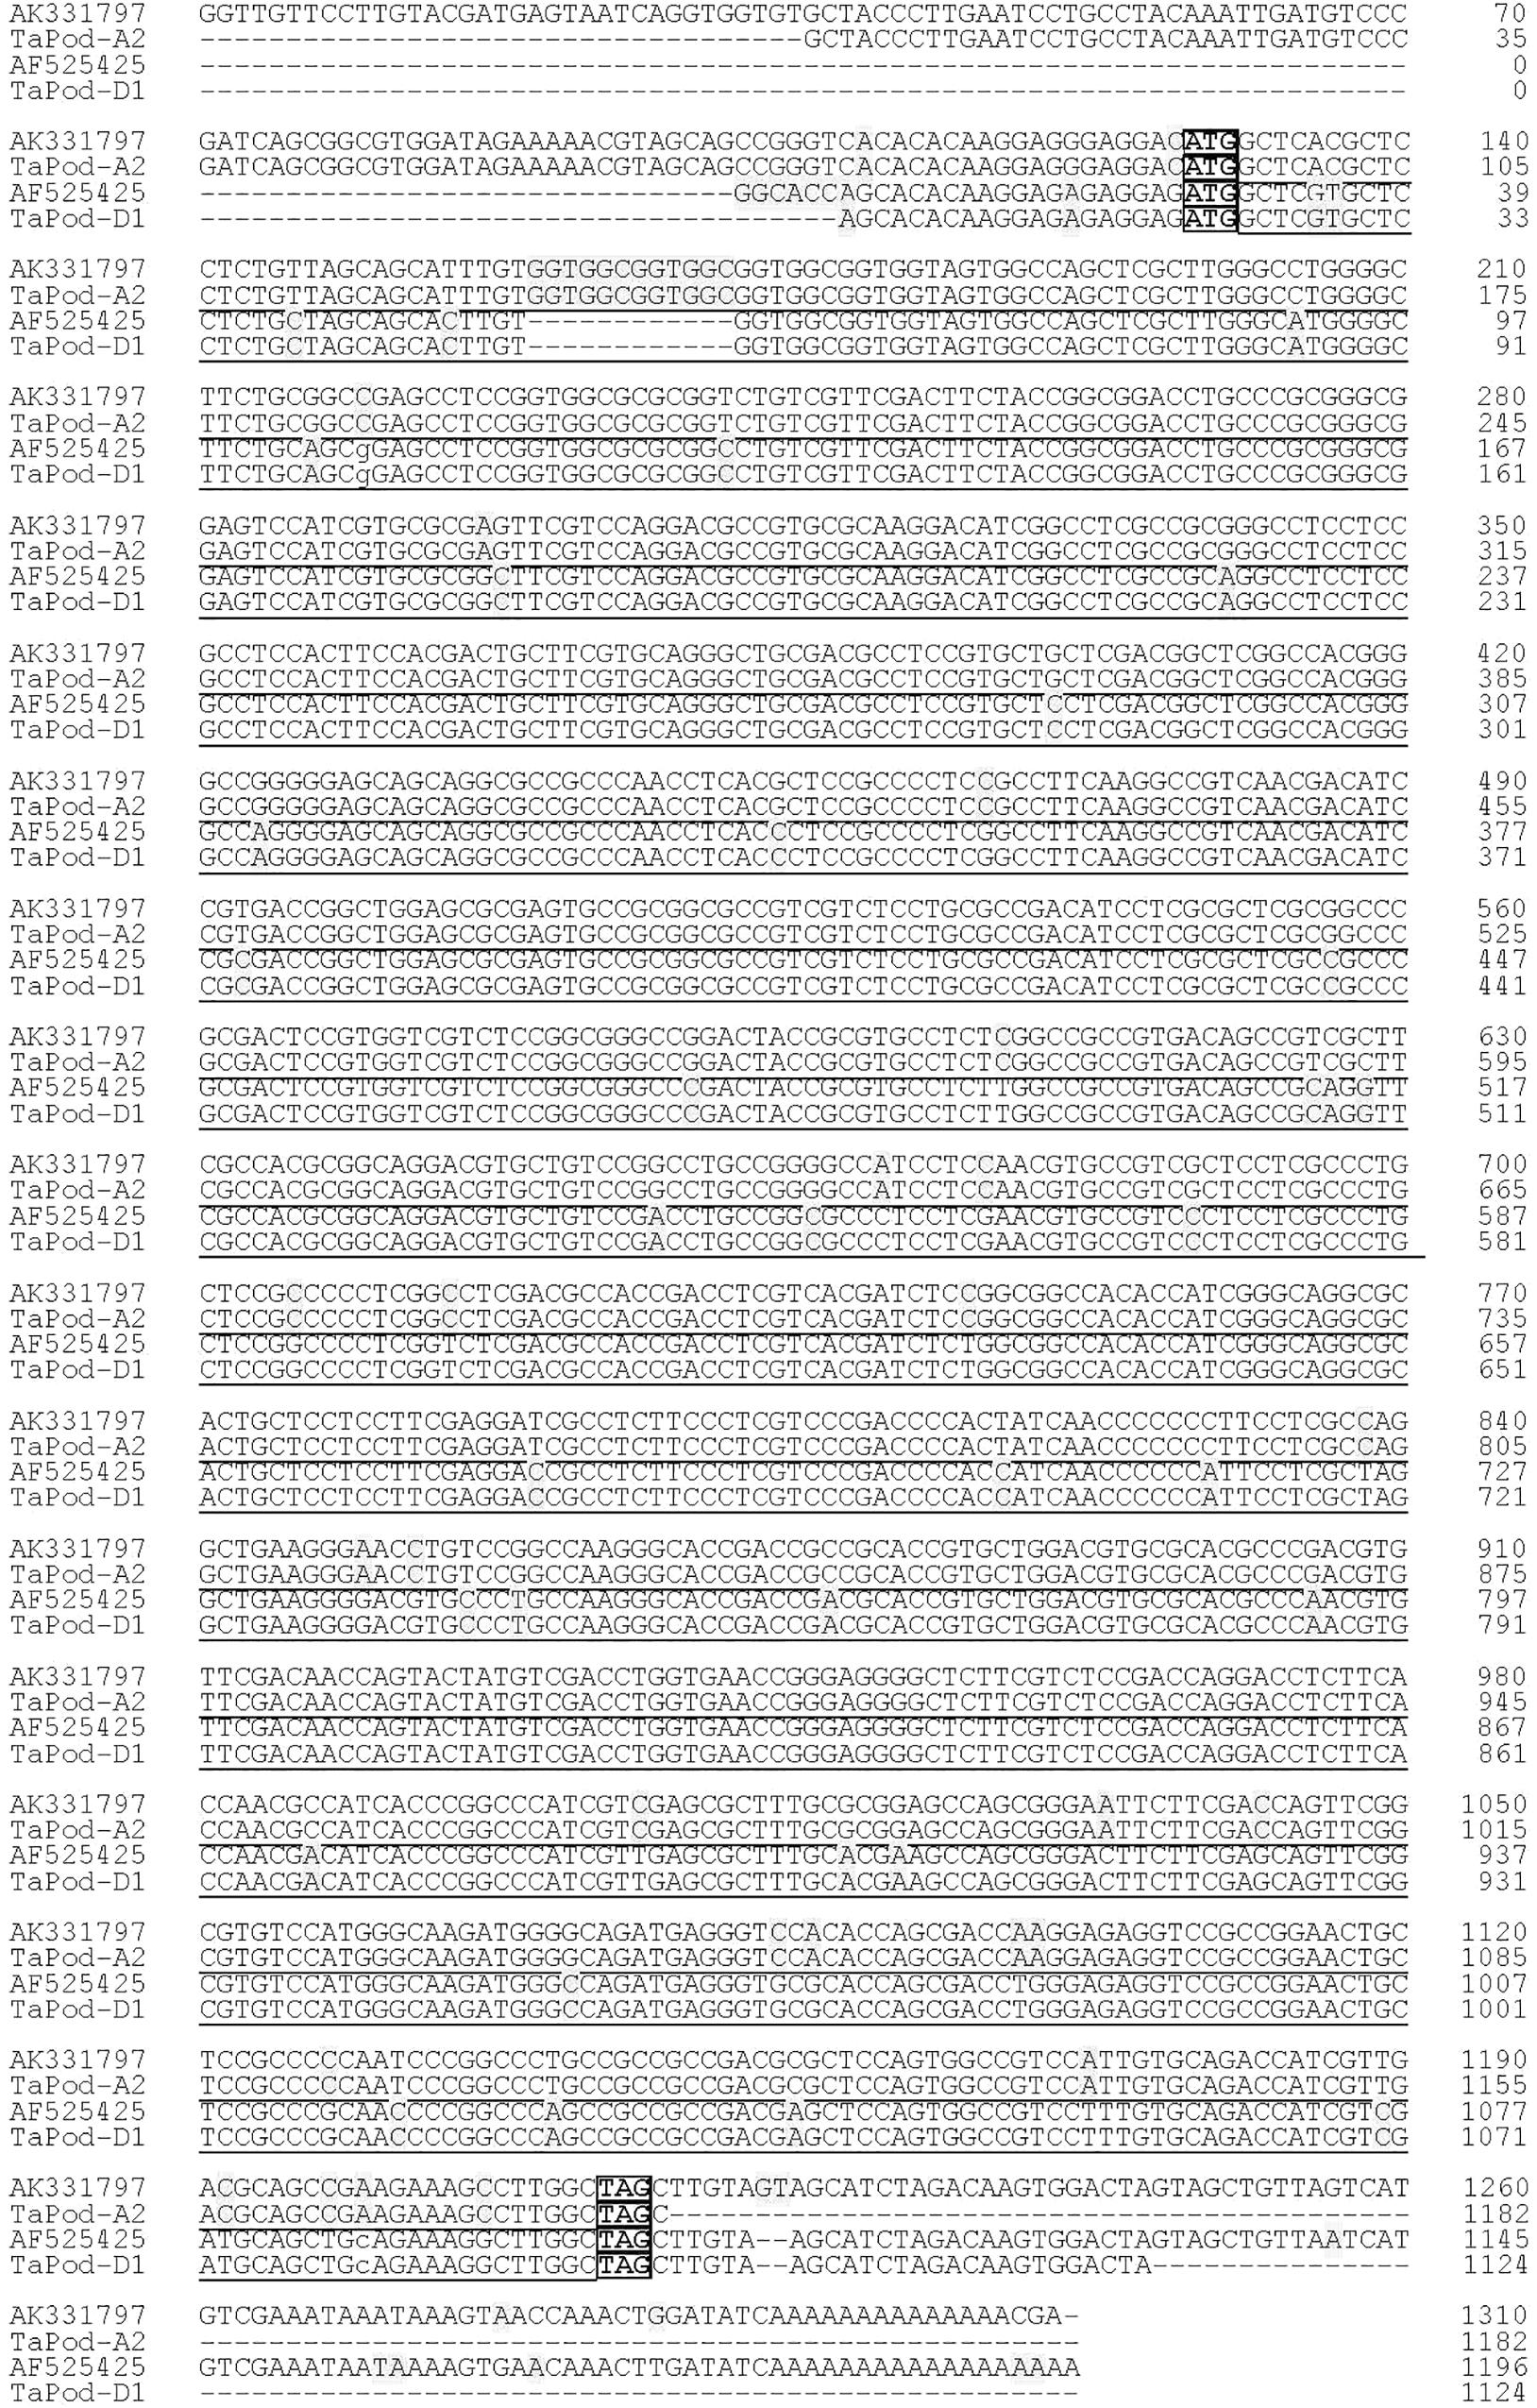
Figure 1. Alignment of TaPod-D1 and TaPod-A2. The SNPs are shaded, whereas the exons are underlined. The start and terminate codons are in boxes. Hyphens indicate gaps to improve alignment.
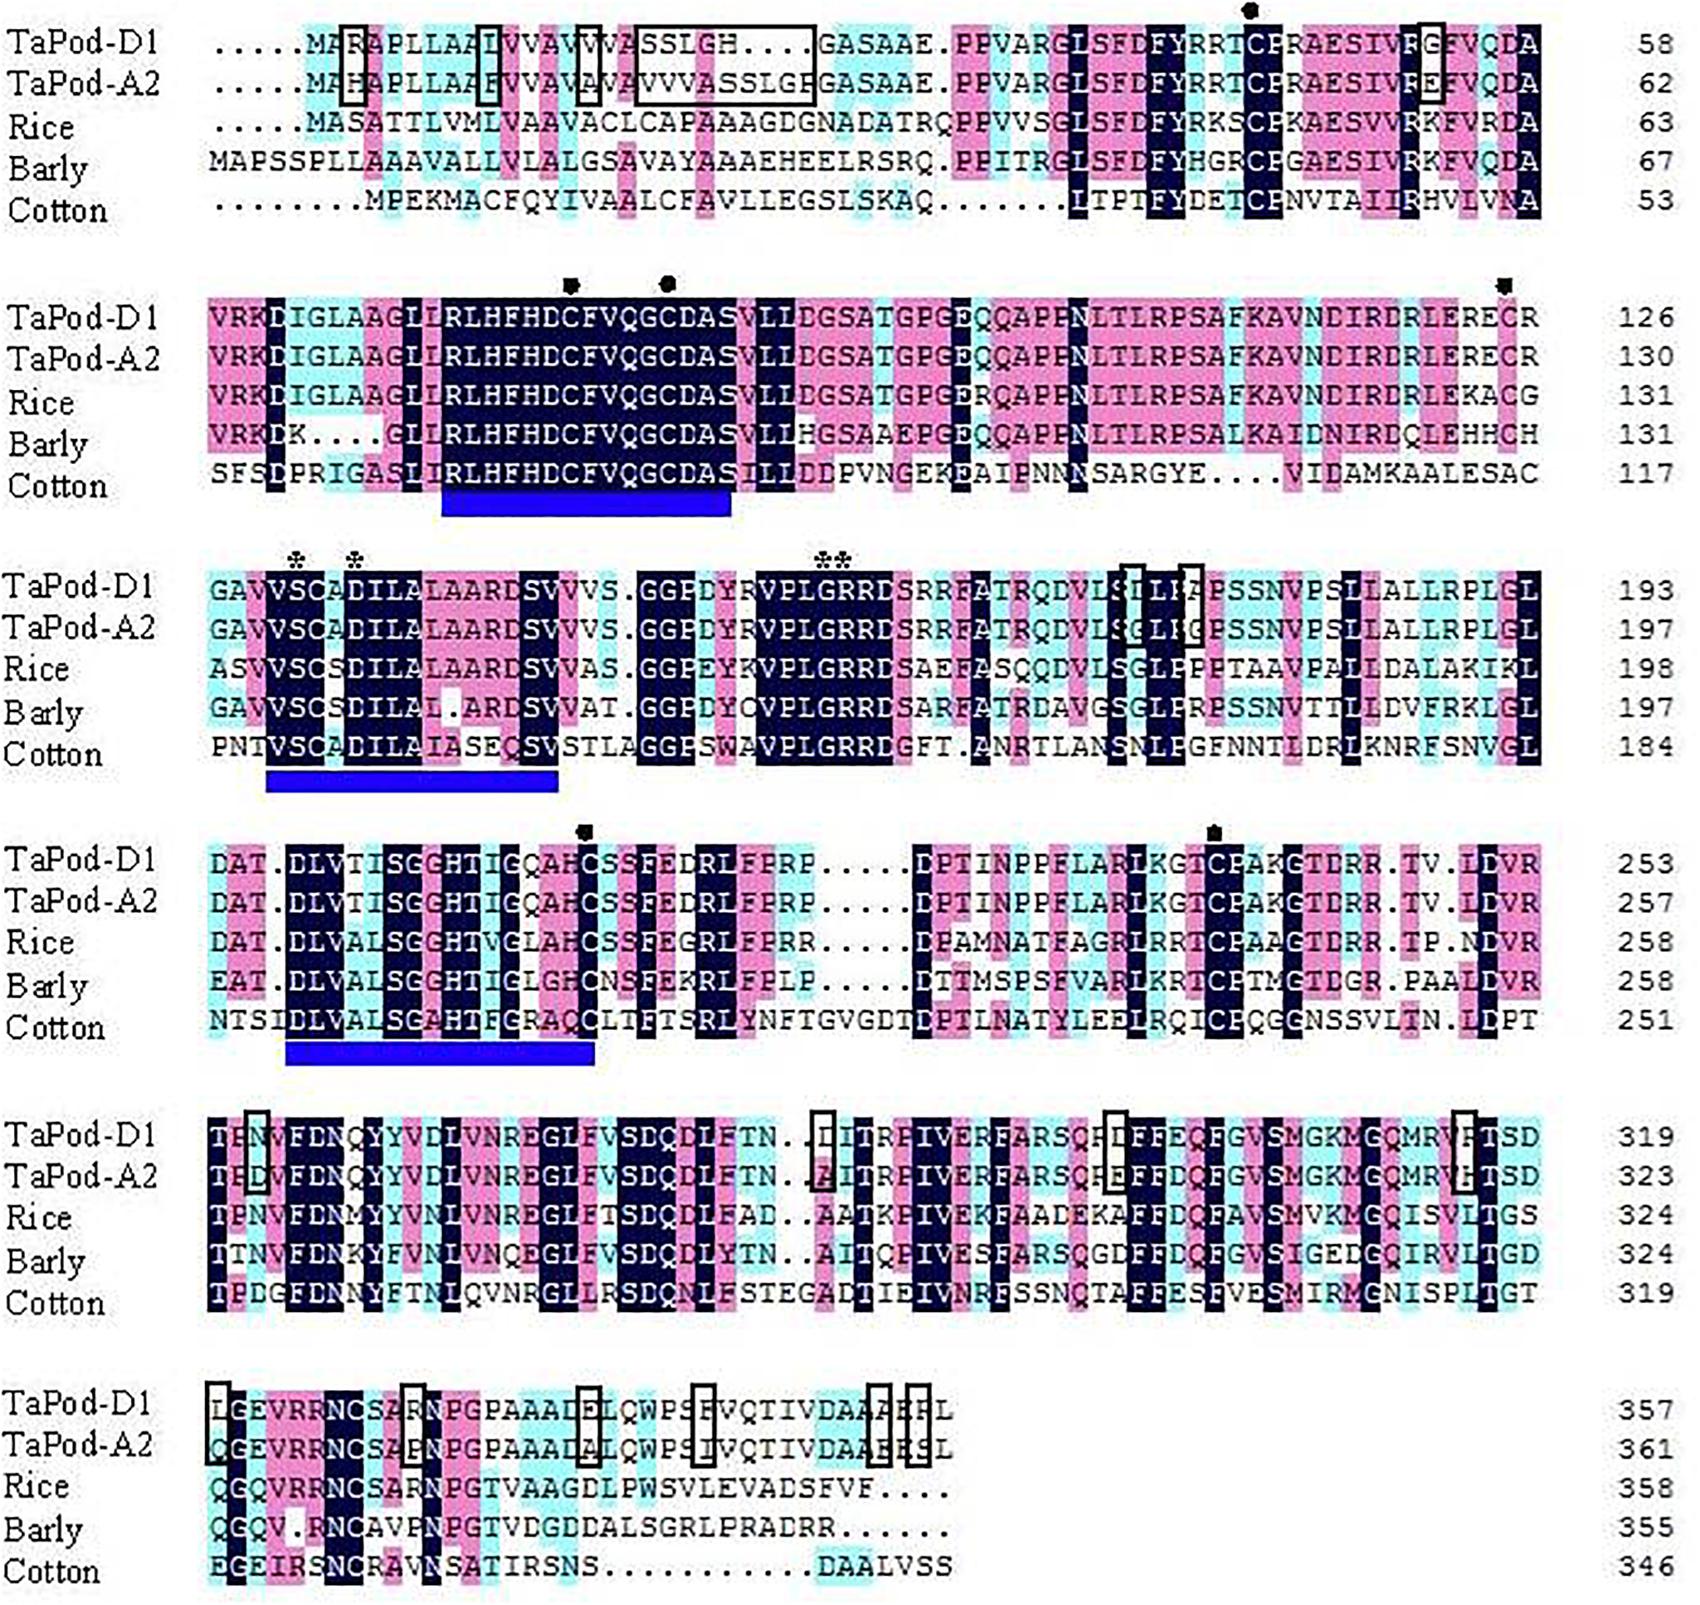
Figure 2. Amino acid sequence alignment of wheat TaPod-A2 and TaPod-D1, rice (CAH69265), barley (AAA32974), and cotton (AAL92037). The shadows show the same amino acid residues. The different amino acids in the peptide sequences encoded by TaPod-A2 and TaPod-D1 are in boxes. The three conserved domains of class III peroxidase are underlined. The residues involved in a salt bridge are indicated with asterisks (∗). The cysteines involved in disulfide bridges are indicated with solid circles (•) (Hiraga et al., 2001; Passardi et al., 2004a,b; Marchler-Bauer et al., 2009).
Based on AK331797, P3 and P4 were designed to amplify the complete gDNA sequence of TaPod-A2, and were mapped on wheat chromosome 7A using a set of NT lines (data not shown). Primer sets P3 and P4 were used to produce upstream and downstream gDNA sequence, respectively, of TaPod-A2 based on AK331797, and produced PCR products of 752 and 629 bp, respectively (Table 1). The PCR fragments amplified by P3 and P4 showed 100% sequence identify with AK331797 and had an overlap of 269 bp. The two sequences amplified from chromosome 7A were combined to create a gDNA sequence of TaPod-A2 comprising a 5′ UTR of 92 bp, and a 3′ UTR of 1 bp, with 1182 bp in total (Table 1 and Figure 1). The ORF of TaPod-A2 was 1089 bp, and encoded 362 AA residues with a predicted molecular weight of ∼38.9 kDa (Figure 2).
TaPod-D1 and TaPod-A2 lacked introns and showed the highest identities in gDNA and AA sequences, at 83.9 and 92.8%, respectively (Figures 1, 2). The ORF of TaPod-D1 and TaPod-A2 shared 61 SNPs and one 12-bp InDel (Figure 1); 27 SNPs gave rise to amino-acid substitutions (Figure 2). The genes TaPod-D1 and TaPod-A2 had an in-frame ATG codon consistent with Kozak’s rule near its 5′ end (Figure 1) (Kozak, 1996), and indicated that the trinucleotide ATG is the initiation codon of TaPod-D1 and TaPod-A2.
Characterization of Partial DNA Sequences of TaPod-A3 and TaPod-B1
Primer set P5 was used to produce the downstream gDNA sequence of the TaPod-A3 gene based on TC389044, whereas set P6 was used to produce the downstream gDNA sequence of TaPod-B1 based on TC383617. Both of the PCR products produced by P5 and P6 showed 100% identity with the downstream sequences of TC389044 and TC383617, respectively (Figure 3). The downstream sequences of TaPod-A3 and TaPod-B1 showed the higher 89.6% identity (Figure 3). Nineteen SNPs and two 1-bp InDel were present in the downstream gDNA sequence of TaPod-D1 and TaPod-A2 (Figure 1). In this study, we failed to obtain upstream sequence of full-length gDNA sequence of TaPod-A3 and TaPod-B1.
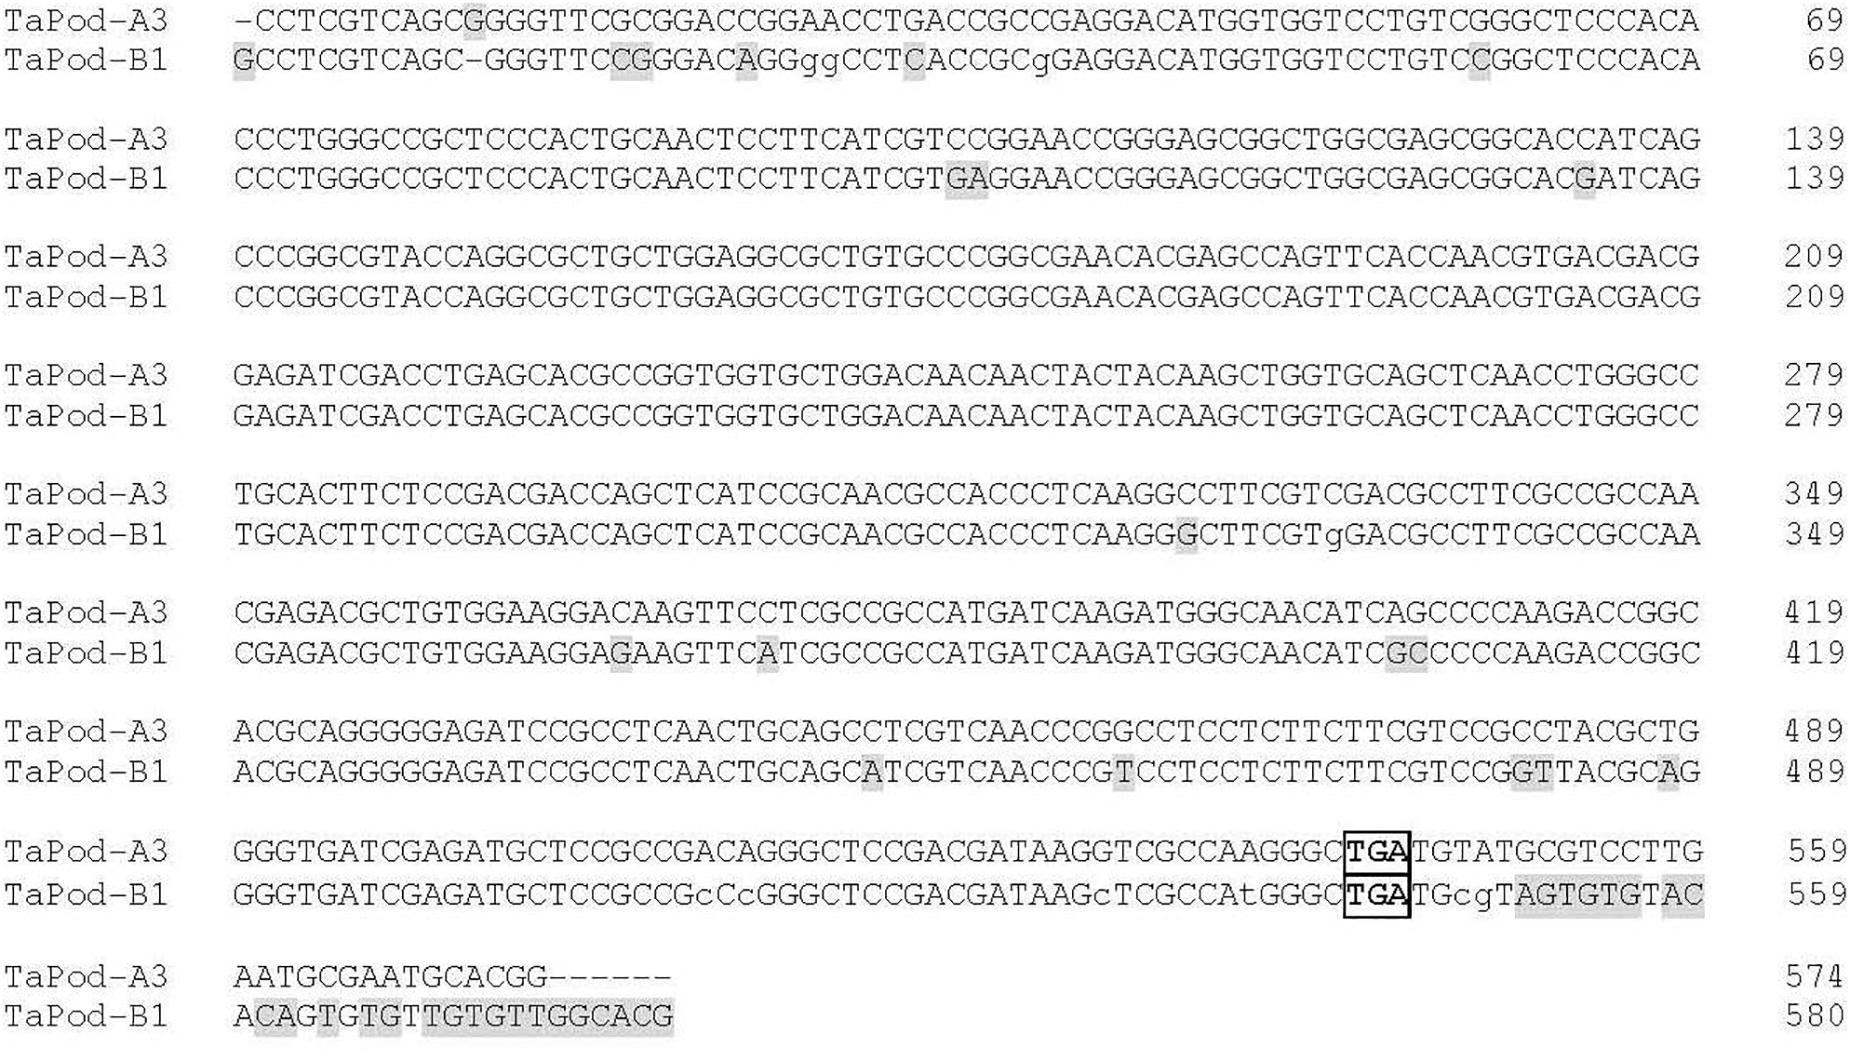
Figure 3. Alignment of TaPod-A3 and TaPod-B1. The SNPs are shaded. The terminate codons are boxed. Hyphens indicate gaps to improve the alignment.
Chromosome Localization of POD Gene Loci
Using PCR and the gene-specific primers (Table 1), all six available CS group-7 Dt lines, CS Dt7AS, CS Dt7AL, CS Dt7BS, CS Dt7BL, CS Dt7DS, and CS Dt7DL were used for the localization of POD genes to chromosome arms. PCR fragments were amplified using gene-specific primers for TaPod-D1, TaPod-A2, TaPod-A3, and TaPod-B1 in five of the lines (Table 2). Among the remaining three CS NT lines, gene-specific primers failed to amplify one fragment in each. In CS Dt7DL, which lacks the short arm of chromosome 7D, no PCR product could be detected using the primers P1 and P2 for TaPod-D1. In CS Dt7AL, which lacks the short arm of chromosome 7A, no PCR fragment was detected using the primers P3 and P4 for TaPod-A2. In CS Dt7AS, which lacks the long arm of chromosome 7A; no PCR fragment could be detected using the primers P5 for TaPod-A3. In CS Dt7BS, which lacks the long arm of chromosome 7B, no PCR fragment could be detected using the primers P6 for TaPod-B1 (Table 2). Overall, these results indicate that TaPod-D1, TaPod-A2, TaPod-A3, and TaPod-B1 were located on chromosome 7DS, 7AS, 7AL, and 7BL, respectively.
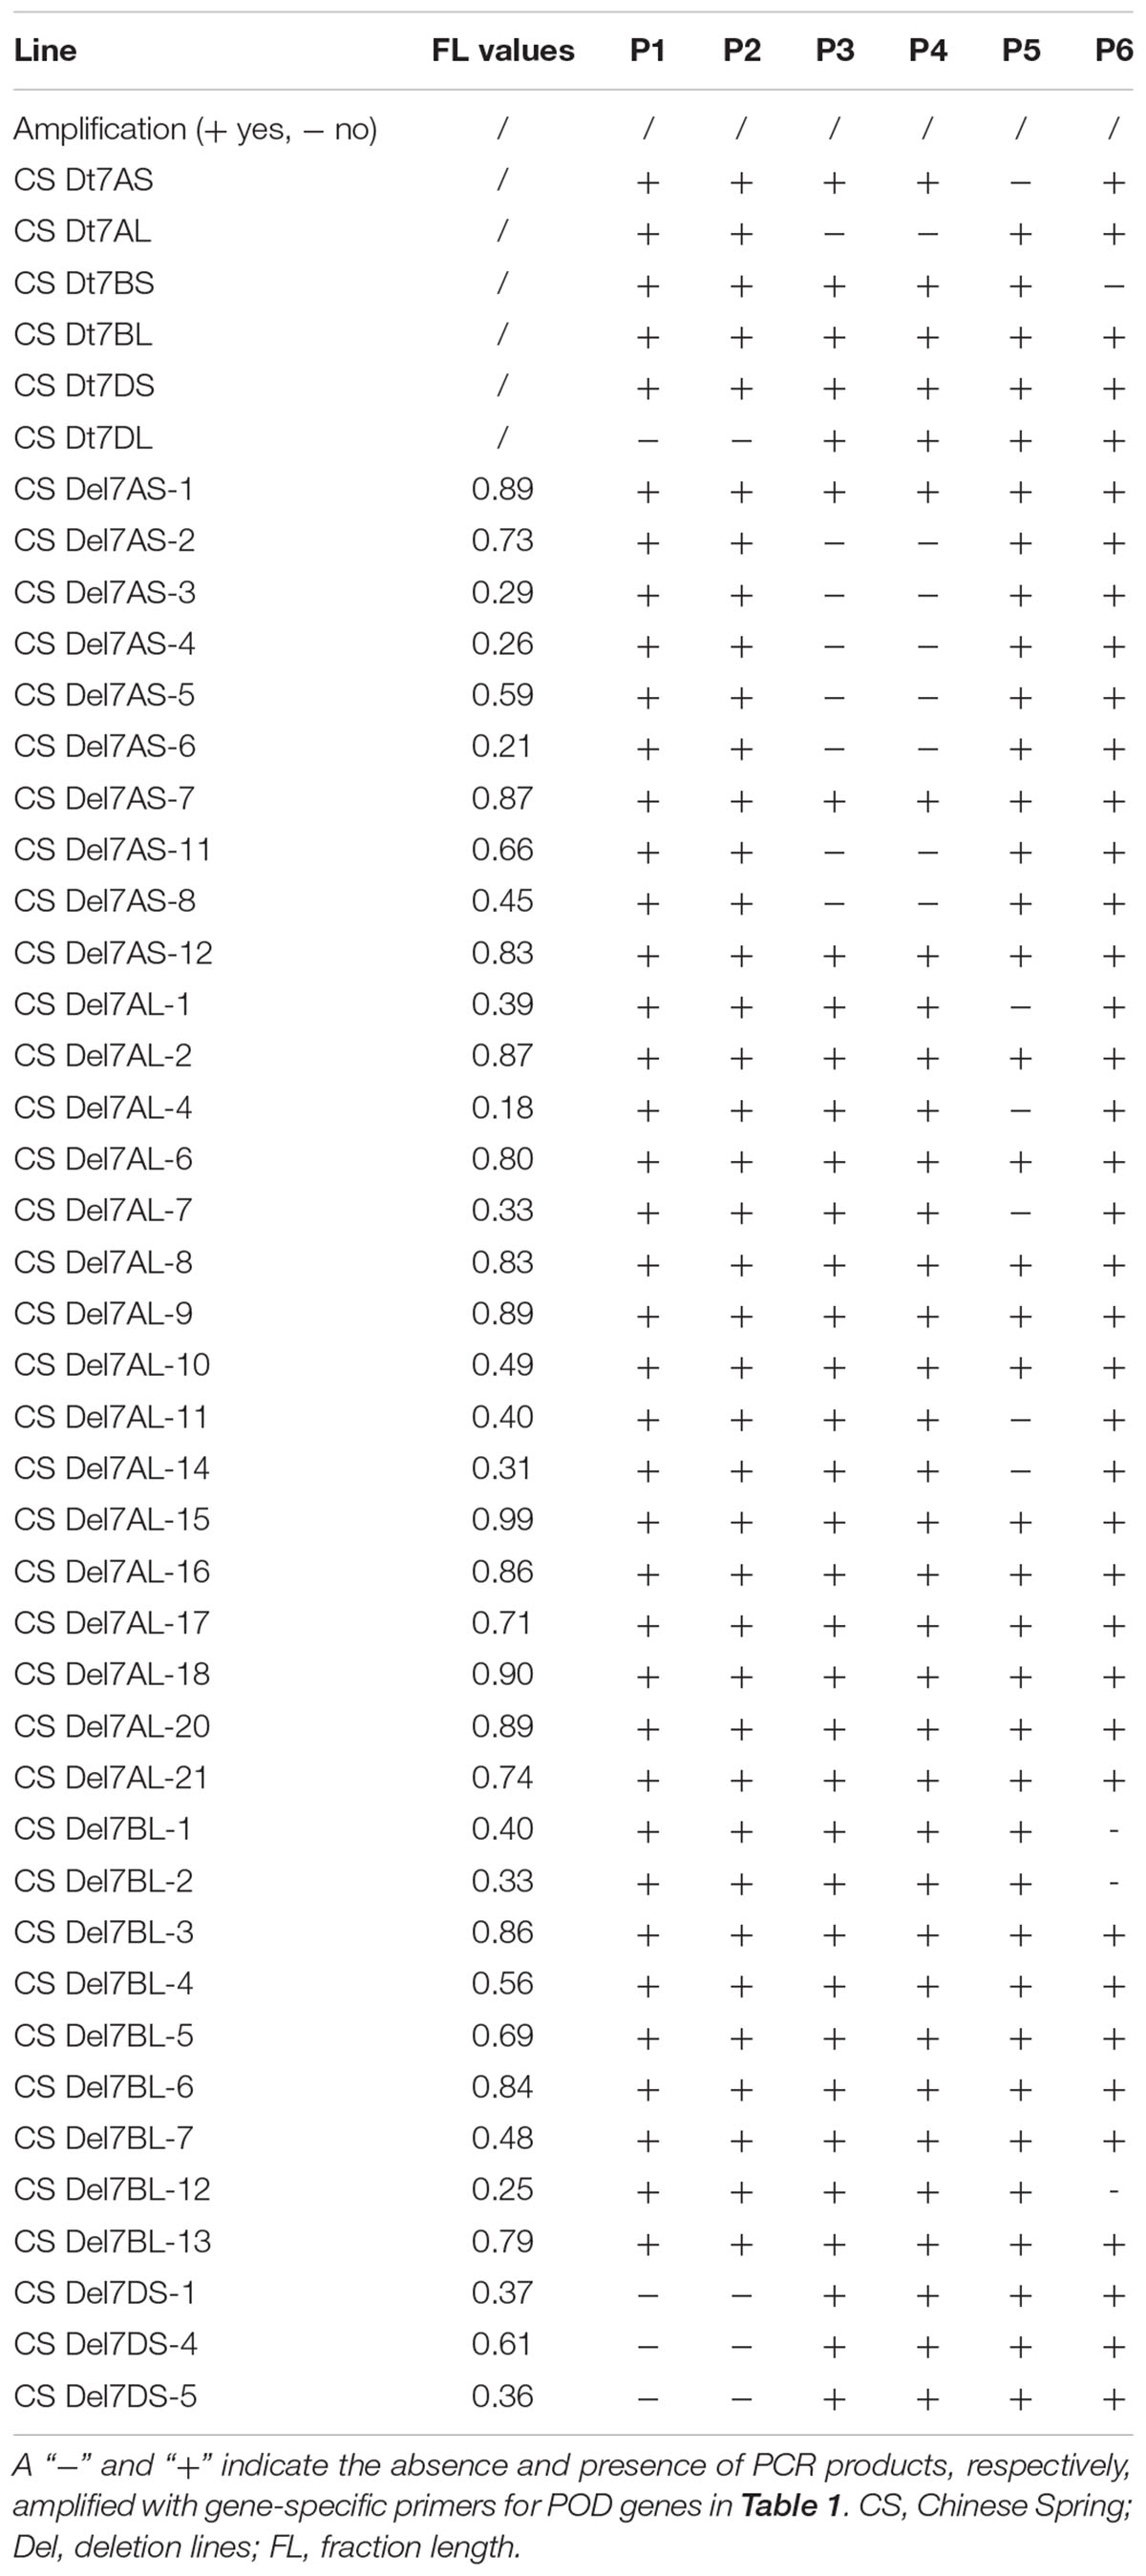
Table 2. The PCR amplification POD genes in Chinese Spring group-7 ditelosomic lines and deletion lines.
Thirty-eight group-7 Del lines were used for physical mapping of these four POD genes within each of the respective chromosome arms. The marker TaPod-D1 appeared in all 35 Del lines; but was absent in the remaining three Del lines for 7DS with break points at Del7DS-5, FL 0.36; Del7DS-1, FL 0.37, and Del7DS-4, FL 0.61 (Table 2). These results confirmed the mapping of TaPod-D1 in the most distal 0.39 FL portion of 7DS (Figure 4).
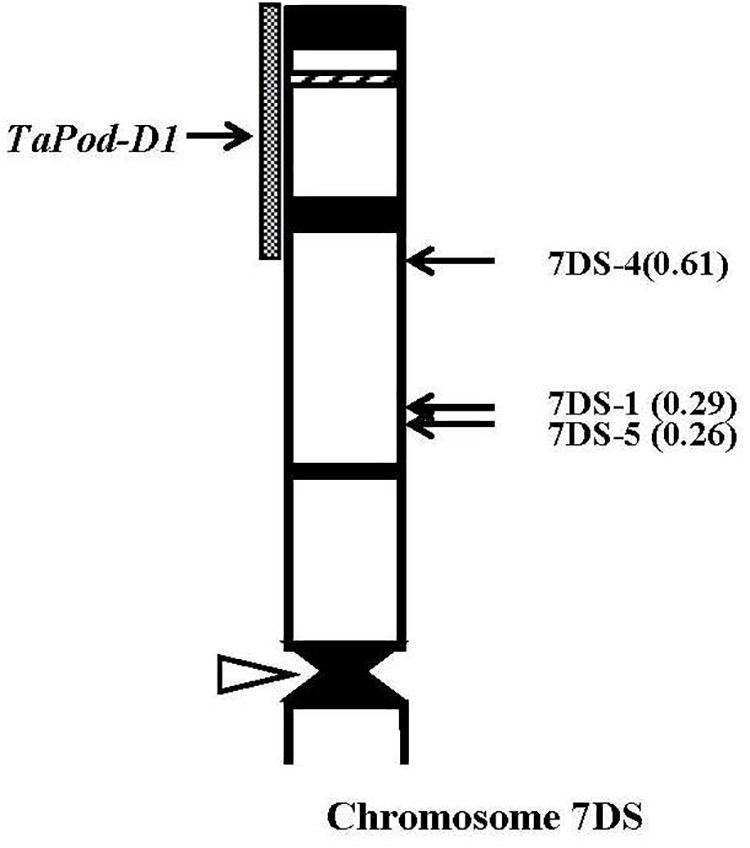
Figure 4. Physical map of Chinese Spring (CS) chromosome 7DS. The identification of deletion lines and fraction arm length (FL) values of breakpoints (parentheses) is shown on the right. C-banding patterns of chromosomes are taken from Gill et al. (1991). The chromosomal region (gray hatched bar) from FL = 0.61 to FL = 1.00 indicates the putative location of the TaPod-D1 gene. Chromosome short arms point toward the top and the open arrow (left) shows the position of the centromere.
The gene-specific primers P3 and P4 for TaPod-A2 could be used to amplify PCR products in 28 group-7 Del lines and three group-7 Del lines for 7AS; whereas no PCR product was detected in the remaining seven Del lines for 7AS (Del7AS-6, FL 0.21; Del7AS-4, FL 0.26; Del7AS-3, FL 0.29; Del7AS-8, FL 0.45; Del7AS-5, FL 0.59; Del7AS-11, FL 0.66; and Del7AS-2, FL 0.73) (Table 2), which confirmed the location of TaPod-A2 between breakpoint FL 0.73 (Del7AS-2) and FL 0.83 (Del7AS-12) of the euploid chromosome of CS (Figure 5).
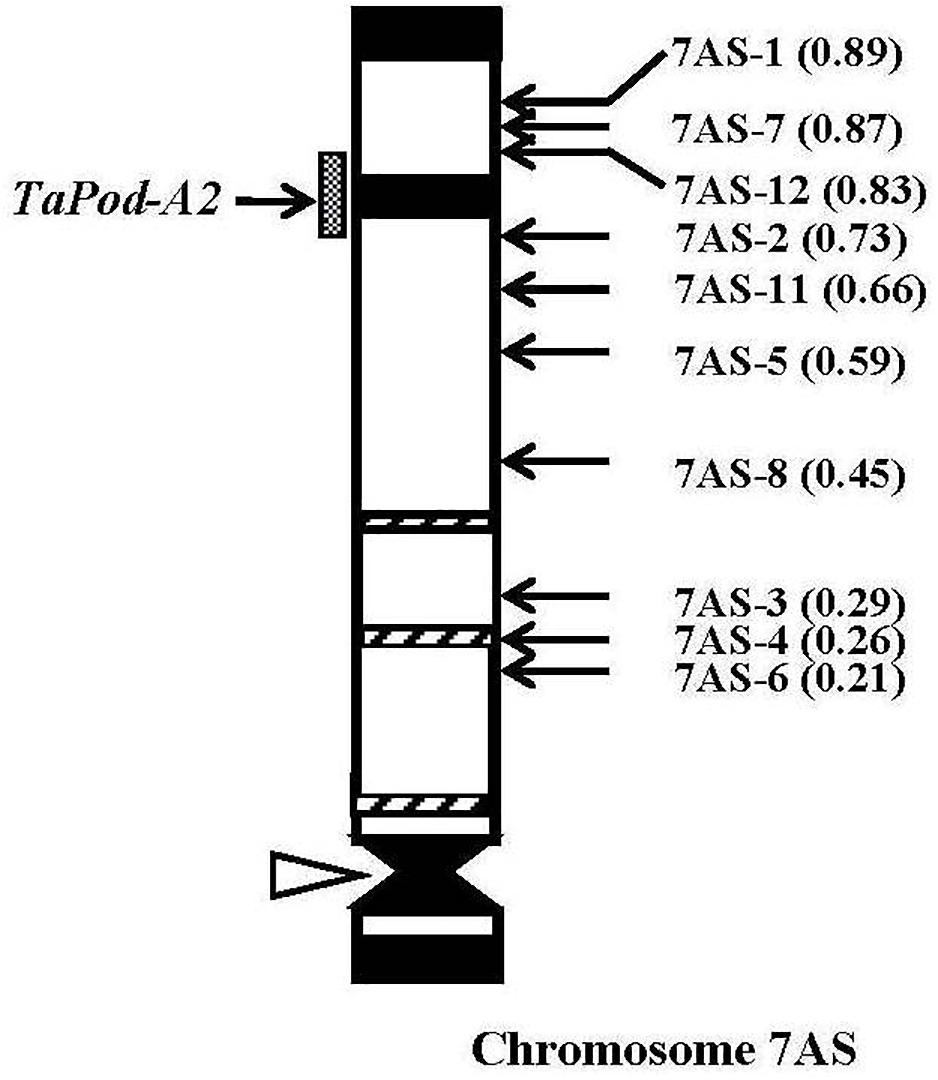
Figure 5. Physical map of Chinese Spring (CS) chromosome 7AS. The identification of deletion lines and fraction arm length (FL) values of breakpoints (parentheses) is shown on the right. C-banding patterns of chromosomes are taken from Gill et al. (1991). The chromosomal region (gray hatched bar) from FL = 0.73 to FL = 0.83 indicates the putative location of the TaPod-A2 gene. Chromosome short arms point toward the top and the open arrow (left) shows the position of the centromere.
The primers P5 for TaPod-A3 could amplify PCR products in 22 group-7 Del lines, and 11 group-7 Del lines for 7AL; whereas no PCR product was detected in the remaining five Del lines for 7AL (Del7AL-4, FL 0.18; Del7AL-14, FL 0.31; Del7AL-7, FL 0.33; Del7AL-1, FL 0.39, and Del7AL-11, FL 0.40) (Table 2), indicating that TaPod-A3 is located between breakpoint FL 0.40 (Del7DL-11) and FL 0.49 (Del7DL-10) of the euploid chromosome of CS (Figure 6).
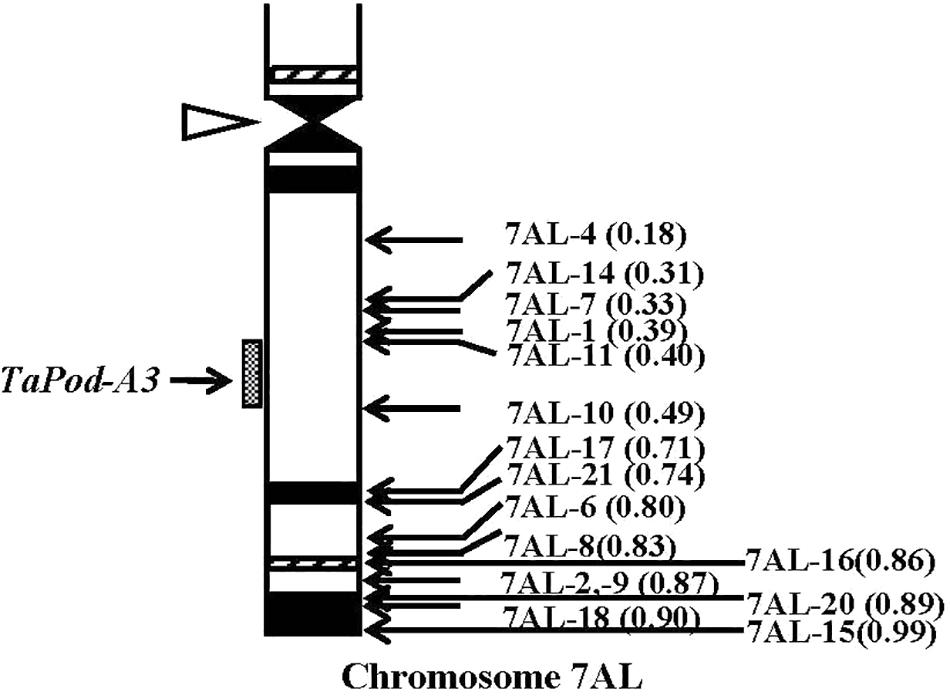
Figure 6. Physical map of Chinese Spring (CS) chromosome 7AL. The identification of deletion lines and fraction arm length (FL) values of breakpoints (parentheses) is shown on the right. C-banding patterns of chromosomes are taken from Gill et al. (1991). The chromosomal region (gray hatched bar) from FL = 0.40 to FL = 0.49 indicates the putative location of the TaPod-A3 gene. Chromosome long arms point toward the bottom and the open arrow (left) shows the position of the centromere.
The primers P6 for TaPod-B1 could amplify PCR products in 29 group-7 Del lines, and six Del lines for 7BL; but no PCR product was detected in the remaining three Del lines for 7BL (Del7BL-12, FL 0.25; Del7BL-2, FL 0.33, and Del7BL-1, FL 0.40) (Table 2), indicating that TaPod-B1 is located between breakpoint FL 0.40 (Del7BL-1) and FL 0.48 (Del7BL-7) of the euploid chromosome of CS (Figure 7).
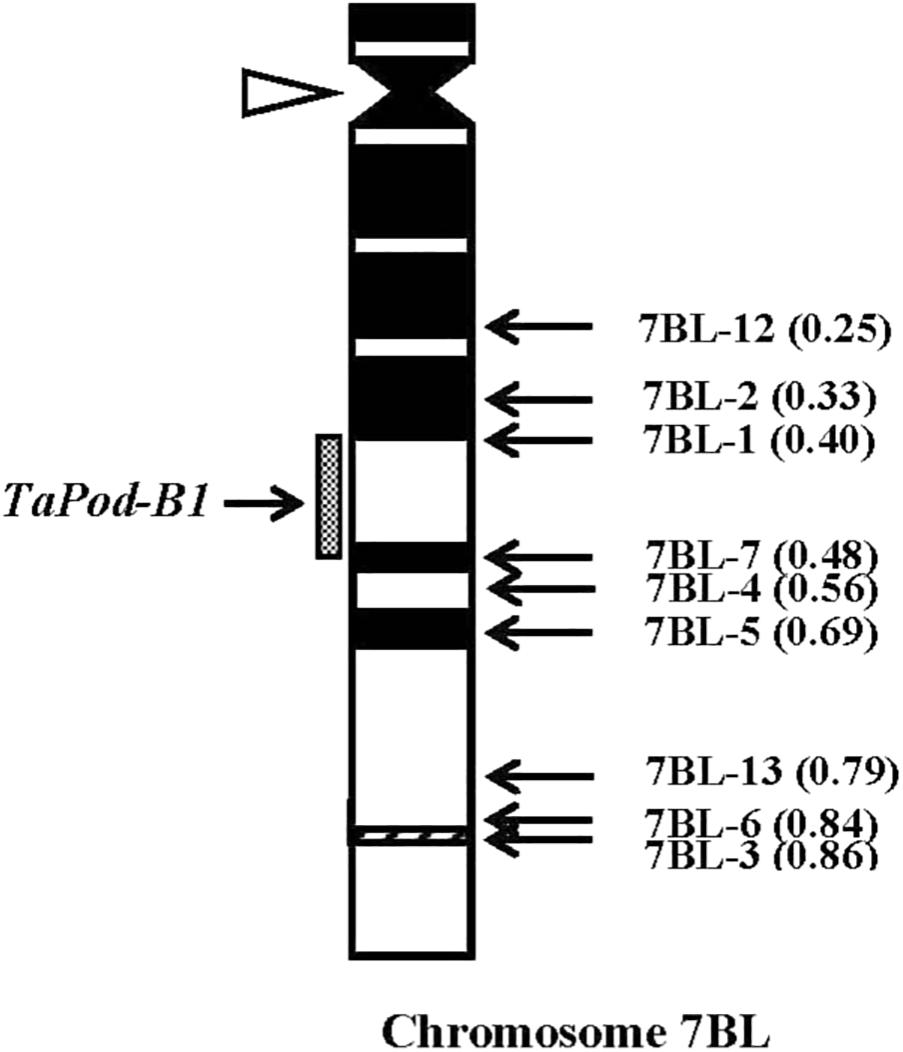
Figure 7. Physical map of Chinese Spring (CS) chromosome 7BL. The identification of deletion lines and fraction arm length (FL) values of breakpoints (parentheses) is shown on the right. C-banding patterns of chromosomes are taken from Gill et al. (1991). The chromosomal region (gray hatched bar) from FL = 0.40 to FL = 0.48 indicates the putative location of the TaPod-B1 gene. Chromosome long arms point toward the bottom and the open arrow (left) shows the position of the centromere.
Allelic Variants at the TaPod-D1 Locus
The gDNA sequence of TaPod-D1 was 1124 bp, and contains an exon of 1077 bp, a 5′ UTR of 20 bp, and a 3′ UTR of 27 bp. Two TaPod-D1 alleles were detected from varieties with higher and lower POD activities, and designated TaPod-D1a and TaPod-D1b, respectively (Figure 8). One Indel and 21 SNPs were found between two alleles in the exon of TaPod-D1, with an Indel (GCTGTG) between the 42nd and 43rd base of TaPod-D1a, the other SNPs are illustrated in Figure 8. The deduced protein sequences of these two TaPod-D1 alleles, TaPod-D1a and TaPod-D1b, contained 357 and 359 AA residues with deduced molecular masses of 38.8 and 39.1 kDa, respectively, and shared 98.6% similarity. Two new AA residues and five missense mutations were found between two alleles in the AA residues of TaPod-D1, with the two new AA (Alanine, A; Valine, V) between the 15th and 16th AA of TaPod-D1a. The other mutations are shown in Supplementary Figure S2.
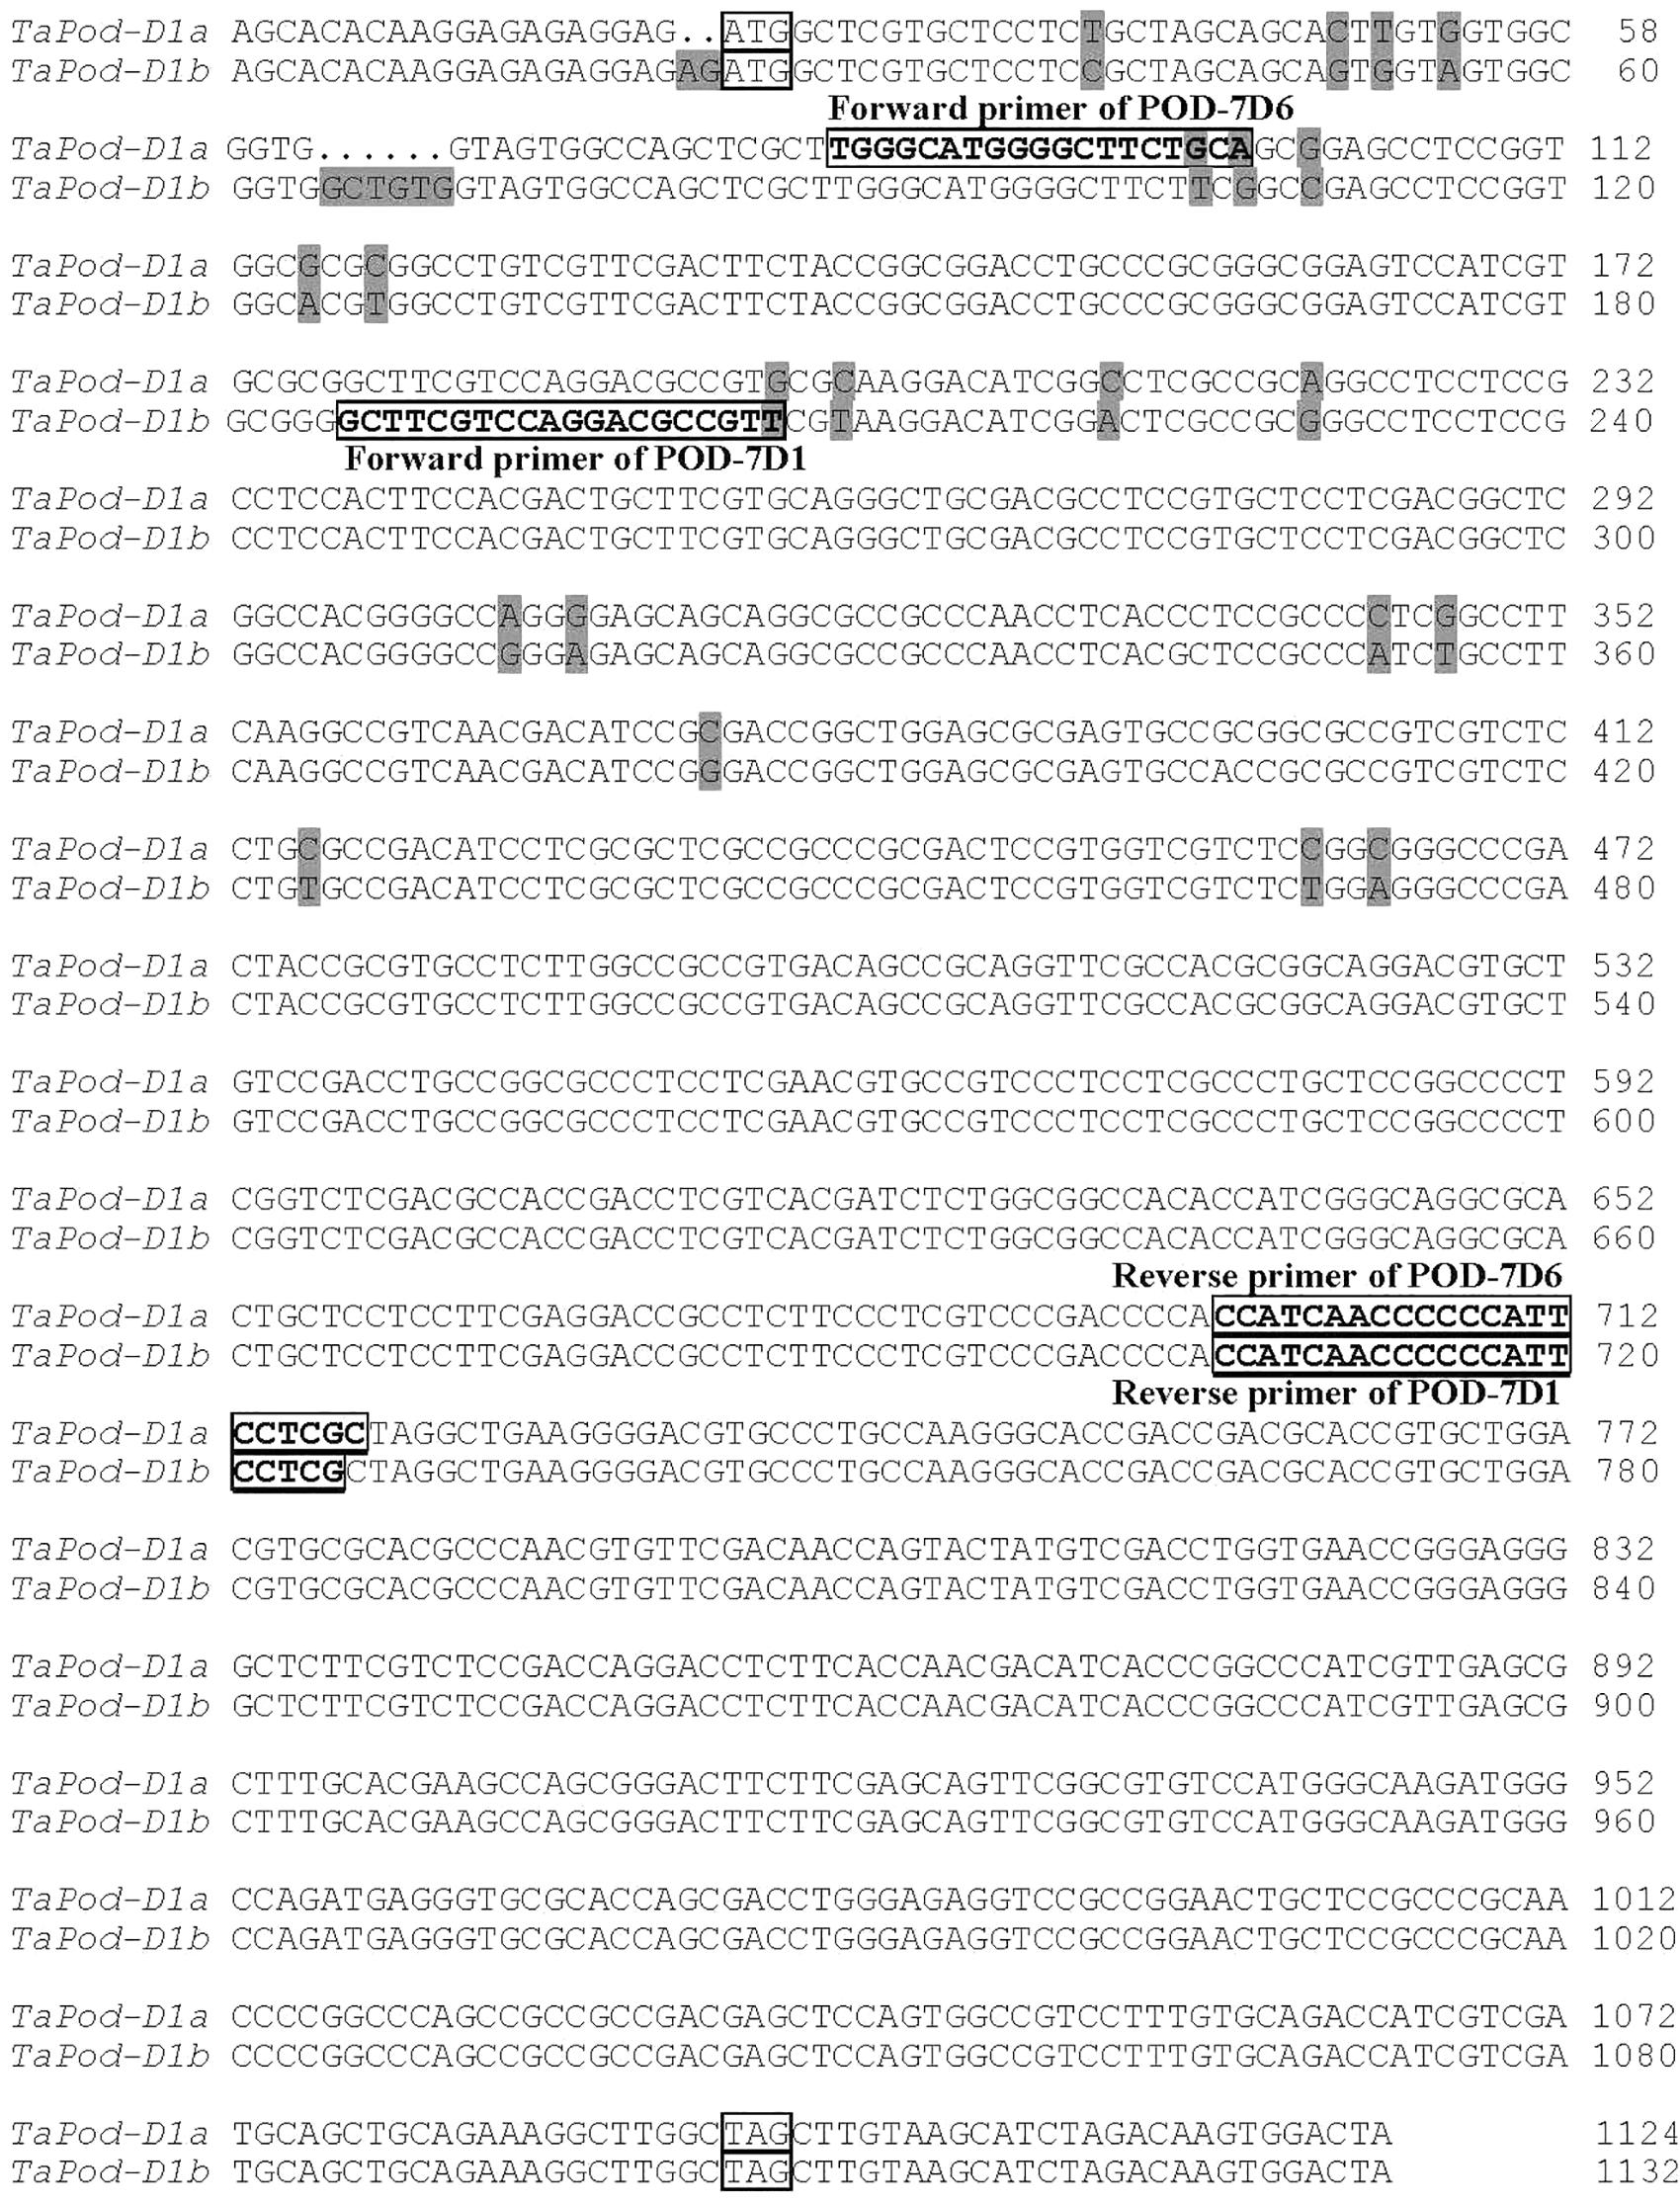
Figure 8. Alignment of alleles TaPod-D1a and TaPod-D1b mapped on wheat chromosome 7D. The initiation and termination codons are boxed; the SNPs are shadowed; the forward and reverse primers of POD-7D6 and POD-7D1 are boxed and bold.
Development of the TaPod-D1 STS Markers for POD Activity
Two functional markers, POD-7D6 and POD-7D1, were developed based on the three mutations at the 76th (from G to T), 78th (from A to G) and 177th (from G to T) bases of TaPod-D1a (Figure 8 and Table 1). POD-7D6 can amplify a PCR fragment of 640 bp in the TaPod-D1a genotypes with lower POD activity; whereas no product is produced in the TaPod-D1b genotypes with higher POD activity (Supplementary Figure S3a). In contrast, POD-7D1 amplifies a product of 540 bp in the TaPod-D1b genotypes with higher POD activity; whereas no product is produced in the TaPod-D1a genotypes with lower POD activity (Supplementary Figure S3b). The two complementary dominant functional markers POD-7D6 and POD-7D1 were physically mapped on 7DS by amplifying NT and three Del lines of chromosome 7DS (CS Del7DS) (Supplementary Figure S4).
The POD activities of 224 wheat varieties were associated with these two functional markers POD-7D6 and POD-7D1. Of the 224 varieties, 115 varieties had TaPod-D1a and 109 had TaPod-D1b (Table 3). The ANOVA indicated that the average POD activities of the 115 varieties with TaPod-D1a expressed 654.6, 705.7, and 675.7 U min-1 g-1 for Regions YHRVWWR and NWWR, and the combined data, respectively, and were significantly lower than the 109 varieties with TaPod-D1b, which expressed 689.3, 760.1, and 709.0 U min-1 g-1 for Regions YHRVWWR and NWWR, and the combined data, respectively (P < 0.01) (Table 3).
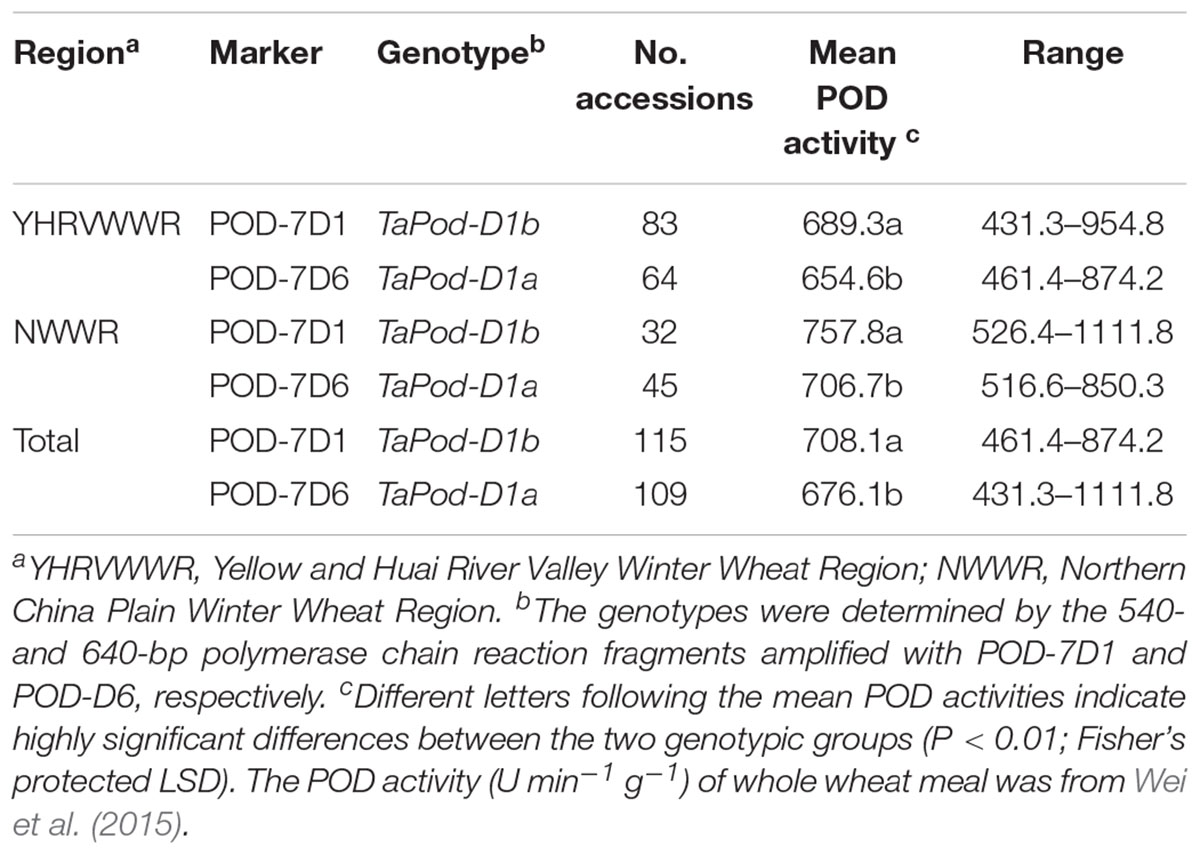
Table 3. Allelic variants at the TaPod-A2 locus in wheat varieties and POD activities with the markers POD-7D1 and POD-7D6.
Discussion
Comparison of Structures of TaPod-D1, TaPod-A2, and Other Plant POD Genes
A striking feature of the nucleotide sequence of POD cDNA in cereals is the GC-richness (∼70.0% G/C)(Theilade and Rasmussen, 1992; Passardi et al., 2004b; Alexandrov et al., 2009). Here, the complete gDNA sequences of TaPod-A2 and TaPod-D1 were characterized in silico in combination with PCR amplification. The overall G/C content of common wheat TaPod-A2 and TaPod-D1 cDNA sequences is 70.0 and 69.5%, respectively. Similarly, the cDNA sequences of rice OsPrx23 (BN000552), barley HvPrx6 (M83671), and maize POD genes (EU962973) have 69.9, 69.0, and 72.1% G/C contents, respectively. Shi and Jarvis (2006) documented that the full-length gDNA sequence of genes that are GC-rich were difficult to isolate with the rapid amplification of cDNA ends (RACE) technique. We found that the G/C content of upstream sequences of wheat POD genes was significantly higher than the G/C content of downstream sequences (∼73.0 vs. ∼66.0%), which may be one of the reasons that we failed to obtain upstream sequence of TaPod-A3 and TaPod-B1 by in silico analysis in combination with PCR amplification.
In sequence alignments of POD genes, the gDNA of TaPod-A2 and TaPod-D1 exhibited, respectively, 60.2 and 62.1% sequence identities with HvPrx6, 73.9 and 73.6% with OsPrx23, and 71.8 and 73.9% maize POD gene (EU962973); whereas TaPod-A2 and TaPod-D1 cDNA showed 79.3 and 79.2% sequence identities with HvPrx6, 75.4 and 74.6% with OsPrx23, and 75.8 and 6.1% with maize POD gene (EU962973). The homologies of gDNA and cDNA sequences among the POD genes of maize, rice, and common wheat ranged from 54.0 to 94.1% (data not shown), with the lowest homology among gDNA sequences due to discrepancies among introns with much lower levels of conserved sequence (Theilade and Rasmussen, 1992; Passardi et al., 2004b; Alexandrov et al., 2009).
The deduced AA sequences of TaPod-A2 and TaPod-D1 exhibited 65.6–69.2% identities with HvPrx6, OsPrx23, and maize POD gene (EU962973), respectively (Figure 2). All of the POD genes included three conserved domains of class III PODs, six cysteines involved in disulfide bridges, and four residues involved in a salt bridge (Figure 2) (Theilade and Rasmussen, 1992; Passardi et al., 2004b; Delannoy et al., 2006; Alexandrov et al., 2009; Marchler-Bauer et al., 2009). Among the three highly conserved domains of class III proxidases, the first and third domains are the distal and proximal heme-binding domains, respectively, whereas the second domain is the central conserved domain and has no known function in proxidase activity (Hiraga et al., 2001; Delannoy et al., 2006; Shigeto and Tsutsumi, 2016).
Alignment of the exons of POD genes indicated that TaPod-A2, TaPod-D1, HvPrx6, OsPrx23, and maize POD genes (EU962973) have full-length 1086, 1074, 1077, and 1068 bp cDNA sequences, respectively. Sequence alignments of POD genes of rice (OsPrx23, OsPrx76, OsPrx84, OsPrx87, OsPrx89, and OsPrx91), maize (EU962973), barley (HvPrx5 and HvPrx6), and common wheat (TaPod-A2 and TaPod-D1) indicated that the exon–intron structures of POD genes are diversified. Until now, five types of exon–intron structures of POD genes in cereals were found, viz., five-exon/four-intron (OsPrx91), four-exon/three-intron (OsPrx89), three-exon/two-intron (OsPrx87), two-exon/one-intron (OsPrx84, HvPrx6), and one-exon/zero-intron structures (TaPod-A2, TaPod-D1, HvPrx5, and OsPrx76) (Theilade and Rasmussen, 1992; Passardi et al., 2004b; Alexandrov et al., 2009). In particular, the one-exon/zero-intron structures are found in most crop species. The results indicated that there were relatively large differences in exon–intron structures among different cereals. In the same cereal species, especially rice, the exon–intron structure of POD genes was also different.
Verification of the Location of POD Genes
Kobrehel and Feillet (1975) found that POD isozymes a and d were located on chromosomes 7D and 7A, respectively. In this study, we mapped TaPod-A2 to 7AS and TaPod-D1 to 7DS using NT, Dt and Del lines of CS. Therefore, TaPod-A2 and TaPod-D1 may code POD isozymes d and a, respectively. This study verifies the previous mapping data on the existence of TaPod-A2 and TaPod-D1 loci on 7AS and 7DS. Our study further localized the TaPod-A2, TaPod-A3, TaPod-B1, and TaPod-D1 genes on the terminal regions of 7AS, 7AL, 7BL, and 7DS, respectively. Based on sequence analysis, gDNA of TaPod-A2 and TaPod-D1 had 56.5 and 55.7% sequence identities with OsPrx76 gene (GenBank accession number: BN000605) in Oryza sativa, respectively (Passardi et al., 2004b). The rice PODs were earlier reported on rice chromosome 6, which is syntenous to wheat group-7 chromosomes (Sorrells et al., 2003; Passardi et al., 2004b). These results would agree with the synteny established between chromosomes of rice and wheat (Sorrells et al., 2003).
Here, we found that TaPod-A2 and TaPod-D1 were located at the similar breakpoint region of 7AS (between breakpoint FL 0.73 and FL 0.83) and 7DS (between breakpoint FL 0.61 and FL 1.00), respectively. Further, TaPod-A3 and TaPod-B1 were located at the similar breakpoint region of 7AL (between breakpoint FL 0.40 and FL 0.49) and 7BL (between breakpoint FL 0.40 and FL 0.48), respectively. Sequence analysis of gDNA and cDNA obtained from various cloning experiments and this study suggests that there are more than four copies of the POD gene in hexaploid wheat. Interestingly, in this study, we found that POD genes were located on either on 7AS (TaPod-A2) or 7DS (TaPod-D1), but not on 7BS. In a previous work, Kobrehel and Feillet (1975) also localized two POD isozymes a and d on 7AS and 7DS in wheat, respectively, and failed to find any POD isozymes on chromosomes 7B. This may be due to homoeologies within groups 4 and 7 and are affected by several rearrangements known to have occurred on and 7BS (Liu et al., 1992; Nelson et al., 1995).
Allelic Variants of TaPod-D1 and POD Activity
Transmembrane proteins (TMPs) are a type of integral membrane and polytopic proteins, which are comprised of a region of AA with a largely hydrophobic character. These proteins have a gateway function that allows specific substances to be transported across the biological membrane. The hydrophobic group of TMP is the primary factor determining the functional characteristics of TMP (Liu et al., 2002). In this study, compared to TaPod-D1a, TaPod-D1b has two more hydrophobic AAs (Alanine and Valine) residues between the 15th and 16th residues in the protein sequence of TaPod-D1a, which would likely lead to a new conformation in this C-terminal portion of the protein. The number of hydrophobic AAs was not changed due to the other five variant AA residues (Supplementary Figure S2). These mutations are located near the C-terminal domain of the conserved 5′ end of the POD gene, which is an important domain in maintaining the function of POD genes (Hiraga et al., 2001; Passardi et al., 2004b; Marchler-Bauer et al., 2009). These polymorphisms could be the reason for a higher expression of the POD gene in the genotype TaPod-D1b attributable to a higher transmembrane transport capacity.
Conclusion
The complete gDNA sequence of TaPod-A2 and TaPod-D1, and the partial gDNA sequence of two additional POD genes (TaPod-A3 and TaPod-B1) were characterized. TaPod-A2 and TaPod-D1 were found to be physically located on 0.73–0.83 and on the most distal 0.39 fraction arm length (FL) of 7AS and 7DS; whereas, TaPod-A3 and TaPod-B1 were assigned to the 0.40–0.49 and 0.40–0.48 FL of 7AL and 7BL, respectively. Two functional markers POD-7D1 and POD-7D6 were developed, amplifying 540- and 640-bp, fragments in varieties with higher and lower POD activities, respectively. The ANOVA indicated the average POD activities of these varieties with TaPod-D1a were significantly lower than these varieties with TaPod-D1b (P < 0.01). This study provides useful information about the molecular structure of the POD genes, effective gene-specific markers, and contributes a valuable resource for quality improvement in wheat breeding programs.
Author Contributions
HG performed the experiments and wrote the manuscript. JS and JW performed a portion of the experiments. EF and CM designed the experiments and contributed to writing of the manuscript.
Funding
This study was supported by grants from the Xinjiang Uygur autonomous regional cooperative innovation project (Shanghai Cooperation Organization partnership for science and technology) (2017E01007), National Natural Science Foundation of China (31771786).
Conflict of Interest Statement
The authors declare that the research was conducted in the absence of any commercial or financial relationships that could be construed as a potential conflict of interest.
Acknowledgments
We thank Dr. Neeraj Kumar for reviewing the manuscript.
Supplementary Material
The Supplementary Material for this article can be found online at: https://www.frontiersin.org/articles/10.3389/fpls.2019.00523/full#supplementary-material
Footnotes
- ^ https://www.k-state.edu/wgrc/genetic_resources/deletion_lines/group_7.html (accessed February 16, 2019).
- ^ http://compbio.dfci.harvard.edu/tgi/cgibin/tgi/blast/index.cgi is no longer active (accessed February 12, 2014).
- ^ http://www.premierbiosoft.com/ (accessed February 16, 2019).
- ^ http://www.lynnon.com (accessed February 16, 2019).
- ^ http://www.ncbi.nlm.nih.gov/Structure/cdd/wrpsb.cgi (accessed February 16, 2019).
- ^ http://compbio.dfci.harvard.edu/tgi/cgibin/tgi/blast/index.cgi is no longer active (accessed February 12, 2014).
References
Alexandrov, N. N., Brover, V. V., Freidin, S., Troukhan, M. E., Tatarinova, T. V., Zhang, H., et al. (2009). Insights into corn genes derived from large-scale cDNA sequencing. Plant Mol. Biol. 69, 179–194. doi: 10.1007/s11103-008-9415-4
Bettge, A. D., and Morris, C. F. (2007). Oxidative gelation measurement and influence on soft wheat batter viscosity and end-use quality. Cereal Chem. 84, 237–242. doi: 10.1094/cchem-84-3-0237
Borrelli, G. M., De Leonardis, A. M., Fares, C., Platani, C., and Di Fonzo, N. (2003). Effect of modified processing conditions on oxidative properties of semolina dough and pasta. Cereal Chem. 80, 225–231. doi: 10.1094/cchem.2003.80.2.225
Bosch, A., Vega, C., and Benito, C. (1987). The peroxidase isozymes of the wheat kernel: tissue and substrate specificity and their chromosomal location. Theor. Appl. Genet. 73, 701–706. doi: 10.1007/BF00260779
Burnette, F. S. (1977). Peroxidase and its relationship to food flavor and quality: a review. J. Food Sci. 42, 1–5.
Csiszár, J., Pintér, B., Kolbert, Z., Erdei, L., and Tari, I. (2008). Peroxidase activities in root segments of wheat genotypes under osmotic stress. Acta Biol. Szeged. 52, 155–156. doi: 10.1016/j.plaphy.2011.12.006
Delannoy, E., Marmey, P., Jalloul, A., Etienne, H., and Nicole, M. (2006). Molecular analysis of class III peroxidase from cotton. J. Cotton Sci. 10, 53–60.
Delcros, J. F., Rakotozafy, L., Boussard, A., Davidou, S., Porte, C., Potus, J., et al. (1998). Effect of mixing conditions on the behavior of lipoxygenase, peroxidase, and catalase in wheat flour doughs. Cereal Chem. 75, 85–93. doi: 10.1094/cchem.1998.75.1.85
Endo, T. R., and Gill, B. S. (1996). The deletion stocks of common wheat. J. Hered. 87, 295–307. doi: 10.1093/oxfordjournals.jhered.a023003
Feillet, P., Autran, J. C., and Verniere, C. I. (2000). Pasta brownness: an assessment. J. Cereal Sci. 32, 215–233. doi: 10.1006/jcrs.2000.0326
Figueroa-Espinoza, M. C., Morel, M. H., Surget, A., and Rouau, X. (1999). Oxidative cross-linking of wheat arabinoxylans by manganese peroxidase. Comparison with laccase and horseradish peroxidase. Effect of cysteine and tyrosine on gelation. J. Sci. Food Agric. 79, 460–463. doi: 10.1002/(sici)1097-0010(19990301)79:3<460::aid-jsfa268>3.0.co;2-7
Fraignier, M. P., Nicole, M. F., and Karoly, K. (2000). Distribution of peroxidases in durum wheat (Triticum durum). Cereal Chem. 77, 11–17. doi: 10.1094/cchem.2000.77.1.11
Gelinas, P., Poitras, E., McKinnon, C. M., and Morin, A. (1998). Oxido-reductases and lipases as dough-bleaching agents. Cereal Chem. 75, 810–814. doi: 10.1094/cchem.1998.75.6.810
Geng, H. W., Beecher, B. S., He, Z. H., and Morris, C. F. (2012). Physical mapping of Puroindoline b-2 genes in wheat using ‘Chinese Spring’ chromosome group 7 deletion lines. Crop Sci. 52, 2674–2678.
Gill, B. S., Friebe, B., and Endo, T. R. (1991). Standard karyotype and nomenclature system for description of chromosome fragments and structural aberrations in wheat (Triticum aestivum). Genome 34, 830–839. doi: 10.1139/g91-128
Hemalatha, M. S., Manu, B. T., Bhagwat, S. G., Leelavathi, K., and Prasada Rao, U. J. S. (2007). Protein characteristics and peroxidase activities of different Indian wheat varieties and their relationship to chapatti making quality. Eur. Food Res. Technol. 225, 463–471. doi: 10.1007/s00217-006-0441-7
Hilhorst, R., Dunnewind, B., Orsel, R., Stegman, P., van Vliet, T., Gruppen, H., et al. (1999). Baking performance, rheology, and chemical composition of wheat dough and gluten affected by xylanase and oxidative enzymes. J. Food Sci. 64, 808–813. doi: 10.1111/j.1365-2621.1999.tb15917.x
Hiraga, S., Sasaki, K., Ito, H., Ohashi, Y., and Matsui, H. (2001). A large family of class III plant peroxidase. Plant Cell Phys. 42, 462–468. doi: 10.1093/pcp/pce061
Honold, G. R., and Stahmann, M. A. (1968). The oxidation reduction enzymes of wheat. IV. Qualitative and quantitative investigations of the oxidases. Cereal Chem. 45, 99–108.
Iori, R., Cavalieri, B., and Palmieri, S. (1995). Cathodic peroxidases of durum wheat flour. Cereal Chem. 72, 176–181.
Johansson, A., Rasmussen, S. K., Harthill, J. E., and Welinder, K. G. (1992). cDNA, amino acid and carbohydrate sequence of barley seed-specific peroxidase BP 1. Plant Mol. Biol. 18, 1151–1161. doi: 10.1007/bf00047718
Jouili, H., Houda, B., and Ezzeddine, E. F. (2011). Plant peroxidases: biomarkers of metallic stress. Acta Phys. Plant 33, 2075–2082. doi: 10.1007/s11738-011-0780-2
Joye, I. J., Lagrain, B., and Delcour, J. A. (2009). Endogenous redox agents and enzymes that affect protein network formation during breadmaking-a review. J. Cereal Sci. 50, 1–10. doi: 10.1016/j.jcs.2009.04.002
Kobrehel, K., and Feillet, P. (1975). Identification of genomes and chromosomes involved in peroxidase synthesis of wheat seeds. Can. J. Bot. 53, 2336–2344. doi: 10.1139/b75-259
Kobrehel, K., and Gautier, M. F. (1974). Variability in peroxidase isozymes in wheat and related species. Can. J. Bot. 52, 755–759. doi: 10.1139/b74-097
Kobrehel, K., Laignelet, B., and Feillet, P. (1974). Study of some factors of macaroni brownness. Cereal Chem. 51, 675–684.
Kozak, M. (1996). Interpreting cDNA sequences: some insights from studies on translation. Mamm. Genome 7, 563–574. doi: 10.1007/s003359900171
Liu, C. J., Atkinson, M. D., Chinoy, C. N., Devos, K. M., and Gale, M. D. (1992). Non-homologous translocations between group 4, 5 and 7 chromosomes within wheat and rye. Theor. Appl. Genet. 83, 305–312. doi: 10.1007/bf00224276
Liu, G. S., Sheng, X. Y., Greenshields, D. L., Ogieglo, A., Kaminskyj, S., Selvaraj, G., et al. (2005). Profiling of wheat class III peroxidase genes derived from powdery mildew-attacked epidermis reveals distinct sequence-associated expression patterns. Mol. Plant Microbe Interact. 18, 730–741. doi: 10.1094/mpmi-18-0730
Liu, Y., Engelman, D. M., and Gerstein, M. (2002). Genomic analysis of membrane protein families: abundance and conserved motifs. Genome Biol. 3, 1–12.
Maksimov, I. V., Cherepanova, E. A., Kuzmina, O. I., Yarullina, L. G., and Akhunov, A. A. (2010). Molecular peculiarities of the chitin-binding peroxidases of plants. Russian J. Bioorg. Chem. 36, 293–300. doi: 10.1134/s1068162010030039
Marchler-Bauer, A., Anderson, J. B., Chitsaz, F., Derbyshire, M. K., DeWeese-Scott, C., Fong, J. H., et al. (2009). CDD: specific functional annotation with the conserved domain database. Nucleic Acids Res. 37, 205–210.
Mika, A., Buck, F., and Luthje, S. (2008). Membrane-bound class III peroxidases: identification biochemical properties and sequence analysis of isoenzymes purified from maize (Zea mays L.) roots. J. Proteomics 71, 412–424. doi: 10.1016/j.jprot.2008.06.006
Nelson, J. C., Sorrells, M. E., and Deynze, A. E. (1995). Molecular mapping of wheat major genes and rearrangements in homoeologous 4, 5 and 7. Genetics 141, 721–731.
Passardi, F., Penel, C., and Dunand, C. (2004a). Performing the paradoxical: how plant peroxidases modify the cell wall. Plant Sci. 9, 534–540. doi: 10.1016/j.tplants.2004.09.002
Passardi, F., Longet, D., Penel, C., and Dunand, C. (2004b). The class III peroxidase multigenic family in rice and its evolution in land plants. Phytochemistry 65, 1879–1893. doi: 10.1016/j.phytochem.2004.06.023
Ramseyer, D. D., Bettge, A. D., and Morris, C. F. (2011a). Endogenous and enhanced oxidative cross-linking in wheat flour mill streams. Cereal Chem. 88, 217–222. doi: 10.1111/j.1750-3841.2011.02404.x
Ramseyer, D. D., Bettge, A. D., and Morris, C. F. (2011b). Flour mill stream blending affects sugar snap cookie and Japanese sponge cake quality and oxidative cross-linking potential of soft white wheat. J. Food Sci. 76,C1300–C1306. doi: 10.1111/j.1750-3841.2011.02404.x
Rasmussen, S. K., Welinder, K. G., and Hejgaard, J. (1991). cDNA cloning, characterization and expression of an endosperm-specific barley peroxidase. Plant Mol. Biol. 16, 317–327. doi: 10.1007/bf00020562
Revanappa, S. B., Salimath, P. V., and Prasada Rao, U. J. S. (2014). Effect of peroxidase on textural quality dough and arabinoxylan characteristic isolated from whole wheat flour dough. Int. J. Food Microbiol. 17, 2131–2141. doi: 10.1080/10942912.2013.784331
Riede, C. R., and Anderson, J. A. (1996). Linkage of RFLP markers to an aluminum tolerance gene in wheat. Crop Sci. 36, 905–909.
Shan, L. W., Luo, H. X., Fan, S. H., and Guo, A. G. (2009). Cloning and expression of wheat peroxidase 1 (wp1) in E. coli. J. Northwest Aric. For. Univ. 37, 213–218.
Shi, X., and Jarvis, D. (2006). A new RACE method for extremely GC-rich genes. Anal. Biochem. 356, 222–228. doi: 10.1016/j.ab.2006.06.028
Shigeto, J., and Tsutsumi, Y. (2016). Diverse functions and reactions of class III peroxidases. New Phytol. 209, 1395–1402. doi: 10.1111/nph.13738
Sorrells, M. E., Rota, M. L., Bermudez-Kandianis, C. E., Greene, R. A., Kantety, R., Munkvold, J. D., et al. (2003). Comparative DNA sequence analysis of wheat and rice genomes. Genome Res. 13, 1818–1827.
Taha, S. A., and Sagi, F. (1987). Relationships between chemical composition of durum wheat semolina and macaroni quality. II. Ash, carotenoid pigments and oxidative enzymes. Cereal Res. Commun. 15, 123–129.
Takasaki, S., Kato, Y., Murata, M., Homma, S., and Kawakishi, S. (2005). Effects of peroxidase and hydrogen peroxide on the dityrosine formation and the mixing characteristics of wheat flour dough. Biosci. Biotechnol. Biochem. 69, 1686–1662.
Theilade, B., and Rasmussen, S. K. (1992). Structure and chromosomal localization of the gene encoding barley seed peroxidase BP 2A. Gene 118, 261–266. doi: 10.1016/0378-1119(92)90197-w
Tognolli, M., Penel, C., Greppin, H., and Simon, P. (2002). Analysis and expression of the class III peroxidase large gene family in Arabidopsis thaliana. Gene 288, 129–138. doi: 10.1016/s0378-1119(02)00465-1
Wei, J. X., Geng, H. W., Zhang, Y., Liu, J. D., Wen, W. E., Zhang, Y., et al. (2015). Mapping quantitative loci for peroxidase activity and developing gene-specific markers for TaPod-A1 on wheat chromosome 3AL. Theor. Appl. Genet. 128, 2067–2076. doi: 10.1007/s00122-015-2567-0
Yoshida, K., Kaothien, P., Matsui, T., Kawaoka, A., and Shinmyo, A. (2003). Molecular biology and application of plant peroxidase genes. Appl. Microbiol. Biot. 60, 665–670. doi: 10.1007/s00253-002-1157-7
Zhai, C. Z., Zhao, L., Yin, L. J., Chen, M., Wang, Q. Y., and Li, L. C. (2013). Two wheat glutathione peroxidase genes whose products are located in chloroplasts improve salt and H2O2 tolerances in arabidopsis. PLoS One 8:e73989. doi: 10.1371/journal.pone.0073989
Keywords: Triticum aestivum L., peroxidase, gene cloning, physical mapping, gene-specific markers
Citation: Geng H, Shi J, Fuerst EP, Wei J and Morris CF (2019) Physical Mapping of Peroxidase Genes and Development of Functional Markers for TaPod-D1 on Bread Wheat Chromosome 7D. Front. Plant Sci. 10:523. doi: 10.3389/fpls.2019.00523
Received: 04 February 2019; Accepted: 04 April 2019;
Published: 24 April 2019.
Edited by:
Petr Smýkal, Palacký University Olomouc, CzechiaReviewed by:
Tomáš Vyhnánek, Mendel University, CzechiaAntonio Martin, Spanish National Research Council (CSIC), Spain
Copyright © 2019 Geng, Shi, Fuerst, Wei and Morris. This is an open-access article distributed under the terms of the Creative Commons Attribution License (CC BY). The use, distribution or reproduction in other forums is permitted, provided the original author(s) and the copyright owner(s) are credited and that the original publication in this journal is cited, in accordance with accepted academic practice. No use, distribution or reproduction is permitted which does not comply with these terms.
*Correspondence: Craig F. Morris, Y3JhaWcubW9ycmlzQGFycy51c2RhLmdvdg==
 Hongwei Geng
 Jia Shi1
 E. Patrick Fuerst
 Craig F. Morris