- 1Tohoku Agricultural Research Center, National Agriculture and Food Research Organization, Morioka, Japan
- 2Institute for Agro-Environmental Sciences, National Agriculture and Food Research Organization, Tsukuba, Japan
- 3Research Center for Agricultural Information Technology, National Agriculture and Food Research Organization, Tsukuba, Japan
- 4Hokkaido Agricultural Research Center, National Agriculture and Food Research Organization, Memuro, Japan
- 5Taiyo Keiki Co. Ltd., Toda, Japan
- 6Department of Biology and Chemistry, Azusa Pacific University, Azusa, CA, United States
- 7Kyushu Okinawa Agricultural Research Center, National Agriculture and Food Research Organization, Chikugo, Japan
- 8Faculty of Horticulture, Chiba University, Matsudo, Japan
Enhancing crop yield response to elevated CO2 concentrations (E-[CO2]) is an important adaptation measure to climate change. A high-yielding indica rice cultivar “Takanari” has recently been identified as a potential candidate for high productivity in E-[CO2] resulting from its large sink and source capacities. To fully utilize these traits, nitrogen should play a major role, but it is unknown how N levels influence the yield response of Takanari to E-[CO2]. We therefore compared grain yield and quality of Takanari with those of Koshihikari, a standard japonica cultivar, in response to Free-Air CO2 enrichment (FACE, +200 μmol mol−1) under three N levels (0, 8, and 12 g m−2) over three seasons. The biomass of both cultivars increased under E-[CO2] at all N levels; however, the harvest index decreased under E-[CO2] in the N-limited treatment for Koshihikari but not for Takanari. The decreased harvest index of Koshihikari resulted from limited enhancement of spikelet number under N-limitation. In contrast, spikelet number increased in E-[CO2] in Takanari even without N application, resulting in significant yield enhancement, averaging 18% over 3 years, whereas Koshihikari exhibited virtually no increase in yield in E-[CO2] under the N-limited condition. Grain appearance quality of Koshihikari was severely reduced by E-[CO2], most notably in N-limited and hot conditions, by a substantial increase in chalky grain, but chalky grain % did not increase in E-[CO2] even without N fertilizer. These results indicated that Takanari could retain its high yield advantage over Koshihikari with limited increase in chalkiness even under limited N conditions and that it could be a useful genetic resource for improving N use efficiency under E-[CO2].
Introduction
Atmospheric CO2 concentrations ([CO2]) are rising at an unprecedented rate. Global [CO2] surpassed a milestone level of 400 ppm in 2015 and the rate of increase is becoming faster (https://www.esrl.noaa.gov/gmd/ccgg/trends/). Increasing concentrations of CO2 and other greenhouse gases will likely induce global environmental changes such as increases in temperatures, which are projected to have negative effects on food production of the major cereal crops (Zhao et al., 2017) or slow the rate of food production increase that is required to meet increasing demand (Iizumi et al., 2017). In contrast, increasing [CO2] will have a direct positive effect on crop photosynthesis and thereby increase grain yield; however, the size of the CO2 fertilization effect is one of the major sources of uncertainty in the projection of the global crop production (Rosenzweig et al., 2014; Deryng et al., 2016; Schleussner et al., 2018).
The uncertainty in projecting the CO2 fertilization effect arises partly from our limited quantitative understanding of crops to elevated [CO2] (E-[CO2]) (Hasegawa et al., 2017); however, CO2 fertilization effects themselves are variable in nature depending on various factors, including temperature, water, nutrition, and crop species or genotype (Kimball, 2016). To exploit the positive effects of E-[CO2] on crop production in the future, the mechanisms by which the CO2 fertilization effects vary must be better understood.
Application of nitrogen (N) fertilizers played a significant role in driving crop yields during the Twentieth century, together with genetic improvement for the suitability of a greater use of N (Evans, 1993; Cassman et al., 2003). Efficient use of N is required to reduce the negative impacts of agriculture on agricultural production not only for increasing farm economy but also for reducing environmental loads by agriculture via possible emission of N2O and contamination of groundwater (Zhang et al., 2015b).
Nitrogen is a key nutritional element mediating plant responses to E-[CO2]. Nitrogen often limits the enhancement of photosynthesis, biomass production, and yield by E-[CO2] (Nakano et al., 1997; Kimball et al., 2002). In fact, previous rice FACE experiments showed that grain yield enhancement in E-[CO2] decreased when N application was below 80 kg/ha (Hasegawa et al., 2017). Nutritional value and appearance quality of the grains are also vulnerable to change under E-[CO2] (Yang et al., 2007; Myers et al., 2014; Usui et al., 2016). Therefore, it is likely that N management practices will need to be revised or redesigned to achieve optimal productivity and quality outcomes under climate change (Bloom, 2015).
Genetic improvement is another major driver of improved crop productivity and will be the major and promising countermeasure against any negative effects of climate change. There is growing evidence of large variation in the yield response to E-[CO2] among cultivars. For instance, a rice FACE experiment in Japan revealed that a wide range of yield enhancement (3–36%) exists among cultivars and that higher-yielding cultivars with a large sink size had a greater [CO2] response (Hasegawa et al., 2013). A more recent study showed that quantitative trait loci for increasing spikelet number were effective in increasing grain yield under E-[CO2] (Nakano et al., 2017). Another rice FACE experiment in China also showed a large yield response to E-[CO2] with hybrid and inbred indica cultivars (Zhu et al., 2015).
These findings are encouraging in that improvement of yield potential can also be beneficial for positive yield response to E-[CO2]; however, yield improvement as a result of greater biomass generally requires greater nutrient input (Wang and Peng, 2017). We would therefore expect that the yield advantage would be smaller where the nutrient resource is limiting. However, previous cultivar studies of yield responses to E-[CO2] were conducted under conventional N conditions and the potential interactions among [CO2], cultivar, and N might have been overlooked.
E-[CO2] is known to reduce grain appearance quality (Yang et al., 2007), which is exacerbated by increases in temperature largely through the increased occurrence of chalky grains (CG) (Usui et al., 2016). The severity of quality degradation by E-[CO2] is cultivar dependent (Usui et al., 2014), and N dependent (Usui et al., 2016); however, the combined effects of N and [CO2] have not been tested to date.
In the present study, we focused on the following two cultivars with contrasting yield potential and appearance quality: Takanari, a high-yielding indica cultivar (Imbe et al., 2004) and Koshihikari, a standard japonica cultivar (Kobayashi et al., 2018). Takanari has several favorable traits under E-[CO2], including greater photosynthetic capacity (Chen et al., 2014), biomass, and grain yield (Hasegawa et al., 2013), and better appearance quality (Zhang et al., 2015a) with little increase in water use (Ikawa et al., 2018) compared to Koshihikari. Koshihikari has been a dominant rice cultivar in Japan for more than 50 years, accounting for more than a third of the rice planted area of the country (Kobayashi et al., 2018). Koshihikari has an intermediate response to E-[CO2] in key traits such as yield (Hasegawa et al., 2013), grain appearance quality (Usui et al., 2014) and grain nutritional quality (Myers et al., 2014) and so can serve as an appropriate check cultivar for the study. To design future N management for contrasting cultivars, field level responses to E-[CO2] must be compared. FACE is currently the most reliable technology to compare the [CO2] responsiveness of different cultivars in open fields. We therefore grew these cultivars under three different N levels for 3 years and compared yield and quality traits in response to E-[CO2] at the Tsukuba FACE facility in Japan.
Materials and Methods
Site Description and Weather Conditions
The experiments were conducted at the Tsukuba FACE facility, Tsukubamirai, Ibaraki, Japan (35°58′N, 139°60′E, 10 m above sea level) over 3 years (2012–2014). Details of the site are described by Nakamura et al. (2012) and Hasegawa et al. (2013). Briefly, the site was established in 2010 in the central region of Japan. The climate is humid subtropical with an average temperature of 13.8°C and annual precipitation of 1,280 mm. The soil is a Fluvisol, which is typical of alluvial areas with 23% clay and 40% silt contents. The total C and N concentrations were 21.4 and 1.97 mg g−1, respectively.
Average air temperatures over the three growing seasons were similar among the 3 years, ranging from 23.5 to 24.2°C (Table 1) and were higher than the 20 year (1991–2010) average of 23.5°C recorded at the nearby weather station, Tsukuba, located approximately 17 km away from the site (available http://www.data.jma.go.jp/obd/stats/etrn/). The solar radiation was between 17.1 and 18.8 MJ m−2d−1 (Table 1), which was 12% higher than the 20-year average of 15.9 MJ m−2d−1.
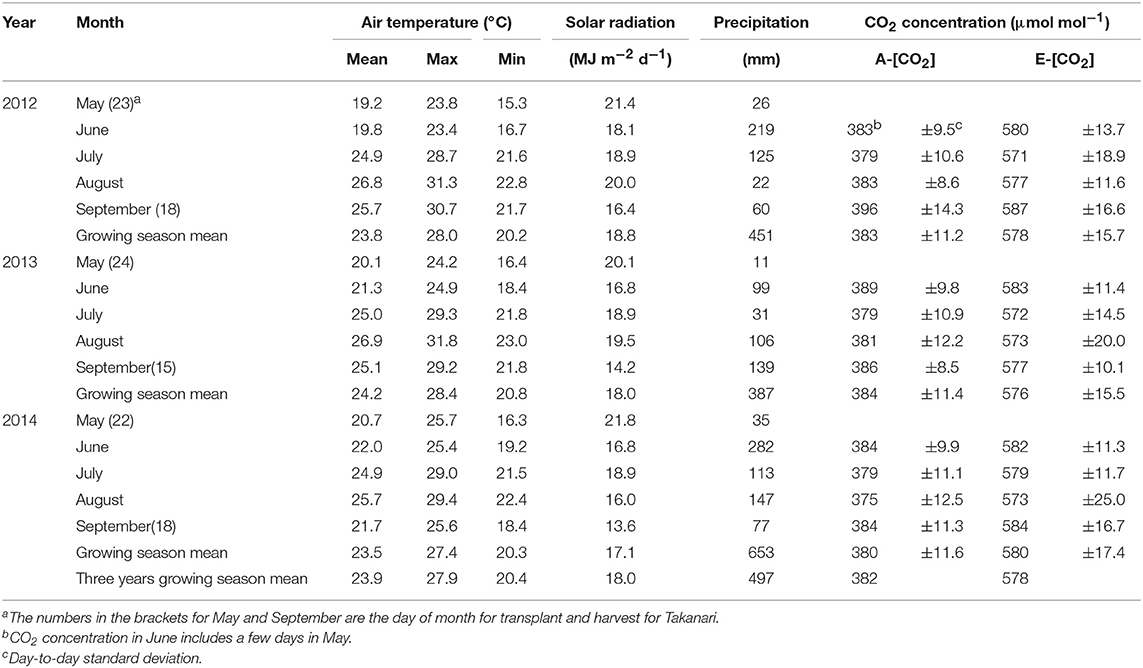
Table 1. Weather conditions and CO2 control during the three growing seasons at the Tsukuba FACE site.
Treatments and Experimental Design
CO2 Treatment
We used four farmers' fields for the CO2 treatments, each of which had two octagonal plots that were of approximately 240 m2 (inner diameter of 17 m) in size; one for E-[CO2] and the other for ambient [CO2] (A-[CO2]) as the control plot, which were approximately 70 m apart to avoid contamination of the fumigated CO2 in the A-[CO2] plots. In the E-[CO2] plots, polyethylene emission tubes were installed horizontally on the peripheries of the octagonal plots. [CO2] was continuously measured at the center of the plots in both E-[CO2] and A-[CO2] plots with infrared gas analyzers (LI-820; LI-COR, Lincoln, NE, USA). We checked the quality of liquid CO2 supplied from the company (NIPPON EKITAN Corporation, Tokyo, Japan) every time it was delivered and confirmed that the concentration of ethylene was below the detectable level of 10 nmol mol−1. The emission tubes on each side were controlled independently with electric pneumatic regulators (ITV2031; SMC Corporation, Tokyo, Japan). Pure CO2 was fumigated in principle from three windward sides to keep [CO2] at the center of the plots, 200 μmol mol−1 above that in A-[CO2]. The accuracy and level of [CO2] were similar across the 3 years, and [CO2] in E-[CO2] was elevated by an average of 194, 192, and 195 μmol mol−1 in 2012, 2013, and 2014, respectively, which were slightly but consistently lower than the target elevation of 200 μmol mol−1 (Table 1).
Fertilizer Application, N Treatment, and Soil N Measurements
Nitrogen fertilizer treatment was similar to that reported by (Oikawa et al., 2017). Briefly, all plots received equal amounts of phosphorous (P) and potassium (K) as a PK compound fertilizer at 4.36 g m−2 of P and 8.30 g m−2 of K prior to flooding. After flooding and puddling (tillage practice with standing water), we placed 35 cm-wide PVC corrugate boarding horizontally to a depth of approximately 15 cm below the soil surface to separate three N fertilizer subplots in each CO2 main plot at 0, 8, and 12 g m−2 (hereafter 0, 8, and 12 N). In the 8 and 12 N plots, we then applied three forms of N as follows: urea and two types of coated urea 5 or 6 days prior to transplanting. The two types of coated urea were LP100 and LP140 (JCAM Agri. Co. Ltd., Tokyo, Japan) in 2012, and LP100 and LP40 (JCAM Agri. Co. Ltd.) in 2013 and 2014. The proportion of urea and LP100 in the total N applied was 25 and 50%, respectively. The remainder (25%) was applied as either LP140 (2012) or LP40 (2013 and 2014). No N fertilizer was applied to the 0N plot. The size of each treatment plot differed year-to-year, but was >15 m2 to accommodate at least two cultivars (see section Plant materials and cultivation methods). Each plot was puddled again for uniformity of fertilizer within each treatment.
In 2012, we collected soil samples from 0 to10 cm of the soil surface at transplanting. After passing the samples through a 2-mm sieve, we extracted exchangeable ammonium in a 1 M KCl solution. Ammonium N was determined in the filtered solution by the indophenol colorimetric method. We also conducted field soil incubation to estimate N supply in the soil in 2012. Before flooding in late April, we took soil samples from the plow layer of 8 N plots and passed them through a 2-mm sieve without air-drying. We then put the sieved unfertilized wet soil (10 g on the dry weight basis) into a 120-ml vial and added distilled water to make up the total amount of water including soil water to 20 ml. We sealed the vials after purging the headspace of the vial with N2 gas. The vials were then wrapped with aluminum foil to keep the contents dark and placed in the 8 N plot during the flooding period until late August. At harvest, we measured the exchangeable ammonium N. By subtracting the initial ammonium N at transplanting, we estimated N mineralized during the growing season.
Plant Materials and Cultivation Methods
We used a high-yielding indica cultivar, Takanari, and a standard japonica cultivar, Koshihikari. Pregerminated seed of the two cultivars were sown in seedling trays (Minoru Pot 448, Minoru Industrial Co. Ltd. Okayama, Japan) filled with sterilized soil. The seedlings were raised in the puddled open field for approximately 4 weeks, with a tunnel cloche or floating mulch for the first 2 weeks. In each CO2 and N treatment plots, we manually transplanted these seedlings in late May at a spacing of 30 × 15 cm (22.2 hills m−2, 3 seedlings per hill). Dates of sowing and transplanting each year are provided in Table 2. The size of each cultivar in each N treatment varied but was >3 m2. The field was kept flooded until late August until the surface water was withdrawn for harvesting. The depth of the surface water was 5–10 cm. Herbicide, pesticide, and fungicide were applied as described previously (Hasegawa et al., 2013). In mid-July, just before the stem-elongation phase, we installed plant support netting made of polyethylene, with an aperture size of 30 cm, to prevent plants from lodging.
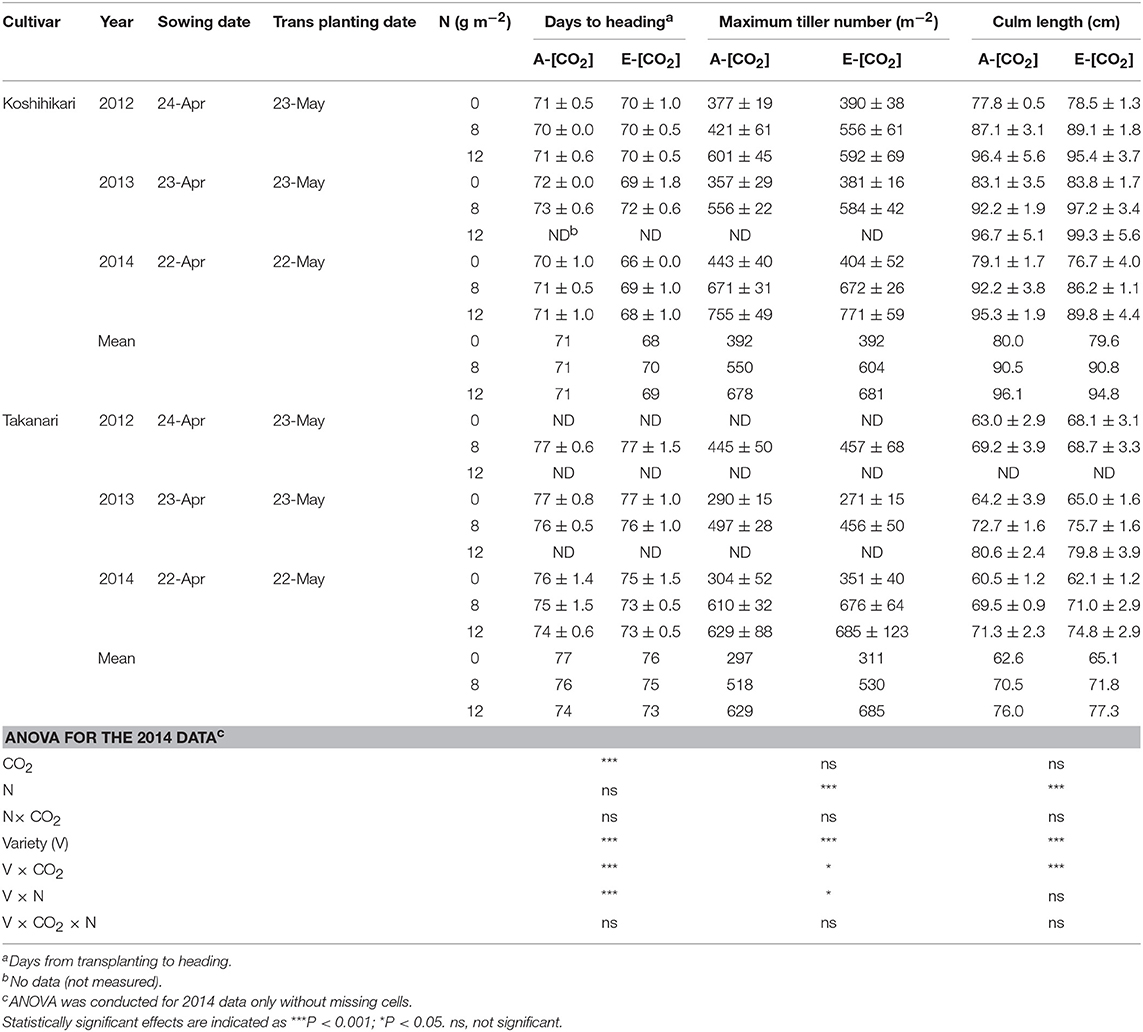
Table 2. The effects of two levels of [CO2] and three levels of nitrogen on heading date, maximum tiller number, and culm length ± standard deviation (n = 4) of Koshihikari and Takanari tested at Tsukuba FACE for three growing seasons.
Growth, Yield, and Quality Measurements
We measured the number of tillers of six hills in each treatment in each block every week from 2 weeks after transplanting until the heading stage and the maximum tiller number was determined as the largest number of tillers observed in these measurements. Culm length was measured for three hills in each plot by measuring the length from the shoot base to the panicle neck node. Panicle emergence was recorded every 2 to 3 days and the heading date was determined as the date when the number of emerged panicles reached 50% of the total productive stems in each treatment. We made all these measurements for 8 N in all years; however, we did not consistently collect all the data for 0 or 12N for all years, which are indicated as ‘ND' (i.e., no data) in Table 2.
At harvest, 18–21 hills from an area of 0.81–0.95 m2 in the middle of each plot were collected and air-dried under the rain shelter. We measured yield and yield components following the method described by Hasegawa et al. (2013). Briefly, we first measured air-dried aboveground biomass and moisture content for both grains and straws to estimate dry biomass at harvest. We counted the number of panicles and threshed spikelets to determine spikelet number and grain weight. A subsample of the unhulled spikelets were soaked in an ammonium sulfate solution with a specific gravity of 1.06 to determine the number of filled (sunken) or unfilled (floated) spikelets. Another subsample of spikelets were dehulled and the brown rice yield was determined. The yield was expressed on the 15% moisture content basis.
We also measured grain appearance quality using a subsample of 50 g of the unsieved brown rice with a grain quality inspector (RGH120A; Satake Corp., Hiroshima, Japan) equipped with image analysis software. The inspector classified each grain into such categories as undamaged, cracked, and chalked grains of different types depending on the position of chalk appearance on the grain. Because E-[CO2] is known to decrease the appearance quality of various cultivars via increased percentage of CG (Usui et al., 2014, 2016), we tested the effects of CO2, N, and varieties on the percentages of undamaged grains (UDG) and CG (sum of white belly, basal white, and milky white grains).
In addition to the 18–21 hills for yield determination, we collected 4–6 hills at the heading and maturity stages, which were separated by organs and oven-dried at 80°C to determine dry weights. The dried samples were ground and used for tissue N concentration measurements with an NC analyzer (Sumigraph NC-22F, Sumika Chemical Analysis Service, Tokyo, Japan). We did not measure panicle N concentration (PNC) of Takanari in 12N in 2012 and 2013 or appearance quality in 2012.
Experimental Design and Statistical Analysis
The experimental plots were laid out in a split-split plot design with CO2 as the main plot, N as the split plot, and cultivar as the split-split plot with four replicates. Analysis of variance (ANOVA) for the year, CO2, N, and cultivar effects was conducted with the statistical package R, version 3.3.3, using a split-split-split procedure described by de Mendiburu (2017). For the traits with missing cells, we performed ANOVA only for the years when full datasets were available.
Results
Soil N, Growth, and Development
Soil exchangeable ammonium N (EAN) at transplanting in the 0N plot in 2012 was 1.53± 0.32 and 1.59 ± 0.28 g m−2 in A-[CO2] and E-[CO2], respectively. Soil N mineralized during the flooding period in 2012 was 5–6 times greater than the initial EAN and not significantly different between the CO2 treatments: 8.25± 0.73 g m−2 in A-[CO2] and 10.0 ± 1.45 g m−2 in E-[CO2].
Days to heading (DTH) were on average approximately 5 days longer for Takanari than for Koshihikari (P < 0.001, Variety main effect, Table 2). Elevated [CO2] decreased DTH significantly by 1–3 days (P < 0.001), which was similar to previous observations in other rice FACE experiments (Hasegawa et al., 2016); however, the effect differed between the two varieties with a significant interaction between CO2 and variety (P < 0.001). DTH was decreased by as much as 4 days in Koshihikari but only by 1–2 days in Takanari. Maximum tiller number (MTN) also differed significantly between the two cultivars with Koshihikari having approximately 10% greater MTN than did Takanari (P < 0.001, Table 2). The effect of E-[CO2] on MTN was not apparent in Koshihikari but was positive in Takanari, which resulted in a significant Variety × CO2 interaction (P < 0.05).
Culm length at harvest was much longer in Koshihikari than in Takanari by as much as 20 cm (P < 0.001). The ANOVA result for culm length only showed a strong interaction between CO2 and cultivar for the 2014 data, where culm length of Koshihikari was decreased by E-[CO2] but that of Takanari was increased (Variety × CO2, P < 0.001, Table 2). This strong interaction was not observed in other years. The effect of N was significantly positive for MTN and culm length. DTH and MTN showed a significant variety × N interaction.
Yield and Yield Components
Elevated [CO2] increased paddy (unhulled grain) yield by 78 g m−2 (9.3%) and aboveground dry mass by 139 g m−2 (10.0%) when averaged over years, N, and cultivars (P < 0.001, Table 3). In all treatments, Takanari had a significantly greater paddy yield than did Koshihikari (P < 0.001, Variety main effect) and the difference was greater in E-[CO2] (P < 0.001, Variety × CO2). The greatest yield enhancement of paddy yield by E-[CO2] was observed in Takanari in the 0 N plot (18.0% averaged over 3 years, Table 3), and the smallest enhancement was in Koshihikari in the same 0N plot, resulting in a significant CO2 × N × Variety interaction (0% averaged over 3 years, P = 0.080). The enhancement of aboveground dry mass by E-[CO2] was higher in Takanari than in Koshihikari (P < 0.05, CO2 × Variety) similarly across N treatments with no significant three-way interaction. The harvest index (HI) of Takanari was much greater than that of Koshihikari by as much as 9 points on average and was not affected by [CO2] or N applications (Table 3). In contrast, the HI of Koshihikari was decreased by E-[CO2] particularly in the 0N plot by 3 points. This resulted in a significant three-way interaction effect (CO2 × N × Variety) on HI (P < 0.05).
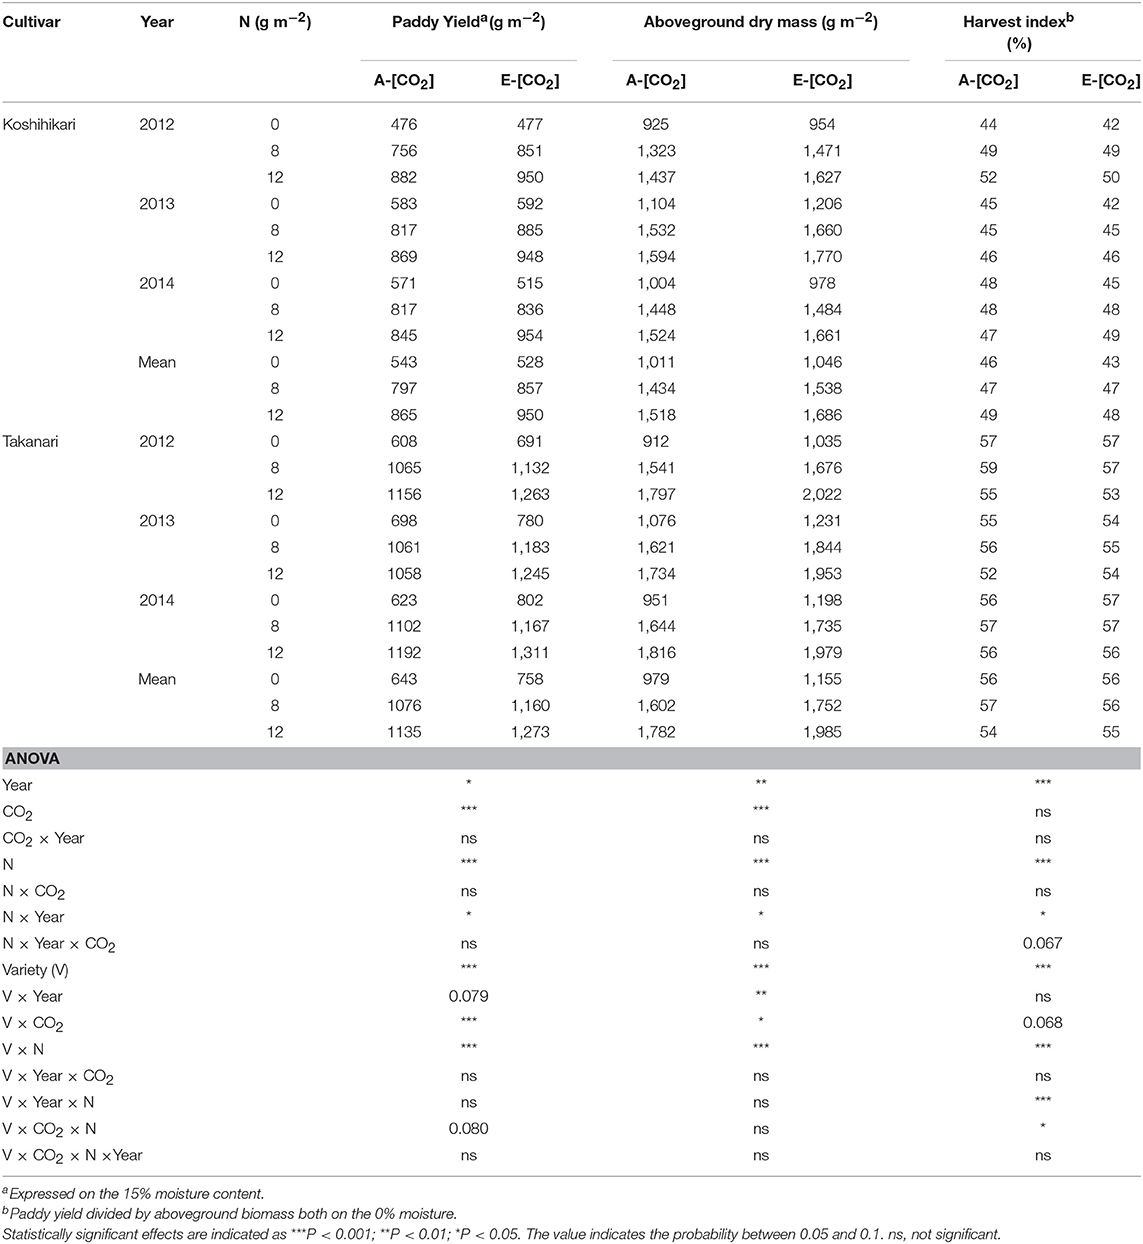
Table 3. The effects of two levels of [CO2] and three levels of nitrogen on paddy yield, aboveground biomass, and harvest index of Koshihikari and Takanari tested at Tsukuba FACE for three growing seasons.
The response of hulled grain (brown rice) yield to CO2 and N was similar to that of paddy yield (Table 4). Takanari had a greater brown rice yield in E-[CO2] than Koshihikari and the enhancement by E-[CO2] was particularly high in the 0N plot (CO2 × Variety × N, P = 0.057). Elevated [CO2] increased sink-related yield components such as panicle density, spikelet per panicle, and spikelet density (CO2 main effect, P = 0.098, < 0.05 and < 0.01, respectively); however, the effects of E-[CO2] on spikelet per panicle and spikelet density was different between cultivars (CO2 × Variety, P < 0.05). These yield components were increased by E-[CO2] by 9 and 11%, respectively, in Takanari; however, virtually no increase was found in Koshihikari. High N application did not moderate the response of these yield components to E-[CO2]. In contrast, a significant three-way interaction was observed in the percentage of ripened spikelets (P < 0.05).
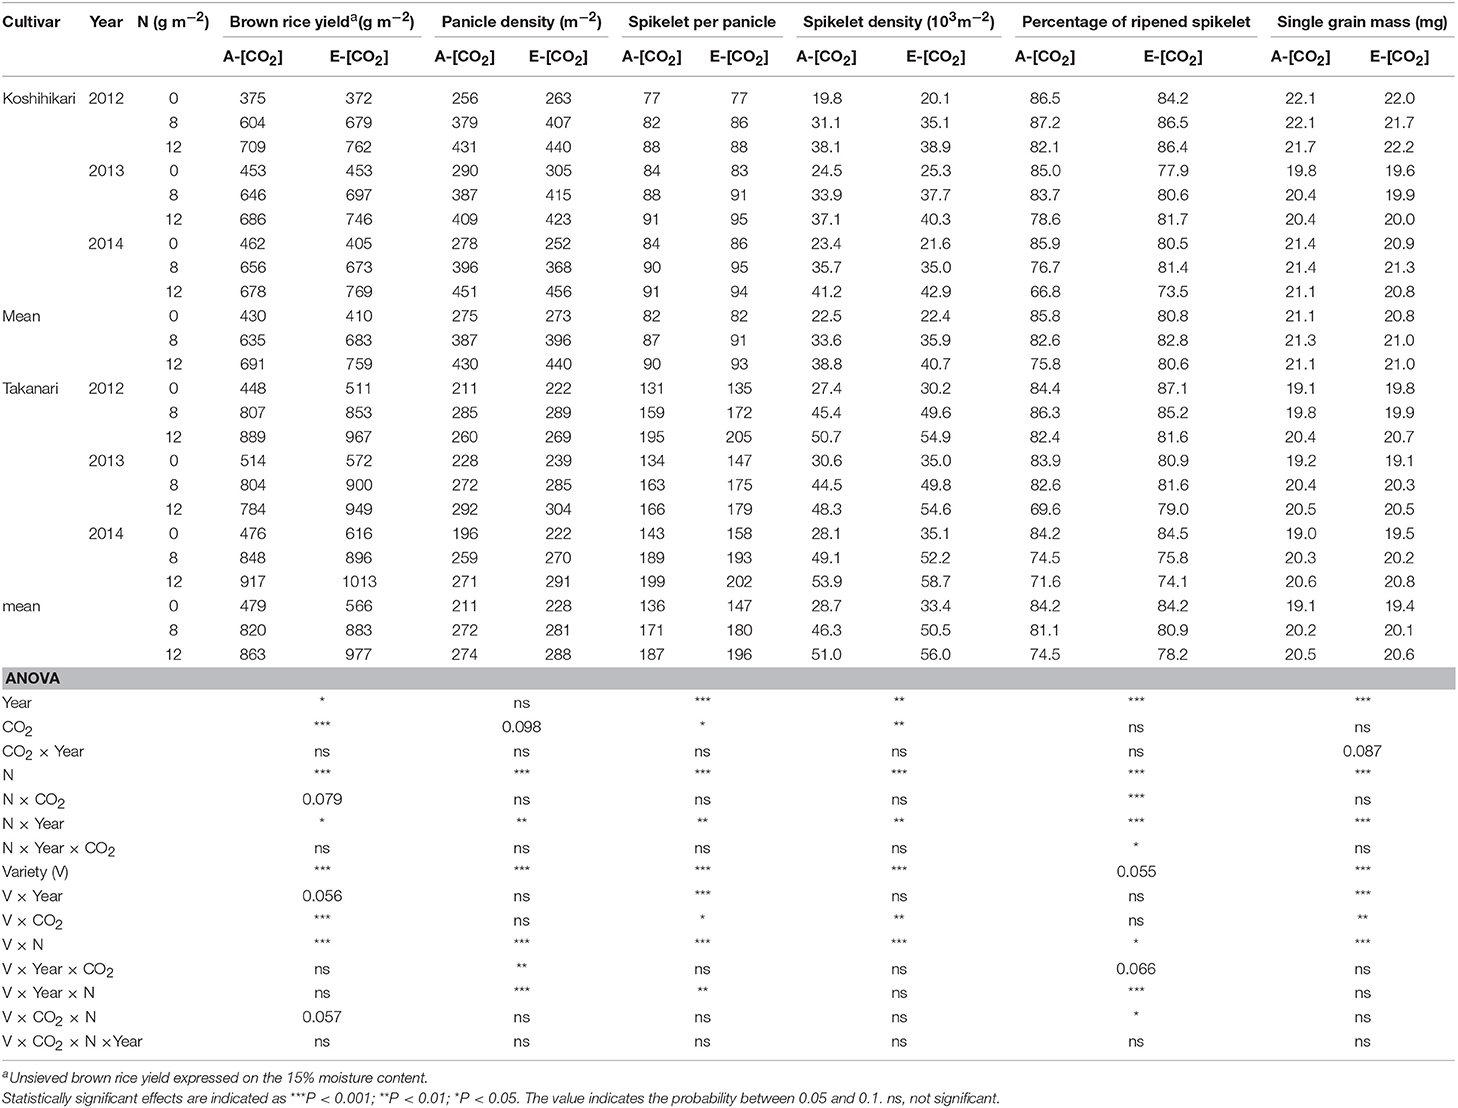
Table 4. The effects of two levels of [CO2] and three levels of nitrogen treatment on yield and yield components of Koshihikari and Takanari tested at Tsukuba FACE for three growing seasons.
Relationship Between N Uptake and Yield Components
The yield enhancement of Koshihikari by E-[CO2] was substantially decreased by the limited N supply because HI decreased with a decrease in N supply significantly in E-[CO2]. In contrast, the HI of Takanari remained unchanged across the different N and CO2 treatments, which resulted in a significant difference in the CO2 × N response between the two cultivars. To explore the reason for this difference, we examined the relationship between HI and the sink-related traits. Spikelet number per unit aboveground biomass of Koshihikari was significantly smaller than that of Takanari (Figure 1, Table S1, Variety main effect, P < 0.01) and decreased under the reduced supply of N, particularly in E-[CO2]; however, that of Takanari was unchanged by the N conditions, resulting in a significant Variety × N interaction (P < 0.001). The HI was significantly correlated with the spikelet number per biomass (Figure 2A, P < 0.001); however, it was not correlated with the percentage of ripened spikelets (Figure 2B).
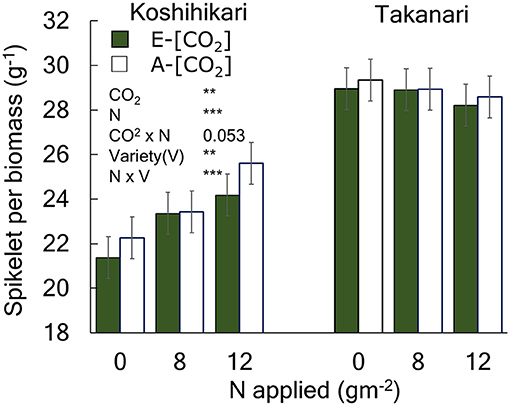
Figure 1. The effects of N and [CO2] on the spikelet number per unit aboveground biomass of Koshihikari and Takanari. The 3-year averages and a summary of ANOVA results with significant treatment and variety effects are shown in this figure. All data and the ANOVA results are provided in Table S2. *** and ** indicate significant differences at P = 0.001 and 0.01, respectively. The value indicates the probability between 0.05 and 0.1. Vertical bars are the standard errors of the residual of the ANOVA.
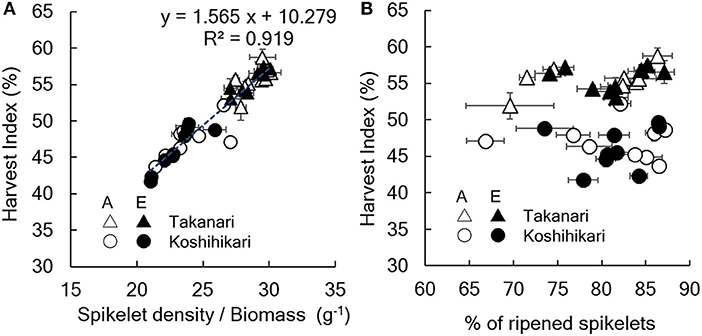
Figure 2. Relationship between harvest index and (A) spikelet number/aboveground biomass or (B) % of ripened spikelets. A, A-[CO2] = ambient [CO2]; E, E-[CO2] = elevated [CO2]. Vertical or horizontal bars are the standard errors of the mean in each year.
Aboveground crop N (ACN) increased with N supply (Figure 3, Table S1, N main effect, P < 0.001). Takanari had a greater ACN than Koshihikari at all N levels (Variety main effect, P < 0.01). The effect of E-[CO2] on ACN differed between cultivars; E-[CO2] did not affect ACN of Koshihikari but increased that of Takanari at all N levels, as indicated by a significant Variety × CO2 interaction (P < 0.01).
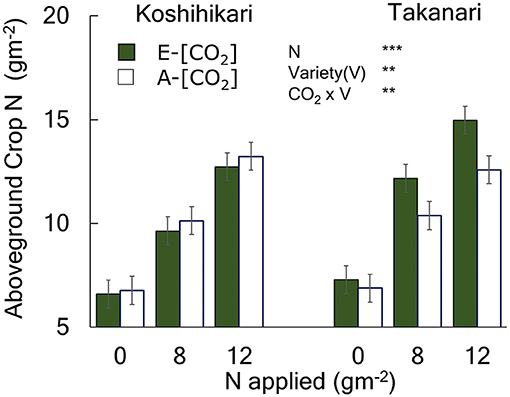
Figure 3. The effects of N and [CO2] on the aboveground crop N of Koshihikari and Takanari measured at maturity. The 2014 data with full data sets without missing cells are presented with a summary of ANOVA results with significant effects. All available data are presented in Table S2 along with a summary of ANOVA using 0 and 8N over the 3-year period which agreed with that in 2014 without significant interactions with year. *** and ** indicate significant differences at P = 0.001 and 0.01, respectively. Vertical bars are the standard errors of the residual of the ANOVA.
We observed a close relationship between spikelet density and ACN at heading and harvest; however, the relationship was clearly cultivar-dependent (Figure 4), with Takanari having a substantially greater spikelet production capacity per unit N uptake than Koshihikari. For each cultivar, the spikelet density-crop N relationship was consistent across the different [CO2] treatments. In contrast, spikelet density of Takanari increased in response to E-[CO2] by increasing ACN even under N-limited conditions.
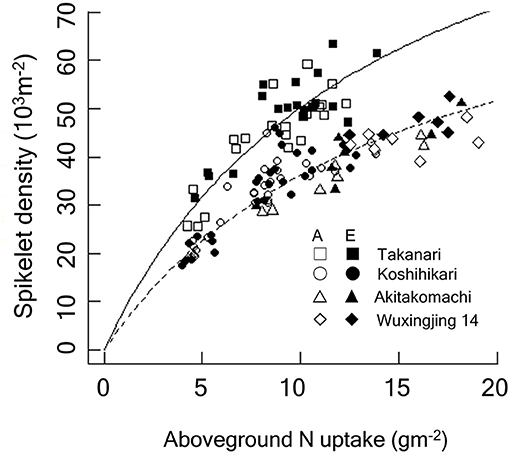
Figure 4. Relationship between spikelet density and crop N accumulated by the heading stage of Koshihikari and Takanari grown at the Tsukuba FACE for 3 years (2012–2014). Additionally, data from the Shizukuishi FACE, Iwate, Japan (“Akitakomachi”) and from the Wuxi FACE, Jiangsu, China (“Wuxianjing 14”) are shown (Kim et al., 2003; Yang et al., 2006). A linearized form of the Michaelis-Menten type rectangular hyperbola function was fitted to the data by the ordinary least square method. The regression lines were significantly different between Koshihikari and Takanari (P < 0.001) and between Takanari and the rest (P < 0.001). A, A-[CO2]; E, E-[CO2]. In the figure, regressions reconverted to the original form are shown: Solid, Takanari, y = 120.5x/(13.98 + x), R2 = 0.804, P < 0.001; Dashed, the rest, y = 90.11x/(14.89 + x), R2 = 0.876, P < 0.001.
Panicle N Concentration and Grain Appearance Quality
Panicle N concentration (PNC) increased with N supply (P < 0.001, Table 5); however, PNC was generally higher in Koshihikari than in Takanari (P < 0.001). For PNC, the ANOVA was based on the 2014 data only because of missing observations in the other 2 years. E-[CO2] decreased the PNC in most treatments; however, this decrease was larger in Koshihikari than that in Takanari (Variety × CO2, P < 0.01). Elevated [CO2] reduced the percentage of UDG severely, mainly owing to the increased CG (P < 0.001, Table 5). The two cultivars also showed a contrasting response to E-[CO2] for UDG and CG (CO2 × Variety, P < 0.001, Table 5). The decrease in UDG by E-[CO2] averaged 13.9 points for Koshihikari and 3.1 points for Takanari (Table 5), although UDG of Takanari was generally poor because of the high percentage of malformed grains across different CO2, N and years (data not shown). The decreases in UDG were mostly accounted for by the increases in CG (96%), which was mainly caused by the occurrence of white-base type CG (71% for Koshihikari and 33% for Takanari, Table S2). Nitrogen application significantly increased UDG and decreased CG (P < 0.001); however, the dependence on N application was larger in Koshihikari than in Takanari (Variety × N, P < 0.001, Table 5). Koshihikari had the poorest appearance quality in the 0 N plot, whereas Takanari showed the best appearance in the 0 N plot.
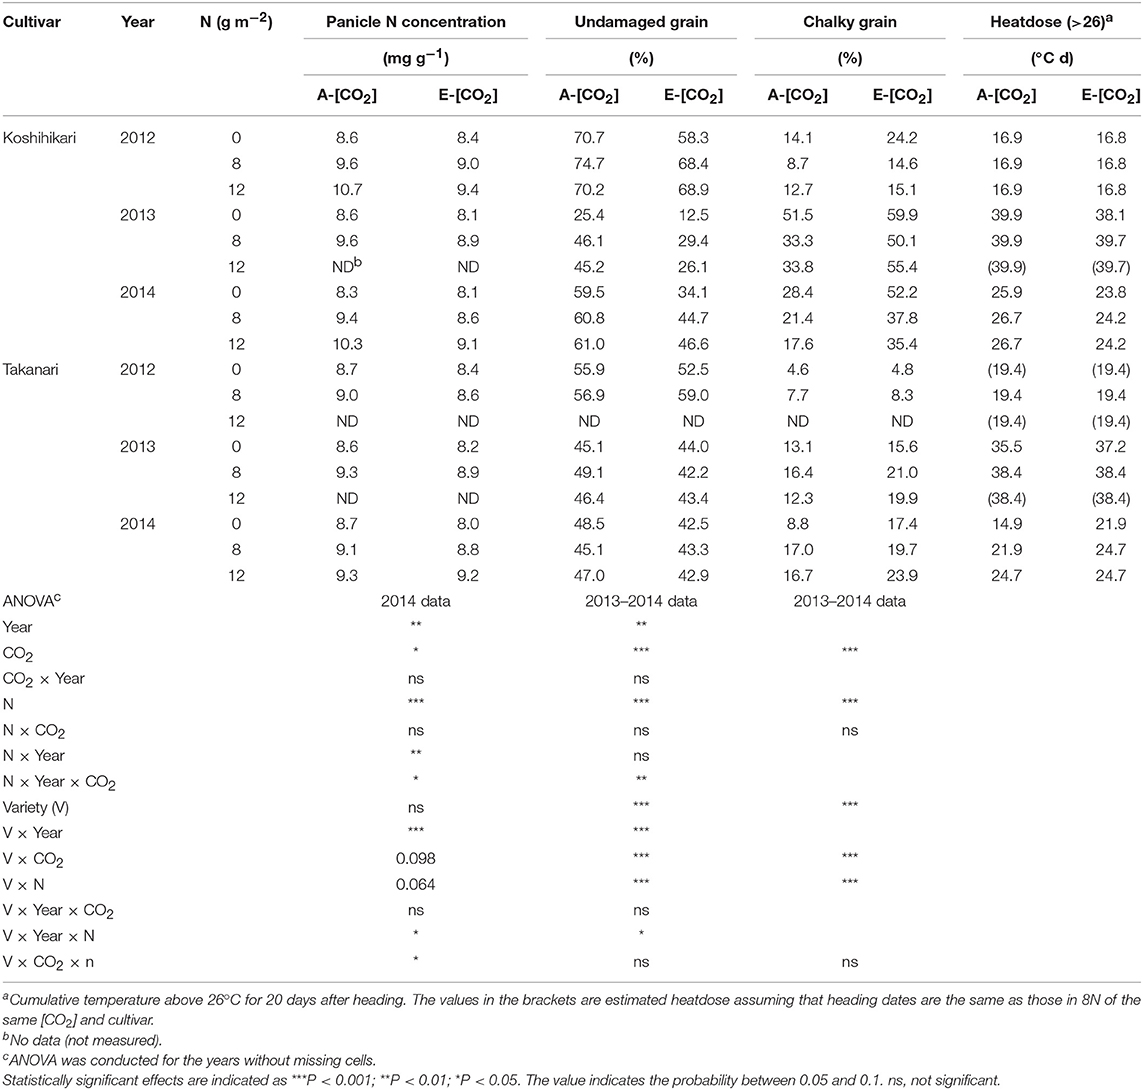
Table 5. The effects of two levels of [CO2] and three levels of nitrogen treatment on panicle N concentration, % of undamaged grains, and chalky grains of Koshihikari and Takanari tested at Tsukuba FACE for three growing seasons.
There was a significant year effect on both UDG and CG with the 2013 crop showing the poorest appearance quality (lowest UDG and highest CG) among the 3 years (P < 0.001, Table 5). The large year-to-year variations in UDG and CG were closely associated with the cumulative temperature above 26°C for 20 days after heading (early grain filling period), which was highest around 40°C d in 2013 and lowest around 17–19°C d in 2012 (Table 5). The effect of N on UDG and CG was largest in 2013 when the quality loss was largest in A-[CO2]. However, in E-[CO2], CG exceeded 50% in all three N treatments in Koshihikari. The differences in UDG and CG between the two cultivars were noted in 2013 (Variety × Year × N, P < 0.05), where CG of Koshihikari was larger than that of Takanari by as much as 40 points in the 0 N plot.
These significant interactions for the grain quality related traits are summarized in Figure 5. CG of Koshihikari varied significantly among years but significant negative relationships were observed within each year (Figure 5A). The regression lines were statistically different between A-[CO2] and E-[CO2] except for in 2013, suggesting that the reduction in PNC was not enough to fully explain the variation in CG due to different [CO2]. In contrast, CG of Takanari varied little among years and no negative relationship was observed with PNC, with a slightly positive relationship observed on one occasion (E-[CO2] in 2014, Figure 5B).
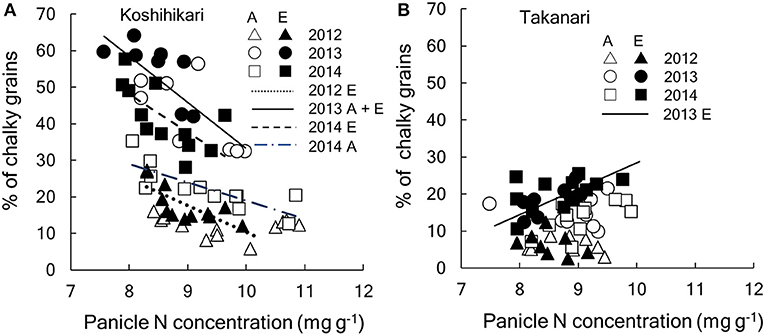
Figure 5. Relationship between percentage of chalky grains and panicle N concentration of (A) Koshihikari and (B) Takanari cultivars. Regressions lines were tested between A-[CO2] and E-[CO2] each year. In the figure, regression that are significant are drawn. If the [CO2] effect is significant, separate lines are drawn for each [CO2] and, if not, a common line is drawn. (A) Koshihikari, dotted, y = −7.32x + 83.5 for E-[CO2] in 2012 (R2 = 0.519, P < 0.01); solid, y = −12.6x + 159.3 for A- and E-[CO2] in 2013 (R2 = 0.580, P < 0.001);dot-dash y = −5.0x + 69.1 for A-[CO2] in 2014 (R2 = 0.613, P < 0.01); dashed, y = 10.3x + 130.3 for E-[CO2] in 2014 (R2 = 0.419, P < 0.05): (B) Takanari, y = 7.0x−41.4 (R2 = 0.474, P < 0.05). A, A-[CO2]; E, E-[CO2].
Discussion
CO2 Fertilization Effects Influenced by N and Cultivars
The limitation of CO2 fertilization effects as a result of limited N availability has long been known at the leaf physiological level or crop production level (Stitt and Krapp, 1999; Kimball et al., 2002). The present study has shown that the N-limited CO2 fertilization effect does not hold for Takanari, a high-yielding indica cultivar. Our 3-year FACE experiments with three N levels confirmed that yield enhancement of Koshihikari, a standard japonica rice cultivar, by E-[CO2] was limited by the soil N availability. The 3-year average yield enhancement of Koshihikari was 0%, whereas that in the standard and high levels of N was 10% (Table 3). We also confirmed that the N limited CO2 fertilization effect on grain yield was mainly via reduced biomass allocation to the grains (i.e., HI) rather than limited biomass increase at E-[CO2] as was found in previous rice FACE experiments (Kim et al., 2003; Kobayashi et al., 2006; Zhang et al., 2013). Ample evidence exists that the biomass response to E-[CO2] is limited by soil N availability in various plant species (Reich and Hobbie, 2012; Feng et al., 2015), which are in agreement with the physiological observations that the enhancement of leaf photosynthesis or canopy light use efficiency was decreased owing to poor N status of the leaves (Nakano et al., 1997; Sakai et al., 2006). In the present study, a relatively large amount of N was taken up by the crops even when no N fertilizer was applied, averaging 6.6 g m−2 for 100–110 days. This is similar to the typical rice paddy soil fertility in Japan (Toriyama, 2002) and the present N limitation might not have been so severe as to limit biomass enhancement in the E-[CO2] treatment.
The HI of Koshihikari was decreased by E-[CO2] under N-limited conditions because of the sink limitation. Elevated [CO2] increased biomass even in the N-limited condition; however, it did not increase spikelet number, and thereby reduced the sink: biomass ratio (Figures 1, 2A). This sink limitation did not occur in Takanari even without N application. Consequently, Takanari had a significant yield increase of 18% by E-[CO2] in the 0 N plot averaged over 3 years, whereas Koshihikari had virtually no increase in yield.
The major determinant of spikelet density is crop N uptake (Wada, 1969). We also confirmed the close positive association between crop N at the heading stage and spikelet number. In Figure 4, we included data from previous FACE experiments conducted in Shizukuishi, Japan and in Wuxi, China with 3 N levels over 3 years (Kim et al., 2003; Yang et al., 2006), both of which used japonica cultivars: Akitakomachi in Shizukuishi and Wuxianjing 14 in Wuxi. Spikelet density of the three japonica-type cultivars fell on the same response function to crop N uptake regardless of the [CO2] or N treatments, suggesting a strong limitation of spikelet production by crop N availability. The spikelet density of Takanari was also dependent on N but was consistently greater than that of Koshihikari at the same crop N for the entire range of crop N. Takanari is known for its high N use efficiency (Taylaran et al., 2009), and this characteristics was maintained in E-[CO2].
The large spikelet density of Takanari apparently resulted from a larger number of spikelets per panicle rather than from panicle density (Table 4). A previous study revealed that Takanari possess at least two genes that increase spikelet number per panicle: APO1 and GN1a (Takai et al., 2014, 2018). These genes have proven to be effective under E-[CO2] (Nakano et al., 2017). The present study showed that the advantage was retained under the limited N condition.
The greater yield or spikelet response of Takanari to E-[CO2] compared to Koshihikari resulted from the enhanced crop N uptake even without N fertilizer application (Figure 3). Initially, we hypothesized that the advantage of high-yielding Takanari in response to E-[CO2] over Koshihikari was pronounced with greater N supply because a limited availability of N would not meet the high N demand by Takanari. However, this hypothesis was not supported by our results; crop N uptake of Takanari was enhanced by E-[CO2] even in the 0N plot, which in turn increased spikelet density (Figure 4), whereas that of Koshihikari was not. The source of additional N uptake by E-[CO2] for Takanari in the 0 N plot could not be identified in the present study. In an earlier study (Taylaran et al., 2009), showed that Takanari had significantly greater root length density than japonica cultivars, which might help to absorb N in the N-depleted soil. We speculate that E-[CO2] could enhance the ability of Takanari to collect N from the subsoil. However, there is a concern about the long-term sustainability of the soil N supplying capacity if Takanari-type cultivars are repeatedly grown, although there is limited evidence that long-term CO2 fumigation increases soil C and N accumulation (Guo et al., 2015). However, at least for the 3 years tested in the present study, the advantage of Takanari over Koshihikari was consistently evident.
There has been only limited evidence that E-[CO2] affects N2 fixation in the paddy (Hayashi et al., 2016); however, one previous study showed increased biological N2 fixation activity by E-[CO2] (Hoque et al., 2001). Free-living N2 fixation was not affected by E-[CO2] (Hayashi et al., 2014); however, there is a possibility that associative N2 fixation might be enhanced by E-[CO2]. Nitrification and denitrification processes are a large source of N loss in the paddy soil (Ishii et al., 2011; Bloom, 2015). There is growing evidence that genotypic difference in N use efficiency is related to the capacity to utilize or transport nitrate in the rhizosphere (Li et al., 2008; Hu et al., 2015) or to inhibit nitrification (Sun et al., 2016). Because we did not measure root morphology or rhizosphere chemistry of the two cultivars, we cannot discuss the relevance of the varietal difference in the N use efficiency in E-[CO2] observed in our results, but this is an important subject in the future. The long-term response of the soil-plant system to E-[CO2] is complex and uncertain (Reich and Hobbie, 2012; Reich et al., 2018). Better understandings of soil-plant dynamics that are affected by climatic and genetic factors are key to the effective development of long-term sustainable cultivars and management practices under climate change.
Grain Quality Degradation and Quality Related Responses
Grain appearance quality of Koshihikari was substantially decreased by E-[CO2] by the increased occurrence of CG and quality degradation was particularly noted under the N limited condition (Table 5). The percentage of CG was higher in warmer years, suggesting that the quality degradation by E-[CO2] was similar to that frequently observed under heat during the grain filling period (Usui et al., 2016). Previous studies have shown that, under heat, the starch granules of endosperm cells become loosely packed and the air spaces between the granules create chalky appearances (Morita et al., 2016). It has been commonly observed that reduced N or protein content of the grain increases heat-induced CG (Morita et al., 2005; Wakamatsu et al., 2008), in particular, white-base and white-back type CG, which accounted for a majority (71 %) of the variation in the total CG observed in Koshihikari (Table S2). CG increased significantly with a decrease in PNC (Figure 5A). PNC was decreased not only by reduced N fertilization but also by E-[CO2], which has been commonly observed in many cereal crops (Myers et al., 2014). Consequently, the highest occurrence of CG was observed in the E-[CO2] and 0 N plot in the hottest summer in 2013 (Table 5). Elevated [CO2] increased CG partly via the reduced PNC; however, as shown in the relation between CG and PNC (Figure 5), the CG-PNC relation was significantly different between E-[CO2] and A-[CO2]. CG of E-[CO2] was larger than that of A-[CO2] at the same PNC, suggesting that other factors are involved in the increase in CG by E-[CO2].
Previous studies showed that E-[CO2] increased panicle temperature as a result of decreased leaf stomatal conductance and transpirational cooling by E-[CO2]; a typical increase in daytime panicle temperature was around 0.3–0.5°C (Yoshimoto et al., 2005). This might not be negligible for appearance quality when the temperature exceeds the threshold of approximately 26°C (Morita et al., 2016). However, it remains unclear how much panicle temperature and PNC account for the quality degradation under E-[CO2].
In contrast to Koshihikari, Takanari showed consistently low CG in all treatments and years (Table 5) although UDG was generally poor mainly due to malshaped grains. Recently, breeding efforts are in progress to improve appearance quality traits under high temperatures (heat tolerance) and Takanari is known for its resistance to heat for CG occurrence and is currently used as a donor to heat tolerance (Ishimaru et al., 2016). In our previous FACE study, we showed that Takanari retained a good appearance quality under E-[CO2] (Zhang et al., 2015a). Other studies revealed that Takanari had a consistently high stomatal conductance in both E- and A-[CO2] (Chen et al., 2014) and a lower canopy temperature by 0.4°C than Koshihikari (Ikawa et al., 2018). Therefore, the difference in canopy or panicle temperature between the two cultivars might partially account for the difference in CG.
The present study showed that CG of Takanari did not reveal any decrease in grain appearance quality or increase in CG under N limited conditions (Figure 5B). PNC of Takanari was decreased by E-[CO2] (Table 5); however, unlike Koshihikari, this decrease in PNC did not increase CG even during the hot summer. Takanari had a much lower % of white-base CG than Koshihikari (Table S2), which is known to be sensitive to N nutrition (Morita et al., 2005); this reduced the sensitivity of CG to PNC. Increases in heat-induced white-base CG can be decreased by additional N fertilization to retain higher PNC (Morita et al., 2016); however, increases in PNC can have negative effects on eating quality (Okadome, 2005). The low CG of Takanari even under low N conditions is thus a favorable trait to make both appearance and eating quality traits compatible.
Mechanistic understanding of the negative correlation between PNC and CG for standard japonica cultivars is still limited. A recent genetic and molecular study revealed that sucrose synthase 3 (Sus3) derived from an indica cultivar Habataki, a sister variety of Takanari, increases under high temperature, which confers heat tolerance for appearance quality (Takehara et al., 2018). The relevance of sucrose synthase and N availability is unknown; however, lower PNC might reduce this enzyme and possibly exacerbate appearance quality. It is unclear how Habataki Sus3 performs under limited N condition; however, this could be effective even under low N availability. Several other quantitative trait loci for appearance quality have also been identified on chromosomes 3, 5, 8, and 12 (Takeuchi, 2016); however, the functions of these remain unknown. Future studies are required to determine genetic and molecular backgrounds for the CO2 × N × Variety interaction for appearance quality to effectively develop countermeasures against quality degradation under climate change.
Conclusions
Our 3-year FACE experiment combined with three levels of N fertilizers revealed that the CO2 fertilization effect of a standard japonica cultivar, Koshihikari, diminished as N availability decreased, mainly because of sink limitation. However, sink limitation did not occur in Takanari even without N application, resulting in a significant yield enhancement of 18% by E-[CO2] in the 0N plot. Moreover, Takanari showed a consistently low CG in E-[CO2], whereas appearance quality of Koshihikari was severely damaged by E-[CO2], most notably in the 0N plot because of an increased occurrence of CG. These results indicated that Takanari could retain its yield advantage over Koshihikari even under limited N conditions and it could be a useful genetic resource for improving N use efficiency under E-[CO2].
Author Contributions
TH, HS, TT, and KH identified the research question and designed the field experiments. TH, HS, TT, YU, CC, HI, HW, GZ, HfN, and KH conducted the field experiments and determined growth and yield traits. HsN operated the FACE facility and collected environmental data. HS conducted the chemical analysis. MM, TT, and KH conducted soil analysis. TH, HW, and CC conducted the data analysis. TH wrote the manuscript. All commented and approved the manuscript.
Funding
This work was supported in part by the Ministry of Agriculture, Forestry and Fisheries, Japan, through a research project entitled Development of technologies for mitigation and adaptation to climate change in agriculture, forestry, and fisheries, and in part by a Grant-in-Aid for Scientific Research on Innovative Areas (JP24114711, JP26252004, JJP26252061, JP16H06204, 15K18635) by the Japan Society for the Promotion of Science.
Conflict of Interest Statement
The authors declare that the research was conducted in the absence of any commercial or financial relationships that could be construed as a potential conflict of interest.
Acknowledgments
We thank team members of the Tsukuba FACE at the Institute for Agro-Environmental Sciences, NARO, for their help in the field and laboratory measurements.
Supplementary Material
The Supplementary Material for this article can be found online at: https://www.frontiersin.org/articles/10.3389/fpls.2019.00361/full#supplementary-material
References
Bloom, A. J. (2015). The increasing importance of distinguishing among plant nitrogen sources. Curr. Opin. Plant Biol. 25, 10–16. doi: 10.1016/j.pbi.2015.03.002
Cassman, K. G., Dobermann, A., Walters, D. T., and Yang, H. (2003). Meeting cereal demand while protecting natural resources and improving environmental quality. Annu. Rev. Environ. Resour. 28, 315–358. doi: 10.1146/annurev.energy.28.040202.122858
Chen, C. P., Sakai, H., Tokida, T., Usui, Y., Nakamura, H., and Hasegawa, T. (2014). Do the rich always become richer? Characterizing the leaf physiological response of the high-yielding rice cultivar takanari to free-air CO2 enrichment. Plant Cell Physiol. 55, 381–391. doi: 10.1093/pcp/pcu009
de Mendiburu, F. (2017). Statistical Procedures for Agricultural Research. Available online at: https://cran.r-project.org/web/packages/agricolae/agricolae.pdf (accessed March 19, 2019).
Deryng, D., Elliott, J., Folberth, C., Müller, C., Pugh, T. A. M., Boote, K. J., et al. (2016). Regional disparities in the beneficial effects of rising CO2 concentrations on crop water productivity. Nat. Clim. Chang. 6, 1–7. doi: 10.1038/nclimate2995
Evans, L. T. (1993). Crop Evolution, Adaptation and Yield. New York, NY: Cambridge University Press.
Feng, Z., Rütting, T., Pleijel, H., Wallin, G., Reich, P. B., Kammann, C. I., et al. (2015). Constraints to nitrogen acquisition of terrestrial plants under elevated CO2. Glob. Chang. Biol. 21, 3152–3168. doi: 10.1111/gcb.12938
Guo, J., Zhang, M., Wang, X., and Zhang, W. (2015). Elevated CO2 facilitates C and N accumulation in a rice paddy ecosystem. J. Environ. Sci. 29, 27–33. doi: 10.1016/j.jes.2014.05.055
Hasegawa, T., Li, T., Yin, X., Zhu, Y., Boote, K., Baker, J., et al. (2017). Causes of variation among rice models in yield response to CO2 examined with free-air CO2 enrichment and growth chamber experiments. Sci. Rep. 7:14858. doi: 10.1038/s41598-017-13582-y
Hasegawa, T., Sakai, H., Tokida, T., Nakamura, H., Zhu, C., Usui, Y., et al. (2013). Rice cultivar responses to elevated CO2 at two free-air CO2 enrichment (FACE) sites in Japan. Funct. Plant Biol. 40, 148–159. doi: 10.1071/FP12357
Hasegawa, T., Sakai, H., Tokida, T., Usui, Y., Yoshimoto, M., Fukuoka, M., et al. (2016). “Rice free-air carbon dioxide enrichment studies to improve assessment of climate change effects on rice agriculture,” in Improving Modeling Tools to Assess Climate Change Effects on Crop Response, eds J. L. Hatfield and D. Fleisher (Madison, WI: American Society of Agronomy), 45–68. doi: 10.2134/advagricsystmodel7.2014.0015
Hayashi, K., Tokida, T., and Hasegawa, T. (2016). “FACEing up to future uncertainty : free-air CO2 enrichment experiments in Japanese rice paddy ecosystems,” in The Challenges of Agro-Environmental Research in Monsoon Asia, eds K. Yagi and C. G. Kuo (Tsukuba: National Institute for Agro-Environmental Sciences), 93–114.
Hayashi, K., Tokida, T., Matsushima, M. Y., Ono, K., Nakamura, H., and Hasegawa, T. (2014). Free-air CO2 enrichment (FACE) net nitrogen fixation experiment at a paddy soil surface under submerged conditions. Nutr. Cycl. Agroecosystems 98, 57–69. doi: 10.1007/s10705-013-9595-4
Hoque, M., Inubushi, K., Miura, S., Kobayashi, K., Kim, H.-Y., Okada, M., et al. (2001). Biological dinitrogen fixation and soil microbial biomass carbon as influenced by free-air carbon dioxide enrichment (FACE) at three levels of nitrogen fertilization in a paddy field. Biol. Fertil. Soils 34, 453–459. doi: 10.1007/s00374-001-0430-8
Hu, B., Wang, W., Ou, S., Tang, J., Li, H., Che, R., et al. (2015). Variation in NRT1.1B contributes to nitrate-use divergence between rice subspecies. Nat. Genet. 47, 834–838. doi: 10.1038/ng.3337
Iizumi, T., Furuya, J., Shen, Z., Kim, W., Okada, M., Fujimori, S., et al. (2017). Responses of crop yield growth to global temperature and socioeconomic changes. Sci. Rep. 7:7800. doi: 10.1038/s41598-017-08214-4
Ikawa, H., Chen, C. P., Sikma, M., Yoshimoto, M., Sakai, H., Tokida, T., et al. (2018). Increasing canopy photosynthesis in rice can be achieved without a large increase in water use-A model based on free-air CO2 enrichment. Glob. Chang. Biol. 24, 1321–1341. doi: 10.1111/gcb.13981
Imbe, T., Akama, Y., Nakane, A., Hata, T., Ise, K., Ando, I., et al. (2004). Development of a multipurpose high-yielding rice variety “Takanari.” Bull. Natl Inst. Crop Sci. 5, 35–51.
Ishii, S., Ikeda, S., Minamisawa, K., and Senoo, K. (2011). Nitrogen cycling in rice paddy environments: past achievements and future challenges. Microb. Environ. 26, 282–292. doi: 10.1264/jsme2.me11293
Ishimaru, T., Hirabayashi, H., Sasaki, K., Ye, C., and Kobayashi, A. (2016). Breeding efforts to mitigate damage by heat stress to spikelet sterility and grain quality. Plant Prod. Sci. 19, 12–21. doi: 10.1080/1343943X.2015.1128113
Kim, H.-Y., Lieffering, M., Kobayashi, K., Okada, M., Mitchell, M. W., and Gumpertz, M. (2003). Effects of free-air CO2 enrichment and nitrogen supply on the yield of temperate paddy rice crops. Field Crop. Res. 83, 261–270. doi: 10.1016/S0378-4290(03)00076-5
Kimball, B., Kobayashi, K., and Bindi, M. (2002). Responses of agricultural crops to free-air CO2 enrichment. Adv. Agron. 77, 293–368. doi: 10.1016/S0065-2113(02)77017-X
Kimball, B. A. (2016). Crop responses to elevated CO2 and interactions with H2O, N, and temperature. Curr. Opin. Plant Biol. 31, 36–43. doi: 10.1016/j.pbi.2016.03.006
Kobayashi, A., Hori, K., Yamamoto, T., and Yano, M. (2018). Koshihikari: a premium short-grain rice cultivar – its expansion and breeding in Japan. Rice 11:15. doi: 10.1186/s12284-018-0207-4
Kobayashi, K., Okada, M., Kim, H. Y., Lieffering, M., Miura, S., and Hasegawa, T. (2006). “Paddy Rice Responses to Free-Air [CO2] Enrichment,” in Managed Ecosystems and CO2: Case Studies, Processes, and Perspectives, eds J. Nösberger, S. P. Long, R. J. Norby, M. Stitt, G. R. Hendrey, and H. Blum (Berlin; Heidelberg: Springer), 87–104.
Li, Y. L., Fan, X. R., and Shen, Q. R. (2008). The relationship between rhizosphere nitrification and nitrogen-use efficiency in rice plants. Plant Cell Environ. 31, 73–85. doi: 10.1111/j.1365-3040.2007.01737.x
Morita, S., Kusuda, O., Yonemaru, J., Fukushima, A., and Nakano, H. (2005). “Effects of topdressing on grain shape and grain damage under high temperature during ripening of rice,” in Rice Is Life: Scientific Perspectives for the 21st Century, Proceedings of the World Rice Research Conference, Tsukuba, Japan, eds K. Toriyama, K. L. Heong, and B. Hardy (Los Banos: International Rice Research Institute and Japan International Research Center for Agricultural Sciences), 560–562.
Morita, S., Wada, H., and Matsue, Y. (2016). Countermeasures for heat damage in rice grain quality under climate change. Plant Prod. Sci. 19, 1–11. doi: 10.1080/1343943X.2015.1128114
Myers, S. S., Zanobetti, A., Kloog, I., Huybers, P., Leakey, A. D. B., Bloom, A. J., et al. (2014). Increasing CO2 threatens human nutrition. Nature 510, 139–142. doi: 10.1038/nature13179
Nakamura, H., Tokida, T., Yoshimoto, M., Sakai, H., Fukuoka, M., and Hasegawa, T. (2012). Performance of the enlarged Rice-FACE system using pure CO2 installed in Tsukuba, Japan. J. Agric. Meteorol. 68, 15–23. doi: 10.2480/agrmet.68.1.2
Nakano, H., Makino, A., and Mae, T. (1997). The effect of elevated partial pressures of CO2 on the relationship between photosynthetic capacity and N content in rice leaves. Plant Physiol. 115, 191–198.
Nakano, H., Yoshinaga, S., Takai, T., Arai-Sanoh, Y., Kondo, K., Yamamoto, T., et al. (2017). Quantitative trait loci for large sink capacity enhance rice grain yield under free-air CO2 enrichment conditions. Sci. Rep. 7:1827. doi: 10.1038/s41598-017-01690-8
Oikawa, S., Ehara, H., Koyama, M., Hirose, T., Hikosaka, K., Chen, C. P., et al. (2017). Nitrogen resorption in senescing leaf blades of rice exposed to free-air CO2 enrichment (FACE) under different N fertilization levels. Plant Soil 418, 231–240. doi: 10.1007/s11104-017-3280-3
Okadome, H. (2005). Application of instrument-based multiple texture measurement of cooked milled-rice grains to rice quality evaluation. Japan Agric. Res. Q. 39, 261–268. doi: 10.6090/jarq.39.261
Reich, P. B., and Hobbie, S. E. (2012). Decade-long soil nitrogen constraint on the CO2 fertilization of plant biomass. Nat. Clim. Chang. 2, 1–5. doi: 10.1038/nclimate1694
Reich, P. B., Hobbie, S. E., Lee, T. D., and Pastore, M. A. (2018). Unexpected reversal of C3 versus C4 grass response to elevated CO2 during a 20-year field experiment. Science 360, 317–320. doi: 10.1126/SCIENCE.AAS9313
Rosenzweig, C., Elliott, J., Deryng, D., Ruane, A. C., Müller, C., Arneth, A., et al. (2014). Assessing agricultural risks of climate change in the 21st century in a global gridded crop model intercomparison. Proc. Natl. Acad. Sci. U.S.A. 111, 3268–3273. doi: 10.1073/pnas.1222463110
Sakai, H., Hasegawa, T., and Kobayashi, K. (2006). Enhancement of rice canopy carbon gain by elevated CO2 is sensitive to growth stage and leaf nitrogen concentration. New Phytol. 170, 321–332. doi: 10.1111/j.1469-8137.2006.01688.x
Schleussner, C.-F., Deryng, D., Müller, C., Elliott, J., Saeed, F., Folberth, C., et al. (2018). Crop productivity changes in 1.5°C and 2°C worlds under climate sensitivity uncertainty. Environ. Res. Lett. 13:064007. doi: 10.1088/1748-9326/aab63b
Stitt, M., and Krapp, A. (1999). The interaction between elevated carbon dioxide and nitrogen nutrition: the physiological and molecular background. Plant Cell Environ. 22, 583–621. doi: 10.1046/j.1365-3040.1999.00386.x
Sun, L., Lu, Y., Yu, F., Kronzucker, H. J., and Shi, W. (2016). Biological nitrification inhibition by rice root exudates and its relationship with nitrogen-use efficiency. New Phytol. 212, 646–656. doi: 10.1111/nph.14057
Takai, T., Ikka, T., Kondo, K., Nonoue, Y., Ono, N., Arai-Sanoh, Y., et al. (2014). Genetic mechanisms underlying yield potential in the rice high-yielding cultivar Takanari, based on reciprocal chromosome segment substitution lines. BMC Plant Biol. 14:295. doi: 10.1186/s12870-014-0295-2
Takai, T., Nakano, H., Yoshinaga, S., and Kondo, M. (2018). Identification of a novel QTL for the number of spikelets per panicle using a cross between indica- and japonica-type high-yielding rice cultivars in Japan. Plant Breed. 137, 109–117. doi: 10.1111/pbr.12575
Takehara, K., Murata, K., Yamaguchi, T., Yamaguchi, K., Chaya, G., Kido, S., et al. (2018). Thermo-responsive allele of sucrose synthase 3 (Sus3) provides high-temperature tolerance during the ripening stage in rice (Oryza sativa L.). Breed. Sci. 342, 336–342. doi: 10.1270/jsbbs.18007
Takeuchi, Y. (2016). “Development of isogenic lines of Koshihikari with heat tolerant QTLs. -QTLs derived from Takanari and Ma Li Xian,” in Kenkyuseika554 “Development of Mitigation and Adaptation Technologies to Climate Change in the Sectors of Agriculture, Forestry, and Fisheries - Development of Gramineous Crop Cultivars Adapted Global Warming -” (Tokyo: Ministry of Agriculture Forestry and Fisheries), 40–42.
Taylaran, R., Ozawa, S., and Miyamoto, N. (2009). Performance of a high-yielding modern rice cultivar Takanari and several old and new cultivars grown with and without chemical fertilizer in a submerged paddy field. Plant Prod. Sci. 12, 365–380. doi: 10.1626/pps.12.365
Toriyama, K. (2002). Estimation of fertilizer nitrogen requirement for average rice yield in Japanese paddy fields. Soil Sci. Plant Nutr. 48, 293–300. doi: 10.1080/00380768.2002.10409204
Usui, Y., Sakai, H., Tokida, T., Nakamura, H., Nakagawa, H., and Hasegawa, T. (2014). Heat-tolerant rice cultivars retain grain appearance quality under free-air CO2 enrichment. Rice 7:6. doi: 10.1186/s12284-014-0006-5
Usui, Y., Sakai, H., Tokida, T., Nakamura, H., Nakagawa, H., and Hasegawa, T. (2016). Rice grain yield and quality responses to free-air CO2 enrichment combined with soil and water warming. Glob. Chang. Biol. 22, 1256–1270. doi: 10.1111/gcb.13128
Wada, G. (1969). The effect of nitrogen nutrition on the yield-determining process of rice plant. Bull. Natl. Inst. Agric. Sci. Jpn. Ser. A 16, 1–271.
Wakamatsu, K., Sasaki, O., Uezono, I., and Tanaka, A. (2008). Effect of the amount of nitrogen application on occurrence of white-back kernels during ripening of rice under high-temperature conditions. Japanese J. Crop Sci. 77, 424–433. doi: 10.1626/jcs.77.424
Wang, F., and Peng, S. B. (2017). Yield potential and nitrogen use efficiency of China's super rice. J. Integr. Agric. 16, 1000–1008. doi: 10.1016/S2095-3119(16)61561-7
Yang, L., Huang, J., Yang, H., Zhu, J., Liu, H., Dong, G., et al. (2006). The impact of free-air CO2 enrichment (FACE) and N supply on yield formation of rice crops with large panicle. F. Crop. Res. 98, 141–150. doi: 10.1016/j.fcr.2005.12.014
Yang, L., Wang, Y., Dong, G., Gu, H., Huang, J., Zhu, J., et al. (2007). The impact of free-air CO2 enrichment (FACE) and nitrogen supply on grain quality of rice. Field Crop. Res. 102, 128–140. doi: 10.1016/j.fcr.2007.03.006
Yoshimoto, M., Oue, H., and Takahashi, N. (2005). The effects of FACE (Free-Air CO2 Enrichment) on temperatures and transpiration of rice panicles at flowering stage. J. Agric. Meteorol. 60, 597–600. doi: 10.2480/agrmet.597
Zhang, G., Sakai, H., Tokida, T., Usui, Y., Zhu, C., Nakamura, H., et al. (2013). The effects of free-air CO2 enrichment (FACE) on carbon and nitrogen accumulation in grains of rice (Oryza sativa L.). J. Exp. Bot. 64, 3179–3188. doi: 10.1093/jxb/ert154
Zhang, G., Sakai, H., Usui, Y., Tokida, T., Nakamura, H., Zhu, C., et al. (2015a). Grain growth of different rice cultivars under elevated CO2 concentrations affects yield and quality. Field Crop. Res. 179, 72–80. doi: 10.1016/j.fcr.2015.04.006
Zhang, X., Davidson, E. A., Mauzerall, D. L., Searchinger, T. D., Dumas, P., and Shen, Y. (2015b). Managing nitrogen for sustainable development. Nature 528, 51–59. doi: 10.1038/nature15743
Zhao, C., Liu, B., Piao, S., Wang, X., Lobell, D. B., Huang, Y., et al. (2017). Temperature increase reduces global yields of major crops in four independent estimates. Proc. Natl. Acad. Sci. U.S.A. 114, 9326–9331. doi: 10.1073/PNAS.1701762114
Keywords: chalky grains, climate change adaptation, CO2 fertilization effects, FACE, grain appearance quality, grain yield, nitrogen nutrition, Oryza sativa
Citation: Hasegawa T, Sakai H, Tokida T, Usui Y, Nakamura H, Wakatsuki H, Chen CP, Ikawa H, Zhang G, Nakano H, Matsushima MY and Hayashi K (2019) A High-Yielding Rice Cultivar “Takanari” Shows No N Constraints on CO2 Fertilization. Front. Plant Sci. 10:361. doi: 10.3389/fpls.2019.00361
Received: 18 December 2018; Accepted: 08 March 2019;
Published: 05 April 2019.
Edited by:
Scott Alan Heckathorn, University of Toledo, United StatesReviewed by:
Justin M. McGrath, University of Illinois at Urbana-Champaign, United StatesArnold Jeffrey Bloom, University of California, Davis, United States
Copyright © 2019 Hasegawa, Sakai, Tokida, Usui, Nakamura, Wakatsuki, Chen, Ikawa, Zhang, Nakano, Matsushima and Hayashi. This is an open-access article distributed under the terms of the Creative Commons Attribution License (CC BY). The use, distribution or reproduction in other forums is permitted, provided the original author(s) and the copyright owner(s) are credited and that the original publication in this journal is cited, in accordance with accepted academic practice. No use, distribution or reproduction is permitted which does not comply with these terms.
*Correspondence: Toshihiro Hasegawa, dGhhc2VAYWZmcmMuZ28uanA=
 Toshihiro Hasegawa
 Hidemitsu Sakai
 Takeshi Tokida
 Yasuhiro Usui
 Hirofumi Nakamura5
 Hitomi Wakatsuki
 Charles P. Chen
 Hiroki Ikawa
 Hiroshi Nakano