 Matheus T. Kuska
 Jan Behmann1*†
 Dominik K. Großkinsky
 Thomas Roitsch
- 1Institute for Crop Science and Resource Conservation-Plant Diseases and Plant Protection, University of Bonn, Bonn, Germany
- 2Department of Plant and Environmental Sciences, Copenhagen Plant Science Centre, University of Copenhagen, Frederiksberg, Denmark
- 3Department of Plant and Environmental Sciences, Copenhagen Plant Science Centre, University of Copenhagen, Taastrup, Denmark
- 4Institute of Sugar Beet Research (IfZ), Göttingen, Germany
Molecular marker analysis allow for a rapid and advanced pre-selection and resistance screenings in plant breeding processes. During the phenotyping process, optical sensors have proved their potential to determine and assess the function of the genotype of the breeding material. Thereby, biomarkers for specific disease resistance traits provide valuable information for calibrating optical sensor approaches during early plant-pathogen interactions. In this context, the combination of physiological, metabolic phenotyping and phenomic profiles could establish efficient identification and quantification of relevant genotypes within breeding processes. Experiments were conducted with near-isogenic lines of H. vulgare (susceptible, mildew locus o (mlo) and Mildew locus a (Mla) resistant). Multispectral imaging of barley plants was daily conducted 0–8 days after inoculation (dai) in a high-throughput facility with 10 wavelength bands from 400 to 1,000 nm. In parallel, the temporal dynamics of the activities of invertase isoenzymes, as key sink specific enzymes that irreversibly cleave the transport sugar sucrose into the hexose monomers, were profiled in a semi high-throughput approach. The activities of cell wall, cytosolic and vacuole invertase revealed specific dynamics of the activity signatures for susceptible genotypes and genotypes with mlo and Mla based resistances 0–120 hours after inoculation (hai). These patterns could be used to differentiate between interaction types and revealed an early influence of Blumeria graminis f.sp. hordei (Bgh) conidia on the specific invertase activity already 0.5 hai. During this early powdery mildew pathogenesis, the reflectance intensity increased in the blue bands and at 690 nm. The Mla resistant plants showed an increased reflectance at 680 and 710 nm and a decreased reflectance in the near infrared bands from 3 dai. Applying a Support Vector Machine classification as a supervised machine learning approach, the pixelwise identification and quantification of powdery mildew diseased barley tissue and hypersensitive response spots were established. This enables an automatic identification of the barley-powdery mildew interaction. The study established a proof-of-concept for plant resistance phenotyping with multispectral imaging in high-throughput. The combination of invertase analysis and multispectral imaging showed to be a complementing validation system. This will provide a deeper understanding of optical data and its implementation into disease resistance screening.
1. Introduction
The ascomycota Blumeria graminis f.sp. hordei (Bgh) is an obligate biotroph organism and the causal agent of barley's powdery mildew. It infests leaves and all green parts of barley plants. After the pre-penetration stage which finished with the penetration of the epidermal cell 15 hai, the post-penetration stage starts with an invagination of the fungus inside the epidermal cell. After this entering, Bgh develops a haustorium in the periplasmatic space 24 hai (Francis et al., 1996; Pryce et al., 1999). Haustoria are the feeding organs of Bgh and they deliver nutrients and necessary compounds for the biotrophic fungus (Green et al., 2002). A missing ATPase activity in Bgh is predicted to cause a loss of solute retention capacity of the host cell, which enable Bgh to take up nutrients (Gay et al., 1987). To make necessary carbohydrates available, Bgh reduce the activity of Ribulose-1,5-bisphosphate carboxylase/oxygenase (RuBisCO) and further enzymes of the Calvin cycle (Scholes et al., 1994; Wright et al., 1995a). Studies with powdery mildew of wheat (B. graminis f.sp. tritici) indicated that powdery mildew triggers the accumulation of acid invertases to change the source-sink relation in cereals (Wright et al., 1995b). With the nutrient income, Bgh is able to develop secondary mycelium on the leaf surface. Close to the area of the primary haustorium, conidiophores are grown, producing new conidia 5 dai. The disease is then macroscopically visible as white pustules and the conidiophores produce ~6,000 conidia per millimeter per day (Blumer, 1967). Thus fungal plant pathogens have an strong impact on gen-protein-hormone-metabolite signaling and on the cell histology of plants to overcome resistances such as waxy cuticula, cell wall and the innate resistance. Resistant barley genotypes are typically incompatible plant-pathogen systems e.g., based on mildew locus o (mlo, papilla formation) or mildew locus a (Mla, hypersensitive response resistance) (Jørgensen, 1992). Different plant-pathogen interactions have specific impact on the plant physiology and histology which individually influence the spectral reflectance signature of plants (Mahlein et al., 2012; Wahabzada et al., 2015).
To determine and assess these changes, different optical sensors were established which non-invasively measure specific spectral ranges e.g., spectral sensors, chlorophyll fluorescence and thermography (Mahlein, 2016). These optical sensors record the plant phenotype. Phenotyping is the visual description and assessment from single organs to the canopy, and this phenotype is influenced by the genome and the environment (Fiorani and Schurr, 2013). In this context, plant spectral reflectance from 380 to 2,500 nm can be measured using hyperspectral imaging. The recorded reflectance signature can be used to assess the plant health status, because several chemical compounds and the cell structure has specific optical characteristics. The visual range (VIS, 400–700 nm) is mainly influenced by photo pigments like chlorophyll, carotenoide and anthocyanin (Gitelson et al., 2001; Blackburn, 2007). The near infrared (NIR, 700–1,000 nm) is characterized by scattering processes of the plant and on the leaf structure. Spectral range from 1,000 to 2,500 nm is described as the short wave infrared range (SWIR) with specific water absorption bands (Whiting et al., 2004). During plant pathogenesis the characteristic spectral signature pattern is specifically changed over time (Mahlein et al., 2010). These changes in the spectral reflectance intensity and spectral pattern can be also used to derive histological changes and biological stages of the plant and pathogenesis (Wahabzada et al., 2016). This enables the characterization of the causal agent and the pathogenesis stage (Mahlein et al., 2012). According to these findings, different plant-pathogen interactions specifically influence the spectral signature and the detection of resistant and tolerant crop varieties may be possible. Recent studies identified different resistance reactions such as barley resistances against powdery mildew or sugar beet lines resistant against Cercospora leaf spot using hyperspectral imaging (Kuska et al., 2017; Leucker et al., 2017). Spectral pattern of the corresponding pathogenesis differ and can be distinguished from incompatible plant-pathogen interactions (Arens et al., 2016; Oerke et al., 2016; Kuska et al., 2017; Leucker et al., 2017). Therefore, hyper-/multispectral imaging is a promising technique for high-throughput phenotyping approaches in plant resistance breeding with increasing flexibility, due to technical and methodology developments (Behmann et al., 2018; Thomas et al., 2018b). Leaf chemicals and metabolites can be detected using hyperspectral imaging and machine learning approaches (Arens et al., 2016; Pandey et al., 2017), but the relationship of biochemical mechanisms and hyperspectral reflectance during plant-pathogen interactions are not completely clear.
Currently, many crop improvements are based on molecular plant breeding techniques to identify key factors (Wenzel, 2006; Schaart et al., 2016). Established molecular markers and genetic maps are used for marker-assisted selection, efficient parental selection and high-throughput screening of desired genotypes (Wenzel, 2006). In this context, plant invertases play a key role in plant development, cell regulation, metabolism, hormone signaling and defense response (Roitsch and González, 2004; Proels and Hückelhoven, 2014). The proposed main function of invertases is the carbohydrate partitioning, but investigations of the last decades revealed the multi-functionality of invertases (Roitsch and González, 2004; Proels and Hückelhoven, 2014). Invertases irreversibly cleaves sucrose to glucose and fructose which are the major transported sugars in higher plants (Williams et al., 2000). These can be taken up by plant cells due to hexose transporters (Roitsch, 1999). A coordinated regulation of primary metabolism and pathogen defense responses has been shown (Ehness and Roitsch, 1997; Berger et al., 2007). Studies by Roitsch et al. (2003), Proels and Hückelhoven (2014), and Tauzin and Giardina (2014) reviewed functions of cell wall invertases (Cw-Inv) in the context of pathogen infection. They highlighted the modes of Cw-Inv in plant cell regulations and plant-pathogen interactions. In addition to the extracellular invertase isoenzyme, two intracellular isoenzymes were shown to be involved in the infection by necrotrophic fungi (Berger et al., 2004) and hemibiotrophic bacteria (Bonfig et al., 2010). Such sugar-based signals were also shown in barley-powdery mildew compatible and incompatible interactions (Scholes et al., 1994; Swarbrick et al., 2006). Scholes et al. (1994) hypothesized that apoplastic invertase increased in barley during powdery mildew pathogenesis, because of a increased activity of acid invertase. These specific enzyme kinetics could be used as possible biomarkers for the detection of resistant plant genotypes. Linking these physiological and the optical scales will improve the performance of hyper-/multispectral imaging in plant resistance breeding and will establish a new non-invasive methodology for plant sciences (Großkinsky et al., 2015, 2017).
In this study, different barley genotypes were measured in a high-throughput approach using multispectral imaging. In the first experiment, plants were not inoculated to determine the natural senescence of the genotypes and the influence on the spectral reflectance signature. In the second experiment, plants were inoculated with Bgh. Powdery mildew pathogenesis as well as mlo gene-based resistances and Mla gene-based resistances were identified. Data analysis approach from machine learning could establish and validate resistance phenotyping by multispectral imaging. This is the basis for an automated spectral characterization of susceptible and resistance phenotypes in high-throughput. Furthermore, the temporal dynamics of changes in the activities of invertase isoenzymes were analyzed during different barley-powdery mildew interactions. Proved barley-powdery mildew interactions could be identified by invertase activity pattern already from 0.5 hai.
2. Materials and Methods
2.1. Plant Cultivation and Inoculation of Powdery Mildew
The experimental set-up was divided into two parts. For both investigations, plants were grown in commercial substrate (SW Horto AB, Hammenhög, Denmark) for 10 days in the greenhouse at 22/18°C and a photoperiod of 16 h. H. vulgare cv. Ingrid wild type (WT) was used as a susceptible genotype to powdery mildew. The corresponding near-isogenic line Ingrid M.C. 20, containing dysfunction in mildew locus o 3 (mlo3) (Hinze et al., 1991) and near-isogenic line cv. Pallas 22, containing dysfunction in mlo5 gene were used to assess non race-specific papilla based resistance. H. vulgare cv. Ingrid I10 with resistant mildew locus a 12 (Mla12) and Pallas 01 with Mla1 and Mla12 resistance loci were used to analyze a hypersensitive response (Kølster et al., 1986; Boyd et al., 1995).
Bgh, isolate A6 is avirulent to cv. Ingrid M.C. 20 and I10, and cv. Pallas 01 and 22 (Wolter et al., 1993; An et al., 2006; Swarbrick et al., 2006) and was maintained on cv. Ingrid WT in a controlled environment. Twenty-four hours before inoculation the conidia of heavily infested plants were shaken off and discarded in order to assure homogenous and vital conidia for inoculation. For each genotype, 80 primary leaves were inoculated with a density of = 307 (± 112) conidia/cm2 from young powdery mildew pustules (7–10 dai). Further 80 primary leaves were kept untreated (non-inoculated) as healthy control. For destructive measurements, five primary leaves of both treatments were sampled and frozen in liquid nitrogen 0.5, 12, 24, 48, 72, 96, and 120 hai.
2.2. Total Protein Extraction
Barley leaves were weighed and then homogenized in liquid nitrogen with 0.1 % PVPP. According to (Jammer et al., 2015), 1 ml extraction buffer (40 mM TRIS-HCl pH 7.6, 3 mM MgCl2, 1 mM EDTA, 0.1 mM PMSF, 1 mM benzamidine, 14 mM ß-mercaptoethanol, 24 μ M NADP) was mixed with 500 mg powdered material for 60 min at 4°C. The homogenate was centrifuged at 4°C and 20,000 g for 45 min. The supernatant was transferred into a new tube and kept on ice as a crude extract. According to Jammer et al. (2015), the remaining pellet was washed three times with ddH2O and resuspended in 1 ml high salt buffer (1 M NaCl, 40 mM TRIS-HCl pH = 7.6, 3 mM MgCl2 and 15 mM EDTA) over night at 4°C in a dark room. The resuspended pellet was centrifuged at 4°C and 20,000 g for 25 min. The supernatant was transferred into a new tube as the cell wall extract. To reduce the salt concentration, both extracts were dialysed overnight against 20 mM potassium phosphate buffer (pH = 7.4) at 4 °C in a dark room. Extracted protein content in both extracts was determined according to the Bradford method (Bradford, 1976), using BSA Fraction V as standard protein. The extracts were aliquoted, frozen in liquid nitrogen and stored at −20°C for further use.
2.3. Enzyme Activity Profiling
For semi-high-throughput analysis, a 96-well microtiter plate (Sarstedt, Nümbrecht, Germany) formate was used with a 5 μl citric acid-phosphate-buffer, 5 μl 0.1 M sucrose, 35 μl ddH2O, and 5 μl of dialysed protein extract. For determination of Cw-Inv activity, aliquots of the cell wall extract were incubated with citric acid-phosphate-buffer pH = 4.5 (454 mM Na2HPO4, 273 mM citric acid). For determination of cytosolic invertase (Cyt-Inv) activity, aliquots of the dialysed crude extract were incubated with citric acid-phosphate-buffer pH = 6.8 (772 mM Na2HPO4, 114 mM citric acid) and to test vacuolar invertase (Vac-Inv), citric acid-phosphate-buffer pH = 4.5 was used. In addition, a 0–50 nmol glucose standard curve was prepared with ddH2O. Reaction mixtures were incubated for 30 min at 37°C and then cooled down for 5 min on ice to stop the reaction. According to Jammer et al. (2015), the cooled down reaction mixtures were incubated with 200 μl of glucose oxidase-peroxidase reagent (10 U ml−1 GOD, 0.8 U ml−1 POD, 0.8 mg ml−1 ABTS, 0.1 M potassium phosphate buffer, pH = 7.0) for 30 min at 25°C. The amount of liberated glucose was determined by measuring the absorbance at 405 nm in a plate reader (Ascent Multiskan, Thermo Fisher Scientific, Waltham, USA). Specific activities were expressed as nkat gFW−1. All assays were carried out in triplicate and relative differences of nkat gFW−1 were calculated using Formula 1. To consider the biological dynamic, a variance propagation was calculated as measure of dispersion according to Formula 2.
Formula 1. Calculation of relative differences in specific activity rD[%] [nkat gFW−1] of invertases between non-inoculated (healthy) and B. graminis f.sp. hordei inoculated barley leaves.
Formula 2. Calculation of the standard deviation of relative activity differences between non-inoculated (healthy) and B. graminis f.sp. hordei inoculated barley leaves by variance propagation as measure of dispersion of relative difference specific activity rD[%] [nkat gFW−1] of invertases.
2.4. Multispectral Image Acquisition and Data Analysis
Using narrow banded LEDs, multispectral images with 10 wavelength bands were automatically acquired at spectral bands 365, 460, 525, 570, 645, 670, 700, 780, 890, and 970 nm and spatial resolution of five megapixels (PhenoLab, Videometer, Hørsholm, Denmark) (Svensgaard et al., 2014). A hemisphere setup (PhenoLab, Videometer, Hørsholm, Denmark) was used to assure homogeneous and diffuse illumination of the plants by high power LED sources. Multispectral images consist of consecutive panchromatic images each with a specific LED illumination at the corresponding wavelength. Plants were daily randomized and imaged 0–8 dai.
Spectral signatures of pixels from healthy and diseased regions were extracted manually. Therefore, a rectangular region of interest of ≥ 155 pixels was extracted. When a symptomatic area became visible the amount of pixels extracted increased depending on the symptom development. The spectral reflectance signature was calculated as the arithmetic average of the regions of interest.
For data driven analysis of the multispectral imaging data, a non-linear Support Vector Machine (SVM) classification with a radial base function kernel was applied. Two different classification models for powdery mildew symptoms and HR-spots were learned. As training data healthy plant pixels of the control group and manually selected powdery mildew symptoms and HR spots were used, respectively. To enhance accuracy at the last 2 days of the second experiment, healthy plant pixels provided by the mlo3-resistant genotype were included in the training data. Hyperparameters were optimized using the combination of ten-fold cross-validation and grid-search. Predictions were obtained applying the model on pixel-level to the plant pixels within the image. Background image parts like soil, tray and conveyor system were removed in a preprocessing step by thresholding and spatial masks. The pixel-wise classification was then summarized per tray to the ratio of affected pixels to all plant pixels expressed in percentage. As both models were applied to all images, two ratio values per day and image are derived.
2.5. Separability of Phenotypes
Based on the ratio of powdery mildew symptoms, and HR-spots the plants were assigned to a response type, (I) susceptible, (II) mlo resistance or (III) Mla resistance. A threshold classification of the 20 samples was performed whereas each sample was represented by the two ratios determined by the SVM. A threshold of 5 % on the powdery mildew ratio was used to separate resistant and susceptible samples whereas a threshold of 0.45 % on the HR-ratio was used to separate Mla resistance and mlo resistance.
3. Results
3.1. Temporal Dynamics of Changes in Activities of Invertase Isoenzymes During Barley-Powdery Mildew Interactions
To characterize susceptible and Bgh resistant genotypes the specific activities of cell wall, cytosolic and vacuolar invertases were analyzed (Figure 1). Therefore, relative differences (rD) of the specific activity of inoculated plants to non-inoculated plants were calculated. Positive values indicate higher specific activity in Bgh inoculated individuals compared to non-inoculated plants. Negative values showed a lower activity.
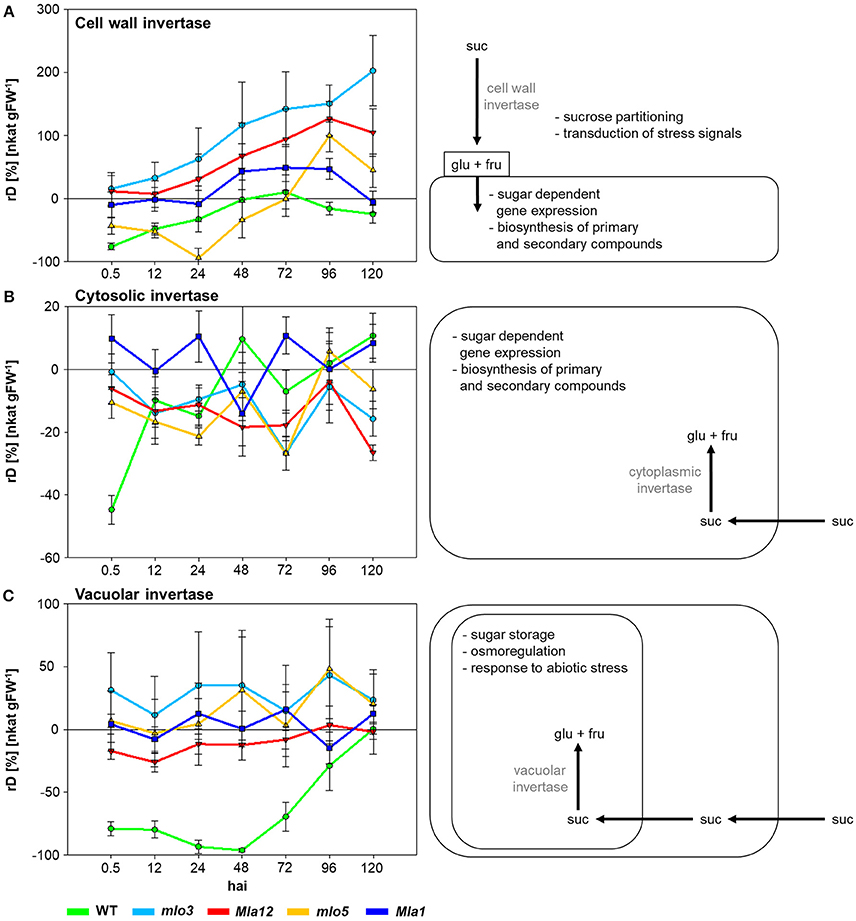
Figure 1. The effect of compatible and incompatible mlo and Mla barley interactions with B. graminis f.sp. hordei on the specific activity signatures of invertases 0.5–120 hai. Relative differences (rD) of the specific activity between the inoculated near-isogenic lines and their corresponding non-inoculated leaves were calculated. Positive values demonstrate higher invertase activity in inoculated leaves, negative values higher invertase activity of non-inoculated leaves. Each invertase shows a specific activity signature for each near-isogenic line. Data shown are from a representative of three independent experiments (n = 5 × 3 biological replicates × technical replicates).
Cell wall invertase activity increased over the experimental period (Figure 1A). Susceptible WT showed the lowest activity of −77% comparing to the non-inoculated control 0.5 hai. The mlo5 genotype showed a declined activity of the cell wall invertase until 24 hai. Highest activity up to 200% was measured in mlo3 leaves. Cw-Inv activity revealed significant differences between mlo3 and mlo5 on all investigated time points in exception of 96 hai (Table 1). Both Mla genotypes showed a similar cell wall invertase activity pattern with significant differences 96 and 120 hai (Table 1).
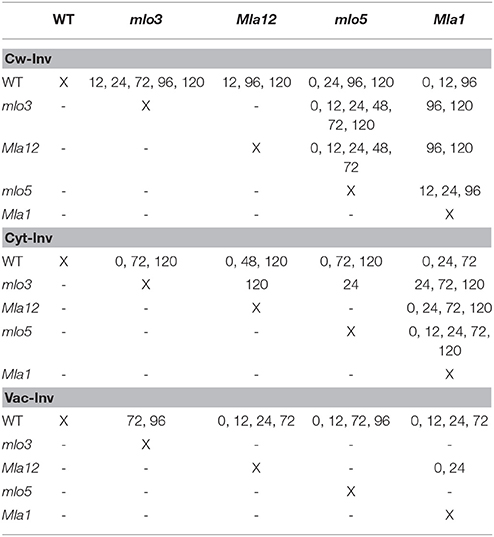
Table 1. Hours after inoculation with B. graminis f.sp. hordei that have significant differences in invertase activity of proved near-isogenic barley lines (Welch's t-test, α = 0.05).
Specific activity of WT cytosolic invertase increased after 0.5 hai (Figure 1B). Compared to control plants, the activity was higher at 48 and 120 hai. The mlo3 and mlo5 genotypes showed similar dynamics in the cytosolic invertase activity with an 6% increased activity in mlo5 leaves 96 hai. But significant differences were shown to all other tested time-points (Table 1). Mla1 had the highest cytosolic invertase activity up to 11% over the experimental period (Figure 1B). The Mla12 genotype had a declined activity and could significantly differentiate from Mla1 0, 24, 72, and 120 hai (Table 1).
Susceptible WT had a declined activity of the vacuolar invertase to −96% until 48 hai (Figure 1C). Then, the activity normalized until the end of the analysis 120 hai. Interestingly, this activity was significantly different to all resistant barley near-isogenic lines (Table 1). Both mlo genotypes showed an similar dynamic pattern of the vacuolar invertase activity with the highest increase of 48% 96 hai (Figure 1C). HR based resistant Mla12 genotype showed lower activity comparing to non-inoculated plants until 72 hai. Mla1 plants had an increased activity at 24, 72, and 120 hai.
3.2. Influence of Barley-Powdery Mildew Interactions on the Multispectral Reflectance
The multispectral reflectance changed over the experimental period specifically for each interaction type (Figure 2). First changes of the reflectance of susceptible cv. Ingrid WT were assessable 2 dai (Figure 2A). The reflectance intensity increased in the VIS range from 380 to 700 nm in accordance with plant growth. Reflectance in the blue range and around 680 nm showed a stronger increase from 4 dai. The NIR range from 700 nm showed a stepwise increase in the reflectance intensity 3 and 5 dai. Powdery mildew pustules were visible from 5 dai and overspread the whole plants 7 dai (Figure 2A). The papilla based resistant mlo3 genotype showed no relevant changes in the multispectral reflectance until 4 dai (Figure 2B). The reflectance increased in the NIR range from 6 dai. In addition, the intensity increased around 380 and 550 nm. The plants showed no powdery mildew symptoms but several bleached spots. Multispectral signatures of Bgh inoculated Mla12 plants significantly changed from 600 to 680 nm and around 900 nm 4 dai (Figure 2C). A plateau pattern was observed in the spectral range from 550 to 690 nm from 7 dai. The plants show necrotic spots on the leaf surface from 5 to 6 dai.
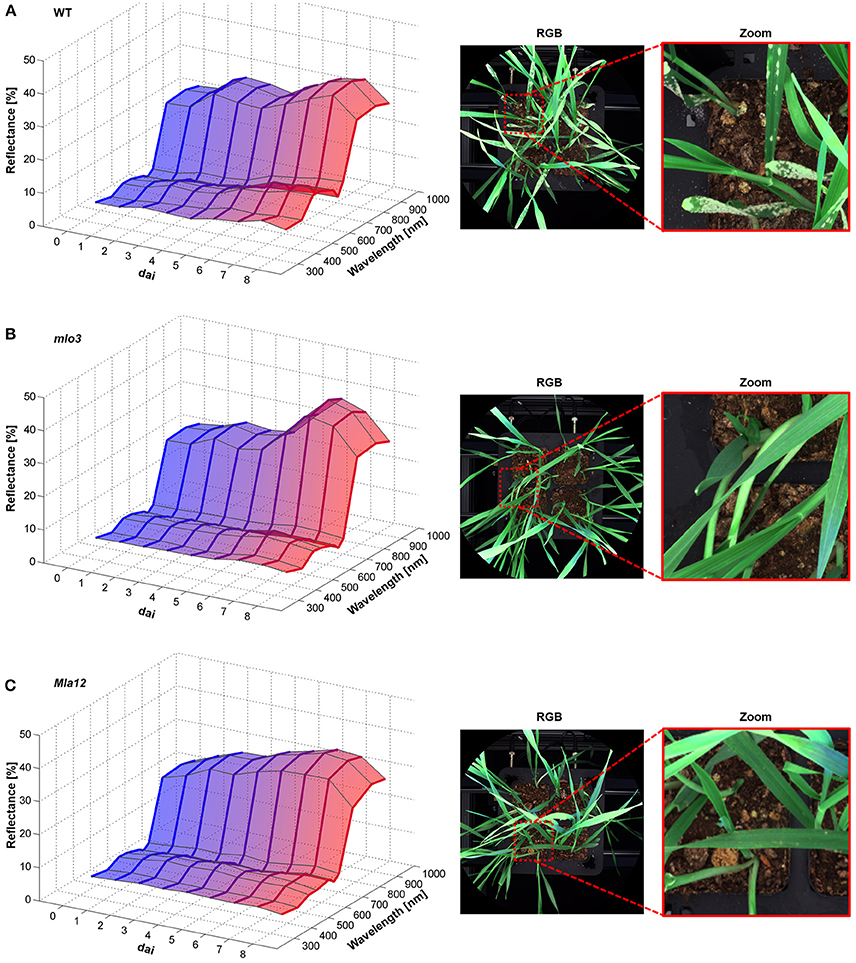
Figure 2. Multispectral signatures of B. graminis f.sp. hordei inoculated H. vulgare leaves cv. Ingrid WT (A), mlo3 (B), and Mla12 (C) 0–8 dai and corresponding RGB images 7 dai. Susceptible WT leaves showed increased reflectance over the entire spectrum during the experimental period (A). The mlo3 genotypes showed a slight increase around the green peak and NIR (B). Reflectance intensity of Mla12 increased especially around 680 nm (C) (n = 64 × (≥150) biological replicates × technical replicates).
The Pallas Mla1 genotype showed similar changes in the spectral reflectance already 2 dai (Figure 3A). Small necrotic spots were also visible on the leaves from 5 to 6 dai. In contrast, the mlo5 genotype showed several bleached spots (Figure 3B). The multispectral signature revealed a slight increases in the intensity from 380 to 660 nm. The reflectance intensity in the NIR range showed a continuous increase.
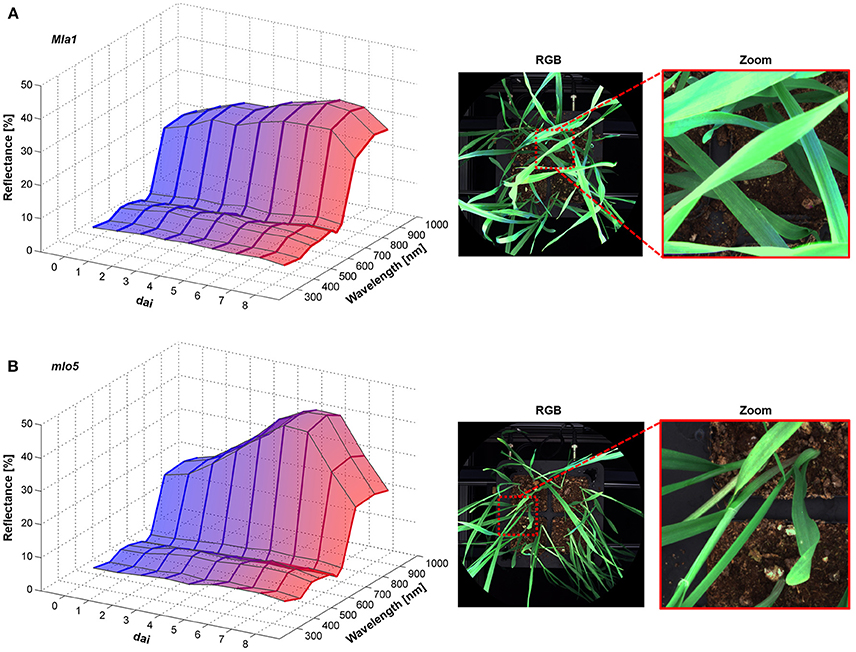
Figure 3. Spectral characteristics of B. graminis f.sp. hordei inoculated H. vulgare leaves cv. Pallas Mla1 (A) and mlo5 (B) 0–8 dai and corresponding RGB images 7 dai (n = 64 × (≥150) biological replicates × technical replicates).
3.3. Automatic Classification of Barley Genotypes Based on the Interaction With B. graminis f.sp. hordei
Applying the SVM on the multispectral images, the identification of powdery mildew diseased tissue and HR spots was feasible (Figure 4). For the identification of reaction types, two different SVM models were applied. In both analyses, healthy tissue is indicated in green pixels, powdery mildew infested tissue is indicated in blue pixels (Figure 4A), HR spots are indicated in red pixels and non-plant pixels are indicated in black. (Figure 4B).
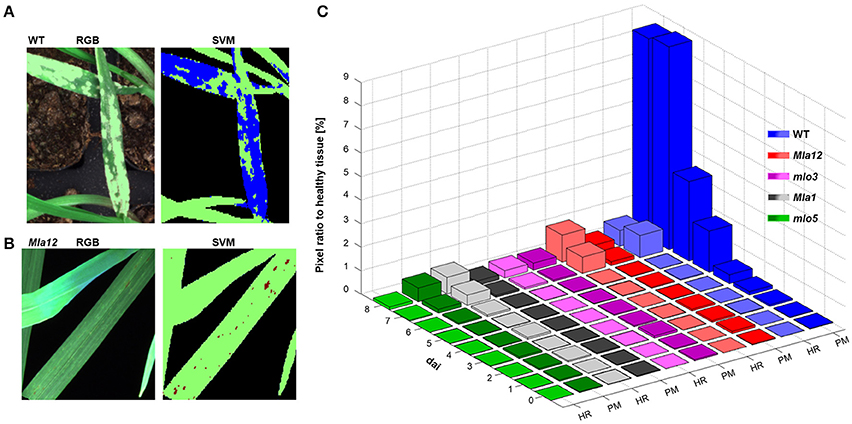
Figure 4. Automatically detected powdery mildew (PM) diseased and HR undergoing pixels applying SVM on multispectral images. In (A,B), representative sections of the multispectral images are illustrated. Healthy tissue is indicated in green pixels and PM diseases tissue in blue pixels (A). Red pixels are indicated tissue undergoing a HR (B). PM and HR pixels are quantified in their ratio to healthy pixels (C). Quantification revealed the susceptible near-isogenic line WT by a high amount of PM diseased pixels from 5 dai. The Mla near-isogenic lines can be identified by high amount of HR pixels. Low pixel ratios for both models are shown for mlo near-isogenic lines.
The ratio determination of powdery mildew diseased pixels and pixels undergoing a HR, revealed a specific pattern which was in accordance with the different barley-powdery mildew interactions (Figure 4C). The quantitative ratios for all investigated near-isogenic lines are shown in Figure 4C. Powdery mildew symptoms can be clearly detected and reach a level of up to 9% of the overall plant pixels. A significant increase in affected pixels was visible at 3 dai with a strong increase till 8 dai. The highest value of the non-susceptibly groups was reached by mlo5 with below 0.6% at the last day. The determined ratio of HR-reactions reached up to 1.15% for Mla12 and up to 0.7% for the Pallas Mla1. For susceptible Ingrid genotype, up to 0.67% of the pixels were determined as HR reactions.
The detection of the susceptible genotype bases mainly on the powdery mildew-ratio whereas the differentiation between Mla and mlo resistance is based on the HR-ratio. In the present experiment, a simple threshold based classification was sufficient for an accurate separation of the classes. The confusion matrix, shown in Table 2 summarizes multispectral images of the individual barley-Bgh interactions 7 dai. All samples (16 plants per multispectral image) were classified correctly, except of one single Mla sample. This sample showed neither powdery mildew symptoms nor a significant number of HR pixels and was therefore assigned to be mlo resistant. An overall accuracy of 95% was reached in the present experiment.
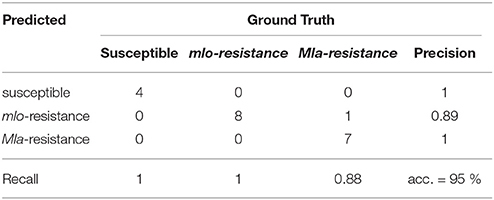
Table 2. Confusion matrix of automatic prediction of susceptible, mlo and Mla based resistant barley near-isogenic lines against powdery mildew based on Support Vector Machine analysis of multispectral images 7 dai.
4. Discussion
4.1. Temporal Dynamics of Invertase Activity Signatures Allow Early Identification of Barley-Bgh Interactions and Their Functionality Is Assessable by Parallel Multispectral Imaging
Cw-Inv increased especially in mlo and Mla resistant near-isogenic lines over the experimental period. An increase in the activity of invertases in Bgh inoculated leaves will have several consequences. Beside an increased hydrolysis of sucrose to glucose and fructose, the photosynthesis rate is reduced and several defense genes are activated (Scholes et al., 1994; Both et al., 2005; Swarbrick et al., 2006). Recently, investigations by Brugger et al. (2017) highlighted a decreased photosynthetic rate and an increased non-photochemical quenching of mlo3 and Mla1 leaves inoculated with Bgh. This is caused by the light energy, reflected as thermal dissipation and not used for photosynthesis. Swarbrick et al. (2006) hypothesized that a reduced photosynthesis rate is induced by increased Cw-Inv activity and play a role in hexoses generation which may supply energy for the defense response and signaling for defense genes against Bgh. The increased spectral reflectance intensity 500–700 nm from 48 hai is associated with lower rate in photosynthesis of susceptible WT and resistant Mla1 and Mla12. A specific increase of Cw-Inv activity during plant-pathogen interaction was also observed in different systems and trophic styles (Proels and Hückelhoven, 2014). This supports Cw-Inv as a promising biomarker, but several signals are converged at the site of Cw-Inv. Therefore, this potential biomarker must be evaluated for every specific plant-pathogen system. In this study, Cw-Inv and Cyt-Inv showed to be significantly different between the investigated plant-pathogen systems at least during two experimental time points. The spectral reflectance showed similar patterns for the specific interaction and allowed an accurate characterization of the interaction type. Differences on the “omic level” can be induced by their different signal pathways e.g., Mla1 induces Bgh race-specific resistance via a RAR1 independent pathway (Schulze-Lefert and Vogel, 2000; Bieri et al., 2004).
Specific activities of the tested invertase isoenzymes was significant lower in Bgh inoculated WT compared to the corresponding non-inoculated leaves already 0.5 hai. Furthermore, the continuous increase of Vac-Inv activity from 48 hai was in accordance with increased reflectance around 365, 460, and 670 nm of susceptible WT, which is characteristic for powdery mildew pathogenesis (Kuska et al., 2015, 2017; Wahabzada et al., 2015). Such early phenomena was investigated by Nielsen et al. (2000). They have shown an extracellular proteinaceous matrix from the conidia body by electron microscopy already 1 hai. They proposed even an earlier interaction between plant and conidia, because they identified that conidia can uptake low-molecular-weight compounds before germination. This makes Bgh conidia capable of signal- recognition and respond to the host, immediately after the first contact (Nielsen et al., 2000). In this context, it was also shown that cell wall carbohydrates contribute to penetration resistance (Ellinger et al., 2013). Later increased invertase activities in this study are similar to results of Scholes et al. (1994); Both et al. (2005); Swarbrick et al. (2006) and are important to facilitate nutrition uptake by the Bgh haustoria which prefer glucose (Whipps and Lewis, 1981). In addition, the increased spectral reflectance in the green and red range are in accordance with studies by Scholes et al. (1994). They hypothesized a reduced photosynthesis activity due to increased invertase activity, because the increased carbohydrate concentration down regulates the Calvin cycle. These would affect plant development and architecture, which are indicated in the NIR range (Gates et al., 1965; Slaton et al., 2001). But, increasing reflectance between 750 and 1,000 nm in this study was mainly caused by plant growth and leaf overlapping. The decreased reflectance intensity 8 dai is caused due to hang down and overlapping of the barley leaves. Thus, the leaves were in a different height and angle composed to earlier experimental days. This can be avoided using a plant fixation which keep the leaves in position at every day time and will reduce the effect of increasing reflectance intensity over the whole spectrum and experimental period (Mahlein et al., 2012). Further solution, which consider the leaf angle could be the implementation of 3D models for the normalization of spectral reflectance (Behmann et al., 2016). Different state-of-the-art optical approaches and machine learning applications for the estimation of disease severity were realized on the leaf level (Bock et al., 2010; Rumpf et al., 2010; Pethybridge and Nelson, 2015; Kuska et al., 2017; Thomas et al., 2017). Thomas et al. (2018a) established a mini-plot facility in the greenhouse for high-throughput identification and quantification of powdery mildew tolerant barley lines using hyperspectral imaging in the VIS range. For detailed review of limitations and solution statements for spectral imaging in plant breeding processes, we refer to Kuska and Mahlein (2018) and Thomas et al. (2017). In our study, the quantification of diseased and HR pixels was feasible on whole plants using SVM on multispectral images. This enables the characterization of barley-powdery mildew interaction types with a high precision and shows the potential of machine learning methods for high-throughput resistance screening (Behmann et al., 2015). In further trials, the trained model can be applied to identify and characterize unknown genotypes as mlo or Mla resistant, even if the causing locus is unknown so far. For further models, the specific crops and pathogenesis must be investigated. Therefore, the use of specific fungal isolates is essential to identify race-specific resistances e.g., against the wheat stem rust isolate Ug99. Here the isolate overcame wheat resistances and common biological markers are now limited or inoperative (Singh et al., 2011). The here presented technique and method has high potential to identify new promising parental candidates for present and future breeding purposes in a fully automated manner. However, a direct differentiation of the mlo and Mla loci was not realized by the multispectral imaging, which shows the current limitation for practical breeding processes. For such a detailed phenotyping, the coherency of hyperspectral reflectance signatures with physiological and “omic data” must be systematically investigated (Arens et al., 2016; Leucker et al., 2017; Kuska and Mahlein, 2018). New developed markers and resulted new breeding lines can be then tested under different environmental conditions and will be analyzed and assessed by multispectral imaging.
In summary, this study represents a successful proof-of-concept for effective and efficient screening of barley-powdery mildew interaction types in a controlled environment with high-throughput solutions. Data analysis can be highly improved by machine learning approaches. In addition to reduced labor intensity, a pixelwise disease and HR spot estimation was enabled by a SVM which allows a precise barley-powdery mildew interaction type prediction. Consequently, multispectral imaging can be used for high-throughput plant resistance screenings to identify resistant plants and to differentiate them in a controlled environment. The distinct temporal dynamics of changes in activity signatures of invertase isoenzymes can be used for early identification of barley-Bgh interactions, which are assessed on functionality by parallel multispectral imaging. In future approaches, multispectral imaging will be established for different environmental scenarios to analyze the stability of plant resistance in combination with abiotic stress factors. In these scenarios, the combination of metabolic and phenomic profiles will be highly informative.
Author Contributions
MK, JB, DG, TR, and A-KM designed the study. MK, JB, and A-KM drafted the manuscript. MK and DG carried out multispectral measurements. MK manually analyzed multispectral images and determined and assessed enzyme kinetics. JB adapted and applied the SVM on multispectral images to identify and quantify plant-pathogen interactions and Welchs t-test on enzyme activities. MK, JB, DG, TR, and A-KM interpreted the data. All authors read and approved the final manuscript.
Conflict of Interest Statement
The authors declare that the research was conducted in the absence of any commercial or financial relationships that could be construed as a potential conflict of interest.
Funding
This work could be carried out due to the financial support of the German Federal Ministry of Education and Research (BMBF) within the scope of the competitive grants program Networks of excellence in agricultural and nutrition research - CROP.SENSe.net (Funding code: 0315529), junior research group Hyperspectral phenotyping of resistance reactions of barley and due to financial support by a Jeff Schell Fellowship (Grant number: F-2016-JS-0196) of the Bayer Science & Education Foundation.
Acknowledgments
The authors are thankful to Karl-Heinz Kogel, Justus-Liebig-Universität Giessen for providing B. graminis f.sp. hordei isolate A6 and Holger Deising, Martin-Luther-Universität Halle-Wittenberg for helpful discussion. Moreover, authors are thankful for helpful discussions at the meetings of the international COST action FA1306, The Quest for Tolerant Varieties - Phenotyping at Plant and Cellular Level.
References
An, Q., Ehlers, K., Kogel, K. H., van Bel, A. J. E., and Hückelhoven, R. (2006). Multivesicular compartments proliferate in susceptible and resistant MLA12-barley leaves in response to infection by the biotrophic powdery mildew fungus. N. Phytol. 172, 563–576. doi: 10.1111/j.1469-8137.2006.01844.x
Arens, N., Backhaus, A., Döll, S., Fischer, S., Seiffert, U., and Mock, H. P. (2016). Non-invasive presymptomatic detection of Cercospora beticola infection and identification of early metabolic responses in sugar beet. Front. Plant Sci. 7:1377. doi: 10.3389/fpls.2016.01377
Behmann, J., Acebron, K., Emin, D., Bennertz, S., Matsubara, S., Thomas, S., et al. (2018). Specim IQ: evaluation of a new, miniaturized handheld hyperspectral camera and its application for plant phenotyping and disease detection. Sensors 18:441. doi: 10.3390/s18020441
Behmann, J., Mahlein, A. K., Paulus, S., Kuhlmann, H., Oerke, E. C., and Plümer, L. (2016). Generation and application of hyperspectral 3D plant models: methods and challenges. Mach. Vis. Appl. 27, 611–624. doi: 10.1007/s00138-015-0716-8
Behmann, J., Mahlein, A. K., Rumpf, T., Römer, C., and L., P. (2015). A review of advanced machine learning methods for the detection of biotic stress in precision crop protection. Precision Agric. 16, 239–260. doi: 10.1007/s11119-014-9372-7
Berger, S., K. Sinha, A. K., and Roitsch, T. (2007). Plant physiology meets phytopathology: plant primary metabolism and plant-pathogen interactions. J. Exp. Bot. 58, 4019–4026. doi: 10.1111/j.1399-3054.2004.00433.x
Berger, S., Papadopoulus, S., Schreiber, U., Kaiser, W., and Roitsch, T. (2004). Complex regulation of gene expression, photosynthesis and sugar levels by pathogen infection. Physiol. Plant. 122, 419–428. doi: 10.1093/jxb/erm298
Bieri, S., Mauch, S., Shen, Q. H., Peart, J., Devoto, A., Casais, C., et al. (2004). Rar1 positively controls steady state levels of barley Mla resistance proteins and enables sufficient Mla6 accumulation for effective resistance. Plant Cell 16, 3480–3495. doi: 10.1105/tpc.104.026682
Blackburn, G. A. (2007). Hyperspectral remote sensing of plant pigments. J. Exp. Bot. 58, 855–867. doi: 10.1093/jxb/erl123
Bock, C. H., Poole, G. H., Parker, P. E., and Gottwald, T. (2010). Plant disease severity estimated visually, by digital photography and image analysis, and by hyperspectral imaging. Crit. Rev. Plant Sci. 29, 59–107. doi: 10.1080/07352681003617285
Bonfig, K. A., Gabler, U., Simon, K., Luschin-Ebengreuth, N., Hatz, M., Berger, S., et al. (2010). Post-translational derepression of invertase activity in source leaves via down-regulation of invertase inhibitor expression is part of the plant defence response. Mol. Plant 3, 1037–1048. doi: 10.1093/mp/ssq053
Both, M., Csukai, M., Stumpf, M. P. H., and Spanu, P. D. (2005). Gene expression profiles of Blumeria graminis indicate dynamic changes to primary metabolism during development of an obligate biotrophic pathogen. Plant Cell 17, 2107–2122. doi: 10.1105/tpc.105.032631
Boyd, L. A., Smith, P. H., Foster, E. M., and Brown, J. K. M. (1995). The effects of allelic variation at the Mla resistance locus in barley on the early development of Erysiphe graminis f.sp. hordei and host response. Plant J. 7, 959–968. doi: 10.1046/j.1365-313X.1995.07060959.x
Bradford, M. M. (1976). A rapid and sensitive method for the quantification of microgram quantities of protein utilizing the principle of protein-dye binding. Anal. Biochem. 72, 248–254.
Brugger, A., Kuska, M. T., and Mahlein, A. K. (2017). Impact of compatible and incompatible barley-Blumeria graminis f.sp. hordei interactions on chlorophyll fluorescence parameters. J. Plant Dis. Protect. 125, 177–186. doi: 10.1007/s41348-017-0129-1.
Ehness, R. and Roitsch, T. (1997). Coordinated induction of mRNAs for extracellulars invertase and a glucose transporter in Chenopodium rubrum by cytokins. Plant J. 11, 539–548.
Ellinger, D., Naumann, M., Falter, C., Zwikowics, C., Jamrow, T., Manisseri, C., et al. (2013). Elevated early callose deposition results in complete penetration resistance to powdery mildew in Arabidopsis. Plant Physiol. 161, 1433–1444. doi: 10.1104/pp.112.211011
Fiorani, F., and Schurr, U. (2013). Future scenarios for plant phenotyping. Annu. Rev. Plant Biol. 64, 267–291. doi: 10.1146/annurev-arplant-050312-120137
Francis, S. A., Dewey, F. M., and Gurr, S. J. (1996). The role of cutinase in germling development and infection by Erysiphe graminis f. sp. hordei. Physiol. Mol. Plant Pathol. 49, 201–211.
Gates, D. M., Keegan, H. J., Schelter, J. C., and Weidner, V. R. (1965). Spectral properties of plants. Appl. Optics 4, 11–20.
Gay, A., Thomas, H., Roca, M., James, C., Taylor, J., Rowland, J., and Ougham, H. (1987). Dynamic experimental evidence for the plasma membrane ATPase domain hypothesis of haustorial transport and for ionic coupling of the haustorium of Erysiphe graminis to the host cell (Hordeum vulgare). N. Phytol. 107, 541–548.
Gitelson, A., Merzlyak, M. N., and Chivkunova, O. B. (2001). Optical properties and nondestructive estimation of anthocyanin content in plant leaves. Photochem. Photobiol. 74, 38–45. doi: 10.1562/0031-8655(2001)0740038OPANEO2.0.CO2
Green, J. R., Carver, T. L. W., and Gurr, S. J. (2002). “The formation and function of infection and feeding structures,” in The Powdery Mildews-A Comprehensive Treatise, eds R. R. Bélanger, W. R. Bushnell, A. J. Dik, and T. L. W. Carver (St. Paul, MN: American Phytopathological Society; APS Press), 66–82.
Großkinsky, D. K., Syaifullah, S. J., and Roitsch, T. (2017). Integration of multi-omics techniques and physiological phenotyping within a holistic phenomics approach to study senescence in model and crop plants. J. Exp. Bot. 69, 825–844. doi: 10.1093/jxb/erx333
Großkinsky, D. K., Svensgaard, J., Christensen, S., and Roitsch, T. (2015). Plant phenomics and the need for physiological phenotyping across scales to narrow the genotype-to-phenotype knowledge gap. J. Exp. Bot. 66, 5429–5440. doi: 10.1093/jxb/erv345
Hinze, K., Thompson, R. D., Ritter, E., Salamini, F., and Schulze-Lefert, P. (1991). Restriction fragment length polymorphism-mediated targeting of the ml-o resistance locus barley (Hordeum vulgare). Proc. Natl. Acad. Sci. U.S.A. 88, 3691–3695.
Jammer, A., Gasperl, A., Luschin-Ebengreuth, N., Heyneke, E., Chu, H., Cantero-Navarro, E., et al. (2015). Simple and robust determination of the activity signature of key carbohydrate metabolism enzymes for physiological phenotyping in model and crop plants. J. Exp. Bot. 66, 5531–5542. doi: 10.1093/jxb/erv228
Jørgensen, J. H. (1992). Discovery, characterization and exploitation of Mlo powdery mildew resistance in barley. Euphytica 63, 141–152.
Kølster, P., Munk, L., Stølen, O., and Løhde, J. (1986). Near-isogenic barley lines with genes for resistance to powdery mildew. Crop Sci. 26, 903–907.
Kuska, M., Wahabzada, M., Leucker, M., Dehne, H. W., Kersting, K., Oerke, E. C., et al. (2015). Hyperspectral phenotyping on the microscopic scale: towards automated characterization of plant-pathogen interactions. Plant Methods 11:28. doi: 10.1186/s13007-015-0073-7
Kuska, M. T., Brugger, A., Thomas, S., Wahabzada, M., Kersting, K., Oerke, E. C., et al. (2017). Spectral patterns reveal early resistance reactions of barley against Blumeria graminis f. sp. hordei. Phytopathology 107, 1388–1398. doi: 10.1094/PHYTO-04-17-0128-R
Kuska, M. T. and Mahlein, A. K. (2018). Aiming at decision making in plant disease protection and phenotyping by the use of optical sensors. Eur. J. Plant Pathol. doi: 10.1007/s10658-018-1464-1
Leucker, M., Mahlein, A. K., Steiner, U., and Oerke, E. C. (2017). Hyperspectral imaging reveals the effect of sugar beet quantitative trait loci on Cercospora leaf spot resistance. Funct. Plant Biol. 44, 1–9. doi: 10.1071/FP16121
Mahlein, A. K. (2016). Plant disease detection by imaging sensors - parallels and specific demands for precision agriculture and plant phenotyping. Plant Dis. 2, 241–251. doi: 10.1094/PDIS-03-15-0340-FE
Mahlein, A. K., Steiner, U., Dehne, H. W., and Oerke, E. C. (2010). Spectral signatures of sugar beet leaves for the detection and differentiation of diseases. Precision Agric. 11, 413–431. doi: 10.1007/s11119-010-9180-7
Mahlein, A. K., Steiner, U., Hillnhütter, C., Dehne, H. W., and Oerke, E. C. (2012). Hyperspectral imaging for small-scale analysis of symptoms caused by different sugar beet disease. Plant Methods 8:3. doi: 10.1186/1746-4811-8-3
Nielsen, K. A., Nicholson, R. L., Carver, T. L. W., Kunoh, H., and Oliver, R. P. (2000). First touch: an immediate response to surface recognition in conidia of Blumeria graminis. Physiol. Mol. Plant Pathol. 56, 63–70. doi: 10.1006/pmpp.1999.0241
Oerke, E. C., Herzog, K., and Toepfer, R. (2016). Hyperspectral phenotyping of the reaction of grapevine genotypes to Plasmopara viticola. J. Exp. Bot. 67, 5529–5543. doi: 10.1093/jxb/erw318
Pandey, P., Ge, Y., Stoerger, V., and Schnabel, J. C. (2017). High throughput in vivo analysis of plant leaf cchemical properties using hyperspectral imaging. Front. Plant Sci. 8:1348. doi: 10.3389/fpls.2017.01348
Pethybridge, S. J., and Nelson, S. C. (2015). Leaf doctor: a new portable application for quantification plant disease severity. Plant Dis. 99, 1310–1316. doi: 10.1094/PDIS-03-15-0319-RE
Proels, R. K. and Hückelhoven, R. (2014). Cell-wall invertases, key enzymes in the modulation of plant metabolism during defence response. Mol. Plant Pathol. 15, 858–864. doi: 10.1111/mpp.12139
Pryce, J. E., Carver, T., and Gurr, S. J. (1999). The roles of cellulase enzymes and mechanical force in host penetration by Erysiphe graminis f.sp.hordei. Physiol. Mol. Plant Pathol. 55, 175–182.
Roitsch, T., Balibrea, M. E., Hofmann, M., Proels, R., and Sinha, A. K. (2003). Extracellular invertase: key metabolic enzyme and PR protein. J. Exp. Bot. 54, 513–524. doi: 10.1093/jxb/erg050
Roitsch, T. and González, M.-C. (2004). Function and regulation of plant invertases: sweet sensations. Trends Plant Sci. 9, 606–612. doi: 10.1016/j.tplants.2004.10.009
Rumpf, T., Mahlein, A. K., Steiner, U., Oerke, E. C., Dehne, H. W., and Plümer, L. (2010). Early detection and classification of plant disease with Support Vector Machines based on hyperspectral reflectance. Comp. Electron. Agric. 74, 91–99. doi: 10.1016/j.compag.2010.06.009
Schaart, J. G., van de Weil, C. C. M., Lotz, L. A. P., and Smulders, M. J. M. (2016). Opportunities for products of new plant breeding techniques. Trends Plant Sci. 21, 438–449. doi: 10.1016/j.tplants.2015.11.006
Scholes, J. D., Lee, P. J., Horton, P., and Lewis, D. H. (1994). Invertase: Understanding changes in the photosynthetic and carbohydrate metabolism of barley leaves infected with powdery mildew. N. Phytol. 126, 213–222.
Schulze-Lefert, P., and Vogel, J. (2000). Closing the ranks to attack by powdery mildew. Trends Plant Sci. 5, 343–348. doi: 10.1016/S1360-1385(00)01683-6
Singh, R. P., Hodson, D. P., Huerta-Espino, J., Jin, Y., Bhavani, S., Njau, P., et al. (2011). The emergence of Ug99 races of the stem rust fungus is a threat to world wheat production. Annu. Rev. Phytopathol. 49, 465–481. doi: 10.1146/annurev-phyto-072910-095423
Slaton, M. R., Hunt, R., and Smith, W. K. (2001). Estimating near-infrared leaf reflectance from leaf structural characteristics. Am. J. Bot. 88, 278–284. doi: 10.2307/2657019
Svensgaard, J., Roitsch, T., and Christensen, S. (2014). Development of a mobile multispectral imaging platform for precise field phenotyping. Agronomy 4, 322–336. doi: 10.3390/agronomy4030322
Swarbrick, P., Schulze-Lefert, P., and Scholes, J. (2006). Metabolic consequences of susceptible and resistance (race-specific and broad-spectrum) in barley leaves challenged with powdery mildew. Plant Cell Environ. 29, 1061–1076. doi: 10.1111/j.1365-3040.2005.01472.x
Tauzin, A. S. and Giardina, T. (2014). Sucrose and invertases, a part of the plant defense response to the biotic stresses. Front. Plant Sci. 5:293. doi: 10.3389/fpls.2014.00293
Thomas, S., Behmann, J., and Mahlein, A. K. (2018a). Quantitative assessment of disease severity and rating of barley cultivars based on hyperspectral imaging in a non-invasive, automated phenotyping platform. Plant Methods 14:45. doi: 10.1186/s13007-018-0313-8
Thomas, S., Kuska, M. T., Bohnenkamp, D., Brugger, A., Alisaac, E., Wahabzada, M., et al. (2018b). Benefits of hyperspectral imaging for plant disease detection and plant protection: a technical perspective. J. Plant Dis. Protect. 125, 5–20. doi: 10.1007/s41348-017-0124-6
Thomas, S., Wahabzada, M., Kuska, M. T., Rascher, U., and Mahlein, A. K. (2017). Observation of plant-pathogen interaction by simultaneous hyperspectral imaging reflection and transmission measurements. Funct. Plant Biol. 44, 23–34. doi: 10.1071/FP16127
Wahabzada, M., Mahlein, A. K., Bauckhage, C., Steiner, U., Oerke, E. C., and Kersting, K. (2015). Metro maps of plant disease dynamics - automated mining of differences using hyperspectral images. PLoS ONE 10:e0116902. doi: 10.1371/journal.pone.0116902
Wahabzada, M., Mahlein, A. K., Bauckhage, C., Steiner, U., Oerke, E. C., and Kersting, K. (2016). Plant phenotyping using probabilistic topic models: Uncovering the hyperspectral language of plants. Sci. Rep. 6:22482. doi: 10.1038/srep22482
Wenzel, G. (2006). Molecular plant breeding: Achievements in green biotechnology and future perspectives. Appl. Microbiol. Biotechnol. 70, 642–650. doi: 10.1007/s00253-006-0375-9
Whipps, J. M. and Lewis, D. H. (1981). “Patterns of translocation, storage and interconversion of carbohydrate,” in Effects of Disease on the Physiology of the Growing Plant, ed P. G. Ayres (Cambridge, UK: Cambridge University Press), 47–84.
Whiting, M. L., Li, L., and Usting, S. L. (2004). Predicting water content using Gaussian model on soil spectra. Remote Sens. Eviron. 89, 535–552. doi: 10.1016/j.rse.2003.11.009
Williams, L. E., Lemoine, R., and Saur, N. (2000). Sugar transporters in higher plants - a diversity of roles and complex regulation. Trends Plant Sci. 5, 283–290. doi: 10.1016/S1360-1385(00)01681-2
Wolter, M., Hollricher, K., Salamini, F., and Schulze-Lefert, P. (1993). The mlo resistance alleles to powdery mildew infection in barley trigger a developmentally controlled defence mimic phenotype. Mol. Genet. Genomics 239, 122–128.
Wright, D. P., Baldwin, B. C., Shephard, M. C., and Scholes, J. D. (1995a). Source-sink relationships in wheat leaves infected with powdery mildew. 1. Alterations in carbohydrate metabolism. Physiol. Mol. Plant Pathol. 47, 237–253.
Keywords: crop resistance, phenotyping, multispectral imaging, invertase, Blumeria graminis f.sp. hordei, PhenoLab, classification, support vector machine
Citation: Kuska MT, Behmann J, Großkinsky DK, Roitsch T and Mahlein A-K (2018) Screening of Barley Resistance Against Powdery Mildew by Simultaneous High-Throughput Enzyme Activity Signature Profiling and Multispectral Imaging. Front. Plant Sci. 9:1074. doi: 10.3389/fpls.2018.01074
Received: 04 April 2018; Accepted: 03 July 2018;
Published: 23 July 2018.
Edited by:
Sebastien Christian Carpentier, Bioversity International, BelgiumReviewed by:
Dragan Perovic, Julius Kühn-Institut, GermanyLi Huang, Montana State University, United States
Copyright © 2018 Kuska, Behmann, Großkinsky, Roitsch and Mahlein. This is an open-access article distributed under the terms of the Creative Commons Attribution License (CC BY). The use, distribution or reproduction in other forums is permitted, provided the original author(s) and the copyright owner(s) are credited and that the original publication in this journal is cited, in accordance with accepted academic practice. No use, distribution or reproduction is permitted which does not comply with these terms.
*Correspondence: Matheus T. Kuska, mkuska@uni-bonn.de
Jan Behmann, jbehmann@uni-bonn.de
†These authors have contributed equally to this work.