 Zhengping Peng
 Yanan Liu1
 Duc-Anh An-Vo
95% of researchers rate our articles as excellent or good
Learn more about the work of our research integrity team to safeguard the quality of each article we publish.
Find out more
ORIGINAL RESEARCH article
Front. Plant Sci. , 08 February 2017
Sec. Plant Nutrition
Volume 8 - 2017 | https://doi.org/10.3389/fpls.2017.00160
Nitrogen (N) is an essential macronutrient for plant growth and excessive application rates can decrease crop yield and increase N loss into the environment. Field experiments were carried out to understand the effects of N fertilizers on N utilization, crop yield and net income in wheat and maize rotation system of the North China Plain (NCP). Compared to farmers’ N rate (FN), the yield of wheat and maize in reduction N rate by 21–24% based on FN (RN) was improved by 451 kg ha-1, N uptakes improved by 17 kg ha-1 and net income increased by 1671 CNY ha-1, while apparent N loss was reduced by 156 kg ha-1. The controlled-release fertilizer with a 20% reduction of RN (CRF80%), a 20% reduction of RN together with dicyandiamide (RN80%+DCD) and a 20% reduction of RN added with nano-carbon (RN80%+NC) all resulted in an improvement in crop yield and decreased the apparent N losses compared to RN. Contrasted with RN80%+NC, the total crop yield in RN80%+DCD improved by 1185 kg ha-1, N uptake enhanced by 9 kg ha-1 and net income increased by 3929 CNY ha-1, while apparent N loss was similar. Therefore, a 37–39% overall decrease in N rate compared to farmers plus the nitrification inhibitor, DCD, was effective N control measure that increased crop yields, enhanced N efficiencies, and improved economic benefits, while mitigating apparent N loss. There is considerable scope for improved N use effieincy in the intensive wheat -maize rotation of the NCP.
In recent decades, the growth of global crop yield has mainly been dependent on increasing application rates of synthetic fertilizers, especially nitrogen (N). Further increases of fertilizer rates are unlikely to be as effective in yield improvement as the N use efficiency sharply declines at higher application rates (Tilman et al., 2002). However, more N fertilizer application is expected to be used in cereal cropping systems to meet the grain demand of 9 billion people in the world by 2050 (Ladha et al., 2005).
North China Plain (NCP) is a major grain producing region in China, accounting for 14% of total grain output in the country from predominant winter-wheat and summer-maize rotation systems. For the winter wheat, in the two high-yield crop regions of Gaocheng and Shenzhou cities in NCP, the farmers’ average N application rate is about 300 kg ha-1 (Ma et al., 2015). However, the N application rate of 240 kg ha-1 was recommended to satisfy grain yield and N use efficiency of wheat under the limited irrigation (Li et al., 2011).
For the summer maize, the typical farmers’ N rate was more than 500 kg ha-1 (Cui et al., 2010), but now it is about 417 kg ha-1 (Ma et al., 2015). Results in the winter-wheat and summer-maize rotation system from region-wide experiments demonstrated the economically optimal N rate was from 130 to 160 kg ha-1 per crop for the average grain yield of around 5.5 and 6.0 t ha-1 in wheat and maize, respectively (Cui et al., 2010). It is evident that N application rates far exceed crop requirements for the maximum wheat and maize yields in NCP. Excessive N fertilizer is lost into environment, not only decreasing N use efficiency (Galloway et al., 2008) but also degrading air (Linquist et al., 2012; Shcherbak et al., 2014), soil (Ju et al., 2006) and water quality (Gao et al., 2015). It is therefore desirable to seek effective ways to increase food production while minimizing N loss and its subsequent environmental damage.
To address this problem, many studies have focused on improving fertilization measures through accurate farmland nutrient management technologies, optimizing fertilizer formulae, researching new fertilizer types and regulating N nutrient supply (Alberto et al., 2014; Rusinamhodzi, 2014; Lin et al., 2015; Liu et al., 2015). The new fertilizer types of controlled-release fertilizer (CRF) can increase N use efficiency and crop yield, but it has a higher cost due to the coating materials (Shaviv, 2001). Recently nitrification inhibitors have also been used as a way to reduce N losses and increase N use efficiencies, but only a few such as dicyandiamide (DCD) and 3,4-dimethylpyrazol phosphate (DMPP) have gained commercial importance for practical use. Both DCD and DMPP were found to increase crop yield and N use efficiency and reduce N2O emission from the wheat-maize cropping system (Liu et al., 2013). Nano carbon (NC) has small size, surface effect, adsorption and other features and has been found to improve wetland rice yield by 10.2% and N agronomic efficiency by 40.1% while minimizing N losses when added into urea compared to urea application alone (Wang et al., 2010). However, it is not clear if the beneficial effects of NC would be achieved for the irrigated, dryland wheat and maize cropping systems in NCP. Besides, although the effects of CRF, DCD, and NC have been demonstrated, respectively, by many studies as described above, the relative effectiveness of these measures was seldom reported.
The application of excessive N fertilizer rates can be avoided by taking into account specific-site conditions affecting residual soil N, such as crop management practices and rotation systems. Farmers’ N fertilizer application rates can be adjusted accounting for actual crop needs through accounting for the amount of N left by the previous crop. As a result, the winter-wheat and summer-maize rotation system in NCP was chosen for this study. The overall aims are to (1) determine a reduction in N fertilizer compared to the farmers’ N rate based on local crop planting history and soil N content, without affecting wheat and maize yields; (2) evaluate the effects of lower N rates on wheat and maize yield, N efficiency, net income and apparent N loss using alternative fertilizer formulation; and (3) confirm new fertilizer management strategies to secure wheat and maize production with decreasing N fertilizer rates, cost and loss into the environment.
The experimental site (N 38°49′, E 115°26′, China) is situated within the Science and Technology Park of Hebei Agricultural University, China. The area has a temperate monsoon climate with cold dry winter and hot rainy summer. Annual average temperature is about 12°C, annual average sunshine hours total 2660 h, and the average frost-free period is 210 days. Soil collected from the plow layers (0–20 cm) in the field and determined by the conventional chemical analysis method (Shi, 1976), is typically classified as fluvo-aquic cinnamon soil with pH 8.7, total N 1.26 g kg-1, alkali-hydrolyzable-N 76.5 mg kg-1, available-P 15.1 mg kg-1, available-K 125.4 mg kg-1, and organic matter of 12.0 g kg-1. This experiment was conducted where the winter-wheat and summer-maize rotation system has been practiced for more than 30 years. Winter wheat cultivar was Henong 5274 and the maize cultivar was Zhengdan 958.
Measurements were carried out from the wheat season of 2013 followed by the maize season and repeated in 2014. Seven treatments were set up as CK (zero N), FN (farmers’ N rate), RN (reduction N rate by 21–24% based on N carry over from the previous season and on crop demand), CRF (CRF with the same N rate as RN), CRF80% (CRF with a 20% reduction of RN), RN80%+DCD (a 20% reduction of RN together with DCD, DCD is applied at 0.5% of N fertilizer with a N content of 69.5%), RN80%+NC (20% reduction N rate of RN added with NC, NC is applied at 0.3% of the total fertilizer rates). The same treatment names but different N fertilizer rates were used for wheat and maize. Details of different treatments in wheat and maize seasons are presented in Table 1. The CRF used for wheat is coated by a single layer of resin and has N content of 43%, and by double layers of resin and sulfur for N content of 38% when applied to maize.
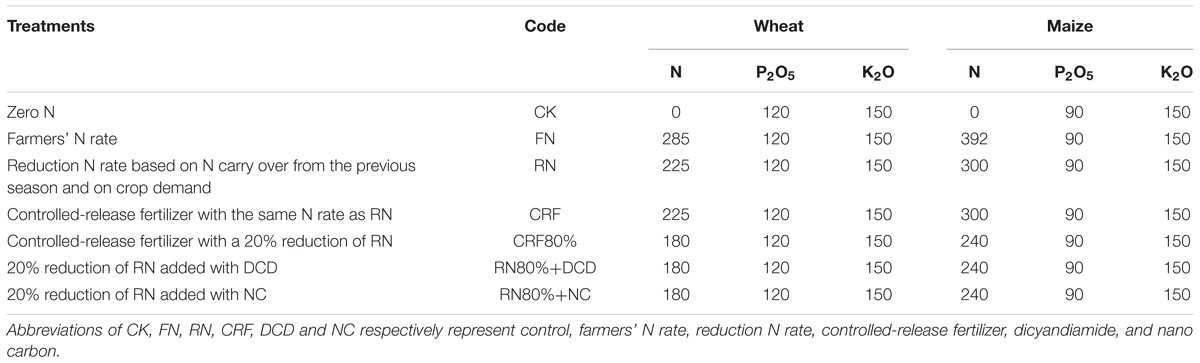
TABLE 1. Fertilizer application rates of treatments in wheat and maize seasons (kg ha-1).
The annual application rates of P and K fertilizers in the forms of calcium superphosphate (P2O5 16%) and potassium sulfate (K2O 60%) were kept identical for seven treatments at the same crop season. In the wheat season, all the P and K fertilizers and 50% of N fertilizer were applied as sowing, and the remaining 50% of N fertilizer was applied as topdressing close to the greening stage coinciding with the first spring irrigation. In the maize season, all the P and K fertilizers and 40% of N fertilizers were applied as sowing, and the remaining 60% of N fertilizer was topdressed close to the jointing stage. Dicyandiamide and NC were applied as both basal fertilizer and by topdressing. Plot size was about 30 m2. Seven treatments with three replicates were arranged in a randomized complete block design.
All wheat basal fertilizers in each treatment were mixed together and broadcasted on the soil surface by hand before planting, followed by land preparation and sowing with machine. Wheat was sown with a seed rate of 187.5 kg ha-1. After wheat harvest, the straw was directly returned into fields. Similarly, all basal fertilizers in each treatment for maize were mixed together and broadcasted on the soil surface by hand, followed by land preparation and sowing seed rate of 37.5 kg ha-1 with machine. Except for the fertilization, other farming practices of all experiment plots were consistent with the farmers’ management methods.
Soil samples from 0–20, 20–40, and 40–60 cm (three random core samples from each plot thoroughly mixed together for each layer) were taken at wheat physiological stages of seeding, greening, jointing, grain filling and maturity and maize growth stages of jointing, silking, grain filling, and maturity. Soil samples were placed in plastic bags and transported to the laboratory, where moist soil was sieved (2 mm), homogenized and stored at 4°C for analyses of NO3--N concentrations. Soil water content was determined gravimetrically after drying for 24 h at 105°C. Soil NO3--N was extracted with 1 mol KCl L-1 with a soil-solution ration of 1:10 and analyzed by continuous flow analysis technique.
For wheat harvest, 1 m long double rows were cut for each plot. Effective spike numbers were counted from 50 selected spikes. All harvested samples were threshed and grain moisture was measured with a crop moisture meter (PM-8188). Grain yield was standardized at 12.5% moisture content. Three samples were weighed to get the average 1000-grain weight for each plot. Straw and grain from some plants were killed at 105°C for 30 min, then dried at 75°C to constant weight and ground into powder to test the total N content using a modified Kjeldahl digestion method (Nelson and Sommers, 1973).
At maize harvest, two representative plants were cut and separated into stem with leaves, grain and ear axis. All aboveground parts of the plants were killed, dried, ground into powder and the total N content determined using the same method as for wheat. The rest of maize ears in each plot were collected and twenty ears with the average weight were chosen to measure bald tip length, ear diameter, ear length, grain number per ear and the 100-grain weight. All maize grains were machine threshed and the grain moisture content was determined using the same method as for wheat grain. Grain yields of maize were standardized at 14% water content.
Crop N efficiency was described by N uptake content and N recovery efficiency (NRE). Using the N element balance principle, N balance status from pre-planting and post-harvest of wheat and maize were calculated (Min et al., 2011). Nitrogen total input was composed of N fertilizer, soil residual N pre-planting, N deposition from dry and wet atmosphere, pre-crop straw return N and mineralized soil N at planting. Nitrogen total output comprised N uptake of crop, soil N post-harvest and apparent N loss. Soil N in 0–60 cm depth was studied. Atmospheric N deposition was derived from Liu et al. (2010). The detailed calculation methods were as follows:
In the economic benefit analysis, production costs included fertilizer and other field management costs. Fertilizer prices in Chinese Yuan (CNY: 1 USD = 6.75 CNY in November 2016) were N 3.9 CNY kg-1, P2O5 5.65 CNY kg-1, K2O 6.5 CNY kg-1, DCD 20 CNY kg-1, NC 260 CNY kg-1, CRF in wheat 4.0 CNY kg-1, and CRF in maize 6.5 CNY kg-1. Field management costs were composed of seed, fertilization and the associated labor costs. Seed costs for wheat and maize were 750 CNY ha-1 and 600 CNY ha-1, respectively. Labor cost for fertilization was 1500 CNY ha-1 per application (zero in CK, once in CRF and CRF80%, and twice in other N treatments). Irrigation, insecticide spray, mechanical sowing and reaping costs in wheat and maize were 2672.3 and 2656.5 CNY ha-1, respectively. Grain prices of wheat and maize at harvest were 2.0 and 2.2 CNY kg-1, respectively.
Grain yields of wheat and maize, yield components and the total N content in plant were obtained from three replicates of each treatment at harvest. The data were statistically analyzed using one-way ANOVA, and the mean values were compared by Duncan’s multiple range test at the 5% levels using the SAS (Cary, 2008). Differences between treatments in all tables were tested at the P ≤ 0.05.
As shown in Table 2, the application of N fertilizer significantly increased the effective spikes, grain number per spike, 1000-grain weight and grain yield of wheat as compared with CK. Relative to FN, the effective spikes and grain number per spike was not significant in other treatments, but 1000-grain weight in RN80%+DCD and grain yields in CRF80%, RN80%+DCD and RN80%+NC were significantly increased. Grain yields in CRF80%, RN80%+DCD and RN80%+NC with N fertilizer rates of 180 kg ha-1 were 16% more than that in RN with N fertilizer rate of 225 kg ha-1. There was no significant difference among CRF80%, RN80%+DCD and RN80%+NC. Grain yield in CRF80% was higher by 6.3% as compared to CRF, despite a 20% reduction and could be further improved by additional control measures such as RN80%+DCD and RN80%+NC.
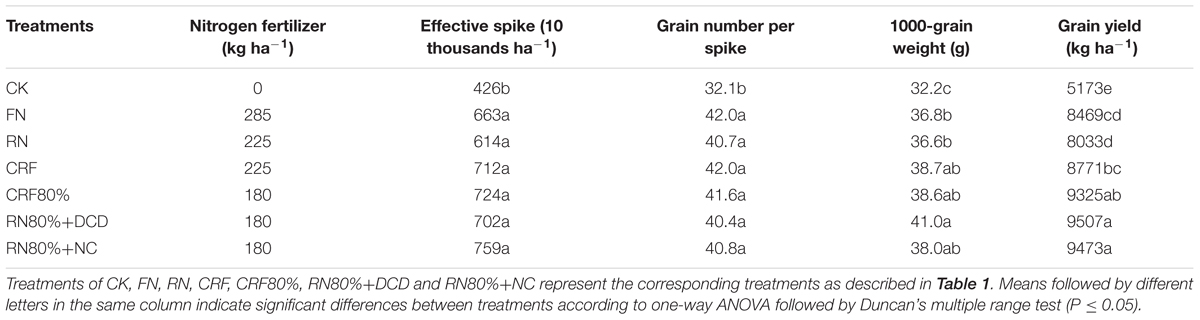
TABLE 2. Wheat yield and yield components with different N control measures.
For maize, ear diameter, ear length, grain number per ear, 100-grain weight and grain yield in all N fertilizers treatments were higher than those of CK, especially grain number per ear and grain yield (Table 3), while the bald tip length was significantly decreased by different N fertilizer treatments. Compared with FN, grain yields in RN, CRF80% and RN80%+DCD increased by 11.1, 17.1, and 14.8%, respectively. Grain yields in CRF80% and RN80%+DCD were about 4% more than that in RN. Among the N fertilizer rates of 240 kg ha-1, grain yields in CRF80% and RN80%+DCD were higher than that in RN80%+NC and there was no significant difference between CRF80% and RN80%+DCD. Grain yield in CRF80% was 15.5% more than CRF. These results illustrate that maize grain yield was not negatively impacted by the reduction in N rate relative to FN and could be enhanced through additional control measures such as CRF80% and RN80%+DCD.
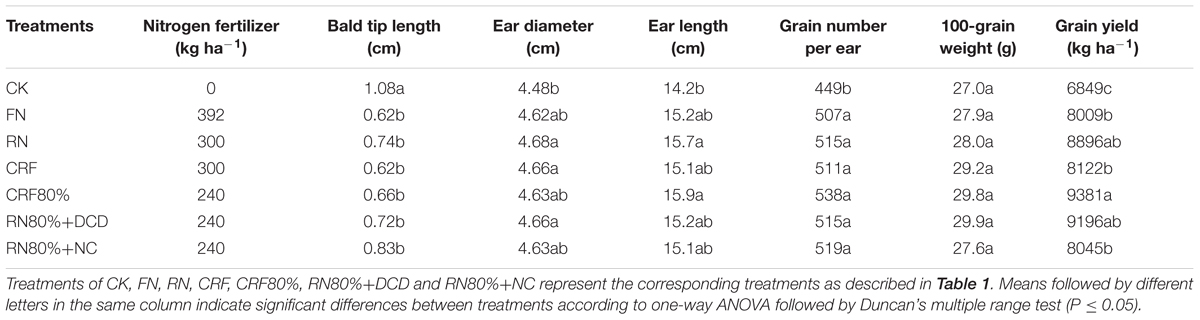
TABLE 3. Maize yield and yield components with different N control measures.
Nitrogen uptakes and recovery efficiencies of wheat and maize in different N control measures are described in Table 4. Nitrogen uptakes of wheat and maize in all N fertilizers were significantly increased by 24.1–34.2 and 28.4–36.1%, respectively, compared with those in CK. There were no significant differences among all N fertilizers. NREs of RN in wheat and maize were enhanced by 8.0 and 6.8% in contrast with FN. Compared to RN, NREs of CRF80%, 80%+DCD and RN80%+NC in wheat and maize were significantly increased by 7.6–13.3 and 4.2–7.4%, respectively. NREs of RN80%+DCD in wheat and maize were the highest among all N fertilizers. It is clear that the farmers’ N fertilizer rates are high and a reduction in RN based on N carry over from the previous season and on crop demand, coupled with different N control measures, could increase crop N efficiency.
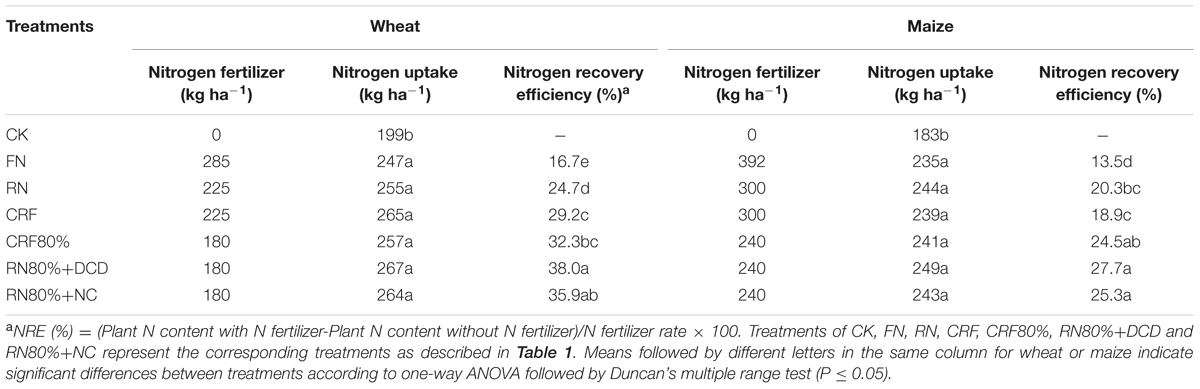
TABLE 4. Crop N uptake and recovery efficiencies with different N control measures.
The economic benefit analyses with different N control measures are shown in Table 5. Compared with FN, the net incomes in CRF, CRF80%, RN80%+DCD and RN80%+NC of wheat increased by 1123–2648 CNY ha-1 (14.5–34.2% improvement), while the net incomes in RN, CRF80% and RN80%+DCD for maize enhanced by 1941–2962 CNY ha-1 (23.2–35.5% improvement). Net incomes of CRF80%, RN80%+DCD, and RN80%+NC in wheat were all higher than that of RN, but for maize only net income of RN80%+DCD was higher.
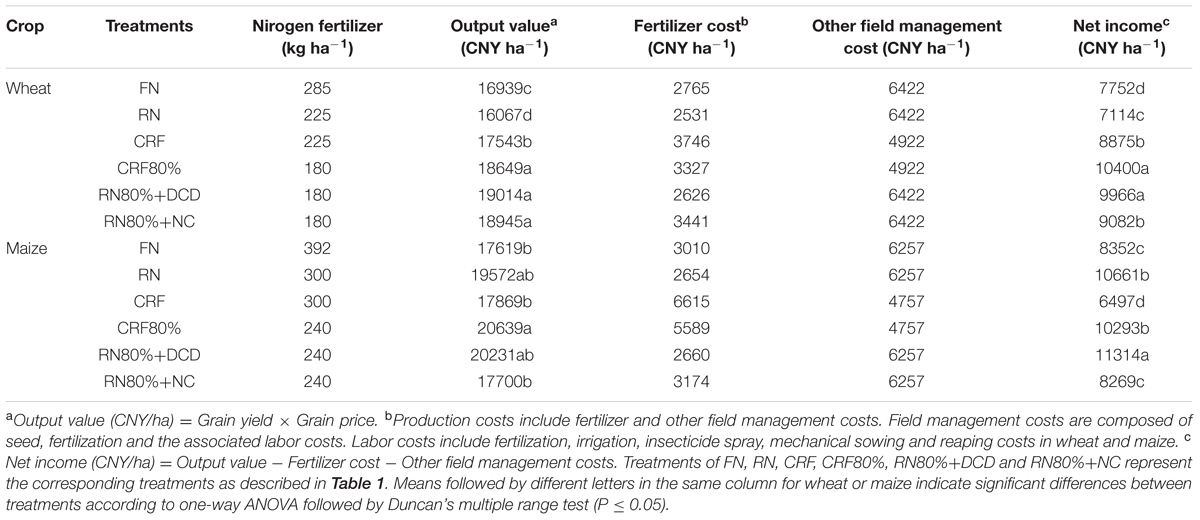
TABLE 5. Crop economic benefit analyses with different N control measures.
Among all treatments in wheat, net income was the highest in CRF80% and second highest in RN80%+DCD with values of 10400 and 9966 CNY ha-1, respectively(34.2 and 28.6% improvement compared with FN). Although the output value in RN80%+DCD was the highest (19014 CNY ha-1), it required two application of fertilizer as basal and topdressing resulting in higher labor cost and lower net income. In CRF80% treatment with single resin coating the fertilizer cost was higher (701 CNY ha-1) but other field management costs decreased by 1500 CNY ha-1 resulting in a net income increase of 434 CNY ha-1. Therefore, CRF80% was the best treatment resulting in higher net income.
For maize, among all treatments net income was the highest in RN80%+DCD (11314 CNY ha-1) and lowest in CRF (6497 CNY ha-1). Output value in CRF80% was the highest (20639 CNY ha-1) with only one fertilizer application cost. However, the high fertilizer cost of CRF80% (2929 CNY ha-1) resulted in lower net income (1021 CNY ha-1) than in RN80%+DCD. Therefore, RN80%+DCD was the best resulting in improved grain yield and higher net income.
During the wheat and maize growth stages, soil NO3--N contents varied depending on the N control measures applied (Figure 1). Soil NO3--N of CK in different soil layers was the lowest, about 10 kg ha-1.
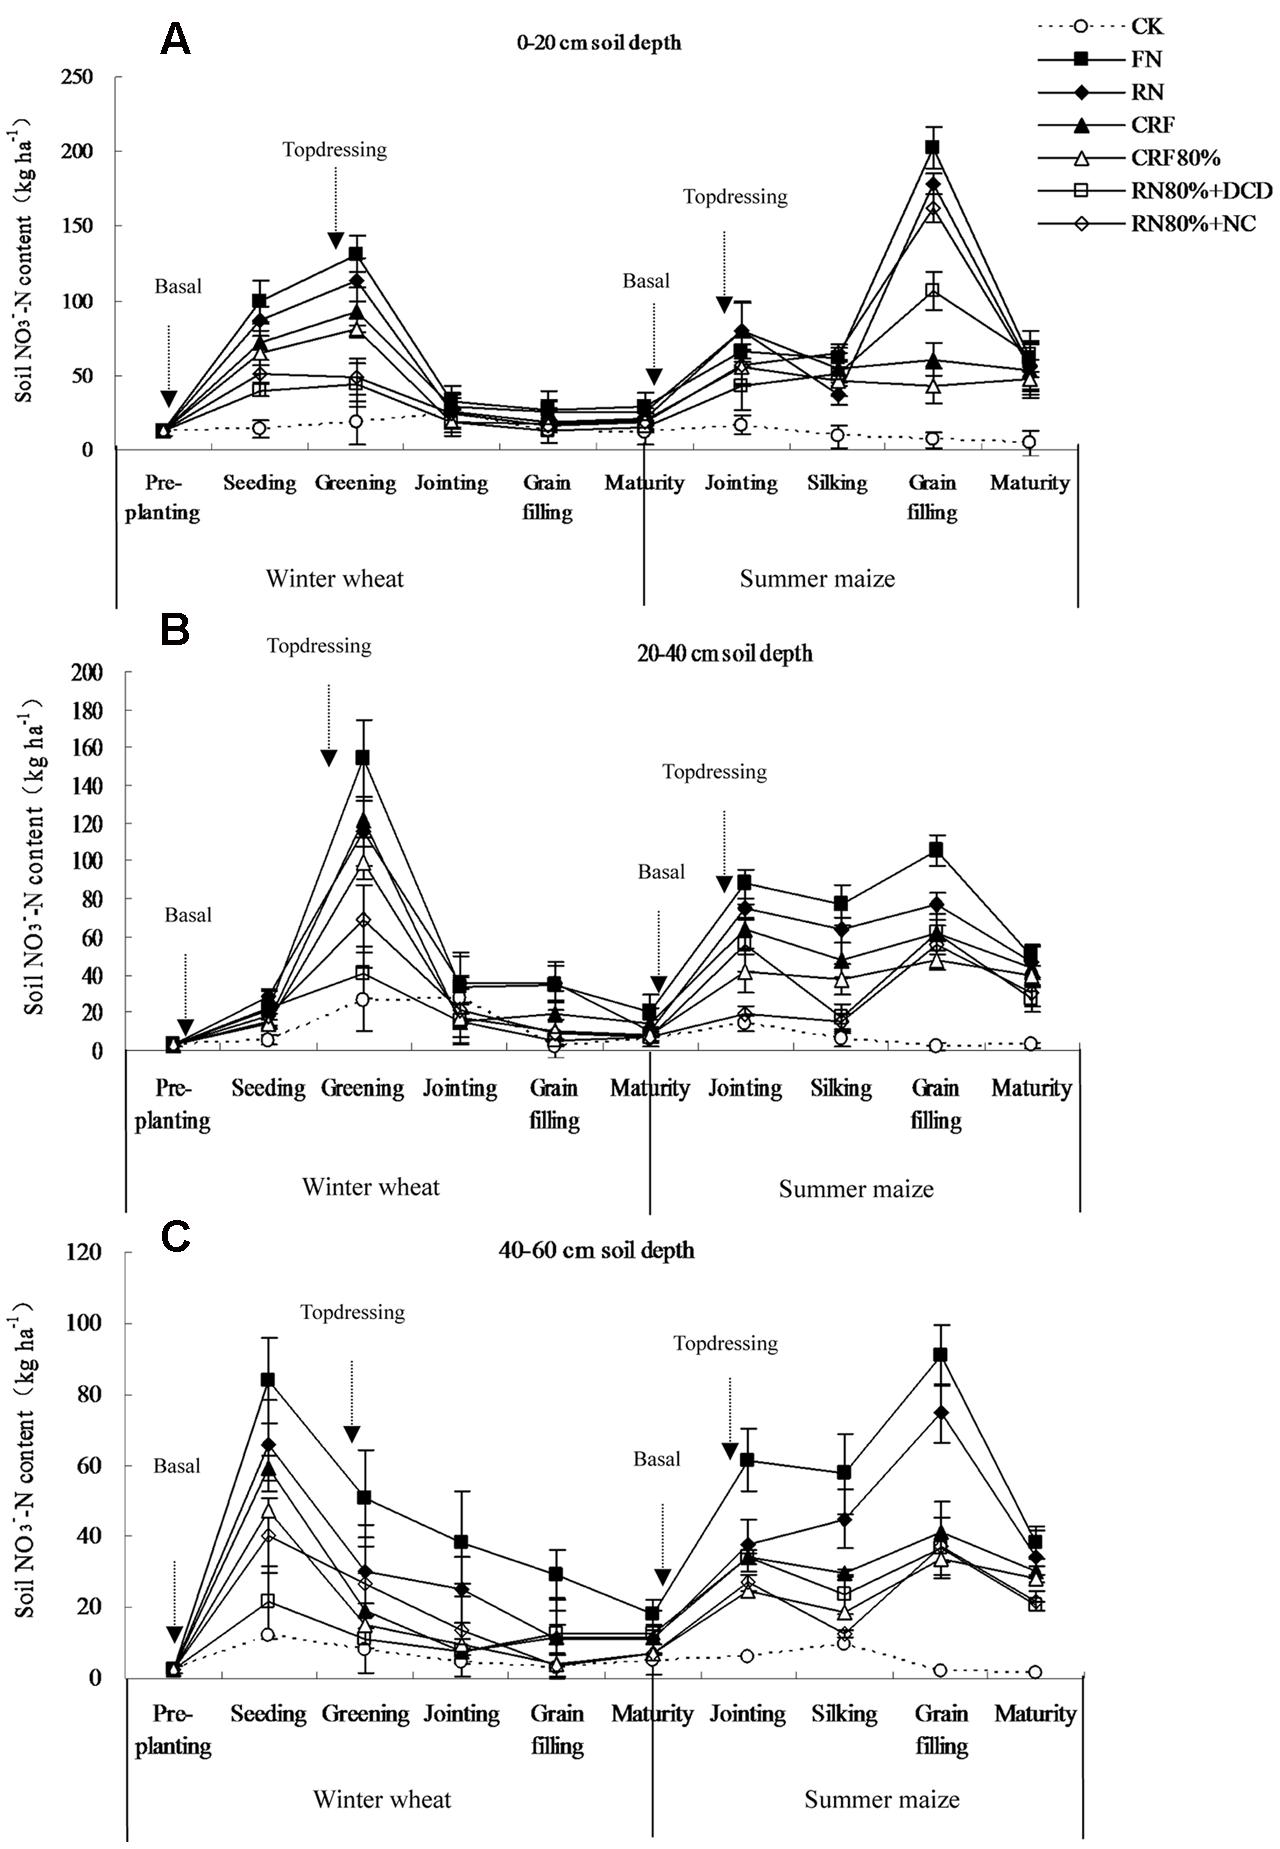
FIGURE 1. Temporal and spatial variations of soil NO3--N content with different N control measures. (A) 0–20 cm soil depth, (B) 20–40 cm soil depth, and (C) 40–60 cm soil depth. The bars denote standard deviation of the three replicates. Treatments of CK, FN, RN, CRF, CRF80%, RN80%+DCD, and RN80%+NC represent the corresponding treatments as described in Table 1. Basal and topdressing are the times of fertilization. Treatments of FN, RN, RN80%+DCD and RN80%+NC are topdressed, while CK, CRF, and CRF80% not.
With wheat plant growth in different soil layers, soil NO3--N among all the treatments increased at the beginning, then declined sharply between greening and jointing stage before settling at a steady level. The peak values of soil NO3--N in 0–20 and 20–40 cm soil depths were both at the greening stage, while in 40–60 cm soil depth it was at the seeding stage. With the maize plant growth in different soil layers, soil NO3--N in all N fertilizer treatments rose to the jointing stage, then reduced before rapidly rising again from silking to grain filling stages followed by further sharp decline.
Under the same stage of crop and among all the treatments, soil NO3--N in FN was higher than that in RN, CRF was more than CRF80%, while CRF80%, RN80%+DCD and RN80%+NC were higher than RN.
With the decrease of N application rate, soil N at post-harvest and apparent N loss were both reduced in wheat and maize seasons (Table 6). In the wheat season, the N fertilizer rate and apparent N loss of RN were lower by 60 and 42.7 kg ha-1 than those in FN, and apparent N loss of RN was higher by 12.1 kg ha-1 compared to CRF. Nitrogen fertilizer application rate and apparent N loss in CRF were higher by 45 and 27.8 kg ha-1 in comparison with CRF80%. Relative to RN, N fertilizer application rates in CRF80%, RN80%+DCD and RN80%+NC decreased by 45 kg ha-1 and apparent N losses reduced by 39.9–50.2 kg ha-1. Under the N fertilizer rates of 180 kg ha-1, apparent N loss in RN80%+DCD was the lowest.
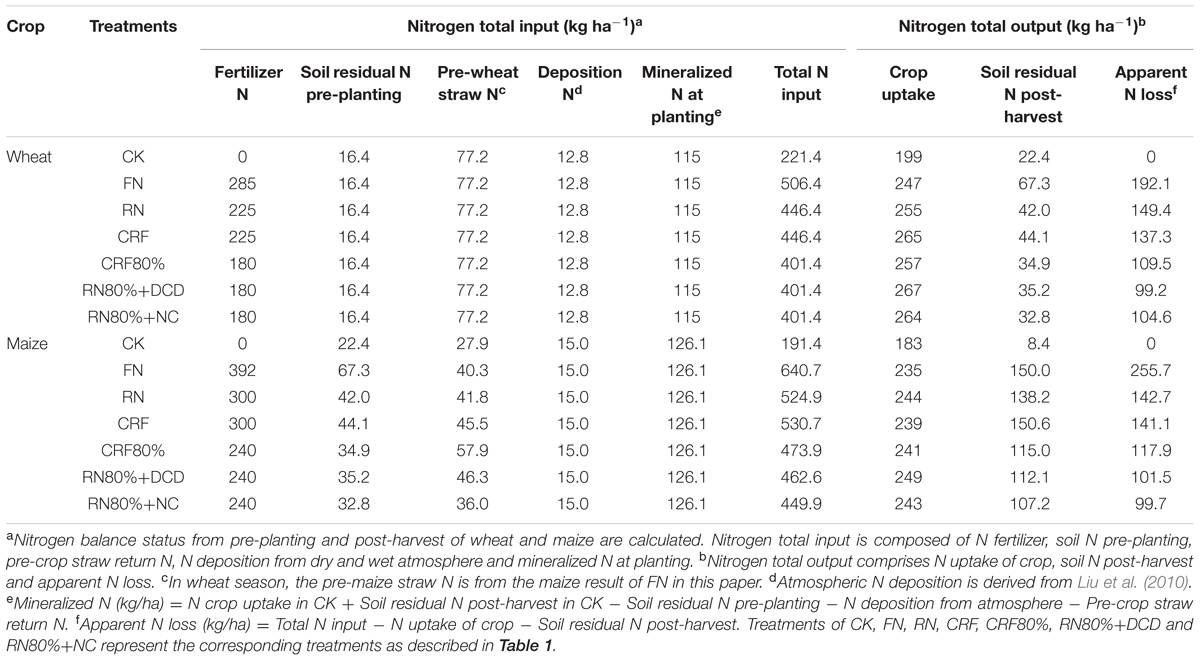
TABLE 6. Nitrogen balance in the soil depth of 0–60 cm with different N control measures.
For the maize, N fertilizer application rate, N total input and apparent N loss of RN were lower by 92, 115.8, and 113 kg ha-1 relative to those in FN. Apparent N loss in RN was slightly higher than that in CRF with the same N rates. Nitrogen fertilizer rate, N total input and apparent N loss in CRF were higher by 60, 56.8, and 23.2 kg ha-1 than those in CRF80%. Compared with RN, N fertilizer rates in CRF80%, RN80%+DCD and RN80%+NC decreased by 60 kg ha-1, total N input reduced by 51–75 kg ha-1 and their apparent N losses reduced by 24.8–43 kg ha-1. Under the N fertilizer rates of 240 kg ha-1, apparent N loss in RN80%+DCD was higher than that in RN80%+NC and lower than that in CRF80%.
These results showed RN80%+DCD and RN80%+NC could improve the wheat and maize yields and reduce N loss compared to FN and RN.
Grain production has grown dramatically mainly due to increased application of N fertilizer. In NCP, under the temperate semi-humid farming conditions, urea applied to the soil is transformed into nitrate within 1–2 weeks. Together with the high application rate of N fertilizer and the crop’s low N recovery there is substantial accumulation of residual nitrate in the soil profile (Ju et al., 2007). In practice the N fertilizer rate should be adjusted according to the residual nitrate and the local conditions. In our experiment, the N rates in FN were 285 and 392 kg ha-1, respectively in wheat and maize, while the rates in RN were 225 and 300 kg ha-1 according to the crop yield, soil fertility, irrigation conditions, pre-plant straw return and many years of field experiment results in NCP. Grain yields of wheat and maize had no significant difference between FN and RN (Tables 2 and 3). NREs of RN in wheat and maize were both enhanced, relative to FN (Table 4). Farmers’ N had excessive N fertilizer rates without additional crop demand leading to more apparent N loss in wheat and maize compared to RN (Table 6). Under the same crop growth stage and different soil depths, soil NO3--N in RN was lower as compared to FN (Figure 1).
From the whole rotation system, compared to FN, the total crop yield of wheat and maize in RN was unchanged, N uptakes improved by 17 kg ha-1, net income increased by 1671 CNY ha-1, while apparent N loss reduced by 156 kg ha-1 (Table 7). As a result, the proposed reduction N application rate does not negatively affect the wheat and maize total grain yields, but improves N efficiency and net income, decreases the production cost and N loss into agricultural soil.
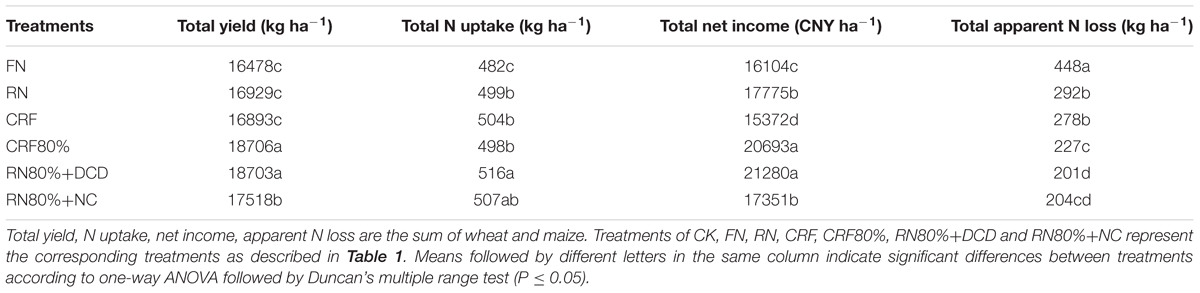
TABLE 7. Total analyses of winter wheat and summer maize with different N control measures.
Some N control measures can further reduce N rate without influencing the crop growth. An example is CRF commonly coated by sulfur, polyethylene, polyvinyl chloride, latex, oil, attapulgite, and other synthetic substances (Guan et al., 2014). Forms of CRF significantly improved yields of wheat (Yang et al., 2011), corn (Ding et al., 2011) and other crops reducing the amount of fertilizer and the labor costs. Despite the environmental and agronomic benefits offered by CRF, their practical use in agriculture is still very limited by high price associated with the complex coating technologies.
In our study, the cost of CRF wrapped by single layer of resin in wheat was less than that wrapped by double layers of resin and sulfur for use with maize. Under the same N fertilizer rate, compared with RN, grain yield in CRF wheat was higher by 9.2% (Table 2), but maize yield was 8.7% lower (Table 3). This conflicting result might be due to different climate conditions and coated materials for wheat and maize (Yu et al., 2010). NRE in CRF as compared to RN improved by 4.5% for wheat (Table 4) but no difference was found in maize. The net income in wheat increased, while in maize reduced (Table 5), and apparent N losses decreased both in wheat and maize (Table 6). From the total rotation system, relative to RN, the total crop yield and N uptake in CRF were similar, while total net income decreased by 2403 CNY ha-1 (Table 7). Yields, N uptakes, NREs, net income for both wheat and maize in CRF80% were all higher and apparent N losses lower than those in CRF and RN (Tables 2–7).
Under the same crop growth stage and different soil depths, soil NO3--N in CRF was lower than that in RN, but higher than that in CRF80% (Figure 1). These results indicate that CRF with rational N rates can improve crop yield and N efficiencies, reduce the amount of fertilizer and the labor costs, reduce N leaching losses into environment. However, because of its expensive coating cost, the net income was not high, especially for maize. Possibly, improved technologies producing cheaper CRF, together with optimal design of fertilizer composition and coatings can achieve better effects in future.
The total yield and net incomes of wheat and maize in CRF80% were similar with that in RN80%+DCD, but total yield was 6.8% higher (1188 kg ha-1) than in RN80%+NC. Compared to RN, total N uptake of wheat and maize in 80%+DCD improved by 17 kg ha-1. For both crops total apparent N loss in RN80%+DCD was the lowest (Table 7). The higher N uptake (Table 3) and plant recovery efficiency (Table 4) probably explain the lower N loss in RN80%+DCD.
Under normal conditions, free NH4+ does not exist and most of the inorganic N occurs as NO3- in the soil (Liu et al., 2013). Nitrogen application rates had little affect on NH4+-N content in the 0–100 cm soil profiles, but led to excess NO3--N accumulated in the 0–100 cm soil profile (Fang et al., 2006). In our experiment, the NH4+-N content in the 0–60 cm soil profiles was very little, so only the soil NO3--N content was studied. Application of DCD shifts the primary form of soil inorganic N from NO3- to NH4+ (Weiske et al., 2001) and may increase the ratio of NH4+/NO3-. Previous results also have indicated that wheat and maize produce higher yields and dry matter when supplied with mixtures of NH4+ and NO3- than only with one of them (Manuel et al., 1992; Smiciklas and Below, 1992). Once applied to soil, DCD is susceptible to biodegradation but was reported to increase wheat and rice yields (Bhatia et al., 2010), although a slight reduction in crop yield was reported by Mahmood et al. (2011).
As has been reported by Wang et al. (2010) NC could increase rice yield and minimize N loss in wetland, results from the present study verified that these effects of NC (RN80%+NC) could be achieved in the irrigated dryland wheat and maize production as well. Moreover, comparing to RN80%+NC, the crop total yield, N utilization and net income in RN80%+DCD were further enhanced while the total apparent N loss was unchanged (Table 7).
Therefore, RN80%+DCD could be proposed as an effective N control measure by increasing yields, enhancing N utilization, boosting economic benefit and mitigating N loss although N loss was still substantial (Table 7). Consequently, further studies on measures to decrease N loss are warranted.
Increasing crop productivity and improving N efficiency are not only related to maximizing the biological potential of crops, but also necessary for the sustainability of China’s agricultural production. We found a reduction in N application rate based on N carry over from the previous season and on crop demand did not affect the total wheat and maize grain yields relative to the farmers’ N rate in the rotation system, but improved N efficiency and net income, while decreasing the production cost and apparent N loss into the environment. An overall reduction of the N rate by 37–39% compared to farmers’ N, together with different control measures, using DCD was the most effective N control measure that increased yields, enhanced N utilization and economic benefit, while mitigating N loss.
ZP design and direct the experiment, also write this paper. YLiu, YLi, YW, and MM do the experiment, sample soil and plant, determine samples of soil and plant, deal with data, make tables and figures. YA and D-AA-V give the guidance of experiment design and revise the English language.
This work was supported by the 12th Five-year National Technologies Program (No. 2013BAD11B03), Hebei Province Natural Science Fund (C2016204078), National Basic Research Program of China (973 Program) (No. 2012CB955904), the National Natural Science Foundation program (No. 41105115), Young Academic Leaders Program of Agricultural University of Hebei and Study Abroad Program for Young Teachers by Agricultural University of Hebei.
The authors declare that the research was conducted in the absence of any commercial or financial relationships that could be construed as a potential conflict of interest.
The authors thank Q. L. Zhao, the director of the Science and Technology Park of Hebei Agricultural University, China for allowing us to conduct this research and for his help in the field. We would also like to thank W. C. Wang for his assistance in the field.
Alberto, S. C., Diego, A., Ana, M., Laura, S. M., and Antonio, V. (2014). Soil moisture determines the effectiveness of two urease inhibitors to decrease N2O emission. Mitig. Adapt. Strateg. Glob. Change 149, 1–14. doi: 10.1007/s11027-014-9548-5
Bhatia, A., Sasmal, S., Jain, N., Pathaka, H., Kumarb, R., and Singh, A. (2010). Mitigating nitrous oxide emission from soil under conventional and no-tillage in wheat using nitrification inhibitors. Agr. Ecosyst. Environ. 136, 247–253. doi: 10.1016/j.agee.2010.01.004
Cui, Z. L., Chen, X. P., and Zhang, F. S. (2010). Current N management status and measures to improve the intensive wheat–maize system in China. Ambio 39, 376–384. doi: 10.1007/s13280-010-0076-6
Ding, H., Zhang, Y. S., Qin, S. J., Li, W. H., and Li, S. Q. (2011). Effects of 15nitrogen labeled gel based controlled-release fertilizer on dry matter accumulation and the nutrient uptake efficiency of corn. Commun. Soil Sci. Plan 42, 1594–1605. doi: 10.1080/00103624.2011.581726
Fang, Q. X., Yu, Q., Wang, E. L., Chen, Y. H., Zhang, G. L., Wang, J., et al. (2006). Soil nitrate accumulation, leaching and crop nitrogen use as influenced by fertilization and irrigation in an intensive wheat–maize double cropping system in the North China Plain. Plant Soil 284, 335–350. doi: 10.1007/s11104-006-0055-7
Galloway, J. N., Townsend, A. R., Erisman, J. W., Bekunda, M., Cai, Z. C., Freney, J. R., et al. (2008). Transformation of the N cycle: recent trends, questions, and potential solutions. Science 320, 889–892. doi: 10.1126/science.1136674
Gao, W., Howarth, R. W., Swaney, D. P., Honq, B., and Guo, H. C. (2015). Enhanced N input to Lake Dianchi Basin from 1980 to 2010: drivers and consequences. Sci. Total Environ. 505, 376–384. doi: 10.1016/j.scitotenv.2014.10.016
Guan, Y., Song, C., Gan, Y. T., and Li, F. M. (2014). Increased maize yield using slow-release attapulgite-coated fertilizers. Agron. Sustain. Dev. 34, 657–665. doi: 10.2134/jeq2011.0194
Ju, X. T., Kou, C. L., Zhang, F. S., and Christie, P. (2006). Nitrogen balance and groundwater nitrate contamination: comparison among three intensive cropping systems on the North China Plain. Environ. Pollut. 143, 117–125. doi: 10.1016/j.envpol.2005.11.005
Ju, X. T., Liu, X. J., Pan, J. R., and Zhang, F. S. (2007). Fate of 15N-labeled urea under a winter wheat-summer maize rotation on the North China Plain. Pedosphere 17, 52–61. doi: 10.1016/S1002-0160(07)60007-1
Ladha, J. K., Pathak, H., Krupnik, T. J., Six, J., and Kessel, C. (2005). Efficiency of fertilizer nitrogen in cereal production: retrospects and prospects. Adv. Agron. 87, 86–156. doi: 10.1016/S0065-2113(05)87003-8
Li, R. Q., Li, Y. M., He, J. X., Li, G. C., Hao, X. C., and Wang, F. (2011). Effect of N application rate on N utilization and grain yield of winter wheat. J. Triti. Crops 31, 271–275.
Lin, Z. A., Chang, X. H., Wang, D. M., Zhao, G. C., and Zhao, B. Q. (2015). Long-term fertilization effects on processing quality of wheat grain in the North China Plain. Field Crop Res. 174, 55–60. doi: 10.1016/j.fcr.2015.01.008
Linquist, B., Groenigen, K. J., Adviento-Borebe, M. A., Pittelkow, C., and Kessel, C. (2012). An agronomic assessment of greenhouse gas emissions from major cereal crops. Glob. Change Biol. 18, 194–209. doi: 10.1111/j.1365-2486.2011.02502.x
Liu, C., Wang, K., and Zheng, X. (2013). Effects of nitrification inhibitors (DCD and DMPP) on nitrous oxide emission, crop yield and N uptake in a wheat–maize cropping system. Biogeosci. Discuss. 10, 711–737. doi: 10.5194/bgd-10-711-2013
Liu, X. J., Song, L., He, C. E., and Zhang, F. S. (2010). Nitrogen deposition as an important nutrient from the environment and its impact on ecosystems in China. J. Arid Land 2, 137–143. doi: 10.3724/SP.J.1227.2010.00137
Liu, Y. N., Li, Y. C., Peng, Z. P., Wang, Y. Q., Ma, S. Y., Guo, L. P., et al. (2015). Effects of different N fertilizer management practices on wheat yields and N2O emissions from wheat fields in North China. J. Integr. Agric. 14, 1184–1191. doi: 10.1016/S2095-3119(14)60867-4
Ma, S. Y., Liu, Y. N., Wang, Y. Q., Qin, Y. N., Liu, H. L., and Peng, Z. P. (2015). Study on the characters of living condition and nutrient balance of high-yield wheat and maize rotation system in Hebei province. J. Agric. Univ. 38, 8–13.
Mahmood, T., Ali, R., Latif, Z., and Ishaque, W. (2011). Dicyandiamide increases the fertilizer N loss from an alkaline calcareous soil treated with 15N-labelled urea under warm climate and under different crops. Biol. Fert. Soils 47, 619–631. doi: 10.1007/s00374-011-0559-z
Manuel, S. V., Gabriel, A. G., Juan, L. T., and Andres, A. S. (1992). Effect of the NH4/NO3 ratio on GS and PEPCase activities and on dry matter production in wheat. J. Plant Nutr. 15, 2545–2557. doi: 10.1080/01904169209364493
Min, J., Zhao, X., Shi, W. M., Xing, G. X., and Zhu, Z. L. (2011). Nitrogen balance and loss in a greenhouse vegetable system in Southeastern China. Pedosphere 21, 464–472. doi: 10.1016/S1002-0160(11)60148-3
Nelson, D. W., and Sommers, L. E. (1973). Determination of total N in plant material. Agron. J. 65, 109–112. doi: 10.2134/agronj1973.00021962006500010033x
Rusinamhodzi, L. (2014). Conservation Agriculture. Switzerland: Springer International Publishing, 21–37. doi: 10.1007/978-3-319-11620-4-2
Shaviv, A. (2001). Advances in controlled-release fertilizers. Adv. Agron. 71, 1–49. doi: 10.1016/S0065-2113(01)71011-5
Shcherbak, I., Millar, N., and Robertson, G. P. (2014). Global metaanalysis of the nonlinear response of soil nitrous oxide (N2O) emissions to fertilizer Nitrogen. PNAS 111, 9199–9204. doi: 10.1073/pnas.1322434111
Smiciklas, K. D., and Below, F. E. (1992). Role of cytokinin in enhanced productivity of maize supplied with NH4+ and NO3-. Plant Soil 142, 307–313. doi: 10.1007/BF00010976
Tilman, D., Cassman, K. G., Matson, P. A., Naylor, R., and Polasky, S. (2002). Agricultural sustainability and intensive production practices. Nature 418, 671–677. doi: 10.1038/nature01014
Wang, X. Y., Ma, G. H., Di, H., Tian, X. H., and Wang, Y. (2010). Effects of NMUrea on rice yield and agronomic nitrogen efficiency. Plant Nutr. Fert. Sci. 16, 1479–1485.
Weiske, A., Benckiser, G., Herbert, T., and Ottow, J. (2001). Influence of the nitrification inhibitor 3,4-dimethylpyrazole phosphate (DMPP) in comparison to dicyandiamide (DCD) on nitrous oxide emissions, carbon dioxide fluxes and methane oxidation during 3 years of repeated application in field experiments. Biol. Fert. Soils 34, 109–117. doi: 10.1007/s003740100386
Yang, Y. C., Zhang, M., Zheng, L., Cheng, D. D., Liu, M., and Geng, Y. Q. (2011). Controlled release urea improved nitrogen use efficiency, yield, and quality of wheat. Agron. J. 103, 479–485. doi: 10.2134/agronj2010.0343
Keywords: apparent nitrogen loss, maize, net income, nitrogen efficiency, nitrogen fertilizer measures, wheat
Citation: Peng Z, Liu Y, Li Y, Abawi Y, Wang Y, Men M and An-Vo D-A (2017) Responses of Nitrogen Utilization and Apparent Nitrogen Loss to Different Control Measures in the Wheat and Maize Rotation System. Front. Plant Sci. 8:160. doi: 10.3389/fpls.2017.00160
Received: 15 March 2016; Accepted: 25 January 2017;
Published: 08 February 2017.
Edited by:
Richard William Bell, Murdoch University, AustraliaReviewed by:
Kaushik Majumdar, International Plant Nutrition Institute, IndiaCopyright © 2017 Peng, Liu, Li, Abawi, Wang, Men and An-Vo. This is an open-access article distributed under the terms of the Creative Commons Attribution License (CC BY). The use, distribution or reproduction in other forums is permitted, provided the original author(s) or licensor are credited and that the original publication in this journal is cited, in accordance with accepted academic practice. No use, distribution or reproduction is permitted which does not comply with these terms.
*Correspondence: Zhengping Peng, cGVuZ3poZW5ncGluZ0BzaW5hLmNvbQ==
Disclaimer: All claims expressed in this article are solely those of the authors and do not necessarily represent those of their affiliated organizations, or those of the publisher, the editors and the reviewers. Any product that may be evaluated in this article or claim that may be made by its manufacturer is not guaranteed or endorsed by the publisher.
Research integrity at Frontiers
Learn more about the work of our research integrity team to safeguard the quality of each article we publish.