- Crop Improvement Section, ICAR- National Professor Project, ICAR- Indian Institute of Rice Research, Hyderabad, India
Advanced backcross introgression lines (BILs) developed from crosses of Oryza sativa var. Swarna/O. nivara accessions were grown and evaluated for yield and related traits. Trials were conducted for consecutive three seasons in field conditions in a randomized complete block design with three replications. Data on yield traits under irrigated conditions were analyzed using the Additive Main Effect and Multiplicative Interaction (AMMI), Genotype and Genotype × Environment Interaction (GGE) and modified rank-sum statistic (YSi) for yield stability. BILs viz., G3 (14S) and G6 (166S) showed yield stability across the seasons along with high mean yield performance. G3 is early in flowering with high yield and has good grain quality and medium height, hence could be recommended for most of the irrigated locations. G6 is a late duration genotype, with strong culm strength, high grain number and panicle weight. G6 has higher yield and stability than Swarna but has Swarna grain type. Among the varieties tested DRRDhan 40 and recurrent parent Swarna showed stability for yield traits across the seasons. The component traits thousand grain weight, panicle weight, panicle length, grain number and plant height explained highest genotypic percentage over environment and interaction factors and can be prioritized to dissect stable QTLs/ genes. These lines were genotyped using microsatellite markers covering the entire rice genome and also using a set of markers linked to previously reported yield QTLs. It was observed that wild derived lines with more than 70% of recurrent parent genome were stable and showed enhanced yield levels compared to genotypes with higher donor genome introgressions.
Introduction
Improving rice production per unit area and per unit time will be a major challenge in future due to the expanding population of rice consumers in the world. The average yield of existing cultivars reached a plateau and now research is directed toward wild relatives of Oryza to explore novel genes that can improve yield traits. Wild relatives were widely explored as donors for stress resistance and less exploited for yield improvement because of non-preferable agronomic traits linked with them. Wild rice genotypes provide a diverse range of allelic variation due to their adaption to a wide range of environmental conditions. Wild and related genotypes are valuable resources to explore novel variations to widen the genetic background of cultivated rice (Brar and Khush, 1997; Tanksley and McCouch, 1997; Swamy and Sarla, 2008; Wickneswari et al., 2012). Introgression of chromosomal segments from wild species into cultivated species can also generate de-novo variations in the new genetic background (Wang et al., 2005).
Back cross introgression lines developed from wild and adapted genotypes are useful in diversifying existing germplasm in more usable form and also in discovering novel genes/QTLs. As BILs have maximum genome of recurrent parent with few donor segments, it is advantageous to use them for precise estimation of quantitative traits. Fixed BILs can be replicated and can be used to study their environment interactions. The evaluation of the BILs for stability is very important especially when it is derived from an interspecific cross, as it takes more time to attain stability in the new back ground. Utilization of stable BILs will accelerate varietal development due to the presence of novel genes in an adapted parental background (Jeuken and Lindhout, 2004).
As grain yield is a complex quantitative trait, with high environmental interaction; selection of genotypes based on performance in single environment is not effective for varietal identification (Shrestha et al., 2012). It is essential to carry out selection based on yield stability evaluation than average performance in multiple environment conditions (Kang, 1993; Tariku et al., 2013; Islam et al., 2015). Selection of genotypes for stability and adaptability is required prior to recommendation in case of a crop such as rice which is grown in diverse ecologies. Stability is the suitability of a variety over a wide range of environments while adaptability is the better survival of a genotype over any specific environment. This can be attained through either genetic or physiological homeostasis of genotypes for environmental fluctuations (Singh and Narayanan, 2006). For cultivation in large area it is stability for yield traits which is desirable but for achieving maximum productivity, it is adaptability to best target environments that is preferred.
Effects of genotype, environment and genotype × environment interaction determine the phenotypic performance and its general and specific adaptation to different environments (Falconer and Mackey, 1996). This information is required for planning better selection strategies and to identify the best environment to select genotypes for grain yield (Gauch and Zobel, 1996; Kang, 1998). Several studies have been conducted on stability performance for grain yield of rice for different ecosystems (Cooper et al., 1999; Wade et al., 1999; Ouk et al., 2007; Anandan et al., 2009; Kumar et al., 2012; Tariku et al., 2013; Liang et al., 2015; Katsura et al., 2016). Many such studies showed that genotype × environment interaction was more significant than genotypic main effects (Henderson et al., 1996; Cooper and Somrith, 1997; Wade et al., 1997, 1999; Cooper et al., 1999; Inthapanya et al., 2000).
There are several methods to study stability and genotype × environment interactions of traits through conventional analysis. Different models were proposed on stability variance, ecovalence, regression coefficient analysis or principal component analysis (PCA) (Finlay and Wilkinson, 1963; Eberhart and Russell, 1966; Perkins and Jinks, 1968; Freeman and Perkins, 1971; Shukla, 1972; Kang, 1993). Kang (1993) proposed yield stability static (Ysi) by combining yield and stability as a single selection criterion by modifying rank Sum method. However, additive main effects and multiplicative interaction (AMMI) model and the genotype main effects and genotype × environment interaction effects (GGE) model are more popular methods. This method is followed to quantify the genotype environment interaction through PCA and graphical representation and has been widely applied in the multi-environment cultivar trials (Kempton, 1984; Crossa et al., 1990; Gauch and Zobel, 1997).
A panel of 14 BILs derived from Swarna/ Oryza nivara was studied along with 9 high yielding rice varieties of different duration and these 23 lines were screened in three seasons. Genotypic characterization of these BILs was conducted with genome wide polymorphic markers and markers linked to yield QTLs. The objectives of this study were (1) to identify the yield potential of backcross introgression lines in comparison with existing popular varieties (2) to identify stable high yielding BILs and their parental genome percentage (3) to prioritize the component traits important for further genetic dissection and improvement.
Materials and Methods
Location
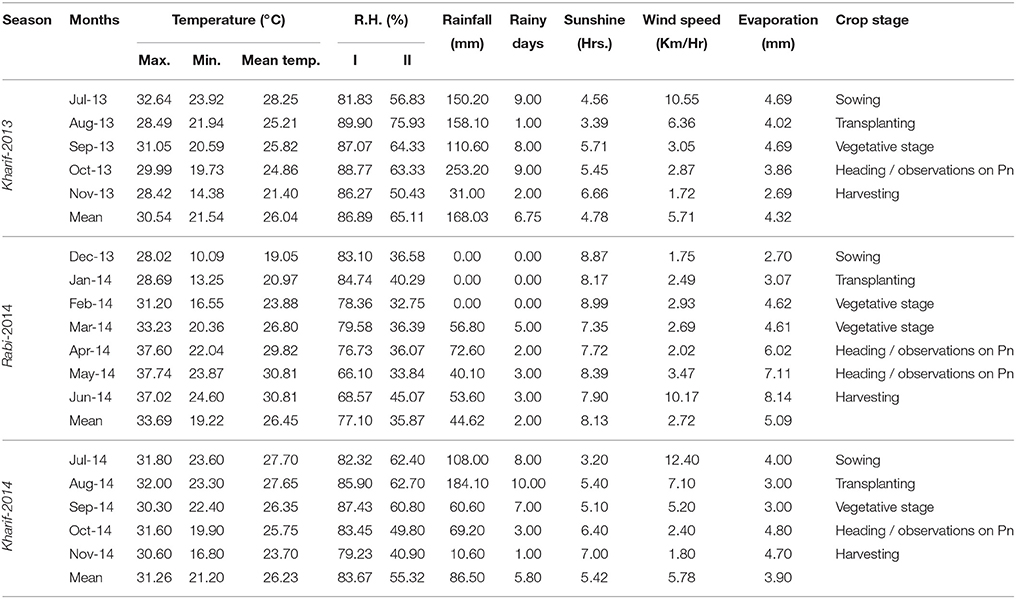
Field experiments were conducted at Indian Institute of Rice Research, Hyderabad (17° 19′ N and 78° 29′ E) at an altitude of 549 m above mean sea level during two wet seasons Kharif -2013(E1), (Kharif -2014) (E2) and one dry season Rabi-2014(E3). Crop was grown in alkaline vertisol with a pH of 7.94 at irrigated field conditions. Details of meteorological conditions during the crop growth period are presented in Table 1.
Plant Material
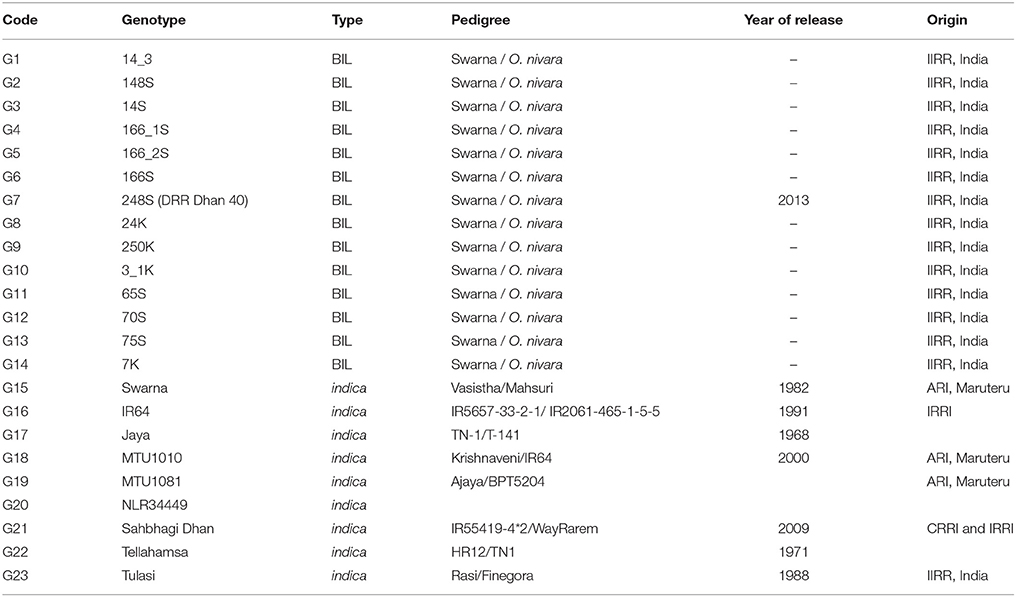
Studies were conducted at IIRR to develop wild introgression lines between O. sativa cv. Swarna and accessions of wild relative, Oryza nivara (Kaladhar et al., 2008; Swamy et al., 2011). The developed BILs were advanced to BC2F6 generation and further purified by single panicle selection method upto BC2F8. From two sets of BILs consisting of 94 lines from Swarna / O. nivara (81848) (S lines) and 104 lines from Swarna / O. nivara (81832) (K lines), a panel of 14 BILs at BC2F8 generation were selected based on their preferable phenotypic traits (Table 2).
As BILs have a range of flowering duration from 77 to 120 days popular varieties IR64, Jaya, MTU1010, MTU1081, NLR34449, Sahbhagi Dhan, Swarna, Tellahamsa, and Tulasi with different flowering duration were grown as checks under irrigated conditions. These BILs were evaluated for yield and related traits in irrigated conditions over a period of three seasons (2013–2014) along with checks. As there is considerable variation in the duration among the BILs, per day productivity was computed to compare genotypes with different duration.
Field Experimental Details
Seeds were sown in nursery beds, and 25 days old seedlings were transplanted, with single seedling per hill in all the field trials. The planting density was 33.3 hills m−2, with 20 cm row spacing and 15 cm intra-row spacing with five rows of 21 plants each constituting a replication. Normal package of practice and fertilizer application was followed; weeds, insects, and diseases were controlled by using standard herbicides and pesticides as required to avoid yield loss. The experimental plots were arranged in a randomized complete block design with three replications each containing 105 plants. These same parameters were followed uniformly across the seasons.
Phenotyping
These genotypes were screened for various yield contributing traits in all the seasons following Standard Evaluation System (IRRI, 2013). The observations on yield and morpho-agronomic traits were recorded from the field experiments.
Statistical Analysis
Analysis of variance was computed for individual environment, then a combined analysis of variance was performed, considering both environments and genotypes as fixed using PB tools (Version 1.4, http://bbi.irri.org/products) and R (R Core Team, 2012). Significance of all effects was tested against mean square of error. The performance of BILs was tested over three seasons and was assessed using stability models viz, (1) yield-stability statistic (YSi) (Kang, 1993), (2) Additive Main effects and Multiplicative Interaction (AMMI) (Gauch and Zobel, 1997), and (3) GGE Biplot or Site Regression model (Yan and Kang, 2003). These models were used to interpret and visualize the stability and GEI patterns. In the AMMI model, only the GEI term is absorbed in the multiplicative component, whereas in the GGE model, the main effects of genotypes (G) plus the GEI are absorbed into the multiplicative component. Yield-stability (YSi) statistic was developed by Kang (1993) to be used as a selection criterion when G × E interaction is significant. The stability-variance was determined following modified Shukla's (1972) method and genotypes with significant stability variance were considered unstable. The stability variance was integrated with yield to obtain the YSi statistic as outlined by Kang and Magari (1995). Simultaneous selection of high yielding and stable genotypes is possible through this method.
The AMMI model (Gauch, 1988) was used in analyzing the stability and interaction for yield traits. The AMMI model is a combination of analysis of variance (ANOVA) and principal component analysis (PCA). The G × E interaction was evaluated with the AMMI model by considering the first two principal components. ANOVA model was used to analyze the trait data with main effects of genotype and environment without the interaction, then, a principal component analysis was integrated using the standardized residuals. These residuals include the experimental error and the effect of the GEI. The analytical model can be written as
Where Yij. is the mean yield of ith genotype in jth environment, μ is the overall mean, δi is the genotypic effect, βj is the environment effect, λk is the singular value for PC axis k, δik is the genotype eigenvector value for PC axis n, βjk is the environment eigenvector value for PC axis k and εij is the residual error assumed to be normally and independently distributed (0, σ2/r), σ2 is the pooled error variance and r is the number of replicates.
GGE biplots display both G (genotype) and GE (genotype environment) variation (Kang, 1993) for genotype evaluation. The GGE biplot is based on the sites regression (SREG) linear bilinear model (Cornelius et al., 1996; Crossa and Cornelius, 1997; Crossa et al., 2002). The sites regression model as a multiplicative model in the bilinear terms shows the main effects of cultivars plus the cultivar × environment interaction (GGE) and the model is
The GGE biplot graphically represents G and GEI effect present in the multi-location trial data using environment centered data. GGE biplots were used to evaluate (1) mega environment analysis (which-won-where pattern), where genotypes can be recommended to specific mega environments. (2) Genotype evaluation, where stable specific genotypes can be recommended across all locations and (3) location evaluation, explains discriminative power of target locations for genotypes under study.
Sum of square percentage was computed as percentage of sum of squares of components of stability analysis of variance per total sum of squares to know the contribution of each component viz., genotype, environment and GEI. Correlation analysis was performed with Statistical Tool for Agricultural Research (STAR) using Pearson's correlation coefficient method. Significance levels are indicated as: *P < 0.05, **P < 0.01, ***P < 0.001.
Genotyping
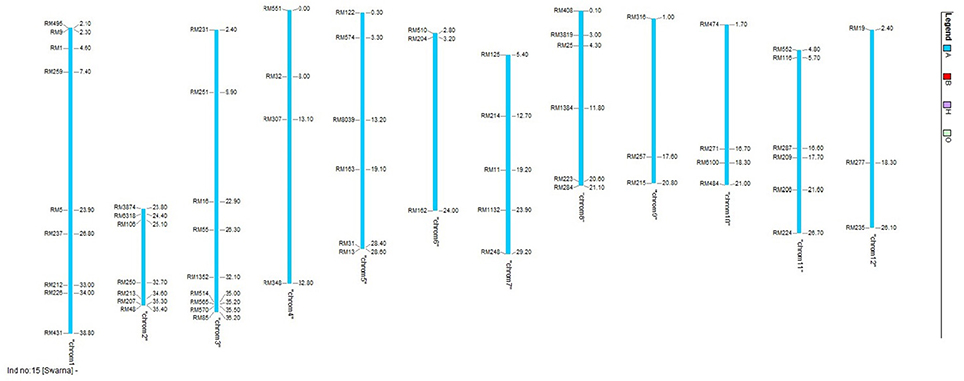
Molecular screening was conducted to identify the presence of reported QTLs in the BILs and also to identify recurrent parent genome percentage. Leaves of 20 days-old seedlings were collected from the field and CTAB (Cetyl Trimethyl Ammonium Bromide) method was followed for DNA extraction (Doyle and Doyle, 1987). Polymorphic SSR markers with genome wide distribution (Figure 1) from universal core genetic map (Orjuela et al., 2010) were used for genotyping (Supplementary Table 1). PCR reactions were carried out in Thermal cycler (Veriti PCR, Applied Biosystems, USA) with the total reaction volume of 10 μl containing 15 ng of genomic DNA, 1X assay buffer, 200 μM of dNTPs, 1.5 mM MgCl2, 10 pmol of forward and reverse primer and 1 unit of Taq DNA polymerase (Thermo Scientific, U.S.A). PCR cycles were programmed as follows: initial denaturation at 94°C for 5 min followed by 35 cycles of 94°C for 45 s, 55°C for 30 s, 72°C for 45 s and a final extension of 10 min at 72°C. Amplified products were resolved in 4% metaphor agarose gels prepared in 0.5 X TAE buffer and electrophoresis was conducted at 120V for 2 h. Gels were stained with ethidium bromide and documented using gel documentation system (Alfa imager, U.S.A). Amplified fragments were scored for the presence (1) or absence (0) for each primer genotype combination. The SSR genotypic data generated in the population were analyzed using the software, GGT ver.2.0. The graphical representations and comparisons were made among the 23 lines on linkage group basis and also the entire genome level on individual basis.
Results
Yield and Yield Related Traits
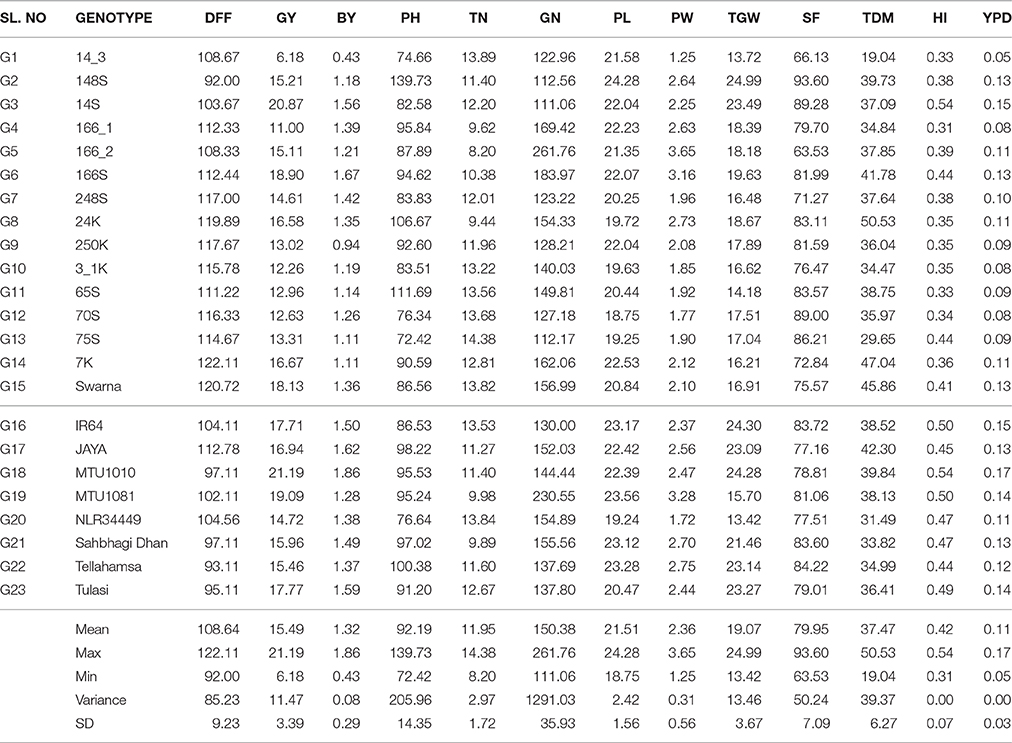
Wide range of variation was observed for yield traits among the genotypes and across the environments. Combined analysis of variance of three environmental data showed significant genotypic and genotype × environment interactions for all the traits except for 1000 grain weight where the G × E interactions were not significant. In the three environments Kharif 2013, Rabi 2014 and Kharif 2014 the variation in seasonal average was observed for DFF, GY, BY PH, TN, and BM. In three seasons; broad genotypic variation was observed and genotypic average ranged for DFF (77.37 to 133.04); GY (4.73 to 24.63); BY (0.33 to 2.10); PH (65.98 to 148.43); TN (6.12 to 20.70); GN (93.70 to 314.55); PL (18.09 to 25.19); PW (0.98 to 3.87); TGW (12.50 to 26.07); SF (60.57 to 97.57); BM (11.26 to 54.12); HI (0.20 to 0.55) and per day productivity (0.04 to 0.19) among the BILs under study (Table 3). The data obtained from the three replications was assessed and compared with high yielding checks in each season. Considering the three season average, among BILs G3 scored highest grain yield, harvest index and per day productivity and G6 scored highest bulk yield compared to Swarna and on par with other checks. G2 was of shortest duration and showed desirable yield traits such as panicle length, 1000 grain weight, spikelet fertility and plant height compared with checks. It was early in flowering with lowest unfilled grains in all the seasons. Derived lines from G6 i.e., G5 had highest grain number, filled grains and panicle weight. G8 was identified as having highest average biomass and dry matter production among BILs, G13, and G1 for high tiller number and G14 for maximum days to maturity. High yielding check MTU1010 showed highest grain yield, bulk yield, harvest index and per day productivity than BILs for three seasons average.
The BILs were screened for seedling vigor in two seasons Kharif and Rabi in field conditions. Seedling vigor for BILs was obtained both for Kharif and Rabi season in terms of plant height and tiller number from the data taken on 40 days after transplanting and 70 days after transplanting. BILs seeds were subjected to germination test and vigor index analysis in vitro by paper towel method (ISTA, 1999). Seedling vigor was also assessed based on paper towel method using the data for shoot length and root length from 7 days and 14 days and germination studies. In both the seasons G2 had highest seedling vigor in terms of plant height. G14 was best for number of tillers in Kharif and G7 in Rabi season. G13(75S) showed highest vigor in terms of tiller number consistently across the seasons. In terms of vigor, G6 and derived lines were better compared to checks. Productive tillers were highest in G1 at the time of harvest. Among the checks Tulasi and Sahbhagi Dhan showed comparatively higher vigor and BILs outperformed popular checks. G2 showed highest seedling vigor in paper towel screening method.
Stability Analysis
Observations on the yield traits for all three seasons were then subjected to combined analyses through Yield-stability statistic (YSi) (Kang, 1993), AMMI and GGE biplot models. In the analysis, each combination of season with location was considered as an environment. Analysis of variance was first conducted for each environment. Pooled data of 3 seasons was subjected to stability analysis using PB tools and R software and specific genotypic adaptation, general genotypic adaptation and specific population adaptation to different seasons were identified.
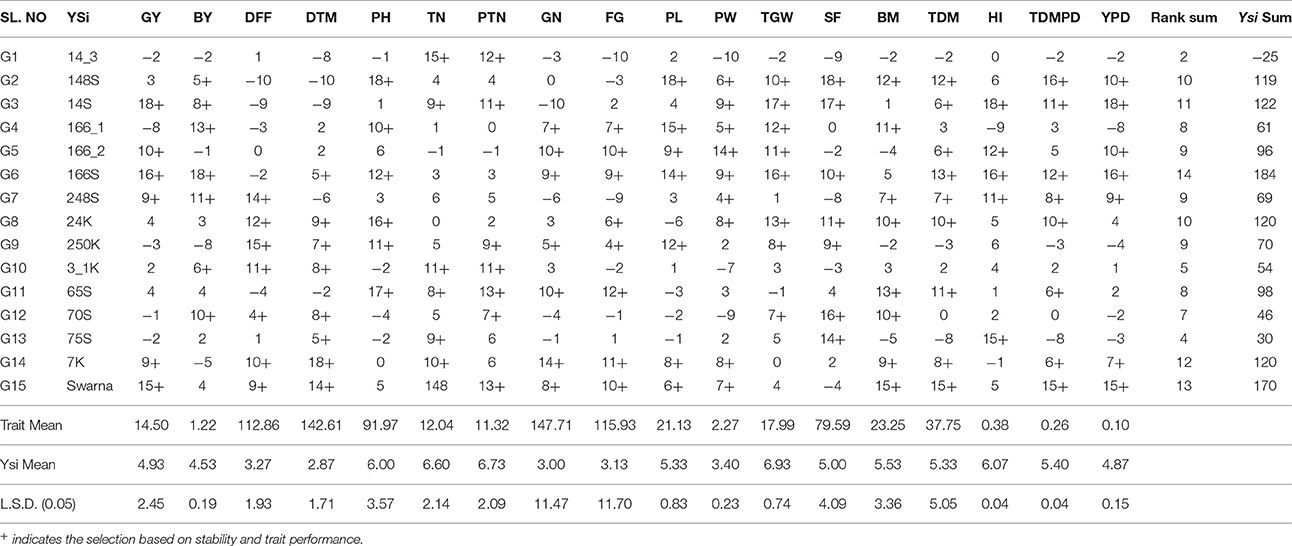
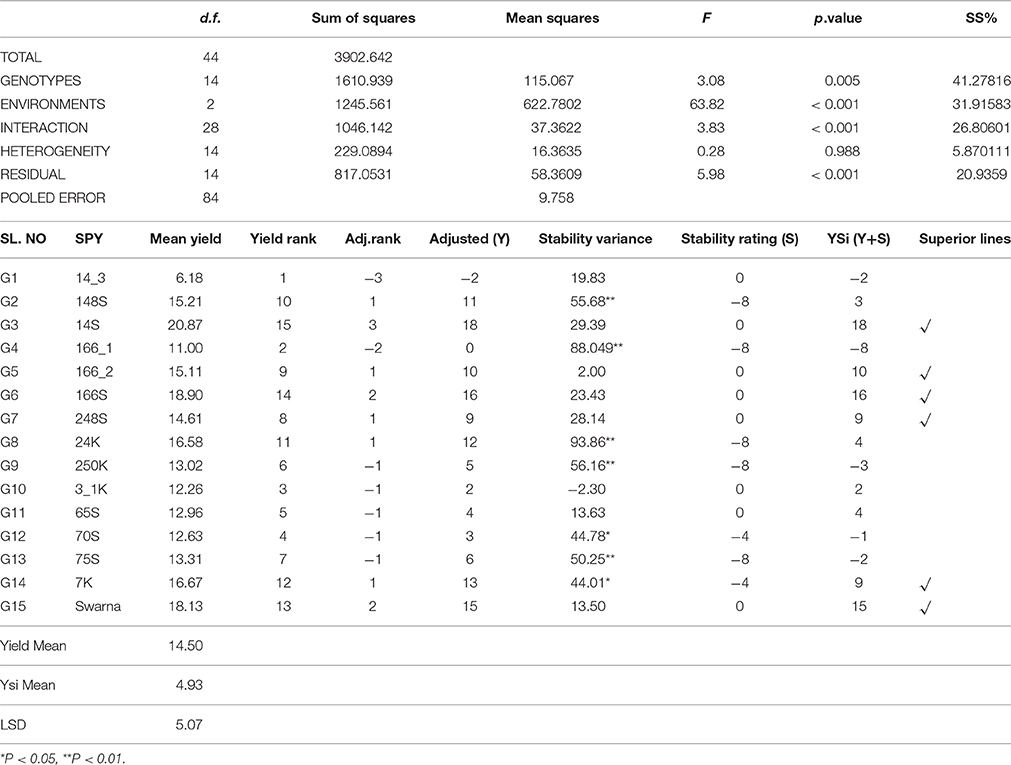
It was found that G3 was the most stable genotype in the selection ranks for GY followed by G6, Swarna, G5, G7, and G14 based on combined analysis of yield and stability using YSi statistic. Similarly for bulk yield, G6 scored highest rank followed by G4, G7, G12, G3, G10, and G2. Among the BILs G6 and G3 showed non-significant stability variance and high average yield, so they may be considered for further multilocation trials. Number of genotypes selected based on YSi ranking varied among the traits. 9 genotypes were found to be superior based on YSi scoring for GY and PH; 8 for DTM, FG,TGW, BM, TDMPD;7 for BY, DFF, TN,PTN, GN,PL,SF, and YPD and 5 genotypes were selected based on high trait mean and stability for HI. G6 was found to be stable for 14 traits under study except DFF, TN, PTN, and BM followed by Swarna which was stable for 13 yield contributing traits. G14(7K) showed stability and high mean for 12 traits, G3(14s) for 11 traits, G2(148S) and G8(24K) for 10 traits and G7(248S) for 9 traits (Table 4).
Sum of YSi scores for each yield and contributing trait was computed to identify the overall ranking of genotypes and G6 scored highest followed by Swarna, G3, G14, G8, and G2. Overall ranking varied if we select among the contributing traits. The varieties which scored highest for DFF, DTM belong to late duration as the highest values were considered for calculation. Similarly for plant height, the tallest varieties scored highest YSi ranking. So selection of rank and its direction can be decided based on the requirements of target ecosystems. The ranking by YSi statistic based on predicted means for stability parameters for grain yield is shown in Table 5.
General Genotypic Adaptation
AMMI and GGE biplot explained the general genotypic adaptation or stability across genotypes (Figure 2). To visualize the performance of different genotypes in a given environment, biplots were used. The relative ranking of different genotypes on the biplots is based on its projection onto the O-axis in AMMI Biplot and GGE biplot was used to diagnose the G × E interaction effects on each yield contributing trait. The results of the AMMI model analysis are interpreted on the basis of AMMI1 biplot where the graph is plotted with the main effect and first multiplicative axis term (PC1) for both genotypes and environments. Greater the Principal Component Axis (PC1) scores, either negative or positive, indicated the specific adaptation of a genotype to certain environments. The more the PC1 scores approximate to zero, the more stable the genotype among the environments under study. The AMMI biplot showed 81.3% fitness in the model for grain yield, and 60.9% for bulk yield. Among the BILs G8, G2, G3, G14, G11, and check Swarna (G15) exhibited high yield with high main (additive) effects showing positive PC1 score. BIL G10 showed less environmental interaction while three environments showed high interaction for GY. Consequently, for BY, Kharif 2014 (E2) showed high interaction but genotypes G2, G6, and G12 were identified with low environmental interactions and were considered best across the seasons for the trait. Based on AMMI analysis G10(3-1K) was the most stable genotype for BM; G6 and G3 for BY; G14 for DFF, DTM; G5 for FG, GN, TN; G3 for HI, GY, YPD; G2 for PH, TN, SF, 1000GW; G3 for PTN; G14 for TDM, TDMPD and G12 for TN. GGE biplot also showed similar results for stability of genotypes in trait expression across environments (Supplementary Figure 1). Genotypic variation was observed for each trait in case of adaptability to specific environments. Kharif environment was most favorable for high yielding BILs such as G3, G5, G2, and G14 while Rabi was favorable for G8 and G6 as they appeared most responsive for yield contributing traits in these respective environments. The environments E1 and E2 were more responsive for the traits BM, FG, GN, PL, PW, and SF and environment E3 was responsive for traits GY, TDM, YPD, TDMPD, DFF, DTM, and HI.
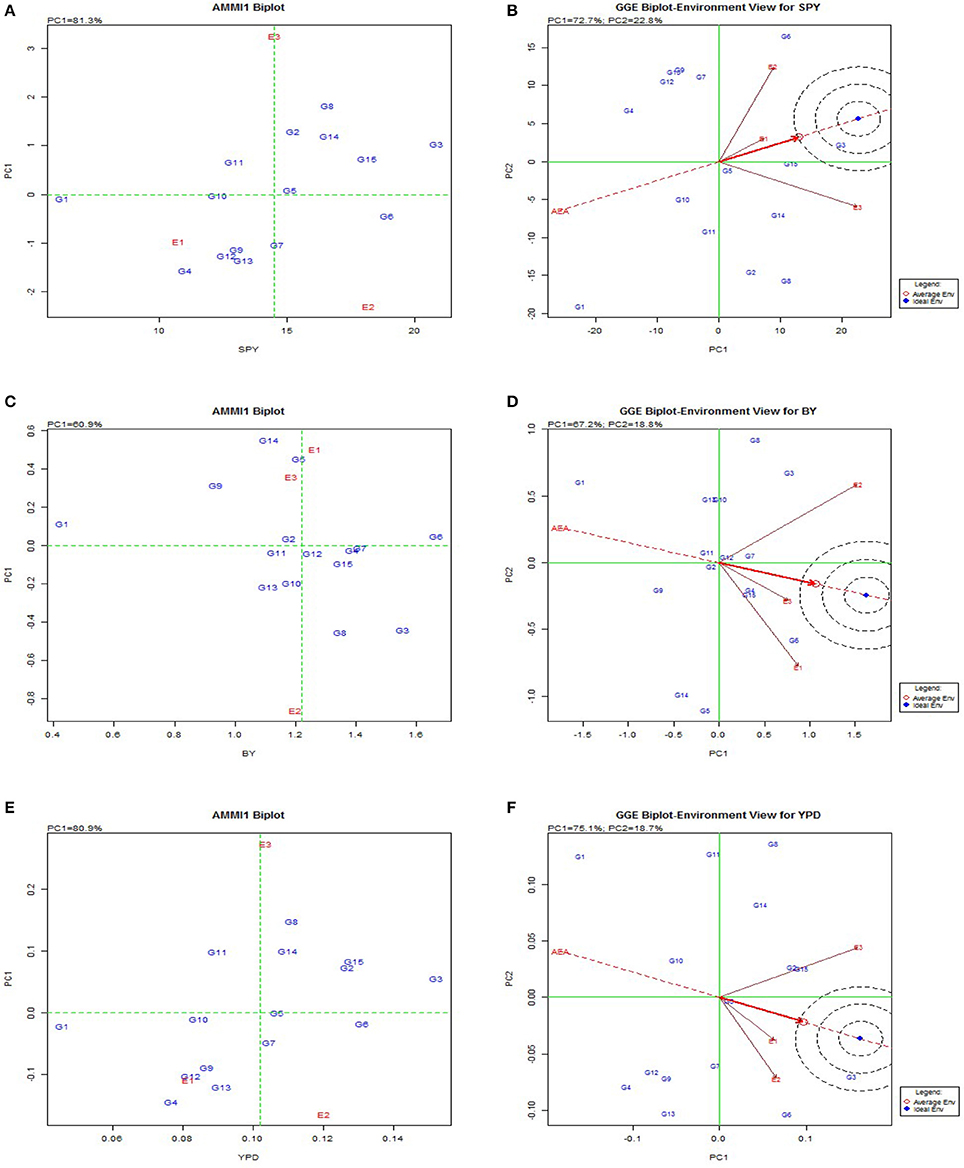
Figure 2. AMMI and GGE biplot for the primary component of interaction (PC1) and mean yield(t/ha) or main effect of rice genotypes in differet seasons. (A), AMMI 1 biplot for single plant yield. (B), GGE biplot for single plant yield. (C), AMMI 1 biplot for bulk yield. (D), GGE biplot for bulk yield. (E), AMMI 1 biplot for per day productivity. (F), GGE biplot for per day productivity.
From the biplot graph of AMMI, it was inferred that interactions of environments are highly varied and all the three environments were highly interactive for most of the yield traits. E3 (Rabi season) appeared to be a favorable environment for BM and SF; E1 for BY, GN, PL, and E2 for PTN and GY. Genotypes G3(14S), G6(166S), and G9(250K) showed low interaction effects and hence they can be considered stable. In case of GY, G3, and G6 had high mean values and hence they can be recommended for all the environments. The genotypes with high interaction are suitable for specific environments, genotypes with high mean and positive interaction are suited for favorable environments and those with high mean and negative interaction are suited for unfavorable environments for the respective traits. A line that passes through the origin and is perpendicular to the O-axis in the biplots separates genotypes that yielded above the mean (G3, G4, G15, G7, G6, G8, G12, and G4) that would possibly yield above average in all the seasons and genotypes that yielded below average (G1, G14, G5, G10, G14, G9, and G1). The released varieties Tulasi, MTU1010, Swarna and Sahbhagi Dhan used as checks performed well across the seasons.
Specific Genotypic Adaptation
Genotypic evaluation was conducted and based on GGE biplot which-won-where pattern and adaptation showed specific genotypic adaptation to limited environment conditions or the adaptability of genotypes for each environment (Figure 3). The same genotype performed best across three seasons for plant height (G2), 1000 grain weight (G2) (Supplementary Figure 2), harvest index (G3) and per day productivity (G3). This shows that these traits have stable expression across the seasons with limited environmental influence and the selected genotypes are most stable for the particular trait. The traits like biomass, days to flowering, days to maturity, filled grains, grain number, panicle weight, spikelet fertility, total dry matter, tiller number showed same genotype performed better in two Kharif (wet season) seasons under study but another genotype appeared to be best for Rabi (dry season). So these traits are showing seasonal variation and genotypic performance depends on environmental conditions. Traits like bulk yield, productive tiller number and grain yield showed no seasonal dependence on genotypic performance.
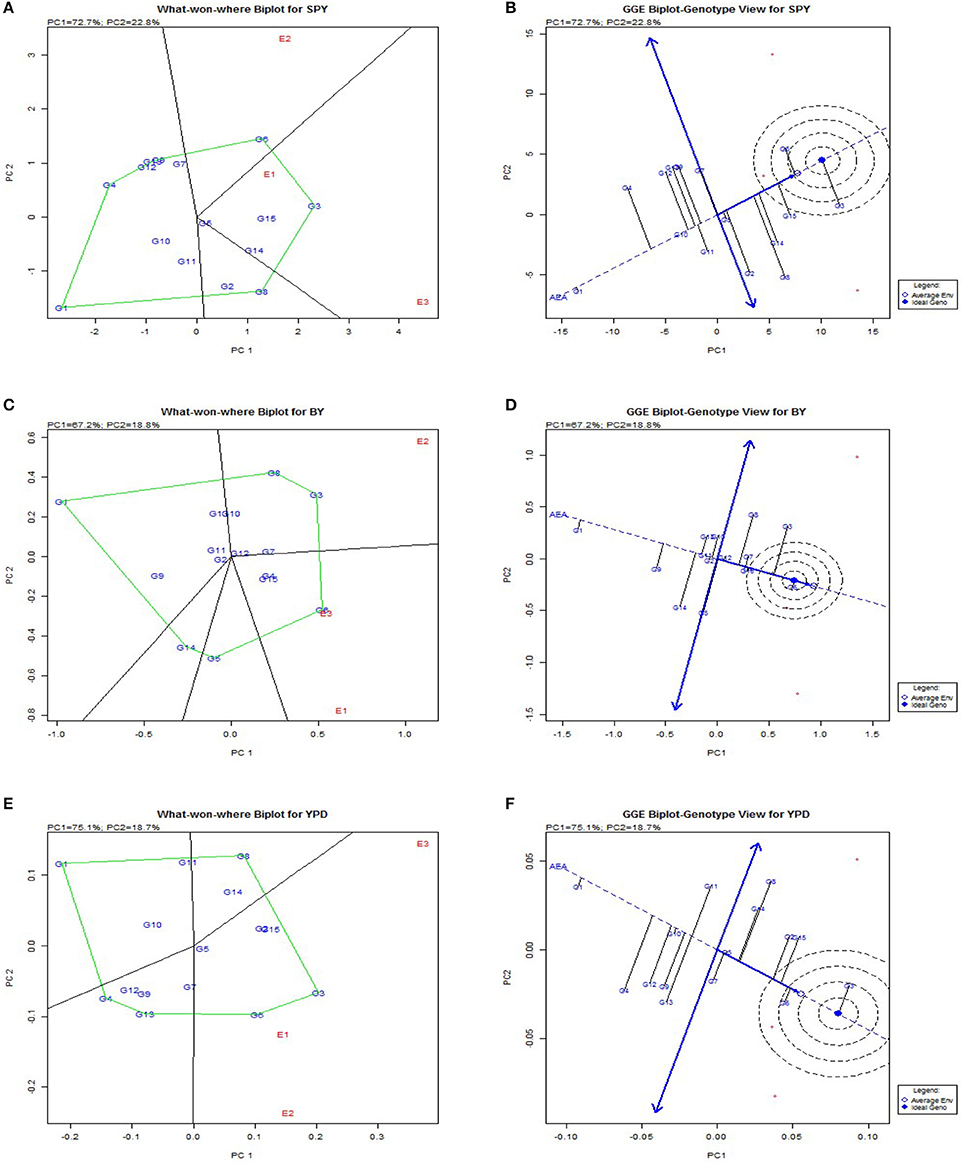
Figure 3. Polygon views of the GGE biplot based on symmetrical scaling for “which-won-where” pattern of rice genotypes in three environments. (A), Polygon view of single plant yield. (B), which-won-where plot single plant yield. (C), Polygon view bulk yield. d which-won-where plot bulk yield. (E), Polygon view per day productivity. (F), which-won-where plot per day productivity.
The polygon was drawn joining cultivars that are located farthest from the origin so that all other cultivars are contained in the polygon. Perpendicular lines to the sides of the polygon divide the biplot into sectors. Each sector has a vertex cultivar which is present in the corner of the polygon. The vertex cultivar is the best performing cultivar in the environments that share the sector with it. Vertex genotypes are G3, G4 and G7 at E1, E2 and E3 respectively. In case of checks, it is inferred that cultivar Sahbhagi Dhan is suited to Rabi season and Tulasi to Kharif season. The analysis indicated that G3, G12, and G4 were suitable BILs for cultivation in irrigated environment as they had the highest ranking in biplot and in predicted means.
Association Analysis
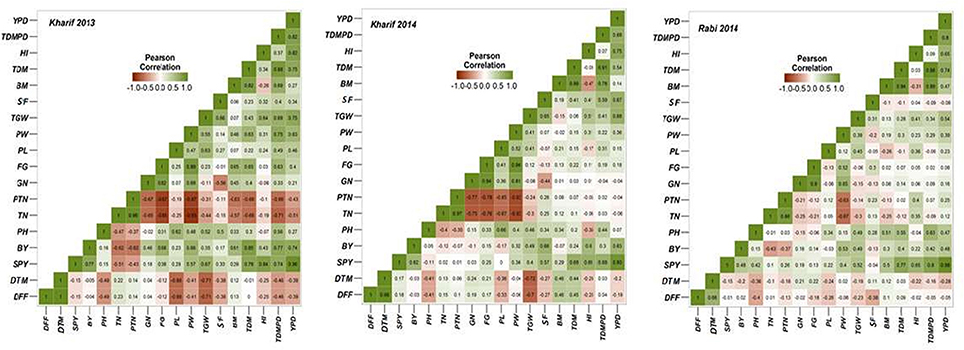
Multiple correlations between different yield and yield related traits was conducted for all the three seasons (Figure 4) and it was observed that grain yield has high significant association with panicle weight, 1000 grain weight, total dry matter, per day productivity and harvest index. Days to fifty percent flowering showed negative correlation with bulk yield, grain yield, spikelet fertility, 1000 grain weight, per day productivity and harvest index. Number of primary branches and secondary branches showed positive association both with filled and unfilled grains. Harvest index directly depended on grain yield, per day productivity, filled grains and panicle weight. In season wise correlation conducted among the yield traits, DFF showed highly significant association with DTM; TN with productive tiller number, panicle length and filled grain number; total number of grains with panicle weight in all the three seasons. Single plant yield showed stable and significant association with 1000 grain weight, biomass, harvest index and per day productivity across the seasons.
Genotyping the BILs
All the BILs were screened using universal core genetic map for rice (Orjuela et al., 2010) and the genotypic data was analyzed using the Graphical Genotypes software (GGT 2.0) (van Berloo, 2008). 74 polymorphic SSR loci out of 165 genome wide core set microsatellite (SSR) markers were used for characterisation of BILs. On an average, percentage of recurrent genome of BILs varied from 36.8% (G2) to 90.6% (G14). The most stable and high yielding BILs, G6 (70.8%) and G3 (72.6%) had about 70% of recurrent parent genome and 20% donor parent genome with less than 10% of heterozygous segments. Further, G2 showed less percentage of recurrent parent genome and donor genome with maximum number of null alleles and recombination. Average percentage of recurrent parent genome in the genotypes was 74.7% and donor genome was 12.5%. Heterozygous segments average was 1.7% and null alleles were 9.7% and recombination was 18.5% (Figure 5).
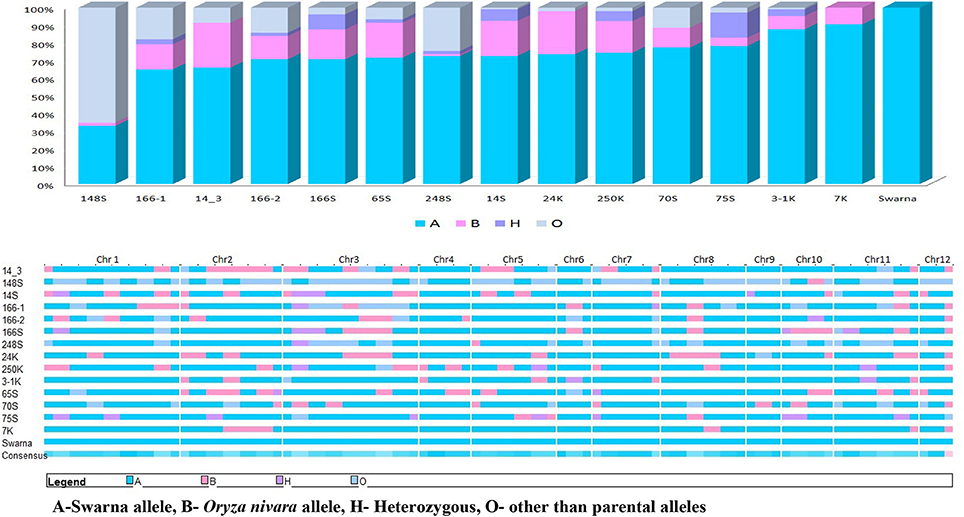
Figure 5. Graphical representations of donor introgression in the backcross introgression lines using GGT software.
Another panel of SSR markers which were linked to the reported QTLs from the same population was also used to screen these BILs. It was observed that many of the BILs have these reported QTLs in either homozygous or heterozygous condition. Yield QTL yldp1.4 from O. nivara was present in most of the BILs.G6 had O. nivara allele of yldp1.4 and its derived lines G4 and G5 had this QTL in completely heterozygous stage. G2 had four QTLs yldp1.4 yldp2.3, nsp1.2 and dtm 2.7 and G1 had three QTLs yldp9.1, dtm9.3 and nfg1.2.
Discussion
Pre-breeding and utilization of wild accessions are gaining importance in plant breeding programs for the identification of novel genes to improve yield levels of existing cultivars. Complex quantitative traits such as yield, with multiple contributing traits are highly influenced by environment interaction effects. Wide spread cultivation of rice in various agro ecological environments and the unpredicted effects of climate change makes the cultivation of stable and adaptable genotypes more desirable (Bose et al., 2012; Vanave et al., 2014). Stability and GEI studies are very important for the efficient breeding and adoption in multi-environment conditions (Kempton et al., 1997; Atlin et al., 2000; IRRI, 2006; Liang et al., 2015).
The yield of rice genotypes fluctuates considerably with change in environmental conditions (Bose et al., 2014). Segregation and appearance of wild traits in advanced generations are common phenomena in interspecific crosses. Keeping this in view, the present study was aimed at identification and characterization of a set of BILs developed from the same parental cross, for three seasons and stability was analyzed for key component traits for yield. Most of the multi location trials and multi-year testing focus only on the stability of grain yield but here we studied other yield contributing and component traits also.
Stability analysis models like YSi statistics, AMMI and GGE biplots are very useful in selecting lines with high homeostasis for broad target environments and were utilized in multilocation trials and in coordinated variety testing programmes. Prasad et al. (2001) studied stability and yield performance of mega varieties using the data from All India Coordinated Rice Improvement Programme (AICRIP) as well as international trials for a period of 25 years and identified four mega environments for testing the varieties for yield potential in India. Many studies have used GGE biplot analysis mainly for mega-environment evaluation, cultivar evaluation, and assessment of varietal stability (Kang, 1993; Yan and Hunt, 2001; Yan and Kang, 2003; Dehghani et al., 2006; Navabi et al., 2006; Blanche et al., 2007; Ding et al., 2007; Jalata, 2011; Mohammadi et al., 2012; Rakshit et al., 2012; Amiri et al., 2015). Balestre et al. (2010); Nassir (2013) studied stability and adaptability of upland rice genotypes by the GGE biplot method based on the predicted genotypic and phenotypic values. The simultaneous selection for high mean and stability results in the selection of superior genotypes with non significant stability variance and it enhances quality of selection. This method was successfully utilized in most of the crops including rice (Wade et al., 1999; Ouk et al., 2007; Tariku et al., 2013) especially for assessing grain yield.
In this study, three seasons data was subjected to correlation analysis and the traits which are associated significantly were discussed for stability analysis. Stability analysis models helped identification of superior genotypes with both high mean yield and stability. Different stability analysis models showed that G3 is the most stable genotype for grain yield followed by G6 and Swarna. G5 and G6 were identified to be stable and ideal genotypes for bulk yield, grain number and number of filled grains, followed by G3, G7, G15, G8, and G12. G14 was identified as most stable genotype for biomass, flowering duration, panicle length and total dry matter production. G2 showed stability and high mean value for 1000 grain weight, spikelet fertility, plant height and panicle length; it was identified as stable genotype for days to fifty percent flowering and days to maturity with lowest mean value indicating the most stable short duration BIL followed by G3. Some of the superior genotypes for yield specific traits with less stability across the seasons can be stabilized with limited back cross approach (Singh and Huerta-Espino, 2004) with an adapted cultivar.
An ideal genotype would be one that has both high mean yield and high stability. The position of an “ideal” genotype is closer to the direction of the mean environment and has a zero projection onto the perpendicular AEC ordinate. G2 and G4 showed high mean ranking and were identified as the best performing lines in terms of both mean yield and stability across environments in the irrigated ecosystem. Based on adaptation map G2 is best adapted for environment E1, G4 for E2 and G7 for E3. Response plot for mean yield also indicated the same results across the seasons.
Among the genotypes recurrent parent Swarna was stable across the seasons for traits like bulk yield, biomass, days to maturity, number of filled grains, panicle length, productive tiller number, panicle weight. The mega variety Swarna, which is popular in major rice growing countries like India, Bangladesh, Philippines and Thailand; is known for its adaptability in wide range of environments (Prasad et al., 2001). The performance of the BILs was on par or above the mega varieties like Swarna and most popular cultivars of different durations. As the BILs and checks belong to different maturity groups, per day productivity (YPD) was considered to compare their yield. The frequency distribution of the pooled data of three seasons for each trait followed a bell shaped curve with Swarna placed on the peak of the curve (Figure 6). However, G6 and G3 proved significantly superior in yield over the recurrent parent Swarna and on par with the best check MTU1010. Graphical representation of the molecular marker data has relevance in studying the genome constitution of the recombinant population (Young and Tanksley, 1989). It was observed that the BILs had more than 70% of recurrent parent genome. Tian et al. (2006) reported that the high-yielding ILs contained relatively less introgressed segments than the low-yielding ILs in a set of 159 ILs derived from Oryza rufipogon in indica cultivar Guichao2 back ground using 126 polymorphic SSRs.
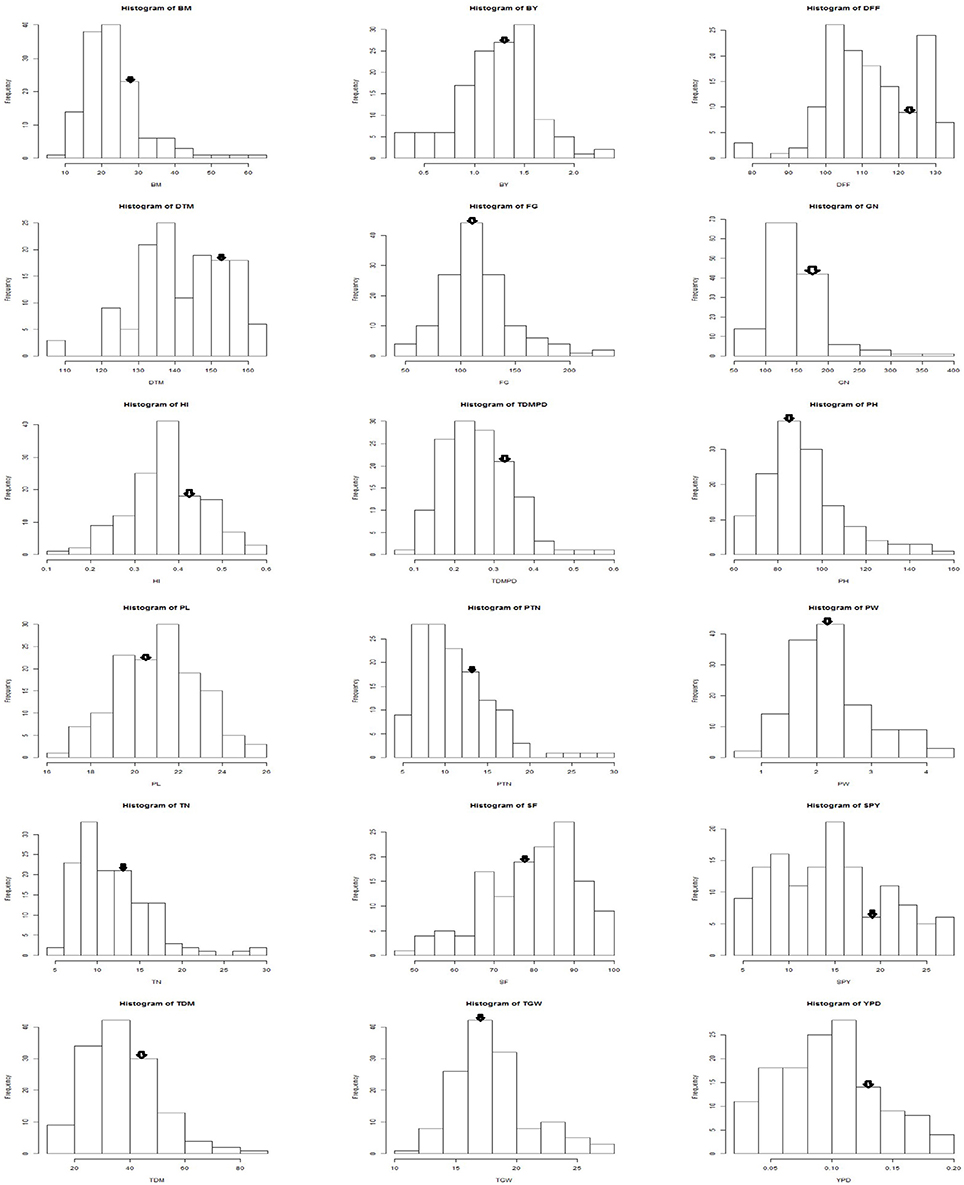
Figure 6. Frequency distribution of yield and yield related traits in Swarna / O. nivara derived BILs arrow indicates Swarna mean value.
Plant height and 1000 grain weight were the most stable traits across the season with minimal genotypic variation and with PC1values of 96.5% and 97.8% respectively in GGE biplot (Figure 7). The explained SS (%) factor was calculated comparing sum of square (SS) from AMMI ANOVA showing the percentage contribution of genotype, environment and interaction effects in phenotypic expression of each trait. It was observed that grain yield was contributed mainly by genotype (41.28%), followed by environment (31.92%), and their interaction (26.81%). The percentage of explanation of phenotype by genotypic contribution was high for 1000 grain weight (90.40%) and plant height (85.99) and environment effect was high for tiller number (47.56), days to flowering (47.24) and grain yield (31.92) while interaction effect was high for bulk yield and filled grains per panicle (Figure 8).
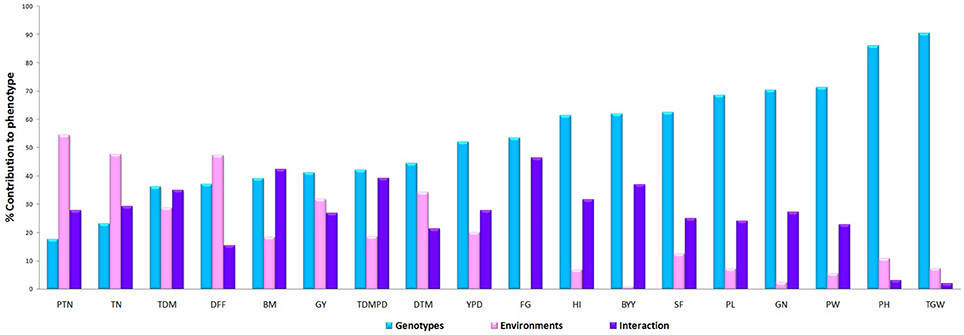
Figure 7. The factor explained SS(%) was calculated comparing sum of square (SS) from AMMI ANOVA showing the percentage contribution of genotype environment and interaction effects in phenotypic expression of each trait across environments.
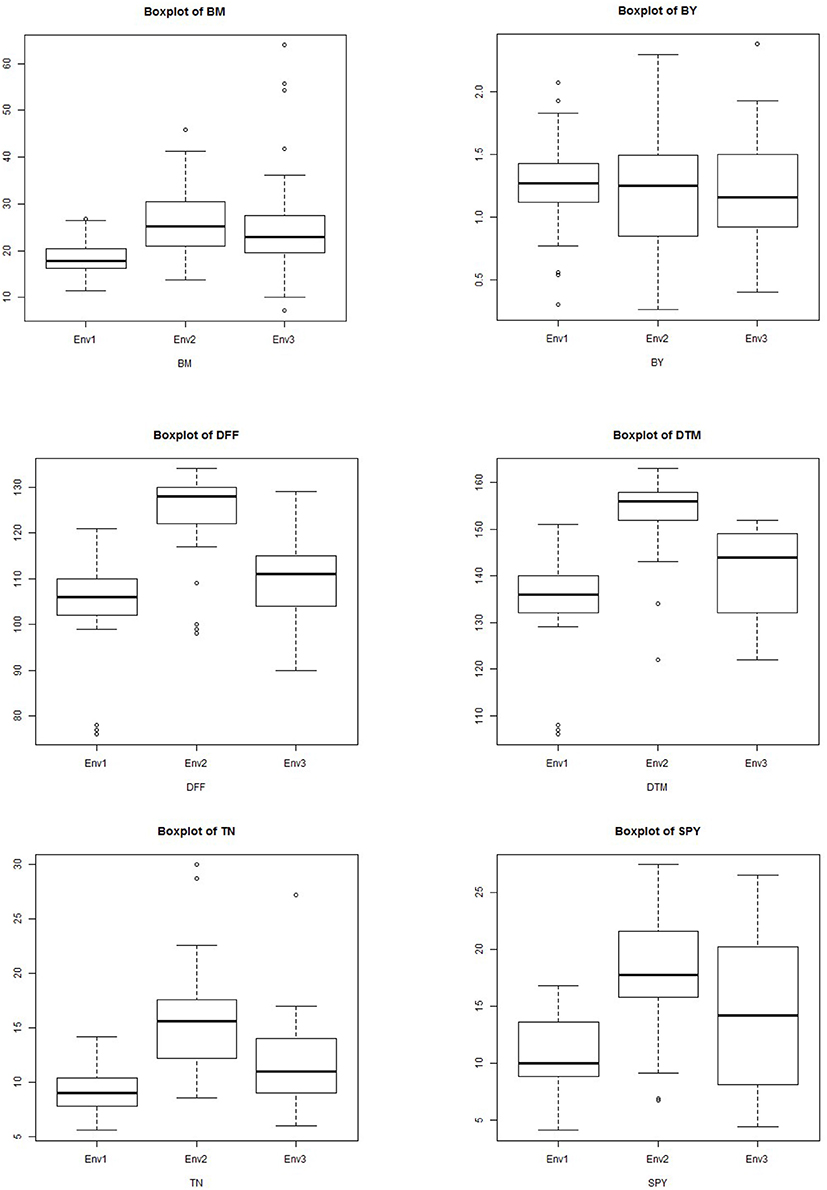
Figure 8. Boxplot showing the differences in yield and related traits among subpopulations. Box edges represent the upper and lower quantile with median value shown as bold line in the middle of the box. Whiskers represent 1.5 times the quantile of the data. Individuals falling outside the range of the whiskers shown as open dots.
The G × E interactions for most of the yield traits under study were significant but some traits showed stable genotypic performance across the environments. The seasonal variation between the highest value and lowest value was observed for traits BM, BY, DFF, DTM, TN, and GY but the difference was minimal for traits GN, PL, PW, TGW, SF, HI, and YPD (Supplementary Figure 3). For the widely varying traits with high GEI, additional agronomic management is also required along with crop improvement for trait stability. Crossover GE and dissimilarity between environments for discriminating genotypes were very low in case of GN, PH, PL, PW, SF, and TGW but were moderate in case of all other traits. Identification of stably expressing contributing traits is very essential for crop improvement for any major trait than combining multiple traits which fluctuate across the environments. It was observed that 1000 grain weight is the trait contributing most to yield and is stably inherited as well as stably associated with grain yield. So while considering the grouping of the genotypes for multi location yield trials, this trait should also to be considered along with duration for a reliable comparison and analysis. The future breeding programs need to focus on improvement of stably performing traits with high heritability to develop stable high yielding genotypes. Dalvi et al. (2007), Panwar et al. (2008), Waghmode and Mehta (2011), and Padmavathi et al. (2013) studied the GE interaction for grain quality in rice and the stability of grain quality is also important in multilocation trials if quality is the selection criteria.
In this study, we used two Kharif and one Rabi season data and there was significant seasonal variation observed for most of the traits. In case of yield GEI were higher in Kharif season than in Rabi season and similar results were reported by Atlin et al. (2000). GGE biplots indicated that Kharif 2013 was the ideal season to select genotypes for BM, HI, PL, PTN, SF, GY, TDM, TGW, Kharif 2014 for DFF, FG, GN, PH, PW, and Rabi 2014 for BY and TGW. Kharif seasons were most ideal seasons to select BILs for yield contributing traits; especially Kharif 2014 was discriminative as well as representative among the seasons and was suitable for selecting genotypes with general adaptation. Rabi season was the most discriminating and least representative environment for testing genotypes and is useful in selecting only specifically adapted genotypes. Kharif 2013 was found least discriminating but most representative among the seasons for most of the traits. The highest environmental averages for all the yield traits were observed in either of the two Kharif seasons. The maximum value was also observed in the Kharif seasons except for traits like SF, BM, and YPD which showed maximum value in Rabi. The significant difference due to environment indicated the existence of genotypic differences in adaptability. Genotypes also differed considerably with respect to their stability for yield traits. Similar observations on GEI were made by Gauch and Zobel (1996); Wade et al. (1999); Ouk et al. (2007); Das et al. (2009); Sreedhar et al. (2011); Tariku et al. (2013); Akter et al. (2014) on multi environment studies using rice genotypes. All the three models showed similar results and utilization of Ysi statistic is advantageous and complements the AMMI and GGE method for selecting stable and high yielding genotypes (Nassir and Ariyo, 2011). Kumar et al. (2012) used different models for stability analysis and the correlations between the stability rankings of entries produced by the GGE model and the parameters of Shukla, AMMI, showed very high rank correlation coefficients.
Advanced BILs with stable yield traits can be grown in several environments to study QTL x environment interactions and these lines can be used in breeding programmes as well as to develop varieties in relatively less duration (Jeuken and Lindhout, 2004). Further studies will focus on (i) development of BIL x BIL mapping population from the stable identified genotypes (ii) identification of QTL for stable contributing traits for yield and (iii) development of varieties from selected stable BILs through multi location variety trials.
Conclusions
The study showed the importance of genotype × environment interaction and stability analysis for evaluation of genotypic yield potential. Wild introgression lines derived from O. nivara in Swarna background were studied for stability for yield related traits in Kharif and Rabi season. The stability and adaptability studies using AMMI, GGE biplot and Ysi statistics indicated G3(14S) and G6(166S) as the most stable BILs with high yield performance. The percentage of explanation of genotype on phenotype was high for 1000 grain weight and plant height and environment effect was high for tiller number, days to flowering and grain yield and interaction effect was high for bulk yield and filled grains per panicle. DRR Dhan 40, an elite BIL and recently released variety showed yield stability with high mean performance and the mega varieties which were used as checks also showed yield stability across the seasons. It was observed that wild derived lines with about 70% of recurrent parent genome were more stable and showing enhanced yield levels. Thus, more emphasis should be devoted in future breeding programs to pre breeding and to develop genotypes with wider adaptation. Stability analysis and GEI may be further extended widely for stress resistance, quality as well as nutrient composition for precise identification of superior genotypes.
Ethics Statement
The authors declare that the experiments comply with the current laws of the country in which they were performed and in compliance with ethical standards.
Author Contributions
DB, SN conceived and planned the work. Phenotypic and genotypic screening was performed by JB, AR, RY, KB, SM, MS, DB, RP, and GP. DS, DB, analyzed the data. DB wrote the manuscript. DS and SN revised and proofread the manuscript. Facilities provided at Indian Institute of Rice Research by VB.
Conflict of Interest Statement
The authors declare that the research was conducted in the absence of any commercial or financial relationships that could be construed as a potential conflict of interest.
Acknowledgments
This research was carried out as part of ICAR- National Professor Project (F.No: Edn/27/4/NP/2012-HRD) funded by Indian Council of Agricultural Research, New Delhi, India; under sub project on Mapping QTLs for yield and related traits using BILs from elite x wild crosses of rice (ABR/CI/ BT/11). These lines were initially developed in Department of Biotechnology (DBT) funded project, (BT/AB/FG-2 (Ph-II) 2009), New Delhi, India. The authors are highly grateful to the Director, ICAR- IIRR for providing facilities.
Supplementary Material
The Supplementary Material for this article can be found online at: http://journal.frontiersin.org/article/10.3389/fpls.2016.01530
Abbreviations
AMMI, additive main effect and multiplicative interaction; G × E, genotype by environment; GGE, Genotype and Genotype × Environment Interaction; BILs, backcross introgression lines; GEI, Genotype Environment Interaction; AICRIP, All India Coordinated Rice Improvement Programme; PCA, principal component analysis; IIRR, Indian Institute of Rice Research, DFF, days to fifty percent flowering; DTM, days to maturity; PH, plant height, TN, tiller number, PTN, number of productive tillers; PL, panicle length; PW, panicle weight; FG number of filled grains; TG, total number of grains; TGW, 1000 grain weight; GY, grain yield; BM, biomass; SF, spikelet fertility; TDM, total dry matter; HI, harvest index; TDMPD, total dry matter per day; YPD, per day productivity; BY, bulk yield.
References
Akter, A., Jamil, H. M., Umma, K. M., Islam, M. R., Hossain, K., and Mamunur, R. M. (2014). AMMI Biplot analysis for stability of grain yield in hybrid rice (Oryza sativa L.). J. Rice Res. 2, 126–169. doi: 10.4172/jrr.1000126
Amiri, R., Bahraminejad, S., Sasani, S., Jalali-Honarmand, S., and Fakhri, R. (2015). Bread wheat genetic variation for grain's protein, iron and zinc concentrations as uptake by their genetic ability. Eur. J. Agrono. 67, 20–26. doi: 10.1016/j.eja.2015.03.004
Anandan, A., Eswaran, R., Sabesan, T., and Prakash, M. (2009). Additive main effects and multiplicative interactions analysis of yield performances in rice genotypes under coastal saline environments. Adv. Biol. Res. 3, 43–47.
Atlin, G. N., Baker, R. J., McRae, K. B., and Lu, X. (2000). Selection response in subdivided target regions. Crop Sci. 40, 7–13. doi: 10.2135/cropsci2000.4017
Balestre, M., Santos, V. B., Soares, A. A., and Reis, M. S. (2010). Stability and adaptability of upland rice genotypes. Crop Breed. Appl. Biotechnol. 10, 357–363. doi: 10.1590/S1984-70332010000400011
Blanche, S. B., Myers, G. O., and Kang, M. S. (2007). GGE biplots and traditional stability measures for interpreting genotype by environment interactions. J. Crop Imp. 20, 123–135. doi: 10.1300/J411v20n01_07
Bose, L. K., Jambhulkar, N. N., and Singh, O. N. (2014). Additive main effects and multiplicative interaction (AMMI) analysis of grain yield stability in early duration rice. J. Anim. Plant Sci. 24, 1885–1897.
Bose, L. K., Nagaraju, M., and Singh, O. N. (2012). Genotype × Environment interaction and stability analysis of lowland rice genotypes. J. Agric. Sci. 57, 1–8. doi: 10.2298/JAS1201001B
Brar, D. S., and Khush, G. S. (1997). Alien introgression in rice. Plant Mol. Biol. 35, 35–47. doi: 10.1023/A:1005825519998
Cooper, M., Rajatasereekul, S., Immark, S., Fukai, S., and Basnayake, J. (1999). Rainfed lowland rice breeding strategies for northeast Thailand. I. Genotypic variation and genotype × environment interactions for grain yield. Field Crops Res. 64, 131–151. doi: 10.1016/S0378-4290(99)00056-8
Cooper, M., and Somrith, B. (1997). “Implications of genotype-by-environment interactions for yield adaptation of rainfed lowland rice: influence of flowering date on yield variation,” in Breeding Strategies for Rainfed Lowland Rice in Drought-Prone Environments, eds S. Fukai, M. Cooper, and J. Salisbury (Canberra, ACT: Australian Centre for International Agricultural Research), 104–114.
Cornelius, P. L., Crossa, L., and Seyedsadr, M. S. (1996). “Statistical test and estimators of multiplicative models for genotype-by-environment interaction,” in Genotype-by-Environment Interaction, eds M. S. Kang and H. G. Gauch (Boca Raton, FL: CRC Press),199–234.
Crossa, J., and Cornelius, P. L. (1997). Sites regression and shifted multiplicative model clustering of cultivar trials sites under heterogeneity of variances. Crop Sci. 37, 406–415. doi: 10.2135/cropsci1997.0011183X003700020017x
Crossa, J., Cornelius, P. L., and Yan, W. (2002). Biplots of linear-bilinear models for studying crossover genotype × environment interaction. Crop Sci. 42, 619–633. doi: 10.2135/cropsci2002.0619
Crossa, J., Gauch, H. G., and Zobel, R. W. (1990). Additive main effects and multiplicative interactions analysis of two international maize cultivar trials. Crop Sci. 30, 493–500. doi: 10.2135/cropsci1990.0011183X003000030003x
Dalvi, V. V., Patel, D. V., Vashi, P. S., and Kshirsagar, R. M. (2007). Genotype × Environment interaction for yield and its components in rice hybrids. J. Maharastra Agric.Univ. 32, 25–28.
Das, S., Misra, R. C., and Patnaik, M. C. (2009). G × E interaction of mid-late rice genotypes in LR and AMMI model and evaluation of adaptability and yield stability. Environ Ecol. 27, 529–535.
Dehghani, H., Ebadi, A., and Yousefi, A. (2006). Biplot analysis of genotype by environment interaction for barley yield in Iran. Agron. J. 98, 388–393. doi: 10.2134/agronj2004.0310
Ding, M., Tier, B., and Yan, W. (2007). “Application of GGE biplot analysis to evaluate genotype (G), environment (E) and G × E interaction on P. radiata: case study,” in Australasian Forest Genetics Conference, 11–14 April 2007, the Old Woolstore, Hobart, Tasmania, Australia.
Doyle, J. J., and Doyle, J. L. (1987). A rapid DNA isolation procedure from small quantities of fresh leaf tissue. Phytochem. Bull. 19, 11–15.
Eberhart, S. A., and Russell, W. A. (1966). Stability parameters for comparing varieties. Crop Sci. 6, 36–40. doi: 10.2135/cropsci1966.0011183X000600010011x
Falconer, D. S., and Mackey, T. F. C. (1996). Introduction to Quantitative Genetics, 4th Edn. Harlow: Addison-Wesley Longman.
Finlay, K. W., and Wilkinson, G. N. (1963). The analysis of adaptation in a plant breeding programme. Aust. J. Agric. Res. 14, 742–754. doi: 10.1071/AR9630742
Freeman, G. H., and Perkins, J. M. (1971). Environmental and genotype environmental components of variability. VIII. Relations between genotypes grown in different environments and measures of these environments. Heredity 27, 15–23. doi: 10.1038/hdy.1971.67
Gauch, G. H., and Zobel, R. W. (1996). “AMMI analysis of yield trials,” in Genotype by Environment Interaction, eds M. S. Kang, and H. G. Gauch (Boca Raton, FL: CRC Press), 85–122.
Gauch, H. G. (1988). Model selection and validation for yield trials with interaction. Biometrics. 44, 705–715. doi: 10.2307/2531585
Gauch, H. G., and Zobel, R. W. (1997). Identifying mega-environments and targeting genotypes. Crop Sci. 37, 311–326. doi: 10.2135/cropsci1997.0011183X003700020002x
Henderson, S. A., Fukai, S., Jongdee, B., and Cooper, M. (1996). “Comparing simulation and experimental approaches to analysis of genotype by environment interactions for yield in rainfed lowland rice,” in Plant Adaptation and Crop Improvement, eds M. Cooper, and G. L. Hammer (Wallingford: CAB International, in Association with IRRI and ICRISAT), 443–464.
Inthapanya, P. S., Sihavong, P., Sihathep, V., Chanphengsay, M., Fukai, S., and Basnayake, J. (2000). Genotypic performance under fertilized and non-fertilized conditionsin rainfed lowland rice. Field Crops Res. 65, 1–14. doi: 10.1016/S0378-4290(99)00065-9
International Seed Testing Association (ISTA) (1999). International rules for seed testing. Seed Sci. Technol. 27, 340.
Islam, M. R., Sarker, M. R. A., Sharma, N., Rahman, M. A., Collard, B. C. Y., Gregorio, G. B., et al. (2015). Assessment of adaptability of recently released salt tolerant rice varieties in coastal regions of South Bangladesh. Field Crops Res. 190, 34–43. doi: 10.1016/j.fcr.2015.09.012
Jalata, Z. (2011). GGE-biplot analysis of multi-environment yield trials of barley (Hordeium vulgare L.) genotypes in south eastern Ethiopia highlands. Int. J. Plant Breed. Genet. 5, 59–75. doi: 10.3923/ijpbg.2011.59.75
Jeuken, M. J. W., and Lindhout, P. (2004). The development of lettuce backcross inbred lines (BILs) for exploitation of the Lactuca saligna (wild lettuce) germplasm. Theor Appl. Genet. 109, 394–401. doi: 10.1007/s00122-004-1643-7
Kaladhar, K., Swamy, B. P. M., Babu, A. P., Reddy, C. S., and Sarla, N. (2008). Mapping quantitative trait loci for yield traits in BC2F2 population derived from Swarna / O.nivara cross. Rice Genet. Newsl. 24, 34–36.
Kang, M. S. (1993). Simultaneous selection for yield and stability in crop performance trials: consequences for growers. Agron. J. 85, 754–757. doi: 10.2134/agronj1993.00021962008500030042x
Kang, M. S. (1998). Using genotype-by-environment interaction for crop cultivar development. Adv. Agron. 62, 199–252. doi: 10.1016/S0065-2113(08)60569-6
Kang, M. S., and Magari, R. (1995). STABLE: A basic program for calculating stability and yield stability statistics. Agron. J. 87, 276–277. doi: 10.2134/agronj1995.00021962008700020023x
Katsura, K., Tsujimoto, Y., Oda, M., Matsushima, K., Inusah, B., Dogbe, W., et al. (2016). Genotype-by-environment interaction analysis of rice (Oryza spp.) yield in a flood plain ecosystem in West Africa. Eur. J. Agron. 73, 152–159. doi: 10.1016/j.eja.2015.11.014
Kempton, R. A. (1984). The use of bi-plots in interpreting variety by environment interactions. J. Agric. Sci. 103, 123–135. doi: 10.1017/S0021859600043392
Kempton, R. A., Fox, P. N., and Cerezo, M. (1997). Statistical Methods for Plant Variety Evaluation. (London: Chapman and Hall), 1–8.
Kumar, A., Verulkar, S. B., Mandal, N. P., Variar, M., Shukla, V. D., Dwivedi, J. L., et al. (2012). High-yielding, drought-tolerant, stable rice genotypes for the shallow rainfed lowland drought-prone ecosystem. Field Crops Res. 133, 37–47. doi: 10.1016/j.fcr.2012.03.007
Liang, S., Ren, G., Liu, J., Zhao, X., Zhou, M., McNeil, D., et al. (2015). Genotype-by-environment interaction is important for grain yield in irrigated lowland rice. Field Crops Res. 180, 90–99. doi: 10.1016/j.fcr.2015.05.014
Mohammadi, M., Karimizadeh, R., Hosseinpour, T., Falahi, H. A., Khanzadeh, H., Sabaghnia, N., et al. (2012). Genotype × Environment interaction and stability analysis of seed yield of durum wheat genotypes in dryland conditions. Not. Sci. Biol. 4, 57–64. doi: 10.15835/nsb.4.3.7807
Nassir, A. L. (2013). Genotype × Environment analysis of some yield components of upland rice (Oryza sativa L.) under two ecologies in Nigeria. Int. J. Plant Breed. Genet. 7, 105–114. doi: 10.3923/ijpbg.2013.105.114
Nassir, A. L., and Ariyo, O. J. (2011). Genotype × Environment interaction and yield-stability analyses of rice grown in tropical inland swamp. Not. Bot. Hort. Agrobot. Cluj. 39, 220–225. doi: 10.15835/nbha3915591
Navabi, A., Yang, R. C., Helm, J., and Spaner, D. M. (2006). Can spring wheat-growing mega or niche-adapted genotypes? Crop Sci. 46, 1107–1116. doi: 10.2135/cropsci2005.06-0159
Orjuela, J., Garavit, A., Bouniol, M., Arbelaez, J. D., Moreno, L., Kimball, J., et al. (2010). A universal core genetic map for rice. Theor. Appl. Genet. 120, 563–572. doi: 10.1007/s00122-009-1176-1
Ouk, M., Basnayake, J., Tsubo, M., Fukai, S., Fischer, K. S., Kang, S., et al. (2007). Genotype-by-environment interactions for grain yield associated with water availability at flowering in rainfed lowland rice. Field Crops Res. 101, 145–154. doi: 10.1016/j.fcr.2006.10.003
Padmavathi, P. V., Satyanarayana, P. V., Ahamed, L. M., and Chamundeswari, N. (2013). Stability analysis of quality traits in rice hybrids. Oryza 50, 208–213.
Panwar, L. L., Joshi, V. N., and Ali, M. (2008). Genotype × Environment interaction in scented rice. Oryza 45, 103–109.
Perkins, J. M., and Jinks, J. L. (1968). Environmental and genotype environmental components of variability. III. Multiple lines and crosses. Heredity 23, 339–356. doi: 10.1038/hdy.1968.48
Prasad, G. S. V., Prasadarao, U., Rani, N. S., Rao, L. V. S., Pasalu, I. C., and Muralidharan, K. (2001). Indian rice varieties released around the world. Curr. Sci. 80, 1508–1511.
Rakshit, S., Ganapathy, K. N., Gomashe, S. S., Rathore, A., Ghorade, R. B., Nagesh Kumar, M. V., et al. (2012). GGE biplot analysis to evaluate genotype, environment and their interactions in sorghum multi-location data. Euphytica 185, 465–479. doi: 10.1007/s10681-012-0648-6
R Core Team (2012). R: A Language and Environment for Statistical Computing. Vienna: R Foundation for Statistical Computing. ISBN 3-900051-07-0
Shrestha, S., Asch, F., Dusserre, J., Ramanantsoanirina, A., and Brueck, H. (2012). Climate effects on yield components as affected by genotypic responses to variable environmental conditions in upland rice systems at different altitudes. Field Crops Res. 134, 216–228. doi: 10.1016/j.fcr.2012.06.011
Shukla, G. K. (1972). Some statistical aspects of partitioning genotype environmental components of variability. Heredity 29, 237–245. doi: 10.1038/hdy.1972.87
Singh, P., and Narayanan, S. S. (2006). Biometrical Techniques in Plant Breeding. New Delhi: Kalyani Publishers, 316.
Singh, R. P., and Huerta-Espino, J. (2004). “The use of 'single-backcross, selected bulk breeding approach for transferring minor genes based rust resistance into adapted cultivars,” in Proceedings of 54th Australian Cereal Chemistry Conference and 11th Wheat Breeders Assembly, 21–24 September 2004, eds C. K. Black, J. F. Panozzo, G. J. Rebetzke (Canberra, ACT), 48–51
Sreedhar, S., Reddy, T. D., and Ramesha, M. S. (2011). Genotype × Environment interaction and stability for yield and its components in hybrid rice cultivars (Oryza sativa L.). Int. J. Plant Breed. Genet. 5, 194–208. doi: 10.3923/ijpbg.2011.194.208
Swamy, B. P. M., Kaladhar, K., Ramesha, M. S., Viraktamath, B. C., and Sarla, N. (2011). Molecular mapping of QTLs for yield and yield-related traits in Oryza sativa cv Swarna × O. nivara (IRGC81848) backcross population. Rice Sci. 18, 178–186. doi: 10.1016/S1672-6308(11)60025-5
Swamy, B. P. M., and Sarla, N. (2008). Yield enhancing quantitative trait loci (QTLs) from wild species. Biotechnol. Adv. 26, 106–120. doi: 10.1016/j.biotechadv.2007.09.005
Tanksley, S. D., and McCouch, S. R. (1997). Seed banks and molecular maps: unlocking genetic potential from the wild. Science 277, 1063–1066. doi: 10.1126/science.277.5329.1063
Tariku, S., Taddesse, L., Bitew, M., and Asfaw, M. (2013). Genotype by environment interaction and grain yield stability analysis of rice (Oryza sativa L.) genotypes evaluated in north western Ethiopia. Net. J. Agric. Sci. 1, 10–16.
Tian, F., Li, D. J., Fu, Q., Zhu, Z. F., Fu, Y. C., Wang, X. K., et al. (2006). Construction of introgression lines carrying wild rice (Oryza rufipogon Griff.) segments in cultivated rice (Oryza sativa L.) background and characterization of introgressed segments associated with yield-related traits. Theor. Appl. Genet. 112, 570–580. doi: 10.1007/s00122-005-0165-2
Vanave, P. B., Apte, U. B., Kadam, S. R., and Thaware, B. L. (2014). Stability analysis for straw and grain yield in rice (Oryza sativa L.) Electron. J. Plant Breed. 5, 442–444.
van Berloo, R. (2008). GGT 2.0 Versatile software for visualization and analysis of genetic data. J. Hered. 99, 232–236. doi: 10.1093/jhered/esm109
Wade, L. J., McLaren, C. G., Criseno, L., Amarante, S. T., Sarawgi, A. K., Kumar, R., et al. (1997). “Genotype-by-environment interactions: RLRRC Experience,” in Breeding Strategies for Rainfed Lowland Rice in Drought-prone Environments, eds S. Fukai, M. Cooper, and J. Salisbury (Canberra, ACT: Australian Centre for International Agricultural Research), 115–125
Wade, L. J., McLaren, C. G., Quintana, L., Harnpichitvitaya, D., Rajatasereekul, S., Sarawgi, A. K., et al. (1999). Genotype by environment interactions across diverse rainfed lowland rice environments. Field Crops Res. 64, 35–50. doi: 10.1016/S0378-4290(99)00049-0
Waghmode, B. D., and Mehta, H. D. (2011). Genotype × environment interaction and stability analysis in hybrid rice. Crop Improv. 38, 6–12.
Wang, Y. M., Dong, Z. Y., Zhang, Z. J., Lin, X. Y., Shen, Y., Zhou, D. W., et al. (2005). Extensive de novo genomic variation in rice induced by introgression from wild rice (Zizania latifolia Griseb.). Genetics 170, 1945–1956. doi: 10.1534/genetics.105.040964
Wickneswari, R., Bhuiyan, M. A. R., Kalluvettankuzhy, K. S., Lim, L. S., Thomson, M. J., Narimah, M. K., et al. (2012). Identification and validation of quantitative trait loci for agronomic traits in advanced backcross breeding lines derived from Oryza rufipogon × Oryza sativa cultivar MR219. Plant Mol. Biol. Rep. 30, 929–939. doi: 10.1007/s11105-011-0404-4
Yan, W., and Hunt, L. A. (2001). Interpretation of genotype × environment interaction for winter wheat yield in Ontario. Crop Sci. 41, 19–25. doi: 10.2135/cropsci2001.41119x
Yan, W., and Kang, M. S. (2003). GGE Biplot Analysis: a Graphical Tool for Breeders, Geneticists, and Agronomists. Boca Raton, FL: CRC Press.
Keywords: BILs, stability, AMMI, GGE, Oryza nivara, yield traits
Citation: Balakrishnan D, Subrahmanyam D, Badri J, Raju AK, Rao YV, Beerelli K, Mesapogu S, Surapaneni M, Ponnuswamy R, Padmavathi G, Babu VR and Neelamraju S (2016) Genotype × Environment Interactions of Yield Traits in Backcross Introgression Lines Derived from Oryza sativa cv. Swarna/Oryza nivara. Front. Plant Sci. 7:1530. doi: 10.3389/fpls.2016.01530
Received: 11 March 2016; Accepted: 29 September 2016;
Published: 19 October 2016.
Edited by:
John Doonan, Aberystwyth University, UKReviewed by:
Natalie Brezinova Belcredi, Mendel University, CzechiaYaunhuai Han, Shanxi Agricultural University, China
Copyright © 2016 Balakrishnan, Subrahmanyam, Badri, Raju, Rao, Beerelli, Mesapogu, Surapaneni, Ponnuswamy, Padmavathi, Babu and Neelamraju. This is an open-access article distributed under the terms of the Creative Commons Attribution License (CC BY). The use, distribution or reproduction in other forums is permitted, provided the original author(s) or licensor are credited and that the original publication in this journal is cited, in accordance with accepted academic practice. No use, distribution or reproduction is permitted which does not comply with these terms.
*Correspondence: Divya Balakrishnan, ZGl2eWFiMDAwNUBnbWFpbC5jb20=; ZGl2eWFiYWxha3Jpc2huYW4wNUBnbWFpbC5jb20=
 Divya Balakrishnan
 Desiraju Subrahmanyam
 Jyothi Badri
 Addanki Krishnam Raju
 Yadavalli Venkateswara Rao
 Kavitha Beerelli
 Sukumar Mesapogu
 Malathi Surapaneni
 Revathi Ponnuswamy
 Sarla Neelamraju