
94% of researchers rate our articles as excellent or good
Learn more about the work of our research integrity team to safeguard the quality of each article we publish.
Find out more
ORIGINAL RESEARCH article
Front. Plant Sci. , 14 June 2016
Sec. Evolutionary and Population Genetics
Volume 7 - 2016 | https://doi.org/10.3389/fpls.2016.00843
This article mentions parts of:
The complete chloroplast genome sequence of the relict woody plant Metasequoia glyptostroboides Hu et Cheng
 Sajjad Asaf1
 Abdul L. Khan2
 Abdur R. Khan1
 Muhammad Waqas1,3
 Sang-Mo Kang1
 Muhammad A. Khan1
 Seok-Min Lee1
 In-Jung Lee1*
Nicotiana otophora is a wild parental species of Nicotiana tabacum, an interspecific hybrid of Nicotiana tomentosiformis and Nicotiana sylvestris. However, N. otophora is least understood as an alternative paternal donor. Here, we compared the fully assembled chloroplast (cp) genome of N. otophora and with those of closely related species. The analysis showed a cp genome size of 156,073 bp and exhibited a typical quadripartite structure, which contains a pair of inverted repeats separated by small and large single copies, containing 163 representative genes, with 165 microsatellites distributed unevenly throughout the genome. Comparative analysis of a gene with known function across Nicotiana species revealed 76 protein-coding sequences, 20 tRNA sequences, and 3 rRNA sequence shared between the cp genomes. The analysis revealed that N. otophora is a sister species to N. tomentosiformis within the Nicotiana genus, and Atropha belladonna and Datura stramonium are their closest relatives. These findings provide a valuable analysis of the complete N. otophora cp genome, which can identify species, elucidate taxonomy, and reconstruct the phylogeny of genus Nicotiana.
Chloroplasts contain a circular DNA with approximately 130 genes, with a size ranging from 72 to 217 kb (Sugiura, 1995; Moore et al., 2007). Most cp genomes have a typical quadripartite structure consisting of a small single copy region (SSC), large single copy region (LSC), and a pair of inverted repeats (IRs) (Yurina and Odintsova, 1998; Wang et al., 2015). These inverted repeats (IRs) might influence the length of various cp genomes (Chang et al., 2006; Guisinger et al., 2011). The chloroplast (cp) DNA of green plants is exceptionally conserved in gene content and organization, providing sufficient resources for genome-wide evolutionary studies. Recent efforts have demonstrated the potential to resolve phylogenetic relationships at different taxonomic levels, and understand structural and functional evolution, by using the whole chloroplast genome sequences (Jansen et al., 2007; Moore et al., 2010). Because of the generally conservative nature of the cp genome structure, cp genome data is used most often to address phylogenetic and evolutionary questions at or above the species level.
Tobacco leaf is one of the most economically important parts of the common tobacco plant (Occhialini et al., 2016). Analyzing the composition and structure of the cp genome for such an economically important crop can explore novel genetic and evolutionary variations, which could improve plant traits (Jin and Daniell, 2015). Of the tobacco species, Nicotiana tabacum is one of the most widely grown commercial crops in different regions of the world. It is also a typical model organism for research in basic and important biological processes (Zhang et al., 2011). Nicotiana tabacum provides a key source of BY-2 plant cell lines for molecular research studies related to plant pathology and disease resistance (Nagata et al., 1992). Furthermore, considerable interest has focused on understanding the origin, organization and evolution of N. tabacum genome. It is stands out as a complex allotetraploid with large genome 4.5 GB with significant proportion of repeats (Renny-Byfield et al., 2011). As a species, N. tobacum evolved through the interspecific hybridization of the ancestors of Nicotiana sylvestris (maternal donor and Nicotiana tomentosiformis (paternal donor) about 200,000 year ago (Leitch et al., 2008). However, based on mitochondria and chloroplast sequence data, the chromosome segregation morphology of the flowers, and the presence of an S genome in tobacco, is thought to originate from the N. sylvestris ancestor (Sperisen et al., 1991; Murad et al., 2002). Development in modern genomics and the genome sequences of modern varieties of ancestral species were previously reported (Sierro et al., 2013), and limited evidence suggests that N. otophora is an alternative paternal donor (Gazdova et al., 1995; Riechers and Timko, 1999).
Plastids of N. otophora leaf tissue are fundamental organelles for photosynthesis and metabolic functioning. These are thought to have originated through endosymbiosis of free-living cyanobacteria with eukaryotic cells (Rodriguez-Ezpeleta et al., 2005), and remnants of cyanobacterial genes were transferred to the nucleus (Timmis et al., 2004). The angiosperm plastome has a uniparental inheritance and stable structure, making it a more informative and valuable source for phylogenetic analysis at different taxonomic levels (Ravi et al., 2008) than are mitochondrial genomes (Timmis et al., 2004). Previously, phylogenetic analyses were based on sequencing one or a few loci from plastomes of various taxa. The availability of complete chloroplast sequences, and advances in next generation sequencing techniques, has made whole plastome analysis achievable with greater and more valuable information, which could produce noteworthy results, and reduce sampling error (Martin et al., 2005). This whole genome approach may help clarify previous ambiguous phylogenetic relationships (Jansen et al., 2007; Moore et al., 2010). Recently, high–throughput sequencing technologies enabled the sequencing of hundreds of plastid genomes for terrestrial plants (Wu, 2015). Therefore, various organelle genomes from various important medicinal plants have been reported, and some are still being analyzed (Michael and Jackson, 2013).
In this study, we sequenced and analyzed the first complete chloroplast genome of N. otophora. The complete cp genome of N. otophora, in conjunction with previously reported cp genomes sequences, will improve our understanding of the evolutionary history of Nicotiana genus within Solanaceae, especially regarding the position of N. otophora in evolution and plant systematics. Hence, we analyzed the fully assembled chloroplast (cp) genome of N. otophora and compared its relationship with closely related species, such as N. tomentosiformis, N. tabacum, N. sylvestris, and N. undulata.
A standard protocol of DNA extraction was followed as described in detailed by Sierro et al. (2014). The pure DNA was sequenced using on an Illumina HiSeq-2000. About 67,460,219 raw reads were demultiplexed, trimmed and filtered using CLC Genomics Workbench v7.0 (CLC Bio, Aarhus, Denmark). Filtered reads were assembled using N. tabacum (NC001879) as a reference genome by following the method described by Wu (2015, 2016).
The online program (DOGMA) was used to annotate the N. otophora cp genome (Wyman et al., 2004). The annotation results were checked manually and codon positions were adjusted by comparing to a previously homologs gene from various chloroplast genomes present in the database. Furthermore, the tRNAscan-SE version1.21 (Schattner et al., 2005) was used to verify all transfer RNA genes using default settings. The OGDRAW program (Lohse et al., 2007) was used to draw a circular map of the N. otophora cp genome. GC content and codon usage were analyzed by the MEGA 6 software (Kumar et al., 2008). The mVISTA software was used to compere the N. otophora cp genome with four other cp genomes using the N. otophora annotation as reference (Frazer et al., 2004).
To identify repeat sequences, including palindromic, reverse, and direct repeats within the cp genome, REPuter software was used (Kurtz et al., 2001). The following conditions for repeat identification were used in REPuter: (1) Hamming distance of 3, (2) 90% or greater sequence identity, (3) and a minimum repeat size of 30 bp. Phobos software (Leese et al., 2008) was used to detect (SSRs) within the cp genome, with the parameters set at ten repeat units ≥10 for mononucleotides, eight repeat units ≥8 for dinucleotides, four repeat units ≥4 for trinucleotides and tetranucleotides, and three repeat units ≥3 for pentanucleotide and hexanucleotide SSRs. Furthermore, tandem repeats in the N. otophora cp genome were identified using the Tandem Repeats Finder version 4.07 b (Benson, 1999), with default settings.
After aligning the sequences using MAFFT (Katoh and Standley, 2013), BioEdit software (http://www.mbio.ncsu.edu/bioedit/bioedit.html) was used to adjust the sequences manually. Furthermore, a sliding window analysis was conducted for variability (Pi) evaluation in LSC, SSC, and IR regions of the cp genome using the DnaSP version 5.1 software (Librado and Rozas, 2009). The step size was set to 200 bp, with a 600-bp window length.
We used LSC, SSC, and IR regions to analyze the average pair wise sequence divergence for four Nicotiana species: N. sylvestris, N. tabacum, N. tomentosiformis, and N. undulata cp genomes. The missing and ambiguous gene annotations were reconfirmed by comparative sequence analysis after a multiple sequence alignment and gene order comparison. These regions were aligned using the Clustal W software (Thompson et al., 1994). Furthermore, Kimura's two parameter (K2P) model was selected to calculate the pairwise sequence divergences (Kimura, 1980). To elucidate the N. otophora phylogenetic position within the Solanaceae family, multiple alignments were performed using 75 protein-coding genes shared by the cp genomes of 12 Solanaceae members representing five genera. Two species, Citrus aurantifolia and Citrus sinensis, were designated as out-groups. Maximum parsimony (MP) analysis was executed using MEGA 6 (Tamura et al., 2013), and for Maximum likelihood (ML) analysis, the GTR + I + G nucleotide substitution model was selected. Furthermore, Bayesian inference (BI) was implemented with MrBayes 3.12 using setting (MCMC algorithm for 1,000,000 generations with 4 incrementally heated chains, starting from random trees and sampling one out of every 100 generations) from Wu et al. (2015).
N. otophora Cp genome were assembled by mapping all Illumina reads to the draft cp genome sequence, using CLC Genomics Workbench v7.0. A total of 1,877,281 reads were obtained, with an average length of 101 bp, thus yielding 341.885x coverage of the cp genome. The consensus sequence for a specific position was generated by assembling reads mapped to the position and used to construct the complete sequence of N. otophora cp genome. The size of the complete N. otophora cp genome (156,073 bp) was found to be within the range of other angiosperms (Yang et al., 2010). The cp genome exhibited a distinctive quadripartite structure, which includes a pair of inverted repeats (IRa and IRb 25,888 bp), and separate SSC (17677 bp) and LSC (86621 bp) regions (Table 1, Figure 1). The GC content (37.7%) of the N. otophora cp genome is very similar to other Nicotiana species cp genomes (Table 1; Sugiyama et al., 2005; Yukawa et al., 2006). The GC contents of the LSC and SSC regions (35.8 and 32%) are lower than that of the IR regions (43%). This high GC percentage in the IR regions is due to the presence of eight ribosomal RNA (rRNA) sequences in these regions. Current results are similar to data that previously reported a high GC percentage in the IR regions, which could be due to the presence of ribosomal RNA (Qian et al., 2013).
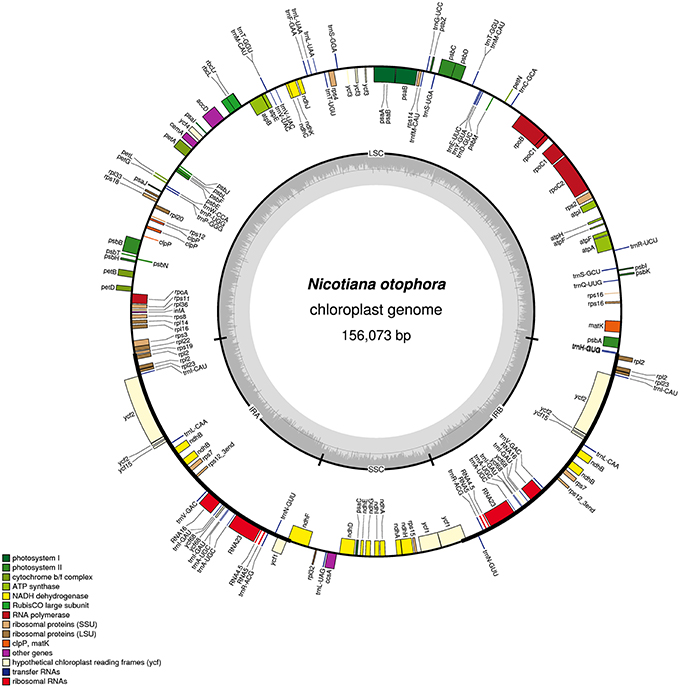
Figure 1. Gene map of the N. otophora chloroplast genome. Genes drawn inside the circle are transcribed clockwise, and those outside are counterclockwise. Genes belonging to different functional groups are color-coded. The darker gray in the inner circle corresponds to GC content, and the lighter gray corresponds to AT content.
A total of 163 genes were found in the N. otophora cp genome, of which 116 are unique, including 110 protein-coding genes, 45 tRNA genes, and 8 rRNA genes (Figure 1, Table 1). Fourteen protein coding, four rRNA, and nine tRNA genes are repeated in the IR regions. The LSC region comprises 96 protein coding and 26 tRNA genes, whereas the SSC region comprises 15 protein-coding genes and 1 tRNA gene. The protein-coding genes present in the N. otophora cp genome include nine genes for large ribosomal proteins (rpl2, 14, 16, 20, 22, 23, 32, 33, 36), 11 genes for small ribosomal proteins (rps2, 3, 7, 8, 11, 12, 14, 15, 16, 18, 19), 5 genes for photosystem I (psaA, B, C, I, J), and 10 genes related to photosystem II. Furthermore, there are six genes (atpA, B, E, F, H, I) for ATP synthase and the electron transport chain in the N. otophora cp genome (Table 2). A similar pattern of protein coding genes was also shown by Sugiyama et al. (2005) and Yukawa et al. (2006) for N. tabbacum and N. sylvestris, respectively.
Protein, rRNAs, and tRNAs are encoded by 51.5, 5.79, and 1.86% of the whole chloroplast genome, respectively, and the remaining 40.85% is non-coding regions. The 29 unique tRNA genes encode all of the 20 amino acids essential for protein biosynthesis. Furthermore, protein-coding sequences (CDS) are 80,379 bp in length and comprise 110 protein genes, which code for 26,793 codons (Tables 1, 3). The N. otophora cp genome codon usage frequency was determined by tRNA and protein-coding gene sequences (Table S1). Interestingly, leucine (10.6%) and cysteine (1.2%) were the maximum and minimum commonly coded amino acids, respectively (Figure 2). Among these, the maximum and minimum codons used were ATT (1087), encoding isoleucine, and ATT (1) encoding methionine, respectively. The AT content was 50.15, 61.72, and 66.83% at the 1st, 2nd, and 3rd codon positions within the CDS region (Table 3). The preference for a high AT content at the 3rd codon position is due to the A and T concentration reported in various terrestrial plant cp genomes (Morton, 1998; Tangphatsornruang et al., 2010; Nie et al., 2012; Qian et al., 2013).
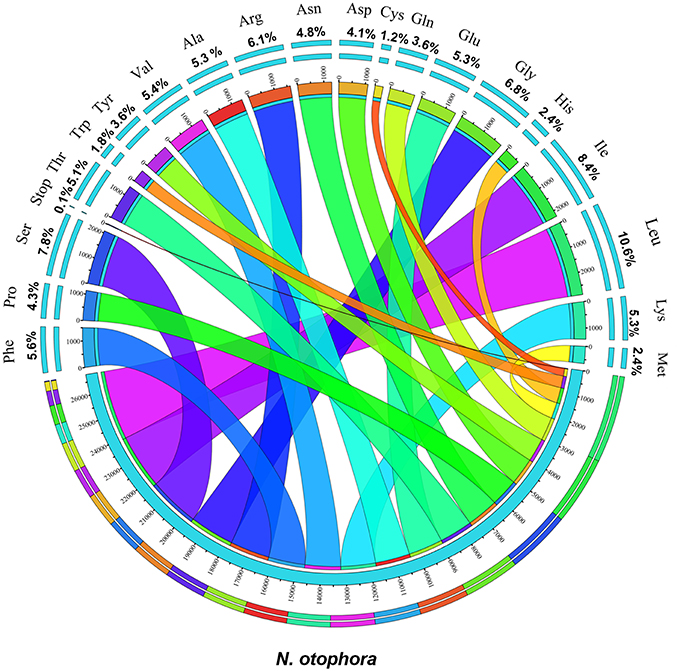
Figure 2. Amino acid frequencies of the N. otophora cp protein coding sequences. The frequencies of amino acids were calculated for all 110 protein-coding genes from the start to the stop codon.
Repeat sequences are very helpful in phylogenetic study, and play a vital role in genome rearrangement (Cavalier-Smith, 2002; Nie et al., 2012). Furthermore, analysis of the various cp genomes concluded that repeat sequences are essential to induce indels and substitutions (Yi et al., 2013). For repeat analysis, 20 palindromic repeats, 19 forward repeats, and 18 tandem repeats were identified in the N. otophora cp genome (Figure 3A). Among these, 17 forward repeats had a size of 30–44 bp in length, whereas only two tandem repeats were found to be same length, and 16 were 15–29 bp in length (Figures 3A–D). Similarly, 17 palindromic repeats were 30–44 bp, and two repeats were 45–59 bp in length (Figure 3B). Overall, 57 repeats were found in the N. otophora cp genome. Similarly, 56, 57, 53, 51 repeat pairs were found in previously reported N. sylvestris, N. tabacum, N. tomentosiformis, and N. undulata (Figure 3A; Yukawa et al., 2006) genomes, respectively, when compared with N. otophora (Figure 3A). About 29.4% of these repeats were distributed in protein coding regions (Table S2). Previous reports suggested that sequence variation and genome rearrangement occurs due to the slipped strand mispairing and the improper recombination of these repeat sequences (Cavalier-Smith, 2002; Asano et al., 2004; Timme et al., 2007). Furthermore, the presence of these repeats indicates that the region is a crucial hotspot for genome reconfiguration (Gao et al., 2009). Additionally, these repeats are an informative source for developing genetic markers for phylogenetic and population genetics studies (Nie et al., 2012).
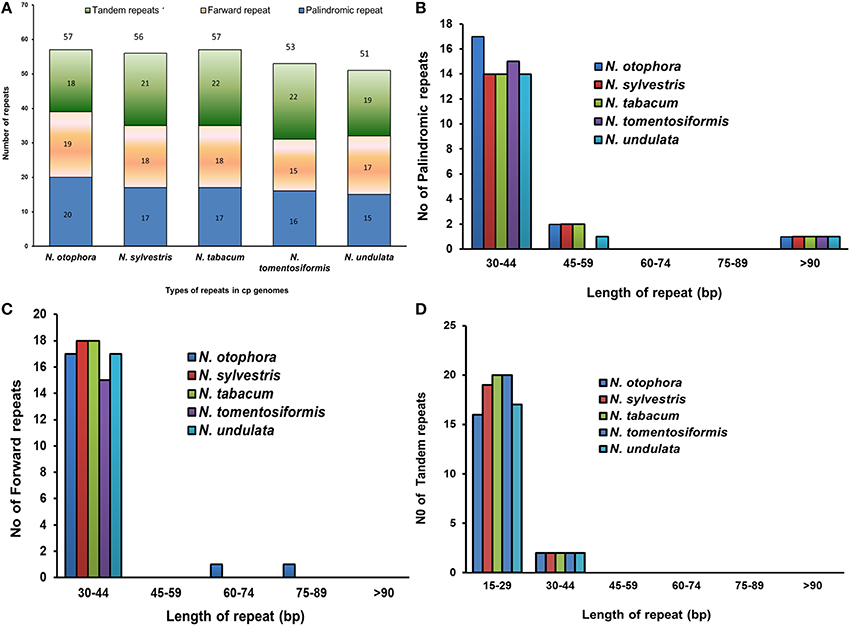
Figure 3. Analysis of repeated sequences in five Nicotiana chloroplast genomes. (A), Total of three repeat types; (B), Frequency of the palindromic repeat by length; (C), frequency of the direct repeat by length; and (D), Frequency of tandem repeat by length.
Simple sequence repeats (SSRs), or microsatellites, are 1–6 bp repeating sequences, which are distributed throughout the genome. Due to a high polymorphism rate at the species level, SSRs have been recognized as one of the main sources of molecular markers, and have been extensively researched in phylogenetic investigations and population genetics (Powell et al., 1995; Provan et al., 1997; Pauwels et al., 2012). In this study, we detected perfect SSRs over 10 bp in N. otophora together with four other Nicotiana species cp genomes (Figure 4A). Certain parameters were set, because SSRs of 10 bp or longer are prone to slipped strand mispairing, which is believed to be the main mutational mechanism for polymorphism (Rose and Falush, 1998; Raubeson et al., 2007; Huotari and Korpelainen, 2012). A total of 165 perfect microsatellites were analyzed in the N. otophora cp genome based on SSR analysis (Figure 4A). Similarly 163, 162, 159, and 162 SSRs were detected in N. sylvestris, N. tabacum, N. tomentosiformis, and N. undulata, respectively (Figure 4A). The majority of the SSRs in these cp genomes are mononucleotides, varying in quantity from 38 in N. sylvestris to 49 in N. otophora. Interestingly, trinucleotides are the second most predominant, ranging from 64 in N. otophora to 74 in N. sylvestris. Furthermore, only one pentanucleotide is present in all species (Figure 4A). In N. otophora, all mononucleotides (100%) are composed of A/T, and a similar majority of dinucleotides (61.36%) is comprised of A/T (Figure 4B). Our findings are comparable to previously reported arguments that SSRs found in the chloroplast genome are generally composed of polythymine (polyT) or polyadenine (polyA) repeats, and infrequently contain tandem cytosine (C) and guanine (G) repeats (Kuang et al., 2011). Therefore, these SSRs contribute to the AT richness of the N. otophora cp genome, as previously reported for different species (Kuang et al., 2011; Chen et al., 2015). SSRs were also detected in CDS regions of the N. otophora cp genome. The CDS account for approximately 51.50% of the total length. About 70.9% of SSRs are detected in non-coding regions, whereas only 26% of SSRs are present in the protein-coding region. Furthermore, about 2.42% of SSRs are present in the rRNAs and 0.6% was detected in tRNA genes. These results suggest an uneven distribution of SSRs in the N. otophora cp genome, which was also reported for different angiosperm cp genomes (Chen et al., 2015).
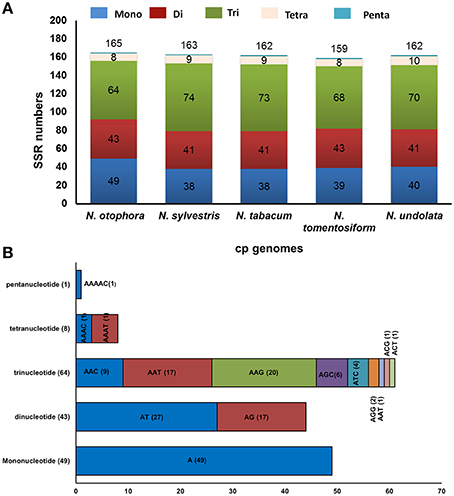
Figure 4. Analysis of simple sequence repeat (SSR) in the five Nicotiana chloroplast genomes. (A) Number different SSRs types detected in five genomes and (B) Frequency of identified SSR motifs in different repeat class types.
Four complete cp genomes within the Nicotiana genus, namely N. sylvestris (155,941 bp), N. tabacum (155,943 bp), N. tomentosiformis (155,745 bp), and N. undulata (155,863 bp) were selected for comparison with N. otophora (156,073 bp). The genome size of N. otophora is the largest of these, and this difference is mostly attributed to the variation in the length of the IR region (Table 1). Analysis of genes with known functions showed that N. otophora shared 76 protein-coding genes, 20 tRNA genes, and 3 rRNA genes, with four other Nicotiana species cp genomes. The number of unique genes found in N. otophora, N. sylvestris, N. tabacum, N. tomentosiformis, and N. undulata cp genomes were 116, 105, 103, 105, and 114, respectively (Figure 5, Table S3).Furthermore, the overall gene organization and gene structures of these genomes were found very similar. However, some genes like, cemA and infA genes were found in N. otophora, N. tabacum and N. undulata while absent from N. sylvestris and N. tomentosiformis cp genomes. Similarly two genes rbcLr and ycf68 were observed only in N. otophora genome (Table S4). The ycf10 gene was absent in N.otophora, N. tabacum and N. undulata and founded in N. sylvestris and N. tomentosiformis cp genomes (Table S4).
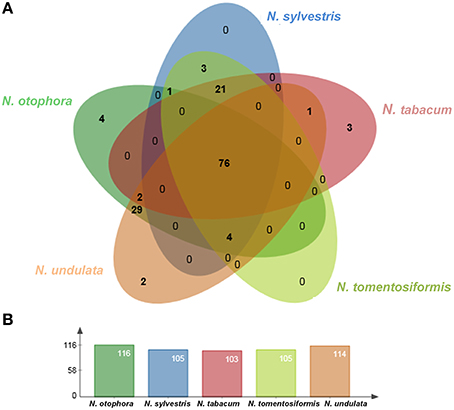
Figure 5. Venn diagram illustrating the proportion of genes in five Nicotiana cp genomes. (A) Number of protein coding genes shared by five Nicotiana cp genomes. (B) Number of unique genes identified in each cp genome.
Pairwise cp genomic alignment between N. otophora with four other genomes uncovered a high degree of synteny. N. otophora annotation was used as a reference to plot the overall sequence identity of five Nicotiana species cp genomes using mVISTA (Figure 6). The results show that the LSC and SSC regions are more divergent than the two IR regions. Furthermore, non-coding regions exhibit a higher divergence than coding regions. These highly divergent regions include ndhD, ndhH, ndhF, trnH-psbA, matK, ycF2, rpl22, rps15, and atpB among others. Similar results related to these genes were reported previously (Qian et al., 2013), and the differences among various coding regions between species were also analyzed (Kumar et al., 2009).
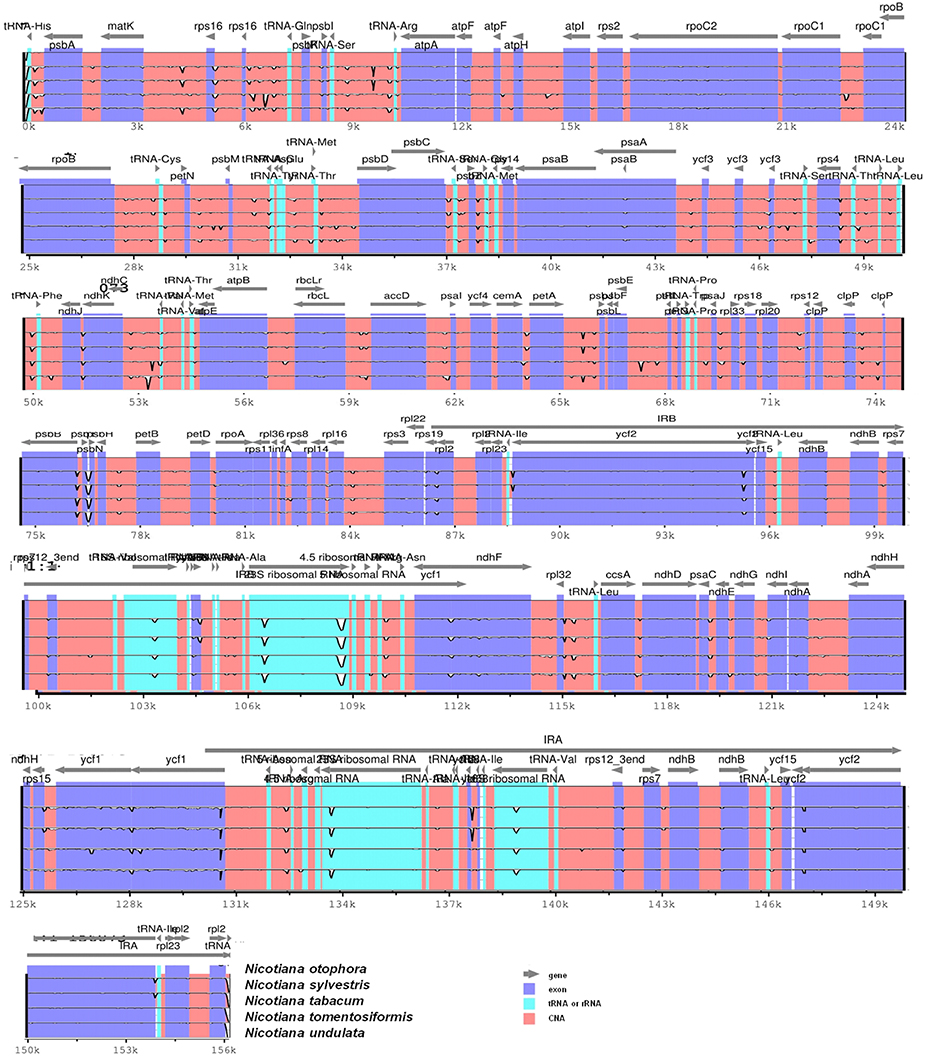
Figure 6. Visualization alignment of five chloroplast genome sequences. VISTA-based identity plot showing sequence identity among five Nicotiana species using N. otophora as a reference. The thick black line shows the inverted repeats (IRs) in the chloroplast genomes.
We compared the IR, LSC, and SSC regions in cp genomes and calculated the average pairwise sequence divergence among these five species. Of these regions, SSC had >0.010 average sequence divergence, and the most divergent region was found in N. undulata (0.0149). Among these three regions, IR has the least average sequence divergence (0.003) (Table S5). Furthermore, to calculate the sequence divergence level, the nucleotide variability (Pi) values within 600 bp in these five chloroplast genome LSC, SSC, and IR regions were calculated (Figure 7). In the IR region, these values varied from 0 to 0.1162 with a mean of 0.00216, the LSC region was from 0 to 0.030 with a mean of 0.0021, and the SSC regions were 0–0.1140, with a mean of 0.00321, indicating that the differences among these genome regions were small. However, some highly variable loci, including trnA, psbA, matK, rps1, rps15, atpB, rpl22, rpl14, clpP, ndhF, ndhD, ndhH, ycF2, ycF4, and ycF15, were more precisely located (Figure 7). All of these regions had much higher values than other regions (Pi > 0.007). Eight of these loci were located in the LSC region, four in the SSC region, and two were in the IR region. Among them, psbA, clpP, matK, ndhF, rpl22, rps15, rpl14, ycF2, and ycF15 have been detected as highly variable regions in different plants (Kim and Lee, 2004; Dong et al., 2012; Qian et al., 2013). Based on these results, we believe that ycf2, clpP, matK, rpl22, rps15, and ndhF, which have comparatively high sequence deviation, are good sources for interspecies phylogenetic analysis, as previously reported (Chen et al., 2015).
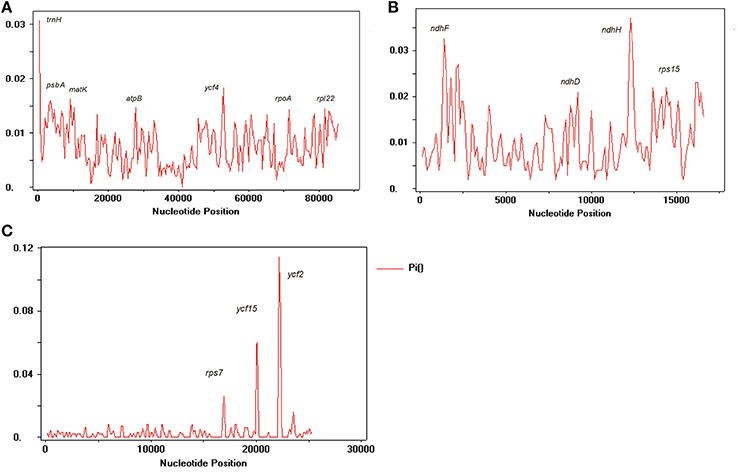
Figure 7. Sliding window analysis of N. otophora with four Nicotiana cp genomes. (A) Analysis of LSC regions, (B) Analysis of SSC regions, and (C) Analysis of IR regions. (window length: 600 bp, step size: 200 bp). X-axis, position of the midpoint of a window; Y-axis, nucleotide diversity of each window.
To study the phylogenetic position of N. otophora within the Solanaceae family, we used 75 protein-coding genes shared by the cp genomes of 13 Solanaceae members, representing five genera, for multiple alignments (Figure 8). Two species, C. aurantifolia and C. sinensis, were set as outgroups. Maximum likelihood (ML) analysis revealed 8 out of 11 nodes with bootstrap values ≥99%, and most of these nodes had 100% bootstrap values. For maximum parsimony (MP), the bootstrap values were very high for the MP tree, with values ≥99% for 10 of the 11 nodes. Both the ML and MP phylogenetic results were strongly supported, with 100% bootstrap values, and the position of N. otophora is clustered with N. tomentosiformis within Nicotiana, with Atropha belladonna and Datura stramonium as their closest relatives (Figure 8). Twelve species of Solanaceae from five different genera showed extremely conserved cp genome structures. In recent years, numerous studies employ cp DNA sequences to enrich phylogenetic analysis, which is substantially increasing our understanding of the evolutionary relationship between angiosperms (Leebens-Mack et al., 2005; Jansen et al., 2007; Moore et al., 2007).
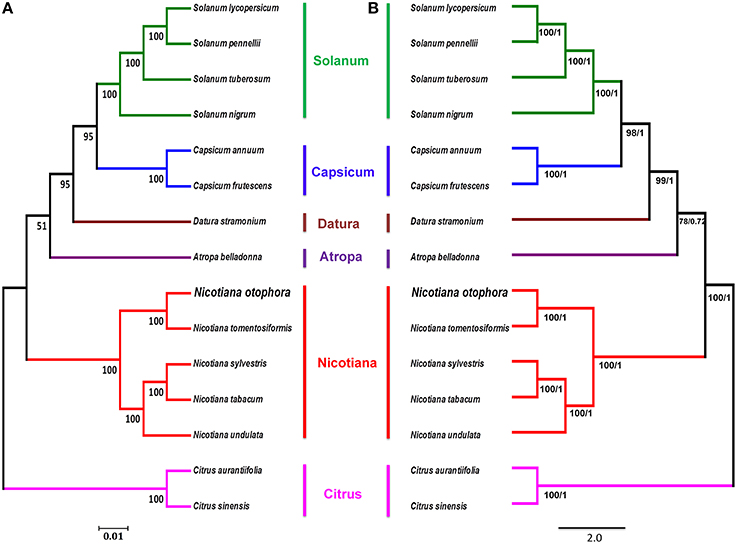
Figure 8. Phylogenetic relationship of N. otophora with related species based on 75 protein-coding genes shared by all cp genomes. Tree constructed by maximum likelihood (A), maximum parsimony and Bayesian inference (B) with Citrus aurantifolia and Citrus sinensis as outgroups.
This study reported the complete chloroplast genome sequence of N. otophora (156,073 bp). The structure and organization of this genome is very similar to previously reported cp genomes from genus Nicotiana. The location and distribution of repeat sequences were detected, and LSC, SSC, and IR region sequence divergences were identified. Furthermore, MP and ML phylogenetic trees were constructed on the basis of protein coding genes, which were also shared by 12 Solanaceae members from five different genera. The data presented here will facilitate our understanding of the evolutionary history of tobacco. These findings provide a valuable analysis of the complete cp genome of N. otophora, which can be used to identify species, elucidate taxonomy, or reconstruct the phylogeny of the Nicotiana genus.
All authors listed, have made substantial, direct and intellectual contribution to the work, and approved it for publication.
This study was supported by a research fund (311058-05-3-CG000) from the Ministry for Food, Agriculture, Forestry, and Fisheries, Republic of Korea.
The authors declare that the research was conducted in the absence of any commercial or financial relationships that could be construed as a potential conflict of interest.
The Supplementary Material for this article can be found online at: http://journal.frontiersin.org/article/10.3389/fpls.2016.00843
Asano, T., Tsudzuki, T., Takahashi, S., Shimada, H., and Kadowaki, K. (2004). Complete nucleotide sequence of the sugarcane (Saccharum officinarum) chloroplast genome: a comparative analysis of four monocot chloroplast genomes. DNA Res. 11, 93–99. doi: 10.1093/dnares/11.2.93
Benson, G. (1999). Tandem repeats finder: a program to analyze DNA sequences. Nucleic Acids Res. 27, 573–580. doi: 10.1093/Nar/27.2.573
Cavalier-Smith, T. (2002). Chloroplast evolution: Secondary symbiogenesis and multiple losses. Curr. Biol. 12, R62–R64. doi: 10.1016/S0960-9822(01)00675-3
Chang, C. C., Lin, H. C., Lin, I. P., Chow, T. Y., Chen, H. H., Chen, W. H., et al. (2006). The chloroplast genome of Phalaenopsis aphrodite (Orchidaceae): comparative analysis of evolutionary rate with that of grasses and its phylogenetic implications. Mol. Biol. Evol. 23, 279–291. doi: 10.1093/molbev/msj029
Chen, J. H., Hao, Z. D., Xu, H. B., Yang, L. M., Liu, G. X., Sheng, Y., et al. (2015). The complete chloroplast genome sequence of the relict woody plant Metasequoia glyptostroboides Hu et Cheng. Front. Plant Sci. 6:447. doi: 10.3389/Fpls.2015.00447
Dong, W. P., Liu, J., Yu, J., Wang, L., and Zhou, S. L. (2012). Highly variable chloroplast markers for evaluating plant phylogeny at low taxonomic levels and for DNA barcoding. PLoS ONE 7:e35071. doi: 10.1371/journal.pone.0035071
Frazer, K. A., Pachter, L., Poliakov, A., Rubin, E. M., and Dubchak, I. (2004). VISTA: computational tools for comparative genomics. Nucleic Acids Res. 32, W273–W279. doi: 10.1093/nar/gkh458
Gao, L., Yi, X., Yang, Y. X., Su, Y. J., and Wang, T. (2009). Complete chloroplast genome sequence of a tree fern Alsophila spinulosa: insights into evolutionary changes in fern chloroplast genomes. BMC Evol. Biol. 9:130. doi: 10.1186/1471-2148-9-130
Gazdova, B., Siroky, J., Fajkus, J., Brzobohaty, B., Kenton, A., Parokonny, A., et al. (1995). Characterization of a new family of tobacco highly repetitive DNA, grs, specific for the Nicotiana-tomentosiformis genomic component. Chromosome Res. 3, 245–254. doi: 10.1007/bf00713050
Guisinger, M. M., Kuehl, J. V., Boore, J. L., and Jansen, R. K. (2011). Extreme reconfiguration of plastid genomes in the angiosperm family geraniaceae: rearrangements, repeats, and codon usage (vol 28, pg 583, 2011). Mol. Biol. Evol. 28, 1543–1543. doi: 10.1093/molbev/msr037
Huotari, T., and Korpelainen, H. (2012). Complete chloroplast genome sequence of Elodea canadensis and comparative analyses with other monocot plastid genomes. Gene 508, 96–105. doi: 10.1016/j.gene.2012.07.020
Jansen, R. K., Cai, Z., Raubeson, L. A., Daniell, H., dePamphilis, C. W., Leebens-Mack, J., et al. (2007). Analysis of 81 genes from 64 plastid genomes resolves relationships in angiosperms and identifies genome-scale evolutionary patterns. Proc. Natl. Acad. Sci. U.S.A. 104, 19369–19374. doi: 10.1073/pnas.0709121104
Jin, S., and Daniell, H. (2015). The engineered chloroplast genome just got smarter. Trends Plant Sci. 20, 622–640. doi: 10.1016/j.tplants.2015.07.004
Katoh, K., and Standley, D. M. (2013). MAFFT multiple sequence alignment Software Version 7: improvements in performance and usability. Mol. Biol. Evol. 30, 772–780. doi: 10.1093/molbev/mst010
Kim, K. J., and Lee, H. L. (2004). Complete chloroplast genome sequences from Korean ginseng (Panax schinseng Nees) and comparative analysis of sequence evolution among 17 vascular plants. DNA Res. 11, 247–261. doi: 10.1093/dnares/11.4.247
Kimura, M. (1980). A simple method for estimating evolutionary rates of base substitutions through comparative studies of nucleotide sequences. J. Mol. Evol. 16, 111–120.
Kuang, D. Y., Wu, H., Wang, Y. L., Gao, L. M., Zhang, S. Z., and Lu, L. (2011). Complete chloroplast genome sequence of Magnolia kwangsiensis (Magnoliaceae): implication for DNA barcoding and population genetics. Genome 54, 663–673. doi: 10.1139/G11-026
Kumar, S., Hahn, F. M., McMahan, C. M., Cornish, K., and Whalen, M. C. (2009). Comparative analysis of the complete sequence of the plastid genome of Parthenium argentatum and identification of DNA barcodes to differentiate Parthenium species and lines. BMC Plant Biol. 9:131. doi: 10.1186/1471-2229-9-131
Kumar, S., Nei, M., Dudley, J., and Tamura, K. (2008). MEGA: a biologist-centric software for evolutionary analysis of DNA and protein sequences. Brief. Bioinformat. 9, 299–306. doi: 10.1093/bib/bbn017
Kurtz, S., Choudhuri, J. V., Ohlebusch, E., Schleiermacher, C., Stoye, J., and Giegerich, R. (2001). REPuter: the manifold applications of repeat analysis on a genomic scale. Nucleic Acids Res. 29, 4633–4642. doi: 10.1093/nar/29.22.4633
Leebens-Mack, J., Raubeson, L. A., Cui, L. Y., Kuehl, J. V., Fourcade, M. H., Chumley, T. W., et al. (2005). Identifying the basal angiosperm node in chloroplast genome phylogenies: sampling one's way out of the felsenstein zone. Mol. Biol. Evol. 22, 1948–1963. doi: 10.1093/molbev/msi191
Leese, F., Mayer, C., and Held, C. (2008). Isolation of microsatellites from unknown genomes using known genomes as enrichment templates. Limnol. Oceanogr. Methods 6, 412–426. doi: 10.4319/lom.2008.6.412
Leitch, I. J., Hanson, L., Lim, K. Y., Kovarik, A., Chase, M. W., Clarkson, J. J., et al. (2008). The ups and downs of genome size evolution in polyploid species of Nicotiana (Solanaceae). Ann. Bot. 101, 805–814. doi: 10.1093/aob/mcm326
Librado, P., and Rozas, J. (2009). DnaSP v5: a software for comprehensive analysis of DNA polymorphism data. Bioinformatics 25, 1451–1452. doi: 10.1093/bioinformatics/btp187
Lohse, M., Drechsel, O., and Bock, R. (2007). OrganellarGenomeDRAW (OGDRAW): a tool for the easy generation of high-quality custom graphical maps of plastid and mitochondrial genomes. Curr. Genet. 52, 267–274. doi: 10.1007/s00294-007-0161-y
Martin, W., Deusch, O., Stawski, N., Grunheit, N., and Goremykin, V. (2005). Chloroplast genome phylogenetics: why we need independent approaches to plant molecular evolution. Trends Plant Sci. 10, 203–209. doi: 10.1016/j.tplants.2005.03.007
Michael, T. P., and Jackson, S. (2013). The first 50 plant genomes. Plant Genome 6, 1–7. doi: 10.3835/plantgenome2013.03.0001in
Moore, M. J., Bell, C. D., Soltis, P. S., and Soltis, D. E. (2007). Using plastid genome-scale data to resolve enigmatic relationships among basal angiosperms. Proc. Natl. Acad. Sci. U.S.A. 104, 19363–19368. doi: 10.1073/pnas.0708072104
Moore, M. J., Soltis, P. S., Bell, C. D., Burleigh, J. G., and Soltis, D. E. (2010). Phylogenetic analysis of 83 plastid genes further resolves the early diversification of eudicots. Proc. Natl. Acad. Sci. 107, 4623–4628. doi: 10.1073/pnas.0907801107
Morton, B. R. (1998). Selection on the codon bias of chloroplast and cyanelle genes in different plant and algal lineages. J. Mol. Evol. 46, 449–459. doi: 10.1007/Pl00006325
Murad, L., Lim, K. Y., Christopodulou, V., Matyasek, R., Lichtenstein, C. P., Kovarik, A., et al. (2002). The origin of tobacco's T genome is traced to a particular lineage within Nicotiana tomentosiformis (Solanaceae). Am. J. Bot. 89, 921–928. doi: 10.3732/ajb.89.6.921.
Nagata, T., Nemoto, Y., and Hasezawa, S. (1992). Tobacco by-2 Cell-Line as the Hela-Cell in the Cell Biology of Higher-Plants. Int. Rev. Cytol. Survey Cell Biol. 132, 1–30.
Nie, X. J., Lv, S. Z., Zhang, Y. X., Du, X. H., Wang, L., Biradar, S. S., et al. (2012). Complete chloroplast genome sequence of a major invasive species, Crofton Weed (Ageratina adenophora). PLos ONE 7:e36869. doi: 10.1371/journal.pone.0036869
Occhialini, A., Lin, M. T., Andralojc, P. J., Hanson, M. R., and Parry, M. A. (2016). Transgenic tobacco plants with improved cyanobacterial Rubisco expression but no extra assembly factors grow at near wild type rates if provided with elevated CO2. Plant J. 85, 148–160. doi: 10.1111/tpj.13098
Pauwels, M., Vekemans, X., Gode, C., Frerot, H., Castric, V., and Saumitou-Laprade, P. (2012). Nuclear and chloroplast DNA phylogeography reveals vicariance among European populations of the model species for the study of metal tolerance, Arabidopsis halleri (Brassicaceae). New Phytol. 193, 916–928. doi: 10.1111/j.1469-8137.2011.04003.x
Powell, W., Morgante, M., Mcdevitt, R., Vendramin, G. G., and Rafalski, J. A. (1995). Polymorphic simple sequence repeat regions in chloroplast genomes–applications to the population-genetics of pines. Proc. Natl. Acad. Sci. U.S.A. 92, 7759–7763. doi: 10.1073/pnas.92.17.7759
Provan, J., Corbett, G., McNicol, J. W., and Powell, W. (1997). Chloroplast DNA variability in wild and cultivated rice (Oryza spp.) revealed by polymorphic chloroplast simple sequence repeats. Genome 40, 104–110. doi: 10.1139/G97-014
Qian, J., Song, J. Y., Gao, H. H., Zhu, Y. J., Xu, J., Pang, X. H., et al. (2013). The complete chloroplast genome sequence of the medicinal plant Salvia miltiorrhiza. PLoS ONE 8:e57607. doi: 10.1371/journal.pone.0057607
Raubeson, L. A., Peery, R., Chumley, T. W., Dziubek, C., Fourcade, H. M., Boore, J. L., et al. (2007). Comparative chloroplast genomics: analyses including new sequences from the angiosperms Nuphar advena and Ranunculus macranthus. BMC Genomics 8:17410. doi: 10.1186/1471-2164-8-174
Ravi, V., Khurana, J. P., Tyagi, A. K., and Khurana, P. (2008). An update on chloroplast genomes. Plant Systemat. Evol. 271, 101–122. doi: 10.1007/s00606-007-0608-0
Renny-Byfield, S., Chester, M., Kovařík, A., Le Comber, S. C., Grandbastien, M.-A., Deloger, M., et al. (2011). Next generation sequencing reveals genome downsizing in Allotetraploid Nicotiana tabacum, Predominantly through the elimination of paternally derived repetitive DNAs. Mol. Biol. Evol. 28, 2843–2854. doi: 10.1093/molbev/msr112
Riechers, D. E., and Timko, M. P. (1999). Structure and expression of the gene family encoding putrescine N-methyltransferase in Nicotiana tabacum: new clues to the evolutionary origin of cultivated tobacco. Plant Mol. Biol. 41, 387–401. doi: 10.1023/A:1006342018991
Rodriguez-Ezpeleta, N., Brinkmann, H., Burey, S. C., Roure, B., Burger, G., Loffelhardt, W., et al. (2005). Monophyly of primary photosynthetic eukaryotes: green plants, red algae, and glaucophytes. Curr. Biol. 15, 1325–1330. doi: 10.1016/j.cub.2005.06.040
Rose, O., and Falush, D. (1998). A threshold size for microsatellite expansion. Mol. Biol. Evol. 15, 613–615.
Schattner, P., Brooks, A. N., and Lowe, T. M. (2005). The tRNAscan-SE, snoscan and snoGPS web servers for the detection of tRNAs and snoRNAs. Nucleic Acids Res. 33, W686–W689. doi: 10.1093/nar/gki366
Sierro, N., Battey, J. N. D., Ouadi, S., Bakaher, N., Bovet, L., Willig, A., et al. (2014). The tobacco genome sequence and its comparison with those of tomato and potato. Nat. Commun. 5:3833. doi: 10.1038/ncomms4833
Sierro, N., Battey, J. N. D., Ouadi, S., Bovet, L., Goepfert, S., Bakaher, N., et al. (2013). Reference genomes and transcriptomes of Nicotiana sylvestris and Nicotiana tomentosiformis. Genome Biol. 14:R60. doi: 10.1186/Gb-2013-14-6-R60
Sperisen, C., Ryals, J., and Meins, F. (1991). Comparison of cloned genes provides evidence for intergenomic exchange of DNA in the evolution of a tobacco glucan endo-1,3-beta-glucosidase gene family. Proc. Natl. Acad. Sci. 88, 1820–1824.
Sugiyama, Y., Watase, Y., Nagase, M., Makita, N., Yagura, S., Hirai, A., et al. (2005). The complete nucleotide sequence and multipartite organization of the tobacco mitochondrial genome: comparative analysis of mitochondrial genomes in higher plants. Mol. Genet. Genomics 272, 603–615. doi: 10.1007/s00438-004-1075-8
Tamura, K., Stecher, G., Peterson, D., Filipski, A., and Kumar, S. (2013). MEGA6: molecular evolutionary genetics analysis version 6.0. Mol. Biol. Evol. 30, 2725–2729. doi: 10.1093/molbev/mst197
Tangphatsornruang, S., Sangsrakru, D., Chanprasert, J., Uthaipaisanwong, P., Yoocha, T., Jomchai, N., et al. (2010). The Chloroplast genome sequence of mungbean (Vigna radiata) determined by high-throughput pyrosequencing: structural organization and phylogenetic relationships. DNA Res. 17, 11–22. doi: 10.1093/dnares/dsp025
Thompson, J. D., Higgins, D. G., and Gibson, T. J. (1994). Clustal-W–improving the sensitivity of progressive multiple sequence alignment through sequence weighting, position-specific gap penalties and weight matrix choice. Nucleic Acids Res. 22, 4673–4680. doi: 10.1093/nar/22.22.4673
Timme, R. E., Kuehl, J. V., Boore, J. L., and Jansen, R. K. (2007). A comparative analysis of the Lactuca and Helianthus (Asteraceae) plastid genomes: identification of divergent regions and categorization of shared repeats. Am. J. Bot. 94, 302–312. doi: 10.3732/Ajb.94.3.302
Timmis, J. N., Ayliffe, M. A., Huang, C. Y., and Martin, W. (2004). Endosymbiotic gene transfer: organelle genomes forge eukaryotic chromosomes. Nat. Rev. Genet. 5, 123–135. doi: 10.1038/nrg1271
Wang, M. X., Cui, L. C., Feng, K. W., Deng, P. C., Du, X. H., Wan, F. H., et al. (2015). Comparative analysis of Asteraceae chloroplast genomes: structural organization, RNA editing and evolution. Plant Mol. Biol. Repor. 33, 1526–1538. doi: 10.1007/s11105-015-0853-2
Wu, Z. (2015). The completed eight chloroplast genomes of tomato from Solanum genus. Mitochondrial DNA. doi: 10.3109/19401736.2014.1003890. [Epub ahead of print].
Wu, Z. (2016). The whole chloroplast genome of shrub willows (Salix suchowensis). Mitochondrial DNA A DNA Mapp. Seq. Anal. 27, 2153–2154. doi: 10.3109/19401736.2014.982602
Wu, Z. Q., Tembrock, L. R., and Ge, S. (2015). Are differences in genomic data sets due to true biological variants or errors in genome assembly: an example from two chloroplast genomes. PLoS ONE 10:e0118019. doi: 10.1371/journal.pone.0118019
Wyman, S. K., Jansen, R. K., and Boore, J. L. (2004). Automatic annotation of organellar genomes with DOGMA. Bioinformatics 20, 3252–3255. doi: 10.1093/bioinformatics/bth352
Yang, M., Zhang, X. W., Liu, G. M., Yin, Y. X., Chen, K. F., Yun, Q. Z., et al. (2010). The Complete Chloroplast Genome Sequence of date palm (Phoenix dactylifera L.). PLoS ONE 5:e12762. doi: 10.1371/journal.pone.0012762
Yi, X., Gao, L., Wang, B., Su, Y. J., and Wang, T. (2013). The Complete chloroplast genome sequence of Cephalotaxus oliveri (Cephalotaxaceae): evolutionary comparison of cephalotaxus chloroplast DNAs and insights into the loss of inverted repeat copies in gymnosperms. Genome Biol. Evol. 5, 688–698. doi: 10.1093/gbe/evt042
Yukawa, M., Tsudzuki, T., and Sugiura, M. (2006). The chloroplast genome of Nicotiana sylvestris and Nicotiana tomentosiformis: complete sequencing confirms that the Nicotiana sylvestris progenitor is the maternal genome donor of Nicotiana tabacum. Mol. Genet. Genomics 275, 367–373. doi: 10.1007/s00438-005-0092-6
Yurina, N. P., and Odintsova, M. S. (1998). Comparative structural organization of plant chloroplast and mitochondrial genomes. Genetika 34, 5–22.
Keywords: Nicotiana, cp genome, repeat analysis, phylogeny, sequence divergence, SSRs
Citation: Asaf S, Khan AL, Khan AR, Waqas M, Kang S-M, Khan MA, Lee S-M and Lee I-J (2016) Complete Chloroplast Genome of Nicotiana otophora and its Comparison with Related Species. Front. Plant Sci. 7:843. doi: 10.3389/fpls.2016.00843
Received: 12 February 2016; Accepted: 30 May 2016;
Published: 14 June 2016.
Edited by:
Miguel Arenas, Institute of Molecular Pathology and Immunology of the University of Porto, PortugalReviewed by:
Milind Ratnaparkhe, ICAR-Indian Institute of Soybean Research, IndiaCopyright © 2016 Asaf, Khan, Khan, Waqas, Kang, Khan, Lee and Lee. This is an open-access article distributed under the terms of the Creative Commons Attribution License (CC BY). The use, distribution or reproduction in other forums is permitted, provided the original author(s) or licensor are credited and that the original publication in this journal is cited, in accordance with accepted academic practice. No use, distribution or reproduction is permitted which does not comply with these terms.
*Correspondence: In-Jung Lee, aWpsZWVAa251LmFjLmty
Disclaimer: All claims expressed in this article are solely those of the authors and do not necessarily represent those of their affiliated organizations, or those of the publisher, the editors and the reviewers. Any product that may be evaluated in this article or claim that may be made by its manufacturer is not guaranteed or endorsed by the publisher.
Research integrity at Frontiers

Learn more about the work of our research integrity team to safeguard the quality of each article we publish.