- 1Department of Grassland Science, Animal Science and Technology College, Sichuan Agricultural University, Chengdu, China
- 2Department of Agronomy, Purdue University, West Lafayette, IN, USA
- 3Department of Agronomy, Iowa State University, Ames, IA, USA
- 4Department of Plant Genetics and Breeding, Agricultural College, Sichuan Agricultural University, Chengdu, China
As a great potential bio-fuel feedstock, the genus Miscanthus has been widely studied around the world, especially Miscanthus × giganteus owing to its high biomass yield in Europe and North America. However, the narrow genetic basis and sterile characteristics of M. × giganteus have become a limitation for utilization and adaptation to extreme climate conditions. In this study, we focused on one of the progenitors of M. × giganteus, Miscanthus sinensis, which was originally distributed in East Asia with abundant genetic resources and comparable biomass yield potential to M. × giganteus in some areas. A collection of 138 individuals was selected for conducting a 3-year trial of biomass production and analyzed by using 104 pairs of SRAP, ISAP, and SSR primers for genetic diversity as well as marker-trait association. Significant differences in biomass yield and related traits were observed among individuals. Tiller number, fresh biomass yield per plant and dry biomass yield per plant had a high level of phenotypic variation among individuals and the coefficient of variation were all above 40% in 2011, 2012, and 2013. The majority of the traits had a significant correlation with the biomass yield except for the length and width of flag leaves. Plant height was a highly stable trait correlated with biomass yield. A total of 1059 discernible loci were detected by markers across individuals. The population structure (Q) and cluster analyses identified three subpopulations in the collection and family relative kinship (K) represented high gene flow among M. sinensis populations from Southwest China. Model testing identified that Q+K was the best model for describing the associations between the markers and traits, compared to the simple linear, Q or K model. Using the Q+K model, 12 significant associations (P < 0.001) were identified including four markers with plant height and one with biomass yield. Such associations would serve an efficient tool for an early selection of M. sinensis and facilitate a genetic improvement of biomass yield for this species.
Introduction
The growing use of fossil fuel has contributed to increasing global warming, but the uses of renewable energy resources such as bio-fuels could be an efficient approach to solve the energy challenge (Kim et al., 2014). The genus Miscanthus, comprising of C4 perennial warm-season rhizomatous grasses (Lewandowski et al., 2003b), is a promising non-food bio-energy crop for cellulosic bio-fuel production due to its broad adaptation, potential high biomass productivity, low-nutrient input, and the ability to sequester carbon (Lewandowski et al., 2000; Clifton-Brown et al., 2001; Stewart et al., 2009; Dwiyanti et al., 2014; Anzoua et al., 2015). Miscanthus × giganteus is a hybrid generated from a cross between tetraploid Miscanthus sacchariflorus and diploid Miscanthus sinensis. It has been considered as a candidate for bio-fuel production within the genus.
It is generally known that biomass yield is a critical trait for potential bio-energy crops. Extensive research works of biomass yield in Miscanthus have been completed in Europe and North America (Greef et al., 1997; Hodkinson et al., 2002a,b; Heaton et al., 2008, 2009; Hastings et al., 2009). M. × giganteus performs well on biomass yield and is the only hybrid genotype currently available for use in most countries (Nishiwaki et al., 2011; Dwiyanti et al., 2014), but it is time and labor consuming to propagate the plants through rhizome division or tissue culture. Furthermore, it is highly risky and genetically difficult to improve M. × giganteus through breeding due to the narrow genetic basis and triploid nature of this species, posing limitations to its biomass productivity, climatic adaptation and overwintering survival under some extreme conditions (Lewandowski et al., 2003a; Clark et al., 2014; Anzoua et al., 2015). As a progenitor of M. × giganteus, diploid M. sinensis is a kind of cross-pollination plant which can be propagated by seeds and potentially provides a comparable biomass yield to that of M. × giganteus in some areas (Zhao et al., 2013; Anzoua et al., 2015; Gifford et al., 2015). Originally distributed in East Asia throughout China, Korea, and Japan, collection of M. sinensis has been made and utilized by many research groups for phenotypic characterization and genetic evaluation (Xu et al., 2013; Nie et al., 2014; Yook et al., 2014; Anzoua et al., 2015). Nevertheless, further works for evaluation of domestication and improvement of M. sinensis as a new valuable genetic resource need to be conducted, especially in areas of its origin (Yook et al., 2014).
Because Miscanthus requires a lengthy establishment phase and there are some challenges in collecting phenotypic data for a large number of individuals, development of genetic markers associated with a trait of interest would be an efficient approach to enhance Miscanthus breeding programs (Clifton-Brown and Lewandowski, 2000; Gifford et al., 2015). Prior to the development of a marker-assisted selection program, quantitative trait locus (QTL) mapping using a population derived from a biparental cross would have been performed to establish associations between traits and genetic markers. However, the process of constructing a mapping population for QTL analysis can be lengthy, especially for perennial grasses.
Association mapping, also known as linkage disequilibrium (LD) mapping, has been proved to be useful and powerful for genetic dissection of complex traits (Yu et al., 2011). Compared to linkage mapping in traditional biparental populations, association mapping results in higher mapping resolution and evaluates a wide range of alleles rapidly (Yu and Buckler, 2006). This technique has been successfully applied for investigating some important agronomic traits in model plant and crop species (Aranzana et al., 2005; Breseghello and Sorrells, 2006; Skøt et al., 2007; Eleuch et al., 2008; Harjes et al., 2008; Wang et al., 2008). There were only a few reports on Miscanthus association mapping (Zhao et al., 2013; Slavov et al., 2014); meanwhile, QTL studies were conducted on limited genetic maps and population (Atienza et al., 2003a,b,c,d; Gifford et al., 2015; Liu et al., 2015).
The unavailable genome sequence and lack of reliable molecular markers limit Miscanthus genetic research. However, the Miscanthus genus belongs to the Tribe Andropogoneae (Poaceae) which contains many important C4 crops including maize (Zea mays L.), sorghum (Sorghum bicolor L. Moench), and sugarcane (Saccharum officinarum L.) with rich genomic databases, and a large number of SSRs have been proven to have high transferability to M. sinensis (Hernandez et al., 2001; Lu et al., 2012; Xu et al., 2013; Zhao et al., 2013; Chae et al., 2014; Yook et al., 2014). In addition, new PCR-based markers can be developed for amplifying different regions of DNA segment targets without needing prior knowledge of target sequences and they can be used for studying M. sinensis genetic diversity, QTL and association mapping.
Southwest China is the major distribution area or diversity center for M. sinensis. As one of the new leading candidates to meet biomass demand for future power generation and bio-fuels production, M. sinensis needs further genetic improvement using both conventional breeding and modern biotechnical approaches. In previous studies, we used different molecular markers and chloroplast DNA (trnL-F and rpl20-rps12) sequence to detect the genetic diversity and differentiate the collected M. sinensis population from southwest China (Xu et al., 2013; Nie et al., 2014; Yan et al., 2015). Although, different population size was used in these studies before, the similar results demonstrated that the population had high gene flow and fairly weak genetic differentiation, which would increase power to detect marker-trait associations. Building on previous studies, we extended the number of PCR-based markers by using simple sequence repeats (SSRs) developed from M. sinensis (Hung et al., 2009; Ho et al., 2011; Zhou et al., 2011), maize (Zhong et al., 2009; Lu et al., 2012), sorghum (Wang et al., 2005; Xu et al., 2013), sugarcane (Lu et al., 2012), and SSR developed from conserved expressed sequence tags (ESTs) databases on grass species (Kantety et al., 2002), as well as intron splice position amplified markers of intron sequence amplified polymorphism (ISAP) and parts of sequence related amplified polymorphism (SRAP) markers used in Nie et al. (2014) on 138 diverse M. sinensis varieties selected from previous population according to the geographic information (Xu et al., 2013; Nie et al., 2014). We also conducted a 3-year replicated field trail for phenotypic evaluation of the population and combined with genotype data for marker-trait association analysis to identify key loci associated with phenotypic traits related to biomass yield. The research results would be useful for Miscanthus breeding aimed at improvement of biomass and related traits.
Materials and Methods
Plant Material Collection and DNA Extraction
A total of 138 M. sinensis individuals used in this study were selected from previous studies (Xu et al., 2013; Nie et al., 2014) collected from Sichuan, Chongqing, Guizhou, and Yunnan provinces, located in Southwest China. The individual geographic information were listed in Table 1 (The distribution map could see Nie et al., 2014, Figure 3). Briefly, each of the genotypes was cloned to three individuals using rhizome division and planted following a complete randomized block design, with one replicate per genotype in each of three blocks. Prior to transplanting, plant leaves were cut back to 8–10 cm with 6–10 tillers. All the individuals were transplanted to the Sichuan Agriculture University farm (Ya' an, Sichuan, China; N 30°08', E 103°14') in May of 2010, with an average annual precipitation of 1774 mm. The soil pH at the experimental site ranged from 5.3 to 5.5, and soil type was purplish loam with 1.46% organic qualitative content. Plants were well watered immediately after transplanting and no fertilizer or water was applied to the plants afterwards.
Fresh young leaves from each individual were collected for genomic DNA extraction using the Plant Genomic DNA kit (Tiangen®, China) according to the manufacturer's protocol. The quality and concentration of the DNA were determined by comparing the sample with known standards of lambda DNA on 0.8% (w/v) agarose gels and NanoDrop ND-1000 spectrophotometer (NanoDrop Technologies Inc., Rockland, DE, USA). The isolated genomic DNA was diluted to 20 ng/μL for PCR amplification.
Primer Selection and PCR Amplification
In this study, we selected part of SRAP primers published previously (Li and Quiros, 2001; Nie et al., 2014) to conduct the association analysis. In addition, six individuals of M. sinensis that varied in morphology and geographic locations were selected for screening other markers based on Nie et al. (2014), including 72 ISAP primer combinations (Lu et al., 2008) and 117 SSR primer combinations (Kantety et al., 2002; Wang et al., 2005; Hung et al., 2009; Zhong et al., 2009; Ho et al., 2011; Zhou et al., 2011; Lu et al., 2012). All the primers used in this study were synthesized by Nanjing GenScript Biological Technology & Service (China).
For PCR amplification, the total volume of each PCR reaction system was 20 μl, containing 3 μL template DNA (20 ng/μL), 10 μL of Mix (10 × reaction buffer, 2.0 mM Mg2+, 0.6 mM of each dNTP, Tiangen®, China), 0.8 μL primers (10 pmol/μL), 0.4 μL Golden DNA Polymerase (2.5 U/μL, Tiangen®, China) and 5 μL of ddH2O. Amplification was performed on a Peltier Thermal Cycler (DNA Engine®, Bio-Rad, USA) under the following conditions: for SRAP and ISAP amplification, 5 min at 94°C for 1 cycle, followed by 5 cycles at 94°C for 1 min, 35°C for 1 min, and 72°C for 1 min, and then 35 cycles at 94°C for 1 min, 50°C for 1 min, and 72°C for 1 min, extended at 72°C for 10 min, then stored at 4°C; for SSR, 5 min at 94°C for 1 cycle, followed by 10 cycles at 94°C for 1 min, 55°C for 30 s, and 72°C for 40 s, decreased 0.5°C for annealing with each cycle, and then 35 cycles at 94°C for 1 min, 50°C for 30 s, and 72°C for 40 s, extended at 72°C for 10 min, then stored at 4°C. Electrophoresis was performed in a denaturing 6% polyacrylamide gel (acrylamide: bis-acrylamide 19:1, 1 × TBE) to separate allele sizes. The gel was stained by AgNO3 solutions.
Phenotypic Data Collection and Analysis
Three morphological traits were measured at early harvest season in 2011. Plant height (H) was measured at the ground level to the top of the plant. The total number of tillers in each plant (TN) was counted after harvest. The fresh biomass yield of per plant (fresh weight, FW) was evaluated with autumn harvest in October. In 2012 and 2013, in addition to H, TN, and FW, several other morphological traits associated with biomass were measured. The main tiller diameter (TD) was measured approximately 10–15 cm from the base of the plant on three randomly chosen tillers. Number of main stem internodes (NI) was counted and the length of the main internode (LI) was measured. The length of flag leaf (LF) and length of longest leaf (LL) were measured from the ligule to the tip along the central vein of the leaf. The width of flag leaf (WF) and width of longest leaf (WL) were measured for the width of the blade at half-leaf length for the leaf which was recorded for measuring the length. Plants were harvested about 20 cm above the soil surface, and the whole above-ground biomass was weighed as FW in October. The harvested tissue were then dried in an oven at 105°C for 1 h, followed by 70°C for 3 days, for determining dry biomass yield per plant (dry weight, DW). All the plants in the field were cut about 20 cm to avoid rhizome damage and facilitate quick re-growth in the following season.
Analysis of variance (ANOVA) and correlation analysis of morphological traits were performed using SPSS 17.0 software (IBM, Armonk, New York, USA). Effects of both environment (different measurement year) and individuals on various traits were determined using the Least Significant Difference test model. Pearson correlation coefficients were calculated for correlation analysis. The coefficient of variation (CV) was calculated using the following model—CV = SD/Mean * 100%—for detecting the discrete level of the data.
Genetic Diversity and Population Structure
The alleles of molecular markers were scored manually for the population as band presence (1) or absence (0), and each of them was treated as an independent character regardless of its intensity. A present/absent data matrix was constructed to analyze the genetic diversity and population structure. The discriminatory power of different primers was evaluated by means of polymorphic information content (PIC), calculated by the following model PICi = 2fi(1 − fi) (Roldan-Ruiz et al., 2000). In the model, PICi is the polymorphic information content of marker “I,” fi is the frequency of the amplified allele (band present), and 1 −fi is the frequency of the null allele.
Population structure (Q) of 138 M. sinensis individuals was confirmed using the model-based clustering approach implemented in STRUCTURE v2.3.4 software (Pritchard et al., 2000) with the “admixture model,” burn-in period of 100,000 iterations and a run of 100,000 replications of Markov Chain Monte Carlo (MCMC) after burn in. For each run, 20 independent runs of STRUCTURE were performed with the number of clusters (K) varying from 1 to 10. Maximum likelihood and delta K (ΔK) tests were used to determine the optimum number of subgroups (Evanno et al., 2005). For clustering analysis, the similarity coefficients were used to construct an unweighted pair group method with arithmetic means (UPGMA) dendogram using sequential agglomerative hierarchical and nested clustering (SAHN) module in the NTSYS-pc version2.10 software. Analysis of molecular variance (AMOVA) was used to calculate variation among and within populations using GenAlEx ver. 6.41 (Peakall and Smouse, 2012).
All genetic diversity indices were calculated using PopGen32 v.1.31, assuming Hardy-Weinberg equilibrium; the genetic diversity was evaluated with parameters: Nei's (1973) gene diversity (H) and Shannon's Information Index of Diversity (I). The total gene diversity (HT) was divided into gene diversity within populations (HS) and the gene diversity among populations (DST). These parameters were calculated according to the equation HT = HS+DST. The genetic differentiation coefficient (GST) was calculated as a ratio of DST/HT and was used to measure population differentiation. Gene flow was calculated as Nm = 0.5(1 − GST)∕GST to estimate the level of gene drift among the populations (Slatkin and Barton, 1989).
Marker-Trait Association Analysis
The markers with minor allele frequency less than 5% were removed in order to reduce false positive associations. Relative kinship (K) among samples was calculated by TASSEL 2.1 software. The marker-trait association analysis was conducted to reveal associations between the interest traits and marker alleles using TASSEL 2.1 software along with the General Linear Model (GLM) and Mixed Linear Model (MLM) procedure (Bradbury et al., 2007) to control for population structure and relative kinship. The simple linear model, Q (population structure results included as fixed effects generating from STRUCTURE software) model, K (relative kinship results included as fixed effects generating from TASSEL software) model, and Q+K models were tested to identify the best model fitting biomass related traits using Quantile-quantile (QQ) plots for association mapping in the M. sinensis populations. Two thresholds for significant associations were tested in our study. First, the significance threshold for associations between loci and traits was set at P < 0.001. Second, the Bonferroni correction of multiple testing (P < 0.05/934 ~5.35 × 10 −5) was performed based on q-value using false discovery rate (FDR, αc = 0.05). The phenotypic variation explained by the single associated marker (R2) indicated the fixed marker effects.
Genome-Wide Prediction
The genome-wide prediction was carried out by using the R package rrBLUP (Endelman, 2011) with ridge regression. The average correlation between the predicted phenotypic values from marker data and the original phenotypic values directly from field trail was used as the criteria of genome prediction accuracy. The accuracy (Pearson's correlation coefficient) was calculated with recommended 10-fold cross-validation and was repeated 100 times (Slavov et al., 2014). The adjusted prediction accuracy was calculated by dividing accuracy by the square root of the broad-sense heritability (h2), where h2 was calculated by using PROC MIXED (SAS Institute, Version 9.1, Cary, NC, USA). The h2 was calculated as follows: h2 = /(/re /e), where , , represent Type III SS (sums of squares) for genotype (G), environment (E), and G × E, respectively. The “e” is the degree of freedom of environment and “re” is the degree of freedom of G × E.
Results
Phenotypic Variation and Correlation
Significant differences among individuals were observed through ANOVA analysis for all measured traits (Table 2). In addition, the biomass yield per plant was increased year by year after establishment. Significant increases were noted in the mean of fresh biomass yield per plant—498.7 g in 2011, 770.8 g in 2012 and 1001.9 g in 2013, with the highest individual increased from 1350 g in 2011 to 2225 g in 2013. The results showed that TN, FW, and DW had a high level of phenotypic variation with CV of above 40% in 2011, 2012, and 2013.
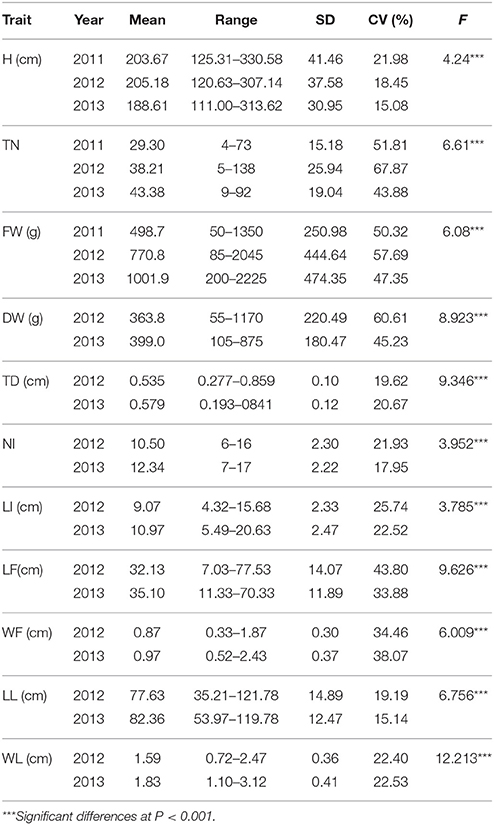
Table 2. The mean, range, standard deviation (SD), coefficient of variation (CV) and F-value of plant height (H), tiller number (TN), fresh biomass yield each plant (FW), dry biomass yield each plant (DW), the main tiller diameter (TD), the number of main stem internodes (NI), the length of main internode (LI), the length of flag leaf (LF), the width of flag leaf (WF), the length of longest leaf (LL), and the width of longest leaf (WL) in Miscanthus sinensis population in 2011, 2012, and 2013.
Significant positive correlations of biomass yield (both fresh and dry) with TN, H, TD, NI, LI, LL, and WL were found, while no correlations were seen in with LF and WF (Table 3). The higher correlation coefficients indicated that M. sinensis biomass yield in the field was largely influenced by TN and H. On the other hand, TN had a significant negative correlation with tiller diameter (r = −0.185, P < 0.05) and leaf length (r = −0.287, P < 0.01), indicating that a M. sinensis plant with a high number of tillers always followed with small tiller diameter and low leaf length. Plant height had a significant positive correlation with the main internode length (r = 0.522, P < 0.01). Significant positive correlations were also found between leaf width and tiller diameter and between flag leaf length and flag leaf width.
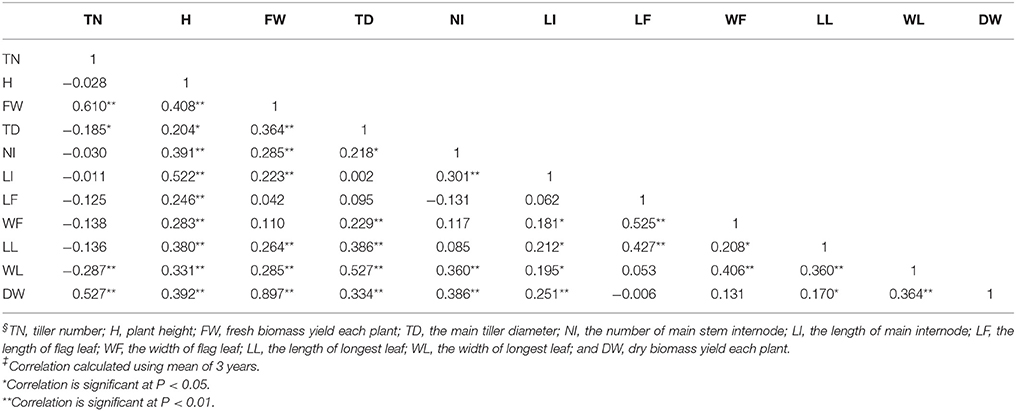
Table 3. Pearson correlation coefficients among TN, H, FW, TD, NI, LI, LF, WF, LL, WL, and DW§ in M. sinensis population‡.
Genotypic Variation and Population Structure
A total of 104 pairs of primers (Supplementary Table 1) were screened for genotyping the collections of 138 M. sinensis individuals while the other primers failed to amplify or did not produce clear bands. In total, 1059 bands were produced and 993 (93.8%) were polymorphic. For the SSR primers developed from M. sinensis, sorghum, sugarcane, maize, and conserved ESTs in grasses, the average of bands produced per primer was 7.8, 8.9, 5.8, 7.2, and 8.0, respectively. The production of ISAP primers had a similar result (6.5) with SSR, while the SRAP had a higher productive capacity (19.8). The mean of polymorphic information content ranged from 26.7% (SSR-4) to 39.0% (SSR-5), demonstrating a different discriminatory capacity for each kind of primer (Table 4).
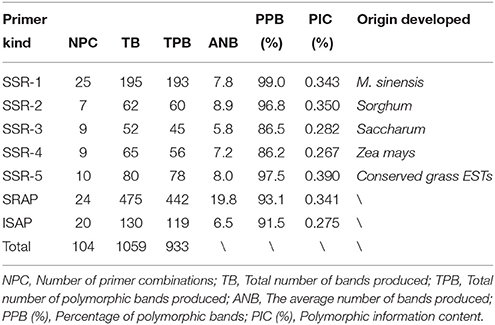
Table 4. The amplification results of each primer and the comparison of productive capacity among seven primers.
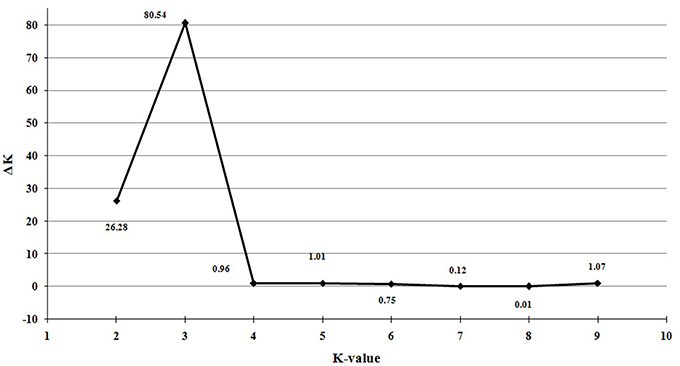
Population structure of the 138 individuals was estimated under the Hardy-Weinberg Equilibrium by using STRUCTURE V2.3.3 software. After dropping the markers with minor allele frequency less than 5%, the total number of marker loci retained for structure and association analysis was 934. Based on maximum likelihood and delta K (ΔK) values, the number of optimum subgroups was three (Figure 1). Accordingly, the 138 individuals were assigned into these three groups. Among them, 34 individuals were assigned to G1, 66 individuals to G2, and 38 individuals to G3 (Figure 2). By using a membership probability threshold (Q-value) of 0.60, the majority of the individuals were clearly assigned to the specific groups while admixture between groups referred to 18 individuals with Q < 0.6 (data not shown).
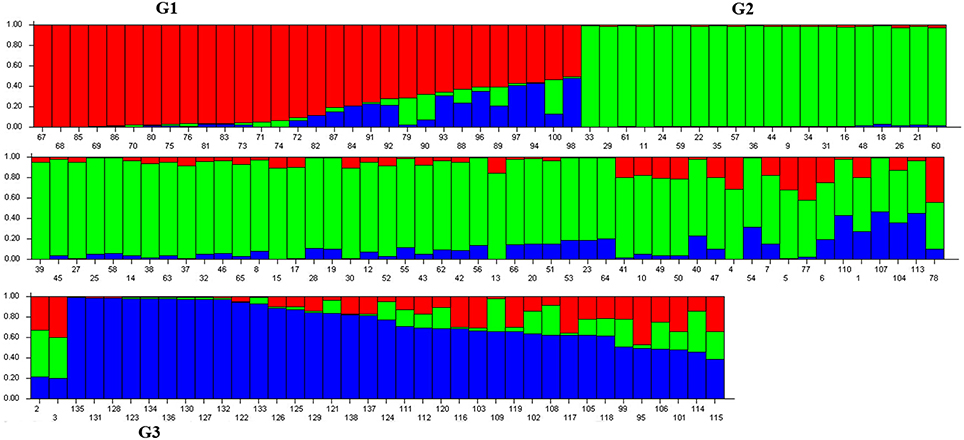
Figure 2. Population structure analysis of 138 M. sinensis individuals from southwest China. Numbers on the x-axis indicate the individual and numbers on the y-axis show the group membership. G1, G2, and G3 represent the identified structure groups.
The genetic similarities coefficient (GS) values of 138 individuals ranged from 0.59 to 0.95 with an average of 0.67. The UPGMA dendrogram based on GS data obviously revealed three major clusters similar to the result from the population structure analysis when the GS value was equal to 0.67 (Supplementary Figure 1).
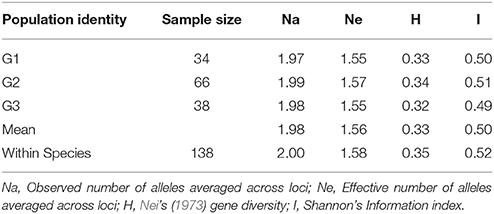
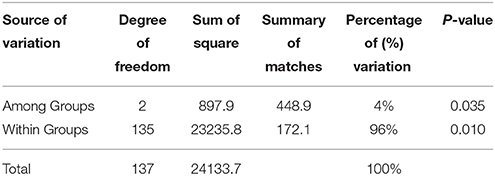
The three groups comprised of 138 individuals had a relatively high genetic diversity reflected by Nei's (1973) gene diversity (H) and Shannon's Information Index of Diversity (I) (Table 5). Total gene diversity (HT) was 0.35 ± 0.015, while gene diversity within groups (HS) was 0.33 ± 0.014 and gene diversity among groups (DST) was 0.016. The total Shannon's Information Index of Diversity (SII) among 138 individuals was 0.52 ± 0.015 with the average of SII within groups was 0.50. The mean genetic differentiation coefficient (GST) was estimated from the 933 bands with a value of 0.046. A higher level of genetic variation within the populations than among them suggested a high frequency of gene flow (Nm = 10.32) between the groups. The AMOVA analysis of the M. sinensis populations showed similar results, and both the genetic variations within (96.0%) and among (4.0%) groups were significant (P < 0.05) (Table 6).
Marker-Trait Association Analysis
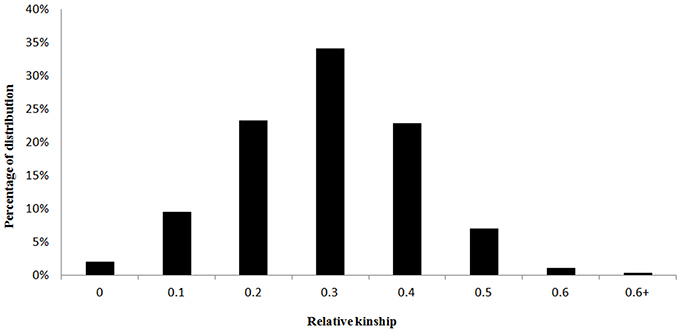
Marker-based relative kinship estimates have proven useful for quantitative inheritance studies in different populations. For the 138 M. sinensis individuals, the pair-wise relative kinship (K) estimates represented a normal distribution with approximately 98% of individuals from 0 to 0.5 (Figure 3). The results agreed that a high gene flow existed among samples. Quantile-quantile (QQ) plot is a probability plot, which is a graphical method of comparing two probability distributions (observed vs. expected). In this study, Q and K were detected among samples. Therefore, the association analysis was performed by taking Q and K into account using GLM and MLM approaches in the software TASSEL 2.1. Biomass yield and related traits were used to test the model with Q only matrix, K only matrix, Q+K matrix and simple linear model (S) excluding the Q and K in QQ plots (Figure 4).
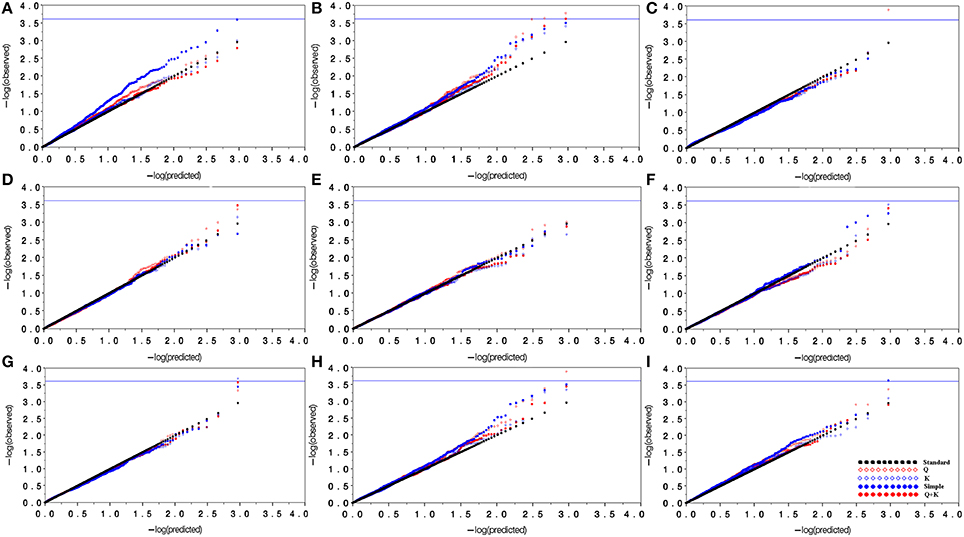
Figure 4. Quantile-quantile plots for model comparison with biomass yield and related traits. (A), Evaluation of model types using markers for tiller number; (B), Evaluation of model types using markers for plant height; (C), Evaluation of model types using markers for tiller diameter; (D), Evaluation of model types using markers for internode number; (E), Evaluation of model types using markers for internode length; (F), Evaluation of model types using markers for leaf length; (G), Evaluation of model types using markers for leaf width; (H), Evaluation of model types using markers for fresh biomass yield; (I), Evaluation of model types using markers for dry biomass yield. In this figure, black dots line represent the predicted value equal to the observed value; blue dots represent the simple linear model (without population structure and relative kinship); red diamond represents the Q model; blue diamond represents the K model; and red dots represent the Q+K model.
In most cases, the Q+K model and the K model had similar power and demonstrated the best approximation to the excepted cumulative distribution of P-values, followed by the Q and S model. The results from the Q+K and K models showed a significant improvement in goodness of fit compared with the other models, except that the fresh biomass and dry biomass yields in the Q+K model had a slightly higher power than the K model. At last, the Q+K model was selected as the best fitting model for association analysis.
A total of 21 significant associations were detected using a simple linear model, 18 using Q model, 15 using K model and 12 using Q+K model (P < 0.001). The averages of the phenotypic variations explained by the model for significant associations were 9.2% (S), 10.9% (Q), 46.8% (K), and 47.1% (Q+K), which was consistent with the model test results. For the significant associations detected by Q+K model, 4 markers were associated with plant height, 3 markers with flag leaf width, 1 marker with internode number, and 1 marker with fresh biomass yield (Table 7). In addition, marker “494” was associated with tiller diameter, leaf length and leaf width simultaneously. When comparing the significant associations detected by the Q+K model and the K model, 3 biomass yields related associations were filtered out (P > 0.001) in the Q+K model while they significant in the K model. The results were consistent with the model test above that the Q+K and K models had nearly the same capacity to detect the associations but the Q+K model seems a little better fit for biomass to control false positive associations. Specifically, one of associations (marker “793” for flag leaf width) reached genome-wide significant after Bonferroni correction for multiple testing (P < 0.05/934 ~ 5.35 × 10⁻⁵), with an estimated false discovery rate (FDR) < 0.05.
For an overall measure of quality of the genotype and phenotype data, genome-wide prediction was conducted in this study (Table 8). Most of measured traits were moderately heritable with the total average of broad-sense heritability (h2) equal to 0.56. Furthermore, the average of prediction accuracy and adjust prediction accuracy was 0.24 and 0.33, respectively. Although, the values of prediction accuracy seem lower, the adjust accuracy of genome-wide prediction for flag leaf width had moderate predictive ability (0.59). Interestingly, association analysis also showed that one marker was highly associated with flag leaf width on genome-wide significant level.
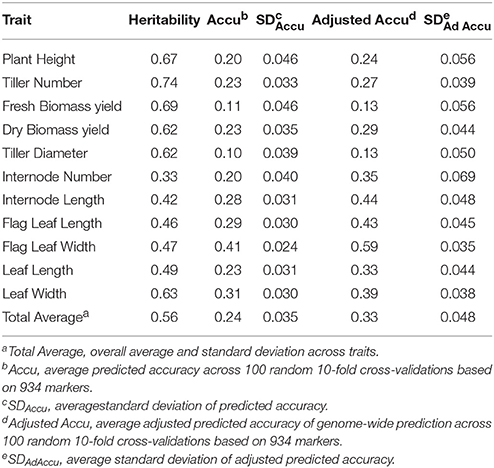
Table 8. Performance of genome-wide prediction in 138 Miscanthus sinensis genotypes based on 934 markers.
Discussion
Miscanthus is a typical perennial grass species that requires a long period of time for establishment after transplanting clonal replicates prior to reaching the maximum growth for optimum and stable productivity (Clifton-Brown and Lewandowski, 2000; Anzoua et al., 2015). M. sinensis grows slowly at the initial phase of establishment due to uneven splitting of the rhizome, the differences in growing conditions prior to transplanting, and variable adaptive capacity to the new environment. Since high biomass yield is the primary goal in improving M. sinensis, it appears that the correlation between traits and biomass yield during the establishment time may be important in M. sinensis breeding programs because plant biomass yield may not be always the optimum criteria for early selection (Gifford et al., 2015). Using traits that can be reliably measured in the early years of establishment to predict future performance could help an efficient early selection to reduce the breeding time. At least, data could be used to remove the unwanted genotypes with little potential.
In this study, plants were not evaluated in the first year after transplanting. In the subsequent 3 years, M. sinensis individuals were examined for biomass yield and related morphological traits in Ya'an, southwest of China, an area known as having the richest rainfall but relatively less light for grass species growth. Abundant phenotypic variations of traits in the establishment phase were found in the population. Most of the traits related to biomass yield tended to reach optimum value in the third year after transplanting and were close to stable growing stage. The results were consistent with previous studies, which suggested that a 3 year establishment phase was needed to achieve a stable or reliable population to collect phenotypic data in Miscanthus species (Clifton-Brown and Lewandowski, 2000).
Superior genotypes of M. sinensis with high tiller numbers and plant height could be comparable to Miscanthus × giganteus in terms of biomass yield potential (Heaton et al., 2004; Huang et al., 2011). Although field performance was evaluated for only 3 years (a few traits evaluated for the last 2 years) after transplanting in this study, some individuals had comparable or exceeded values relative to Miscanthus × giganteus in Europe and North America (Lewandowski et al., 2003a,b; Jezowski, 2008; Maughan et al., 2012; Gifford et al., 2015). The results suggested that some M. sinensis genotypes with vigorous growth, especially with high tillering capacity, greatly contributed to more biomass yield. Those genotypes would have the genetic potential to match or exceed the biomass yield of Miscanthus × giganteus in similar climate areas, although the performance of those genotypes has not been tested in colder climates or higher latitudes. In particular, plant height almost reached the optimum at the second year after transplanting and became stable the following year. The results suggested that plant height can be used as early selection criteria to develop genotypes with high biomass yield potential in M. sinensis. Thus, it could be possible to develop high biomass yield of M. sinensis by simultaneous selecting individuals with high tiller numbers and plant height. Genotypes with high biomass yield identified in this study would be useful for accelerating its domestication as an energy crop in similar areas.
As one of the 34 biodiversity hotspots around the world, southwest China has a special geographical location, climatic conditions, and abundant wild resources (Mittermeier et al., 2000). Prior studies have shown that high gene flow existed among M. sinensis populations from southwest China (Xu et al., 2013; Nie et al., 2014), which could be due to an introgression occurred from here to other distribution areas around China (Xiao et al., 2013). By analyzing trnL-F and rpl20-rps12 sequences, Yan et al. (2015) found that the haplotypes “H2” widely distributed among populations from southwest China and had a high level of similarity (99.64%) with haplotypes “A” identified in Japanese M. sinensis populations (Shimono et al., 2013). Furthermore, through comparison of haplotypes from NCBI, they determined that haplotypes “H1” and “H6” had relatively high similarity to the haplotypes obtained from the Liaoning and Jilin provinces located in northeast China (Jiang et al., 2013). In this study, the 138 individuals collected from N 24°12′15.9″ to N 32°38′57.9″ across southwest China revealed a very high level of gene flow, which is consistent with previous studies. All the results inferred that M. sinensis populations from southwest China have a mixed and complex ancestry owing to the complex ecotypes, random genetic drift, and the high rate of gene flow. Hence, knowing the relationship and population structure of M. sinensis from southwest China is important for taxonomic research and phylogenetic evaluation for their conservation and utilization.
Due to the lengthy period of establishment and the challenges in getting phenotypic data from a large population, a marker-assisted selection program would add tremendous value to a Miscanthus breeding program. However, different types of markers vary in amplification capacity and relationship to the traits in Miscanthus species. SSR regions lie within microsatellite repeats, and have a random distribution genome wide, while the target locus of SRAP is mainly located in open reading frame regions (ORFs). ISAP, as a very good complementary, is designed by using the highly conserved sequence of introns splice position as the core of the primer sequences to amplify the genes encoding areas, which could leading to a high association with expressed sequence. In this study, SRAP have a very high amplification capacity than other markers, demonstrating its values for use in the molecular marker system. The average number of alleles per loci produced in this study was similar to previous studies (Hung et al., 2009; Ho et al., 2011; Zhou et al., 2011; Lu et al., 2012; Nie et al., 2014). Furthermore, both the conserved grass EST-SSRs and ISAP markers were amplified in M. sinensis for the first time but proved to be highly efficient markers for Miscanthus. Using a large amount of molecular markers has great potential to obtain reliable and important loci for detecting the relationships between markers and traits of interest.
Molecular markers have been used to evaluate the genetic relationship of accessions in M. sinensis all around its distributed areas. Some genetic maps with high density and resolution have been constructed (Kim et al., 2012; Ma et al., 2012; Swaminathan et al., 2012; Liu et al., 2015). Atienza's genetic map had been sufficiently used in four QTL studies (Atienza et al., 2003a,b,c,d) in the early stage, but limitations occurred due to the low reproducibility of RAPD markers, the small population size (N = 89) and incomplete genetic map (28 linkage groups detected whereas M. sinensis has 19 chromosomes). More recently, Gifford et al. (2015) and Liu et al. (2015) conducted QTL studies based on the high density genetic maps (Swaminathan et al., 2012; Liu et al., 2015), but identification of QTLs using the genetic map are still limited. Furthermore, the association studies were lagged than QTL research on Miscanthus, and to date, the only two studies were reported. Zhao et al. (2013) conducted marker-trait association by analyzing a M. sinensis population from China and using 23 SSR markers transferable from Brachypodium distachyon and 9 markers were significantly (P < 0.01) associated with heading date and biomass yield. A genome-wide association study was conducted in a 138 M. sinensis population by using 53,174 single-nucleotide variants (SNVs) (Slavov et al., 2014) and a total of 17 significant associations (false discovery rate < 10−5) with phenology, morphology, and cell wall composition traits were detected. In our study, 12 significant associations of biomass yield with related traits were identified and marker “793” associated with flag leaf width reached genome-wide significant after Bonferroni correction for multiple testing. The possible reason why we obtained a number of significant associations similar to Slavov et al. (2014) while using a much smaller number of markers could be that the PCR-based markers are more likely to be associated with traits than random SNPs (just based on their distribution in the genome). However, in our study the ability to predict phenotypes seemed lower than that obtained from genome-wide sequencing (Slavov et al., 2014). Other factors like the number of markers and the structure of the population may be equally important in influencing the power of association studies. The phenotypic data and markers result from association study could be potential candidates to supplementing the database of Miscanthus for improving genome-wide selection in a breeding program.
Author Contributions
XZ, LH, and GN conceived the project and designed the experiments; GN, XW, and YZ performed the experiments; GN, XY, and XL analyzed the data; XZ, MT, and YJ finalized the manuscript; all authors discussed the results and reviewed the manuscript.
Conflict of Interest Statement
The authors declare that the research was conducted in the absence of any commercial or financial relationships that could be construed as a potential conflict of interest.
Acknowledgments
This work was supported by the Earmarked Fund for the Modern Agro-Industry Technology Research System (#CARS-35-05), the National High-Technology Research and Development Program (863 Program) of China (No. 2012AA101801-02), and National Basic Research Program (973 Program) in China (2014CB138705).
Supplementary Material
The Supplementary Material for this article can be found online at: http://journal.frontiersin.org/article/10.3389/fpls.2016.00802
References
Anzoua, K. G., Suzuki, K., Fujita, S., Toma, Y., and Yamada, T. (2015). Evaluation of morphological traits, winter survival and biomass potential in wild Japanese Miscanthus sinensis Anderss. populations in northern Japan. Grassl. Sci. 61, 83–91. doi: 10.1111/grs.12085
Aranzana, M. J., Kim, S., Zhao, K., Bakker, E., Horton, M., Jakob, K., et al. (2005). Genome-wide association mapping in Arabidopsis identifies previously known flowering time and pathogen resistance genes. PLoS Genet. 1:e60. doi: 10.1371/journal.pgen.0010060
Atienza, S. G., Satovic, Z., Petersen, K. K., Dolstra, O., and Martin, A. (2003a). Identification of QTLs associated with yield and its components in Miscanthus sinensis Anderss. Euphytica 132, 353–361. doi: 10.1023/A:1025041926259
Atienza, S. G., Satovic, Z., Petersen, K. K., Dolstra, O., and Martin, A. (2003b). Identification of QTLs influencing agronomic traits in Miscanthus sinensis Anderss. I. Total height, flag-leaf height and stem diameter. Theor. Appl. Genet. 107, 123–129. doi: 10.1007/s00122-003-1220-5
Atienza, S. G., Satovic, Z., Petersen, K. K., Dolstra, O., and Martin, A. (2003c). Identification of QTLs influencing combustion quality in Miscanthus sinensis Anderss. II. Chlorine and potassium content. Theor. Appl. Genet. 107, 857–863. doi: 10.1007/s00122-003-1218-z
Atienza, S. G., Satovic, Z., Petersen, K. K., Dolstra, O., and Martin, A. (2003d). Influencing combustion quality in Miscanthus sinensis Anderss.: identification of QTLs for calcium, phosphorus and sulphur content. Plant Breeding 122, 141–145. doi: 10.1046/j.1439-0523.2003.00826.x
Bradbury, P. J., Zhang, Z., Kroon, D. E., Casstevens, T. M., Ramdoss, Y., and Buckler, E. S. (2007). TASSEL: software for association mapping of complex traits in diverse samples. Bioinformatics 23, 2633–2635. doi: 10.1093/bioinformatics/btm308
Breseghello, F., and Sorrells, M. E. (2006). Association mapping of kernel size and milling quality in wheat (Triticum aestivum L.) cultivars. Genetics 172, 1165–1177. doi: 10.1534/genetics.105.044586
Chae, W. B., Hong, S. J., Gifford, J. M., Rayburn, A. L., Sacks, E. J., and Juvik, J. A. (2014). Plant morphology, genome size, and SSR markers differentiate five distinct taxonomic groups among accessions in the genus Miscanthus. Global Change Biol. Bioenergy 6, 646–660. doi: 10.1111/gcbb.12101
Clark, L. V., Brummer, J. E., Glowacka, K., Hall, M. C., Heo, K., Peng, J., et al. (2014). A footprint of past climate change on the diversity and population structure of Miscanthus sinensis. Ann. Bot. 114, 97–107. doi: 10.1093/aob/mcu084
Clifton-Brown, J. C., and Lewandowski, I. (2000). Overwintering problems of newly established Miscanthus plantations can be overcome by identifying genotypes with improved rhizome cold tolerance. New Phytol. 148, 287–294. doi: 10.1046/j.1469-8137.2000.00764.x
Clifton-Brown, J. C., Lewandowski, I., Andersson, B., Basch, G., Christian, D. G., Kjeldsen, J. B., et al. (2001). Performance of 15 Miscanthus genotypes at five sites in Europe. Agron. J. 93, 1013–1019. doi: 10.2134/agronj2001.9351013x
Dwiyanti, M. S., Stewart, J. R., Nishiwaki, A., and Yamada, T. (2014). Natural variation in Miscanthus sinensis seed germination under low temperatures. Grassl. Sci. 60, 194–198. doi: 10.1111/grs.12051
Eleuch, L., Jilal, A., Grando, S., Ceccarelli, S., Schmising, M. V., Tsujimoto, H., et al. (2008). Genetic diversity and association analysis for salinity tolerance, heading date and plant height of barley germplasm using simple sequence repeat markers. J. Integr. Plant Biol. 50, 1004–1014. doi: 10.1111/j.1744-7909.2008.00670.x
Endelman, J. B. (2011). Ridge regression and other kernels for genomic selection with R package rrBLUP. Plant Genome 4, 250–255. doi: 10.3835/plantgenome2011.08.0024
Evanno, G., Regnaut, S., and Goudet, J. (2005). Detecting the number of clusters of individuals using the software STRUCTURE: a simulation study. Mol. Ecol. 14, 2611–2620. doi: 10.1111/j.1365-294X.2005.02553.x
Gifford, J. M., Chae, W. B., Swaminathan, K., Moose, S. P., and Juvik, J. A. (2015). Mapping the genome of Miscanthus sinensis for QTL associated with biomass productivity. GCB Bioenergy 7, 797–810. doi: 10.1111/gcbb.12201
Greef, J. M., Deuter, M., Jung, C., and Schondelmaier, J. (1997). Genetic diversity of European Miscanthus species revealed by AFLP fingerprinting. Genet. Res. Crop Evol. 44, 185–195. doi: 10.1023/A:1008693214629
Harjes, C. E., Rocheford, T. R., Bai, L., Brutnell, T. P., Kandianis, C. B., Sowinski, S. G., et al. (2008). Natural genetic variation in lycopene epsilon cyclase tapped for maize biofortification. Science 319, 330–333. doi: 10.1126/science.1150255
Hastings, A., Clifton-Brown, J., Wattenbach, M., Mitchell, P., and Smith, P. (2009). The development of MISCANFOR, a new Miscanthus crop growth model: towards more robust yield predictions under different climatic and soil conditions. GCB Bioenergy 1, 154–170. doi: 10.1111/j.1757-1707.2009.01007.x
Heaton, E. A., Dohleman, F. G., and Long, S. P. (2008). Meeting US biofuel goals with less land: the potential of Miscanthus. GCB 14, 2000–2014. doi: 10.1111/j.1365-2486.2008.01662.x
Heaton, E. A., Dohleman, F. G., and Long, S. P. (2009). Seasonal nitrogen dynamics of Miscanthus × giganteus and Panicum virgatum. GCB Bioenergy 1, 297–307. doi: 10.1111/j.1757-1707.2009.01022.x
Heaton, E., Voigt, T., and Long, S. P. (2004). A quantitative review comparing the yields of two candidate C4 perennial biomass crops in relation to nitrogen, temperature and water. Biomass Bioenergy 27, 21–30. doi: 10.1016/j.biombioe.2003.10.005
Hernandez, P., Dorado, G., Laurie, D. A., Martin, A., and Snape, J. W. (2001). Microsatellites and RFLP probes from maize are efficient sources of molecular markers for the biomass energy crop Miscanthus. Theor. Appl. Genet. 102, 616–622. doi: 10.1007/s001220051688
Ho, C. W., Wu, T. H., Hsu, T. W., Huang, J. C., Huang, C. C., and Chiang, T. Y. (2011). Development of 12 genic microsatellite loci for a biofuel grass, Miscanthus sinensis (Poaceae). Am. J. Bot. 98, e201–e203. doi: 10.3732/ajb.1100071
Hodkinson, T. R., Chase, M. W., Lledo, M. D., Salamin, N., and Renvoize, S. A. (2002a). Phylogenetics of Miscanthus, Saccharum and related genera (Saccharinae, Andropogoneae, Poaceae) based on DNA sequences from ITS nuclear ribosomal DNA and plastid trnL intron and trnL-F intergenic spacers. J. Plant Res. 115, 381–392. doi: 10.1007/s10265-002-0049-3
Hodkinson, T. R., Chase, M. W., Takahashi, C., Leitch, I. J., Bennett, M. D., and Renvoize, S. A. (2002b). The use of DNA sequencing (ITS and trnL-F), AFLP, and fluorescent in situ hybridization to study allopolyploid Miscanthus (Poaceae). Am. J. Bot. 89, 279–286. doi: 10.3732/Ajb.89.2.279
Huang, C. L., Liao, W. C., and Lai, Y. C. (2011). Cultivation studies of Taiwanese native Miscanthus floridulus lines. Biomass Bioenergy 35, 1873–1877. doi: 10.1016/j.biombioe.2011.01.032
Hung, K. H., Chiang, T. Y., Chiu, C. T., Hsu, T. W., and Ho, C. W. (2009). Isolation and characterization of microsatellite loci from a potential biofuel plant Miscanthus sinensis (Poaceae). Conserv. Genet. 10, 1377–1380. doi: 10.1007/s10592-008-9699-6
Jezowski, S. (2008). Yield traits of six clones of Miscanthus in the first 3 years following planting in Poland. Ind. Crop Prod. 27, 65–68. doi: 10.1016/j.indcrop.2007.07.013
Jiang, J. X., Zhu, M. D., Ai, X., Xiao, L., Deng, G. T., and Yi, Z. L. (2013). Molecular evidence for a natural diploid hybrid between Miscanthus sinensis (Poaceae) and M. sacchariflorus. Plant Syst. Evol. 299, 1367–1377. doi: 10.1007/s00606-013-0801-2
Kantety, R. V., La Rota, M., Matthews, D. E., and Sorrells, M. E. (2002). Data mining for simple sequence repeats in expressed sequence tags from barley, maize, rice, sorghum and wheat. Plant Mol. Biol. 48, 501–510. doi: 10.1023/A:1014875206165
Kim, C., Lee, T. H., Guo, H., Chung, S. J., Paterson, A. H., Kim, D. S., et al. (2014). Sequencing of transcriptomes from two Miscanthus species reveals functional specificity in rhizomes, and clarifies evolutionary relationships. BMC Plant Biol. 14, 134. doi: 10.1186/1471-2229-14-134
Kim, C., Zhang, D., Auckland, S. A., Rainville, L. K., Jakob, K., Kronmiller, B., et al. (2012). SSR-based genetic maps of Miscanthus sinensis and M. sacchariflorus, and their comparison to sorghum. Theor. Appl. Genet. 124, 1325–1338. doi: 10.1007/s00122-012-1790-1
Lewandowski, I., Clifton-Brown, J. C., Andersson, B., Basch, G., Christian, D. G., Jorgensen, U., et al. (2003a). Environment and harvest time affects the combustion qualities of Miscanthus genotypes. Agron. J. 95, 1274–1280. doi: 10.2134/agronj2003.1274
Lewandowski, I., Clifton-Brown, J. C., Scurlock, J. M. O., and Huisman, W. (2000). Miscanthus: European experience with a novel energy crop. Biomass Bioenergy 19, 209–227. doi: 10.1016/S0961-9534(00)00032-5
Lewandowski, I., Scurlock, J. M. O., Lindvall, E., and Christou, M. (2003b). The development and current status of perennial rhizomatous grasses as energy crops in the US and Europe. Biomass Bioenergy 25, 335–361. doi: 10.1016/S0961-9534(03)00030-8
Li, G., and Quiros, C. F. (2001). Sequence-related amplified polymorphism (SRAP), a new marker system based on a simple PCR reaction: its application to mapping and gene tagging in Brassica. Theor. Appl. Genet. 103, 455–461. doi: 10.1007/s001220100570
Liu, S., Clark, L. V., Swaminathan, K., Gifford, J. M., Juvik, J. A., and Sacks, E. J. (2015). High-density genetic map of Miscanthus sinensis reveals inheritance of zebra stripe. GCB Bioenergy 8, 616–630. doi: 10.1111/gcbb.12275
Lu, C. R., Yu, S. X., Yu, J. W., Fan, S. L., Song, M. Z., Wang, W., et al. (2008). Development and appraisement of functional molecular marker: intron sequence amplified polymorphism (ISAP). Hereditas 30, 1207–1216. doi: 10.3724/SP.J.1005.2008.01207
Lu, Y. F., Jiang, J. X., and Yi, Z. L. (2012). Study on the transferability of maize SSR and sugarcane EST-SSR markers to Miscanthus (Poaceae). Acta Pratacul. Sin. 21, 86–95. Available online at: http://cyxb.lzu.edu.cn/CN/abstract/abstract3412.shtml
Ma, X. F., Jensen, E., Alexandrov, N., Troukhan, M., Zhang, L., Thomas-Jones, S., et al. (2012). High resolution genetic mapping by genome sequencing reveals genome duplication and tetraploid genetic structure of the diploid Miscanthus sinensis. PLoS ONE 7:e33821. doi: 10.1371/journal.pone.0033821
Maughan, M., Bollero, G., Lee, D. K., Darmody, R., Bonos, S., Cortese, L., et al. (2012). Miscanthus × giganteus productivity: the effects of management in different environments. GCB Bioenergy 4, 253–265. doi: 10.1111/j.1757-1707.2011.01144.x
Mittermeier, R. A., Myers, N., and Mittermeier, C. G. (2000). Hotspots: Earth's Biologically Richest and Most Endangered Terrestrial Ecoregions. Washington, DC: Conservation International.
Nei, M. (1973). Analysis of gene diversity in subdivided population. Proc. Natl. Acad. Sci. U.S.A. 70, 3321–3323.
Nie, G., Zhang, X. Q., Huang, L. K., Xu, W. Z., Wang, J. P., Zhang, Y. W., et al. (2014). Genetic variability and population structure of the potential bioenergy crop Miscanthus sinensis (Poaceae) in Southwest China based on SRAP markers. Molecules 19, 12881–12897. doi: 10.3390/molecules190812881
Nishiwaki, A., Mizuguti, A., Kuwabara, S., Toma, Y., Ishigaki, G., Miyashita, T., et al. (2011). Discovery of natural Miscanthus (Poaceae) triploid plants in sympatric populations of Miscanthus sacchariflorus and Miscanthus sinensis in southern Japan. Am. J. Bot. 98, 154–159. doi: 10.3732/ajb.1000258
Peakall, R., and Smouse, P. E. (2012). GenAlEx 6.5: genetic analysis in Excel. Population genetic software for teaching and research–an update. Bioinformatics 28, 2537–2539. doi: 10.1093/bioinformatics/bts460
Pritchard, J. K., Stephens, M., and Donnelly, P. (2000). Inference of population structure from multilocus genotype data. Genetics 155, 945–959. doi: 10.1534/genetics.107.072371
Roldan-Ruiz, I., Dendauw, J., Van Bockstaele, E., Depicker, A., and De Loose, M. (2000). AFLP markers reveal high polymorphic rates in ryegrasses (Lolium spp.). Mol. Breeding 6, 125–134. doi: 10.1023/A:1009680614564
Shimono, Y., Kurokawa, S., Nishida, T., Ikeda, H., and Futagami, N. (2013). Phylogeography based on intraspecific sequence variation in chloroplast DNA of Miscanthus sinensis (Poaceae), a native pioneer grass in Japan. Botany 91, 449–456. doi: 10.1139/cjb-2012-0212
Skøt, L., Humphreys, J., Humphreys, M. O., Thorogood, D., Gallagher, J., Sanderson, R., et al. (2007). Association of candidate genes with flowering time and water-soluble carbohydrate content in Lolium perenne (L.). Genetics 177, 535–547. doi: 10.1534/genetics.107.071522
Slatkin, M., and Barton, N. H. (1989). A comparison of three indirect methods for estimating average levels of gene flow. Evolution 43, 1349–1368.
Slavov, G. T., Nipper, R., Robson, P., Farrar, K., Allison, G. G., Bosch, M., et al. (2014). Genome-wide association studies and prediction of 17 traits related to phenology, biomass and cell wall composition in the energy grass Miscanthus sinensis. New Phytol. 201, 1227–1239. doi: 10.1111/nph.12621
Stewart, J. R., Toma, Y., Fernandez, F. G., Nishiwaki, A., Yamada, T., and Bollero, G. (2009). The ecology and agronomy of Miscanthus sinensis, a species important to bioenergy crop development, in its native range in Japan: a review. GCB Bioenergy 1, 126–153. doi: 10.1111/j.1757-1707.2009.01010.x
Swaminathan, K., Chae, W. B., Mitros, T., Varala, K., Xie, L., Barling, A., et al. (2012). A framework genetic map for Miscanthus sinensis from RNAseq-based markers shows recent tetraploidy. BM Genomics 13:142. doi: 10.1186/1471-2164-13-142
Wang, J., McClean, P. E., Lee, R., Goos, R. J., and Helms, T. (2008). Association mapping of iron deficiency chlorosis loci in soybean (Glycine max L. Merr.) advanced breeding lines. Theor. Appl. Genet. 116, 777–787. doi: 10.1007/s00122-008-0710-x
Wang, M. L., Barkley, N. A., Yu, J.-K., Dean, R. E., Newman, M. L., Sorrells, M. E., et al. (2005). Transfer of simple sequence repeat (SSR) markers from major cereal crops to minor grass species for germplasm characterization and evaluation. Plant Genet Res 3, 45–57. doi: 10.1079/PGR200461
Xiao, L., Xue, D., Jiang, J. X., Ai, X., Qin, J. P., Chen, Z. Y., et al. (2013). Genetic diversity in Miscanthus sinensis of China revealed by Simple Sequence Repeats DNA markers. J. Plant Genet Res.14, 32–36. doi: 10.3969/j.issn.1672-1810.2013.01.006
Xu, W. Z., Zhang, X. Q., Huang, L. K., Nie, G., and Wang, J. P. (2013). Higher genetic diversity and gene flow in wild populations of Miscanthus sinensis in southwest China. Biochem. Syst. Ecol. 48, 174–181. doi: 10.1016/j.bse.2012.11.024
Yan, H. D., Zhang, X. Q., Fu, C., Huang, L. K., Yin, G. H., Nie, G., et al. (2015). Chloroplast DNA variation and genetic structure of Miscanthus sinensis in southwest China. Biochem. Syst. Ecol. 58, 132–138. doi: 10.1016/j.bse.2014.11.007
Yook, M. J., Lim, S. H., Song, J. S., Kim, J. W., Zhang, C. J., Lee, E. J., et al. (2014). Assessment of genetic diversity of Korean Miscanthus using morphological traits and SSR markers. Biomass Bioenergy 66, 81–92. doi: 10.1016/j.biombioe.2014.01.025
Yu, J., and Buckler, E. S. (2006). Genetic association mapping and genome organization of maize. Curr. Opin. Biotechnol. 17, 155–160. doi: 10.1016/j.copbio.2006.02.003
Yu, X., Bai, G., Luo, N., Chen, Z., Liu, S., Liu, J., et al. (2011). Association of simple sequence repeat (SSR) markers with submergence tolerance in diverse populations of perennial ryegrass. Plant Sci. 180, 391–398. doi: 10.1016/j.plantsci.2010.10.013
Zhao, H., Wang, B., He, J., Yang, J., Pan, L., Sun, D., et al. (2013). Genetic diversity and population structure of Miscanthus sinensis germplasm in China. PLoS ONE 8:e75672. doi: 10.1371/journal.pone.0075672
Zhong, Z. L., Jiang, J. X., Lang, L., and Yi, Z. L. (2009). Genetic diversity analysis of Miscanthus species by maize SSR primers. Prog. Mod. Biomed. 9, 2076–2079. doi: 10.13241/j.cnki.pmb.2009.11.001
Keywords: bio-fuel, biomass yield, molecular markers, association analysis, Miscanthus sinensis
Citation: Nie G, Huang L, Zhang X, Taylor M, Jiang Y, Yu X, Liu X, Wang X and Zhang Y (2016) Marker-Trait Association for Biomass Yield of Potential Bio-fuel Feedstock Miscanthus sinensis from Southwest China. Front. Plant Sci. 7:802. doi: 10.3389/fpls.2016.00802
Received: 10 March 2016; Accepted: 22 May 2016;
Published: 07 June 2016.
Edited by:
Kerrie Farrar, Aberystwyth University, UKReviewed by:
Wengang Xie, Lanzhou University, ChinaLindsay V. Clark, University of Illinois, Urbana-Champaign, USA
Copyright © 2016 Nie, Huang, Zhang, Taylor, Jiang, Yu, Liu, Wang and Zhang. This is an open-access article distributed under the terms of the Creative Commons Attribution License (CC BY). The use, distribution or reproduction in other forums is permitted, provided the original author(s) or licensor are credited and that the original publication in this journal is cited, in accordance with accepted academic practice. No use, distribution or reproduction is permitted which does not comply with these terms.
*Correspondence: Xinquan Zhang, emhhbmd4cUBzaWNhdS5lZHUuY24=
 Gang Nie
 Linkai Huang
 Xinquan Zhang
 Megan Taylor
 Yiwei Jiang
 Xiaoqing Yu
 Xinchun Liu
 Xinyu Wang
 Yajie Zhang
