
94% of researchers rate our articles as excellent or good
Learn more about the work of our research integrity team to safeguard the quality of each article we publish.
Find out more
ORIGINAL RESEARCH article
Front. Plant Sci., 31 December 2012
Sec. Plant Physiology
Volume 3 - 2012 | https://doi.org/10.3389/fpls.2012.00295
This article is part of the Research TopicRetrograde Signaling in PlantsView all 26 articles
Amplitude- and frequency-modulated waves of Ca2+ ions transmit information inside cells. Reactive Oxygen Species (ROS), specifically hydrogen peroxide, have been proposed to have a similar role in plant cells. We consider the feasibility of such an intracellular communication system in view of the physical and biochemical conditions in plant cells. As model system, we use a H2O2 signal originating at the plasma membrane (PM) and spreading through the cytosol. We consider two maximally simple types of signals, isolated pulses and harmonic oscillations. First we consider the basic limits on such signals as regards signal origin, frequency, amplitude, and distance. Then we establish the impact of ROS-removing enzymes on the ability of H2O2 to transmit signals. Finally, we consider to what extent cytoplasmic streaming distorts signals. This modeling allows us to predict the conditions under which diffusion-mediated signaling is possible. We show that purely diffusive transmission of intracellular information by H2O2 over a distance of 1 μm (typical distance between organelles, which may function as relay stations) is possible at frequencies well above 1 Hz, which is the highest frequency observed experimentally. This allows both frequency and amplitude modulation of the signal. Signaling over a distance of 10 μm (typical distance between the PM and the nucleus) may be possible, but requires high signal amplitudes or, equivalently, a very low detection threshold. Furthermore, at this longer distance a high rate of enzymatic degradation is required to make signaling at frequencies above 0.1 Hz possible. In either case, cytoplasmic streaming does not seriously disturb signals. We conclude that although purely diffusion-mediated signaling without relaying stations is theoretically possible, it is unlikely to work in practice, since it requires a much faster enzymatic degradation and a much lower cellular background concentration of H2O2 than observed experimentally.
It has long been clear that hydrogen peroxide is involved in signaling in plant cells, and a variety of mechanisms have been proposed for the information transmission (Neill et al., 2002). In a meta-analysis of gene expression induced by a range of localized stress in Arabidopsis leaves, Gadjev et al. (2006) showed that all, or almost all, localized stress treatments activated a large group of genes, which they named general oxidative stress response markers. However, each treatment regulated a unique group of genes, indicating that origin-specific signals were transmitted within the cell. This demonstrates a fundamental signaling phenomenon, which could be operating in any organs, in any cell type in response to any environmental condition.
We have proposed that oxidized peptides are better suited for transmitting specific information to the nucleus than hydrogen peroxide, the most likely signaling molecule in the Reactive Oxygen Species (ROS) family (Møller and Sweetlove, 2010). In that analysis, we concluded that the combination of cytoplasmic streaming and hydrogen peroxide degradation would make signaling via waves of hydrogen peroxide difficult, but the conclusion was not based on any mathematical modeling. More recently, Mittler et al. (2011) proposed that “the ROS signal itself carries within it a decoded (Note: the authors must have meant “encoded” here) message, much like calcium signals that have specific oscillation patterns within defined cellular locations. The specific features of the signal (amplitude, frequency, and/or localization) could then be perceived and decoded by specialized mechanisms to trigger specific gene expression patterns.”
We here consider to what extent intracellular hydrogen peroxide signaling via diffusion is possible, given the physical and biochemical conditions in the cytosol of plant cells. The proposed mechanism is similar to signaling in plant cells by calcium ions, where typically an external stimulus – an invading organism or a nearby cell – causes an influx of calcium ions across the plasma membrane (PM). These calcium ions diffuse through the cytosol to cause the release of calcium ions – either directly or indirectly via inositol triphosphate – from intracellular stores, typically the endoplasmic reticulum, which therefore acts as a relay station to maintain/amplify the signal. When release at the PM ceases, possibly via a negative feedback effect of the calcium ions, recovery occurs as calcium ions are pumped out of the cell or into intracellular stores. The calcium ion signal is received and decoded, e.g., by transcription factors, to change gene expression (Berridge, 1993; Parekh, 2011).
Here the cytoplasm (cytosol plus organelles) acts as an excitable medium, a non-linear dynamical system, and has the capacity to propagate a pulse, while it cannot support the passing of another pulse until it has had time to recover (known as the refractory time). The amplitude and propagation speed of the pulse is affected by the buffering capacity of the cytosol and molecular crowding (Jafri and Keizer, 1995; Dargan and Parker, 2003; Falcke, 2003; Mironova and Mironov, 2008).
When plant cells, e.g., detect an invading organism at the cell wall, one of a cell’s first responses is the recruitment of NADPH oxidase to the PM adjacent to the invasion site and the initiation of superoxide formation and ultimately hydrogen peroxide formation immediately outside the PM. The hydrogen peroxide can enter the cell via aquaporins in the PM (Bienert et al., 2007) and the cell could produce an amplitude- and/or frequency-modulated signal by synchronized modulation of the opening state of the aquaporin molecules in a membrane patch via phosphorylation/dephosphorylation (Maurel et al., 2009). We here address the propagation of such a signal, without which such a signal would make no sense.
We note that the presence of relaying stations in the cytosol is a prerequisite for calcium-mediated signaling in animal cells. We further note that no such relaying stations for H2O2 have been found in plant cells. We consequently consider how a diffusion-mediated signal propagates from the PM across the cytosol to the nucleus in a plant cell in the absence of relaying stations, and we investigate whether and when the signal can be delivered to the nucleus by diffusion alone.
We break the problem into its constituent parts and analyze it by starting with the simplest possible model, adding parts (and thus complexity) one at a time.
This section contains derivations of the theoretical description of diffusion-mediated signaling on which the results presented in Section “Results” are based. A list of the symbols used in the modeling is presented in Table 1.
The dynamics of the concentration c of a species of diffusing molecules is described by the diffusion equation
where r = (x, y, z) denotes the position in space, t parameterizes time, and ▽2 is the Laplace operator,
Consider a point-like emitter which emits an instantaneous pulse of n0 molecules at time t = 0. The concentration that is measured at a given distance from the point of emission after a time t has elapsed, is then
which is the fundamental solution (http://en.wikipedia.org/wiki/Fundamental_solution, 2012-11-25) of the diffusion equation (Eq. 1).
We next consider a single water channel in an infinite, flat impermeable membrane. We refer to this geometry as the open geometry. An aquaporin is less than 10 nm wide and is therefore effectively point-size compared to the distances over which the signal is transmitted (1–10 μm). We assume that the channel lets an instantaneous pulse of n0 molecules cross the membrane. The geometry is the same as above except for the membrane, which restricts the molecules to one half of space. The concentration in that half is hence twice that given in Eq. 3,
Equation 4 is the fundamental solution of the diffusion equation in the open geometry with its closed boundary condition at the membrane at x = 0,
Now assume that channels are distributed evenly over the cell membrane. We denote by ρa the surface density of these channels. If in an area of size a × a all of these emit simultaneously, then the emitted signal can be found by adding up the concentrations from all emitters in that area, using c0 for each emitter. That is, we find the concentration as the convolution of the fundamental solution (Eq. 4) with the constant density profile over the emission area.
At a point on the x-axis a distance x from the membrane – i.e., on the normal through the center [(y, z) = (0, 0)] of the area containing channels (Figure 1A) – the measured concentration after emission is thus
where N0 = ρan0 and erf denotes the error function,
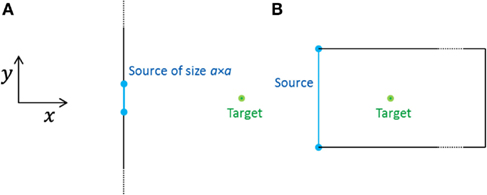
Figure 1. Geometries of the two models considered, seen from above (the z-direction points out of the plane). (A) Open geometry: a square source emits into an infinite half-space. The target is situated at a distance x from the center of the source. (B) Closed geometry: the source fills the whole end-wall of a cell and the target is situated at a distance x from the center of the end-wall. All the cell walls are closed boundaries.
Note that when we are far enough away from the source (approximately when x is larger than a), the signal looks the same no matter what the source looks like; the forms of signals from different emission areas are very similar, the only difference is the scale, which is determined by the total number of molecules emitted. The same similarity of signals occurs even close to the emission area at late times, when the initial shapes of all signals have disappeared by diffusion and all signals are described by Eq. 4 (albeit with different amplitudes). This also means that the specific shape of the emission area is not important. Signals emitted from a square, circular, or differently shaped areas all look alike as long as the dimensions of the areas are roughly the same.
For simplicity, we have assumed above that the dimensions of the cell are much larger than a, the linear extent of the area emitting the signal, i.e., the cell is effectively infinitely large (Figure 1A). We refer to this case as the open geometry, because most of the cell membrane is absent, effectively, being too far away to matter in the diffusive dynamics of concentrations of signaling molecules. In the Results section, Figures 3–7 present results for this geometry.
We shall see below that for the signal to be detectable at the target (∼10 μm from the source), the area of emission must be of the same order (∼10 μm × 10 μm) as the dimension of an epidermal cell (∼10 μm × 20 μm × 100 μm). In an extreme example, the whole end-wall (10 μm × 20 μm) of the cell emits a synchronized signal and the cell walls act as closed (reflecting) boundaries (Figure 1B). Because of the closed boundary conditions the concentration inside the cell does not depend on the y- and z- coordinates and this geometry is mathematically equivalent to a point source emitting in one dimension. Then the concentration measured at time t after emission only depends on the distance in the x-direction from the source and on the length L of the cell, e.g., L = 100 μm. It is calculated using the method of images (Griffiths, 1999) and is
In the Section “Results,” Figures 8–12 present results from such a closed system. Note that while the sum in Eq. 9 in principle is infinite, only a few terms with values of m near 0 contribute in practice.
The refractory time tref is the time it takes, after detection of a pulse signal, for the concentration in a given point to drop to a sufficiently low value to allow detection of a new pulse signal. We define this threshold concentration to be some fraction α of the peak concentration cmax attained at that point in consequence of an emitted signal, the trough/peak ratio. This peak concentration occurs at tmax by definition of this time. In the simplest possible case of the point source, this time is equal to the diffusion time, defined as tD = x2/(6D) in three dimensions. In the simple case of an open geometry, one arrives at the same result, approximately, in cases where the target is further from the source than the size of the emission area. This approximation improves with distance from the source. In a closed geometry, tmax is approximately equal to x2/(2D), which is the diffusion time in one dimension. In general tmax must be found numerically.
The refractory time is found as the solution to the equation
and is
in the simple cases of a point source as well as for an open geometry resembling a point source. Here W is the Lambert-W function, defined implicitly by W(x)eW(x) = x.
An instantaneous pulse is a mathematical abstraction, which is easy to work with, but which does not exist in reality, since an instantaneous emission of a signal of some amplitude N0 would imply an infinite flux over the membrane. Instead, the channels stay open for a duration Δt during which a flux j0 passes through, giving a total signal amplitude of N0 = j0Δt. In the geometry described by Eq. 7, we cannot solve the diffusion equation analytically, and we must solve the diffusion equation (Eq. 1) numerically. This is done using Comsol Multiphysics, a finite element solver for physics and engineering applications.
However, for short times after emission, in the closed geometry or close to the source in the open geometry (i.e., in a point located at a distance from the source which is much smaller than the spatial extent of the source), the system is mathematically equivalent to that of a point source emitting in one dimension. Furthermore, at long times or far from the source in the open geometry, the system is equivalent to that of a point source emitter in three dimensions. Both these cases can be solved analytically. In the 1D case, for times t ≤ Δt, the solution is
where erfc is the complementary error function, erfc = 1 − erf. For t > Δt, the solution is
In the 3D case, the concentration measured at a distance x from the source along a line perpendicular to the membrane is for t ≤ Δt,
and for t > Δt,
Figure 3 illustrates these analytical results. As long as Δt is approximately equal to or shorter than the characteristic diffusion time of an instantaneous pulse, the signal does not differ significantly from that of an instantaneous pulse. We refer to a signal of this type as a short pulse signal.
As far as we know, H2O2 is mainly transported over the membrane by aquaporins. These are passive channels, so the concentration inside the membrane cannot exceed the concentration cout outside the membrane. Furthermore, if the concentration inside the membrane approaches the outside concentration, the flux will diminish.
The maximal concentration on the inside of the membrane is found at time Δt and is (from Eq. 12)
This means that j0 must be much smaller than or equivalently for the flux to stay constant during the time that the channels are open.
Hydrogen peroxide is degraded by enzymes inside the cell. We assume Michaelis–Menten kinetics. Then the evolution of the concentration is described by the reaction-diffusion equation
The reaction-diffusion equation is non-linear, and no known analytical solution exists. We solve the equation numerically using Comsol.
We also consider a harmonically oscillating signal in the closed geometry, that is, a harmonically oscillating flux over the end membrane (x = 0) of the cell. This is described mathematically by the boundary condition
where j0 is the average flux and f is the frequency of the signal. We solve the diffusion equation with degradation (Eq. 17) in one dimension numerically using Comsol with the boundary condition given by Eq. 18 at x = 0 and a closed boundary at x = 100 μm.
We investigate the effect that cytoplasmic streaming may have on signaling. A cytoplasmic stream can be modeled as a roughly cylindrical stream of infinite extent in the open geometry (Figure 2A). If a signaling molecule diffuses into this stream, it will be translated in the direction of the stream with a speed approximately equal to the average speed v found in a cross-section of the stream until the molecule diffuses out of the stream again. As Figure 2A shows, molecules can circumvent the stream and many will reach the target without having crossed the stream. Those whose do cross it will spend an amount of time in the stream which is on the order of the characteristic diffusion time,
where d is the width of the stream or the distance between the source and the target, whichever is smaller. During this time, a particle in the stream is translated a distance
in the direction of the stream (the y-direction). Here Pe is the Péclet number. In biological cells Pe is typically much smaller than one.
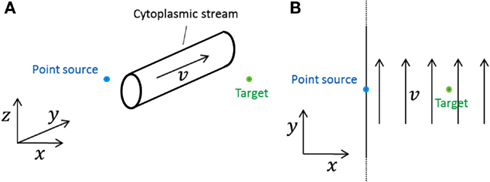
Figure 2. Model systems considered for investigating the effect of cytoplasmic streams. In both cases a point source emits into a cell which is of effectively infinite size (open geometry). (A) A roughly cylindrical cytoplasmic stream of effectively infinite extent along the y-axis and of diameter d is situated between the source and the target. The direction of the stream is perpendicular to the line between source and target. (B) A cytoplasmic stream fills up the entire cell. The direction of the stream is perpendicular to the line between source and target.
Since d is smaller than the distance from the source to the target, Δy is negligible compared to the source-target distance if Pe is smaller than one. Thus, as long as Pe is smaller than one, the effect of cytoplasmic streams is negligible.
In the previous subsection, we showed that cytoplasmic streaming has a negligible effect on signal transmission via diffusion in plant cells, by using an order-of-magnitude argument. The present subsection provides a more rigorous proof. It is rather equation-heavy and can be skipped.
We consider a cytoplasmic stream which fills the entire inside of the “cell” in the open geometry, moving with velocity v everywhere (Figure 2B). This is an extreme case; it is not physically realistic, but any realistic stream will do less transport of signaling molecules. So if we can show that this stream only has negligible effect on the signal measured at the target, then we know that a more realistic cytoplasmic stream, smaller and roughly cylindrical, e.g., has an even smaller effect.
At time t after emission of a short pulse signal from a point-like emitter located at (x,y,z) = (0,0,0), the concentration at the point r inside this cell is equal to
The time tmax when the concentration reaches its peak at the point r, is found by setting the derivative of Eq. 21 to zero and solving for t. This gives
where
and Pe is defined in Eq. 20. Measured at a distance x from the source and perpendicular to the stream (y, z) = (0, 0), the peak signal is then
This should be compared to the peak signal in the absence of a cytoplasmic stream,
Thus, the cytoplasmic stream decreases the peak concentration by a factor of
Even for a Péclet number of one, corresponding to a stream speed of 100 μm s−1 (the highest reported in literature) and a source-target distance of 10 μm (the longest considered), this factor is equal to 0.96. The cytoplasmic stream only decreases the peak signal by 4% in this extreme case. Furthermore, in this case the time at which the peak concentration is measured is 0.97 times tD, the time at which the peak concentration is measured in the absence of cytoplasmic streaming. So we can conclude that the effect of cytoplasmic streaming on the signal is completely negligible in more realistic, less extreme, scenarios.
The values of the various parameters introduced above and the way they influence the hydrogen peroxide signal, will be treated stepwise in the Results section. Table 2 shows typical values of these parameters.
Two properties of the emitted signal determine whether it can be detected at the target: (i) the peak concentration, cmax, of the signaling molecules, which needs to be higher than the minimal detectable concentration, cdetect, and (ii) the refractory time of the signal, which is the time one must wait between emission of signals for successive signals to be discernible. We defined this period as the time it takes for the concentration at the target to drop to say 1/10 (or, alternatively, to 1/100) of its maximal concentration. Exactly to what fraction of its peak that the signal must drop to before a new signal can be discerned is unknown and probably varies between cells. We therefore discuss results for both the relatively low and high arbitrarily chosen peak/trough ratios of 10 and 100.
If we assume that the resting concentration of H2O2 in the cytosol is 0.1 μM (by analogy with free calcium ions in cells) and that the peak concentration must at least be ten times higher than this to be detected, then the minimal detectable concentration at the target is 1 μM for a peak/trough ratio of 10 and 10 μM for a peak/trough ratio of 100.
H2O2 crosses the PM through aquaporins. The maximal flux through a single aquaporin channel is on the order of 109 molecules channel−1 s−1 (Jensen and Mouritsen, 2006) while the number of channels per μm2 is on the order of 30 (Li et al., 2011). This gives a maximal flux per μm2 of 3 × 10¹⁰ molecules μm−2 s−1, or in units of moles: 5 × 10⁻¹⁴ mol μm−2s−1. If we assume that the aquaporins allow H2O2 and water molecules to pass with rates proportional to their respective concentrations and we further assume that the concentrations outside the PM are 100 mM for H2O2 (very high) and 55 M for water (standard), then the maximal flux of H2O2 over the cell membrane is 10−16 mol μm−2 s−1.
A prerequisite for attaining this maximal flux is that the concentration of H2O2 outside the membrane is much higher than the concentration inside, since the aquaporins are passive channels. This is, however, always the case in practice, since even if we let the channel stay completely open for 1 s, the concentration will maximally reach 4 mM inside the cell.
A signal is emitted at the PM by opening the aquaporins for a while. We first consider signals consisting of short pulses. All other types of signals can be constructed by adding short pulses and they are the type of signal, which allows the fastest frequency modulation. A short pulse is obtained by fast opening and closing of the channels in the membrane. For mathematical convenience this can be idealized to an instantaneous pulse where the channels are opened and closed infinitely fast and the flux over the membrane is infinite during this infinitesimal time-interval.
Increasing the time the channels stay open naturally increases the signal amplitude. At long times after emission, there is a simple proportionality between the time the channels stay open (and thus the total signal) and the concentration measured at the target; as with the different emission areas the curves describing the concentration all collapse to the same on curve (Figure 3), except for a scaling factor determined by the total amount of H2O2 emitted. That is, at sufficiently long times the curves become equal except for a scaling factor.
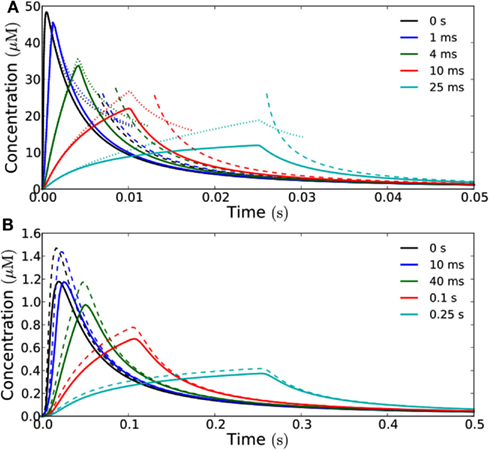
Figure 3. How opening time of the channels influence the signal received at the target. Concentration as a function of time measured at a distance of 1 μm (A) and 10 μm (B) from a square emission patch of size 10 μm × 10 μm in the open geometry. The curves have been rescaled such that they correspond to the same total signal, i.e., the flux is adjusted such that the total amount of H2O2 emitted is the same for the different opening times and equal to 10−19 mol μm−2. The time-interval in which the channels stay open is varied between 0 and 25 ms (A) and 0 and 0.25 s (B). Solid curves represent exact results for a 10 μm × 10 μm area obtained from Comsol simulations while dashed lines represent analytical results for a point source. (A) Dotted lines represent the analytical (1D) solution for an infinite source area. Note how the exact results agree well with the analytical solutions for an infinite source for short times, since we are so close to the source that it effectively feels infinite at this short time-scale. At long times the analytical solutions corresponding to emission from a point source agree well with the exact results and all the curves collapse on the same curve. The diffusion time tD of a signal emitted in an instantaneous pulse is equal to 1 ms. (B) At a distance of 10 μm from the source, the exact results are well approximated by the analytical solution for a point source emitter. The peak signal from a point source is slightly higher than from the 10 μm × 10 μm area since the initial point source signal is more concentrated. However, the curves are qualitatively similar and they all collapse to the same curve at long times as in (A). The diffusion time tD for an instantaneous pulse signal is here equal to 25 ms.
For times shortly after the emission of the signal, it is another story. Longer opening time flattens out the peak of the concentration, and the peak concentration, relative to the concentration measured at long times, is decreased. This in turn increases the refractory time.
When we consider a target that is 1 μm away, the signal can be considered a short pulse as long as the time during which the aquaporins stay open is approximately 1 ms or shorter, since its relative amplitude does not differ significantly from that of an instantaneous pulse (Figure 3A). The maximal amount of H2O2 that can be released in a single short pulse per unit area, i.e., the maximal amplitude of a short pulse signal, is then 10−19 mol μm−2. At a distance of 10 μm, the signal can be considered a short pulse, if the aquaporins stay open for approximately 10 ms or less (Figure 3B), i.e., the maximal amplitude of such a short pulse is 10−18 mol μm−2. Here, where the source-target distance (10 μm) is comparable to the dimensions of the source (10 μm × 10 μm), we also see that the signal received at the target is well approximated by the analytical solution for a point source (Figure 3B).
The size of the activated area on the PM, the area creating the synchronized signal, may vary depending on, e.g., what caused the signal. This gives different signals. We consider emission area sizes ranging from a single channel to 100 μm2: (i) a single channel, (ii) 1 μm × 1 μm (a small patch), and (iii) 10 μm × 10 μm (a large patch extending over a major fraction of one side of a plant cell).
Varying the area of the patch from where molecules are emitted, affects the total amplitude of the signal, if other parameters are kept constant (Figure 4). Furthermore, a larger emission area means slower decay, i.e., longer refractory time (Figures 5 and 6).
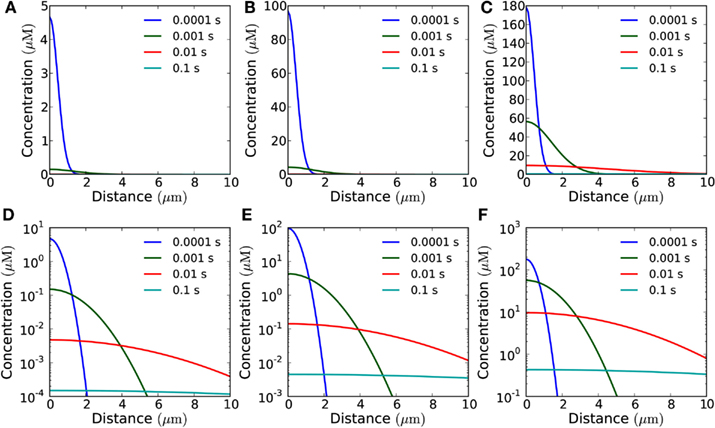
Figure 4. Concentration of H2O2 as a function of distance from the membrane in the open geometry. Snapshots of the concentration profile at different points in time after emission of a single pulse of 10−19 mol μm−2 from areas of varying size: (A) for a single channel; (B) for an area of 1 μm × 1 μm (containing 30 channels); (C) for an area of 10 μm × 10 μm (3,000 channels). (D–F) Same plots as in (A–C) shown with logarithmic y-axis.

Figure 5. Influence of the emission area on the measured signal at a target 1 μm from the source in the open geometry. Concentration of H2O2 as a function of time at a distance of 1 μm from the source after emission of a single pulse of 10−19 mol μm−2 from areas of varying size. The blue (red) lines mark 1/10th (1/100th) of the peak concentration and the time at which it is obtained. (A) for a single channel (signal: 3 × 10⁻²¹ mol) the refractory times are 1.9 and 9.6 ms depending on whether the peak/trough ratio is 10 or 100, respectively. (B) For a 1 μm × 1 μm area (30 channels, total signal: 10−19 mol), refractory times: 2.3 and 11 ms. (C) For a 10 μm × 10 μm area (3000 channels, total signal: 10−17 mol), refractory times: 19 and 100 ms. Note that the signal from a 1 μm × 1 μm area (B) and a point emitter (A) are almost identical when measured at a distance of 1 μm. This is also reflected in the refraction times.

Figure 6. Influence of the emission area on the measured signal at a target 10 μm from the source. Concentration of H2O2 as a function of time at a distance of 10 μm from the source after emission of a single instantaneous pulse of 10−18 mol μm−2 H2O2 from areas of varying size in the open geometry. The blue (red) lines mark 1/10th (1/100th) of the peak concentration and the time at which it is obtained. (A) For a single channel (signal: 3 × 10⁻²⁰ mol) the refractory times are 0.19 and 0.96 s depending on whether the peak/trough ratio is 10 or 100, respectively. (B) For a 1 μm × 1 μm area (total signal: 10−18 mol), refractory times: 0.19 and 0.96 s. (C) For a 10 μm × 10 μm area (total signal: 10−16 mol), refractory times: 0.22 and 1.1 s. The time after signal emission where the concentration has dropped to 1/10 and 1/100 of its maximal value, are marked by vertical lines. All the three curves look almost identical except for the scale factor, i.e., the signals in (B,C) are practically indistinguishable from that of a point source (A). Comparison of the refraction times in the three cases also shows this.
For a signal emitted by a single channel, it is clear that we would need a very high initial signal amplitude to be able to detect the signal, even as close as 1 μm away. If we assume that the resting concentration of H2O2 is 0.1 μM and that we can detect the signal at a concentration 10-fold higher than this, we need a signal twenty times larger than what a single channel can emit in a short pulse, to be able to detect the signal from a single channel at 1 μm from the source. Thus, in the following we will only consider emission from sources of size 1 μm × 1 μm and 10 μm × 10 μm.
The refractory time does not depend on the signal amplitude, but depends highly on distance from the source and emission patch size (Figures 5 and 6). Increasing the distance between the source and the target increases the refractory time and, additionally, drastically decreases the amplitude of the signal (Figures 5 and 6). In the open geometry the main obstacle to signaling is the difficulty of attaining a peak concentration at the target which is sufficiently high to be detected.
At a distance of 1 μm (Figure 5), emission of a pulse of 10−19 mol μm−2 from an area of 1 μm × 1 μm (total signal is 10−19 mol) creates a detectable signal with a refractory time of 2.3 ms for a peak/trough ratio of 10 (11 ms for a ratio of 100), indicating that in the open geometry frequencies of up to 500 Hz are feasible even without enzymatic degradation of H2O2. When the area is larger, 10 μm × 10 μm (total signal: 10−17 mol), the signal is considerably stronger, but the refractory time increases to 19 ms (100 ms for a peak/trough ratio of 100), indicating that here frequencies up to 50 Hz are possible.
With distance, the wave broadens, thereby increasing the refractory time. At a distance of 10 μm (Figure 6), only an emission from the largest area considered (10 μm × 10 μm) is detectable, even if the detection limit is as low as 1 μM. Here the refractory time is 0.22 s for a peak/trough ratio of 10 (1.1 s for a ratio of 100), indicating that signaling with frequencies up to 5 Hz is feasible.
In general, as long as the distance between the target and the source is greater than or equal to the dimensions of the area of emission, the signal is well approximated by the signal from a point source (compare Figures 5A,B and 6A–C) and the refractory times are given approximately by the analytical result for a point emitter (Eq. 11). In this case, for a source-target distance of 1 μm, the refractory times for the signal to reach 1/10th and 1/100th of its peak value for a point source are 1.9 and 9.6 ms respectively. For a source-target distance of 10 μm, the refractory times for a point source are 0.19 and 0.96 s.
Figure 7 shows what a train of short pulses emitted from a 10 μm × 10 μm area looks like at a distance of 10 μm from the source. At a low frequency, say 0.1 Hz, the H2O2 concentration has time to return to the resting level (Figure 7A), at 1 Hz, the level does not quite return to 1/100th of the peak value since the refractory time is 1.1 ms (Figure 7B), and at a frequency of 10 Hz there is a build-up of H2O2 and only a twofold difference between peak and trough, insufficient for the signal to be deciphered (Figure 7C).

Figure 7. Recorded signal at a distance of 10 μm from emitter of a train of pulses in the open geometry. The individual pulse amplitude is 10−18 mol μm−2 emitted from a 10 μm × 10 μm area (total individual signal: 10−16 mol). The blue (red) lines mark 1/10th (1/100th) of the peak concentration and the time at which it is obtained. (A) For an emission frequency of 0.1 Hz both a 10-fold and a 100-fold decrease of the signal is easily detected between emission of signals. (B) For an emission frequency of 1 Hz, a 100-fold difference is no longer obtained, the concentration only has time to decrease by a factor of 85 before the arrival of a new signal. (C) For an emission frequency of 10 Hz, only a maximal peak/bottom ratio of around two is seen at the target.
We have until now assumed that the cell is so large that there is no effect of cell walls on the distribution of H2O2, except from the wall through which it enters the cell. In reality, and especially when we look at repeated pulses and other cases of continuous signaling, H2O2 will build-up in the cytosol and thereby prevent further signaling, unless it is removed.
We consider a closed geometry in which the signal is emitted from the whole end-wall of the cell, e.g., an area of 10 μm × 20 μm. This is the most restricted geometry that one can imagine, i.e., it complements the open geometry treated above and thereby delimits the range of possible phenomena. This is the geometry in which one can have the highest signal amplitudes, but on the other hand also the longest refractory times.
If no H2O2 is removed or degraded, signaling over 10 μm is not possible since the cell fills up with H2O2 and the concentration settles at a constant value throughout the cell of approximately 20% of as measured at 10 μm from the source. However, there are several mechanisms by which H2O2 can be removed – transport out of the cell or into organelles, chemical reactions, and enzymatic reactions. We cannot evaluate the magnitude of the former two and if transport out of the cell is passive it will counter the effect of the cell walls to some extent, i.e., the system will be described by the open geometry or some intermediary between the closed and open geometries. So here we will let H2O2 removal consist entirely of enzymatic degradation to analyze how H2O2 removal affects signaling. The cytosol contains several enzymes capable of removing hydrogen peroxide, e.g., ascorbate peroxidase. When we include removal of H2O2 by Michaelis–Menten kinetics in the model, we see that signaling over 10 μm becomes possible at frequencies up to 2.5 Hz (for a peak/trough ratio of 10) when the removal rate is 100 μM s−1 (Figures 8D and 9A). At a much lower removal rate (1 μM s−1) only signaling at rates up to 0.06 Hz is possible (for a peak/trough ratio of 10, 0.01 Hz for a ratio of 100, Figure 8C). Since the diffusion of H2O2 is fast on intracellular length scales, degradation does not affect the maximal concentration of H2O2 much (Figure 8), though it significantly decreases the refractory time. At an intermediate removal rate (10 μM s−1), similar to the one reported by Bonifacio et al. (2011) signaling at 0.2 Hz is possible (Figures 9B,C). In all cases peak concentrations of 50 μM at the target can be reached.
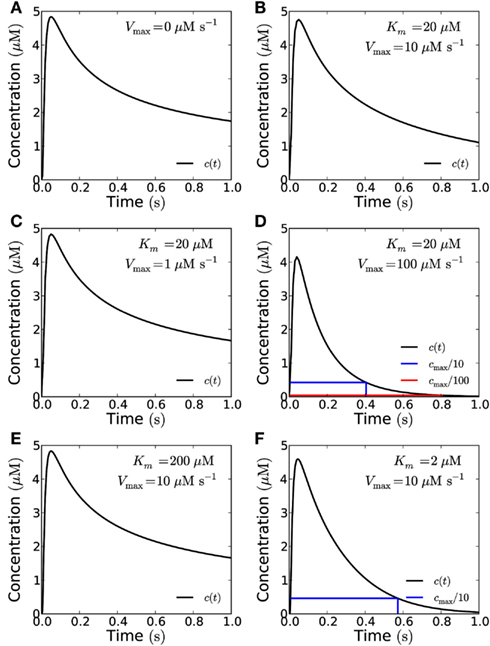
Figure 8. The effect of enzymatic degradation of H2O2 on a short pulse signal. The signal is recorded at a distance of 10 μm from the source in the closed geometry. Enzymatic degradation of H2O2 reduces the refractory time, but does not significantly reduce the peak concentration. A signal of amplitude 10−19 mol μm−2 is emitted from the whole end-wall (10 μm × 20 μm area, total signal: 2 × 10⁻¹⁷ mol) of a 100 μm long cell and measured at a distance of 10 μm. H2O2 is reflected by the sides of the cell. (A) No degradation. (B) For degradation with Vmax = 10 μM s−1 and Km = 20 μM. (C) Vmax = 1 μM s−1 and Km = 20 μM. (D) Vmax = 100 μM s−1 and Km = 20 μM. Here the refraction times are 0.4 s and 0.8 for 1/10th (blue lines) and 1/100th (red lines) of the peak concentration cmax. (E) For Km = 200 μM and Vmax = 10 μM s−1. (F) Km = 2 μM and Vmax = 10 μM s−1. Here the refraction time to reach 1/10th of the peak concentration is 0.57 s. The effect of lowering (raising) Km is qualitatively equivalent to the effect of raising (lowering) Vmax.
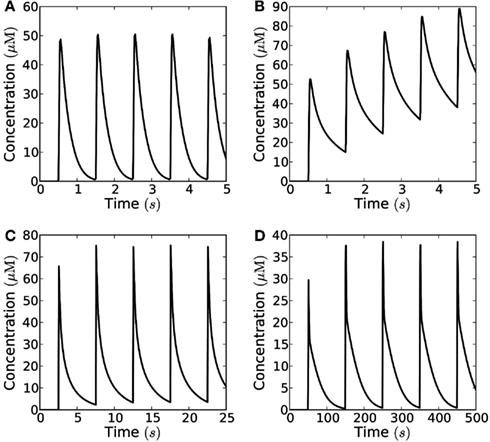
Figure 9. Frequency-modulated signals consisting of short pulses. The range of frequencies at which signaling is possible in the closed geometry, depends strongly on the maximal degradation rate of H2O2. Concentration measured at 10 μm distance from an area of 10 μm × 10 μm, which emits short pulses; the signaling molecules are enzymatically degraded in a reaction with Km = 20 μM and Vmax = 1−100 μM s−1, the amount of H2O2 released by each pulse is N0 = 10−18 mol μm−2. (A) For fast degradation (Vmax = 100 μM s−1) high frequency (f = 1 Hz) and high amplitude signaling is possible; (B) for an intermediate degradation rate (Vmax = 10 μM s−1) signaling is not possible at the highest frequencies (i.e., f = 1 Hz), since the signal’s refractory time is too long; (C) at frequencies lower than 0.2 Hz signaling is possible for Vmax = 10 μM s−1; (D) For slow degradation (Vmax = 1 μM s−1) only low frequency signaling is possible (f = 0.01 Hz).
The Michaelis constant Km may change as well, i.e., due to molecular crowding (see Effect of Molecular Crowding). We have considered a ten-fold increase or decrease in Km (i.e., to 200 or 2 μM) and see that the effect of an increase in Km is qualitatively the same as the effect of a corresponding decrease of Vmax and vice versa (Figures 8E,F).
Frequencies, amplitudes, and background H2O2 concentrations, which make signaling possible are listed in Tables 3 and 4.
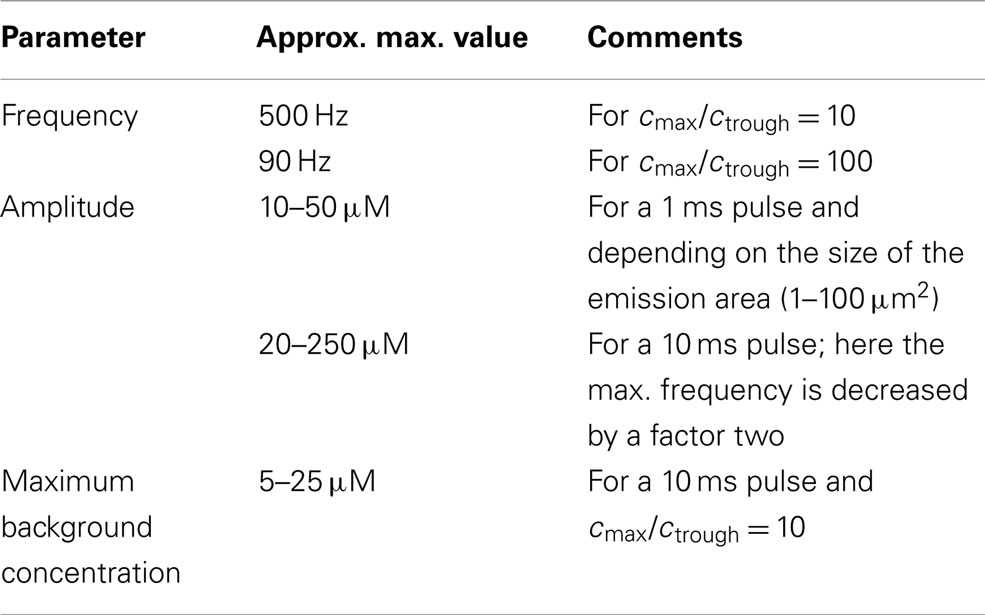
Table 3. Possible parameter values for signaling over a distance of 1 μm using short pulses (open geometry).
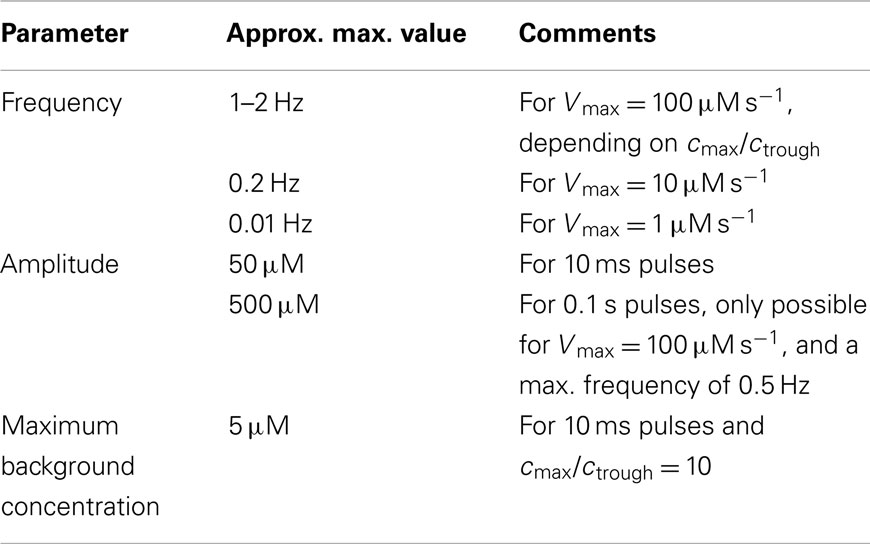
Table 4. Possible parameter values for signaling over a distance of 10 μm using short pulses (closed geometry).
Thanks to the late French physicist Joseph Fourier (the inventor of Fourier analysis), we know that any signal can be constructed as a sum of harmonic functions, i.e., sines and cosines. This type of signal is complimentary to the short pulse, since it is regulated gradually, whereas the short pulse is regulated by an abrupt open/close mechanism. The manner in which such a signal propagates thus gives us a new angle on the problem of signal transmission. This angle is the natural one to use in an investigation of the propagation of pulse trains, because a harmonic signal is the simplest possible periodic pulse train as seen from a mathematical point of view, and because more complicated pulse trains can be viewed as super-positions of these simple ones for analytical purposes. That is the essence of Fourier analysis. Add to this that harmonic signals are the carrier waves for signals encoded by frequency modulation.
While the non-linear kinetics of the Michaelis–Menten degradation term prevents us from solving the kinetic equation using Fourier analysis, that analysis still applies to the emitted signal. It is the interactions of different Fourier components of the propagating signal in the degradation term that bars Fourier analysis.
Figure 10 shows what a signal with a harmonic source looks like throughout the cell at different points in the emission cycle, i.e., snapshots of the concentration profile at different points in time. No spatial wave-like pattern is seen. This is a signature feature of diffusive transport in a non-excitable medium. This is because signal propagation is only driven by concentration gradients and the concentration of signaling molecules thus always will be highest at the source. The wave-pattern is only seen in the time-domain, e.g., when we follow the concentration in a single point over time (Figure 11). To see spatial wave-patterns in diffusion-mediated signaling a non-linear, excitable medium is required.
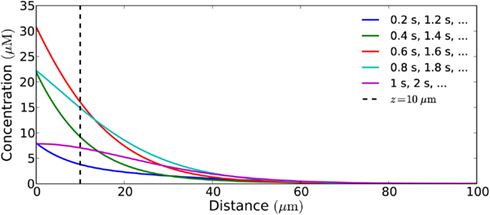
Figure 10. Snapshots of the concentration profile in a cell of length 100 μm (closed geometry) of a signal from a harmonically (sinusoidal) emitting source, taken at different times in the emission cycle. No wave-like pattern is seen. This is a signature feature of signal propagation by diffusion. The wave is only in the time-domain and can be seen if one continuously monitors the concentration of H2O2 at a given distance, e.g., at 10 μm from the source. The period of the flux is 1 Hz, its amplitude is 10−18 mol μm−2s−1, and Vmax is 100 μM s−1.
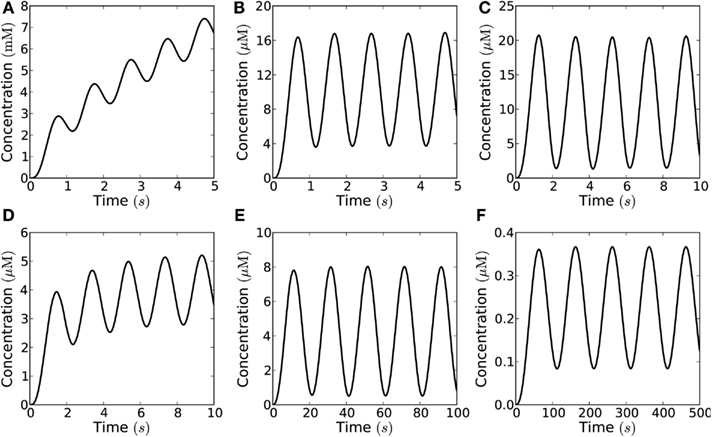
Figure 11. Harmonically oscillating signals in theory allows much higher signaling amplitude than short pulses. However, in practice the amplitude needs to be limited to allow signaling at relevant frequencies, thus harmonic signals actually allow a lower signaling amplitude than short pulses at similar frequencies. Concentration measured at a distance of 10 μm from the emission area of 10 μm × 10 μm in the closed geometry, which emits a harmonic (sinusoidal) flux with amplitude j0 and frequency f = 1−0.01 Hz; the signaling molecules are enzymatically degraded in a reaction with Km = 20 μM and Vmax = 1−100 μM s−1. (A) Even for maximal degradation rate (Vmax = 100 μM s−1) the maximal flux of 10−16 mol μm−2s−1 is so high that the concentration of molecules build-up over time and no signaling is possible; (B) for a lower flux of 10−18 mol μm−2s−1 the concentration no longer builds up over time, but fast signaling is still not possible (f = 1 Hz) due to the long refractory time; (C) for a lower frequency (f = 0.5 Hz) signaling is possible (with cmax/ctrough = 10); (D) if the degradation rate is lower (Vmax = 10 μM s−1) signaling at 0.5 Hz is no longer possible; (E) the frequency must be lowered accordingly to allow signaling (f = 0.05 Hz); (F) for a degradation rate of 1 μM s−1 no signaling is possible, even with the lowest relevant frequencies (f = 0.01 Hz) and at very low amplitude (j0 = 10−21 mol μm−2s−1).
Though harmonic signals in theory allow much higher signaling amplitudes, they are limited by the refractory time, and the possible peak concentrations are lower for harmonic signals than for short pulse at similar frequencies (Figure 11; Table 5). Figures 12A,B shows possible signaling frequencies as a function of Vmax for signaling using short pulses (Figure 12A) and a harmonically oscillating flux (Figure 12B).
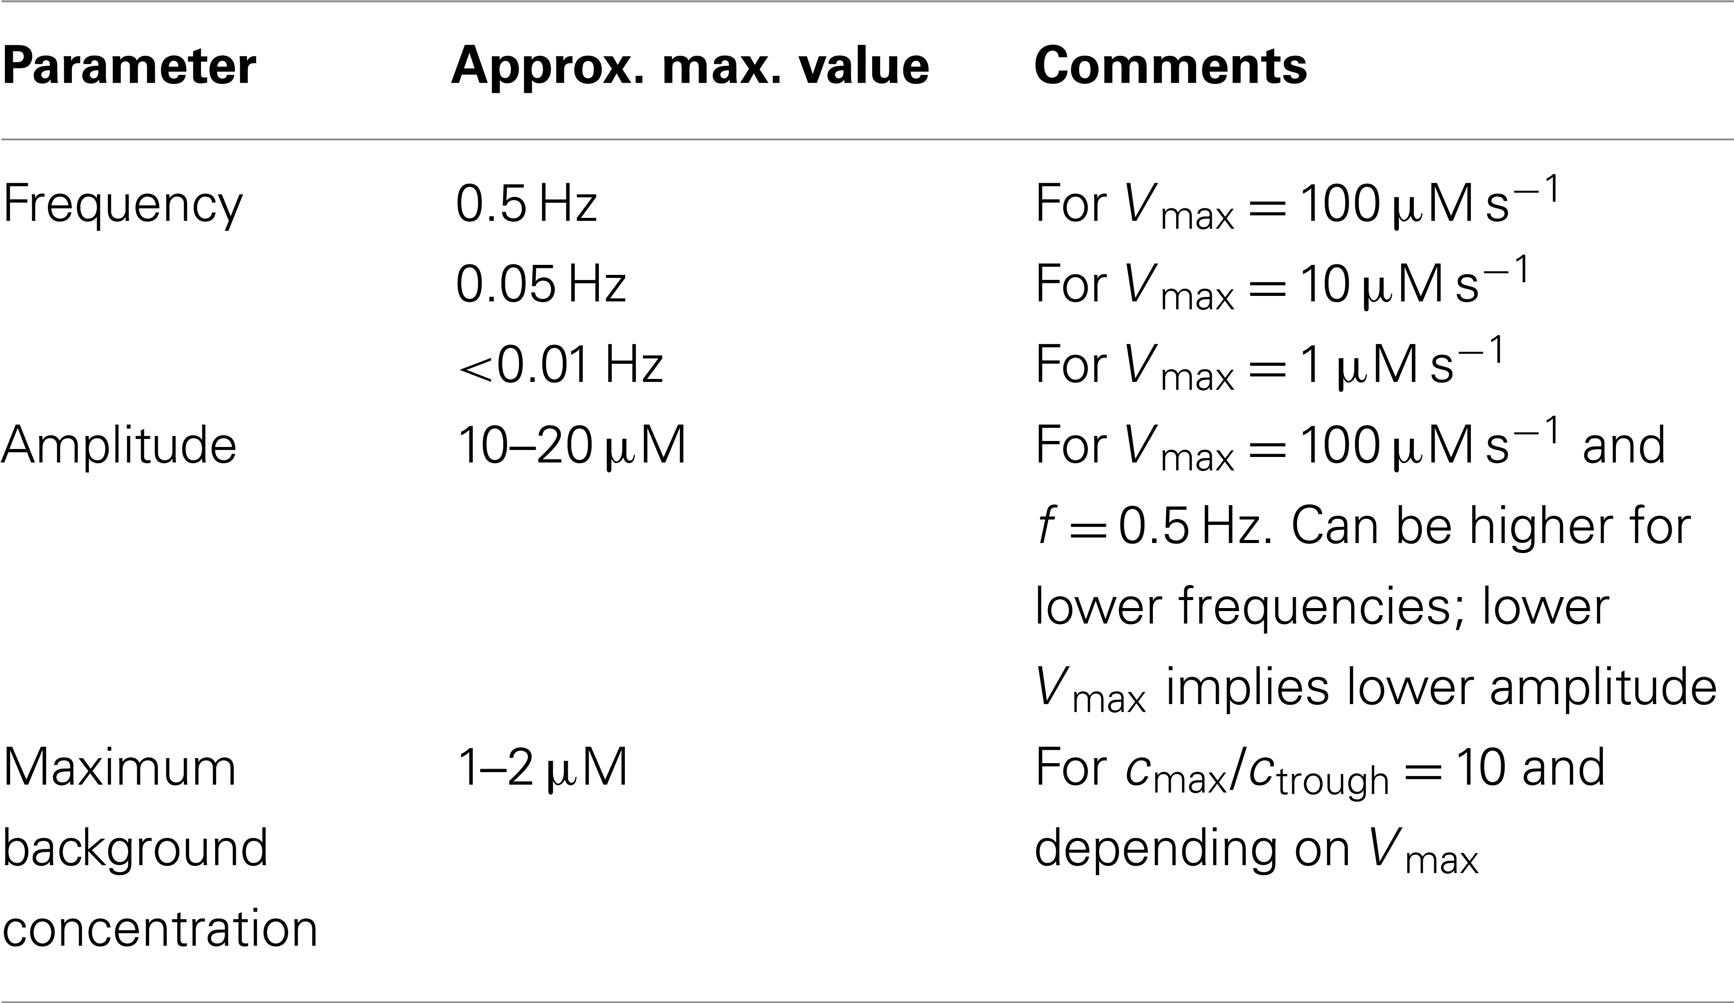
Table 5. Possible parameter values for signaling over a distance of 10 μm using harmonic signals (closed geometry).
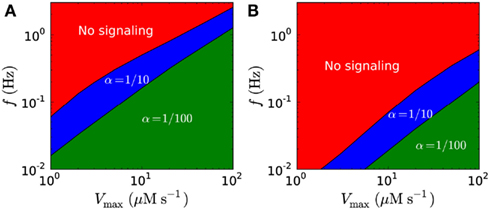
Figure 12. Possible signaling frequencies f in the closed geometry as a function of Vmax. Shown for trough/peak ratios of α = 1/10 (blue) and α = 1/100 (green). (A) Possible frequencies for short pulse signaling. (B) Possible frequencies for harmonic signaling. Higher frequencies are obtainable for short pulse signaling than for harmonic signaling. In both (A,B), the signal detection threshold is 1 μM for α = 1/10 and 10 μM for α = 1/100, and Km is 20 μM.
Molecular crowding effectively lowers the diffusion coefficient of a molecular species in the cytosol compared to its value in water. For calcium ions in animal cells, this effect is of the order of 20–50% (Straube and Ridgway, 2009). We have assumed a similar effect on the diffusion coefficient of H2O2 in plant cells, lowering the diffusion coefficient of H2O2 from 1,700 μm2 s−1 (van Stroe-Biezen et al., 1993) to 1,000 μm2 s−1. Excluding the effect of degradation, a twofold increase of the diffusion coefficient will simply decrease the characteristic diffusion time and refractory times by a factor two, but will not influence signal amplitudes; an increase of the diffusion coefficient diminishes the influence of degradation, since it reduces the time-scale of signaling.
Molecular crowding may also affect the binding rates and rates of catalysis of enzymes and thus change Km and Vmax (Zhou et al., 2008). A change of the rate of catalysis changes both Km and Vmax in the same direction, which means that these two effects largely cancel each other in this case (Figure 8). A change in the association rate between signaling molecules and the degradation enzymes only affects Km and will thus to a larger extent affect reaction kinetics. The effect of crowding varies highly for different enzymes (Norris and Malys, 2011) and is unknown for enzymes degrading H2O2 in plant cells. So we have considered a wide range of possible values for Km (2–200 μM, Figure 8).
Finally, we have investigated what effect cytoplasmic streaming may have on signaling. We have considered a roughly cylindrical cytoplasmic stream in between the source and the target (Figure 2A). A simple order-of-magnitude argument showed that the influence of the stream is negligible if the Péclet number is on the order of one or smaller. Here the Péclet number is defined as the ratio between the stream’s width times the stream velocity and the diffusion coefficient. Considering the maximal stream speed reported in the literature, v = 100 μm (Goldstein et al., 2008; Table 2), and considering a stream which is as wide as the largest distance between the source and the target, 10 μm, we get a Péclet number of one. This means that even in this extreme case, cytoplasmic streaming does not significantly disturb signaling.
Thus, cytoplasmic streaming does not hinder intracellular signaling by diffusion, since the diffusion coefficient is so large compared to typical values of the cytoplasmic stream width and speed (Table 2). On the contrary, it lowers the refractory time, because the stream has a stronger delaying effect on the signal molecules that arrive late at the target than it has on the early arrivers, due to the former spending more time in the stream than the latter. The net effect is a sharper profile of concentration plotted against time, similar to the situation in which signal molecules are degraded.
Our modeling shows that diffusion-mediated frequency- and amplitude-modulated signaling with H2O2 over distances of up to 10 μm is possible if we assume that the detection limit is low (on the order of 1 μM), the synchronized emission area is large (Figures 6 and 8), the flux over the membrane is high, and the removal rate is high (Figures 8 and 9). Under these conditions, signaling with a frequency of up to 2 Hz at 10 μm is possible with amplitudes up to 50 μM (Figures 8, 9, and 12A; Table 4).
The effect of enzymatic degradation of H2O2 is the opposite of what was proposed by Møller and Sweetlove (2010). Instead of making signaling difficult, a high rate of H2O2 degradation is actually a prerequisite for signaling as it reduces the refractory time (Figures 7–9 and 11). Other possible removal mechanisms are uptake into organelles and/or transport out of the cell, neither of which has been described for plant cells and both of which have the same overall effect as degradation, in as much as they would reduce the refractory time. The rate of H2O2 removal is a parameter that the plant cell may modulate to accommodate a wider range of signaling frequencies.
Also contrary to what was proposed by Møller and Sweetlove (2010), cytoplasmic streaming does not distort the H2O2 signal too much, because cytoplasmic stream speeds are slow compared to diffusion over the short cellular distances that are relevant.
The maximal amount of H2O2 emitted in a pulse at the PM depends on the density of aquaporins able to transport H2O2 as well as on the flux per channel in the opened state. The density of aquaporins has been estimated to be 30 molecules per μm2 (Li et al., 2011) and the flux per channel is assumed to be 109 molecules s−1 (Jensen and Mouritsen, 2006). The channel density in the PM is probably a parameter that the plant needs to be able to regulate in response to long-term changes in the water supply. The question is how many of the molecules passing through the aquaporins are H2O2 and how many are water. We assumed no selectivity, but there could be some, which would alter the maximal possible flux. We assumed an external concentration of 100 mM H2O2 and that could well be an overestimate. We also assumed that all the aquaporins in the PM can transport H2O2, which is probably not the case (Bienert et al., 2007; Maurel et al., 2009). Thus, it is possible that the maximum flux possible across the PM turns out to be a limiting factor for H2O2 signaling by diffusion.
Opening times for the synchronized channels down to 1 ms were considered and were required for emission of short pulses over a distance of 1 μm (Figure 3A). Since opening of aquaporins is regulated by reversible phosphorylation/dephosphorylation, this would require that the protein kinase and phosphatase involved can complete their work in considerably less than 1 ms. We do not know whether this is possible.
An alternative to signaling by short pulses is H2O2 signals that resemble harmonic oscillations, which allow for longer opening/closing times for the PM aquaporins that produce these signals. However, in order to produce an harmonic oscillation, it is required that channel closing starts just as the maximal opening state has been achieved, and that may be more difficult to imagine in terms of enzyme kinetics. In this connection, it is interesting that a theoretical study has shown that aquaporin opening may also be voltage gated (Hub et al., 2010). Furthermore, while harmonically oscillating signals are able to create higher signal amplitudes since the channels stay open longer than for short pulse signaling (Figure 11) they have longer refraction times and only allow for signaling at much lower frequencies (Figures 11 and 12B).
The concentration of H2O2 in plant tissues has been reported to be in the micromolar to low millimolar range and usually higher under stress conditions, assuming an even distribution in all cells and cell parts including the vacuole (Halliwell and Gutteridge, 2007; Møller et al., 2007; and references therein). However, the observation that the ROS probe CM-H2DCFDA [(5-(and-6) chloromethyl-2’,7’ dichlorodihydrofluorescein diacetate] does not give a signal in the vacuole (Bienert et al., 2007) may indicate that the vacuole contains little H2O2, which in turn indicates that the concentration in the rest of the cell, where signaling occurs, is even higher. We assume that the vast majority of this H2O2 is free (not bound), i.e., we assume the opposite of what is the case for Ca2+ for which the concentration of free cytosolic ions is three orders of magnitude lower than the total tissue content, due mainly to binding and sequestering inside organelles (e.g., Jafri and Keizer, 1995).
If H2O2 signaling via diffusion with resting levels below 1 μM is a general phenomenon, the waves would indeed have to contain very high peak concentrations in order to give a tissue average hundreds or thousands of times above the resting level. As we have demonstrated, that is very likely not the case, unless relaying stations exist. At higher resting levels in the cytosol for H2O2, the flux across the PM would become limiting and so would enzymatic degradation. In other words, the relatively high average levels of H2O2 observed to be present in plant tissues makes it highly improbable that information is transmitted via diffusing H2O2, unless relaying stations exist in the cytoplasm.
The tissue concentrations of H2O2 referred to above are, of course, averages and probably differ considerably between cell types. If we take a C3 leaf in the light, the photosynthetically active cells, such as the palisade cells, would have a massive turnover of ROS in the chloroplasts and in the peroxisomes as a result of photorespiration (Foyer and Noctor, 2003) and probably a relatively high cytosolic ROS concentration. In contrast, the leaf epidermal cells, which in many species contain no chloroplasts, would be expected to have a ROS concentration much lower than the average for the leaf. The epidermal cells are also often the first cells to confront invading pathogens, where ROS production is an early response, so it may be significant that it is also in these cells that the transmission of information from the PM by ROS diffusion would be more likely to take place because of a lower background concentration of H2O2.
It is a common observation that the cellular ROS production increases in plants in response to stress (Apel and Hirt, 2004). In non-photosynthetic cells, the presence of the mitochondrial alternative oxidase in the mitochondria is very important for keeping the cellular ROS level low, probably because it lowers the reduction level of the electron transport components that are responsible for mitochondrial ROS production (Maxwell et al., 1999; Møller, 2001). Consistent with this, the alternative oxidase is often induced by stress treatments (Gadjev et al., 2006) presumably to prevent the rise in ROS levels. It follows that ROS signaling is likely to occur in unstressed non-photosynthetic cells.
Relaying stations, such as the endoplasmic reticulum and the vacuole (Berridge, 1993; McAinsh and Hetherington, 1998; Stael et al., 2012), make up an important component in Ca2+signaling, but none has been identified for hydrogen peroxide in plant cells. In animal cells, mitochondria are possible relaying stations (Zhou et al., 2010) for superoxide signaling, which may or may not work for plant mitochondria, given that the properties essential for the mechanism are not well described for plant mitochondria (Møller, 2001; Reape and McCabe, 2008).
In plant cells, mitochondria, peroxisomes, and plastids are potential relaying stations for H2O2 signaling, as they are known to produce ROS (Møller, 2001; Foyer and Noctor, 2003; Apel and Hirt, 2004). In fact, recently it was observed that the membrane potential of individual mitochondria oscillates in vivo as well as in vitro with pulse intervals of 5–50 s (i.e., frequencies of 0.02–0.2 Hz) and that this oscillation was affected by the redox state of the mitochondria (Schwarzländer et al., 2012). This could be an indication of a signaling network possibly involving ROS.
Even if H2O2 signaling by frequency- and amplitude-modulated waves occurs, we have little idea of how these signals are decoded. H2O2 is able to regulate genes as demonstrated in bacteria. A general trend in this regulation is that it involves the oxidation of a transcription factor thereby affecting its DNA-binding affinity (Lee and Helmann, 2006; Imlay, 2008). Whether such a system can decode a frequency- or amplitude-modulated signal is not known.
The authors declare that the research was conducted in the absence of any commercial or financial relationships that could be construed as a potential conflict of interest.
This study was supported by grant 10-085228 from the Danish Council for Independent Research – Natural Sciences to Ian Max Møller.
Alberts, B., Bray, D., Lewis, J., Raff, M., Roberts, K., and Watson, J. D. (1994). Molecular Biology of the Cell, 3rd Edn. New York, NY: Garland, 743–744.
Apel, K., and Hirt, H. (2004). Reactive oxygen species: metabolism, oxidative stress, and signal transduction. Annu. Rev. Plant Biol. 55, 373–399.
Bienert, G. P., Møller, A. L. B., Kristiansen, K. A., Schulz, A., Møller, I. M., Schjoerring, J. K., et al. (2007). Specific aquaporins facilitate the diffusion of hydrogen peroxide across membranes. J. Biol. Chem. 282, 1183–1192.
Bonifacio, A., Martins, M. O., Ribeiro, C. W., Fontenele, A. V., Carvalho, F. E. L., Margis-Pinheiro, M., et al. (2011). Role of peroxidases in the compensation of cytosolic peroxidase known down in rice plants under abiotic stress. Plant Cell Environ. 34, 1705–1722.
Dargan, S. L., and Parker, I. (2003). Buffer kinetics shape the spatiotemporal patterns of IP3-evoked Ca2+ signals. J. Physiol. 553.3, 775–788.
Foyer, C. H., and Noctor, G. (2003). Redox sensing and signaling associated with reactive oxygen in chloroplasts, peroxisomes and mitochondria. Physiol. Plant. 119, 355–364.
Gadjev, I., Vanderauwera, S., Gechev, T. S., Laloi, C., Minkov, I. N., Shulaev, V., et al. (2006). Transcriptomic footprints disclose specificity of reactive oxygen species signaling in Arabidopsis. Plant Physiol. 141, 436–445.
Goldstein, R. E., Tuval, I., and van de Meent, J.-W. (2008). Microfluidics of cytoplasmic streaming and its implications for intracellular transport. Proc. Natl. Acad. Sci. U.S.A. 105, 3663–3667.
Halliwell, B., and Gutteridge, J. M. C. (2007). Free Radicals in Biology and Medicine. Oxford: Oxford University Press.
Hub, J. S., Aponte-Santamaría, C., Grubmüller, H., and de Groot, B. L. (2010). Voltage-regulated water flux through aquaporin channels in silico. Biophys. J. 99, L97–L99.
Imlay, J. A. (2008). Cellular defenses against superoxide and hydrogen peroxide. Annu. Rev. Biochem. 77, 755–776.
Jafri, M. S., and Keizer, J. (1995). On the roles of Ca2+ diffusion, Ca2+ buffers, and the endoplasmic reticulum in IP3-induced Ca2+ waves. Biophys. J. 69, 2139–2153.
Jensen, M. Ø., and Mouritsen, O. G. (2006). Single-channel water permeabilities of Escherichia coli aquaporins AqpZ and GlpF. Biophys. J. 90, 2270–2284.
Kristiansen, K. A., Jensen, P.-E., Møller, I. M., and Schulz, A. (2009). Technical focus: monitoring reactive oxygen species formation and localization in living cells by use of the fluorescent probe CM-H2DCFDA and confocal laser microscopy. Physiol. Plant. 136, 369–384.
Lee, J. W., and Helmann, J. D. (2006). The PerR transcription factor senses H2O2 by metal-catalysed histidine oxidation. Nature 440, 363–367.
Li, X., Wang, X., Yang, Y., Li, R., He, Q., Fang, X., et al. (2011). Single-molecule analysis of PIP2; 1 dynamics and partitioning reveals multiple modes of Arabidopsis plasma membrane aquaporin regulation. Plant Cell 23, 3780–3797.
Maurel, C., Sontoni, V., Luu, D.-T., Wudick, M. M., and Verdoucq, L. (2009). The cellular dynamics of plant aquaporin expression and functions. Curr. Opin. Plant Biol. 12, 690–698.
Maxwell, D. P., Wang, Y., and McIntosh, L. (1999). The alternative oxidase lowers mitochondrial reactive oxygen production in plant cells. Proc. Natl. Acad. Sci. U.S.A. 96, 8271–8276.
McAinsh, M. R., and Hetherington, A. M. (1998). Encoding specificity in Ca2+ signaling systems. Trends Plant Sci. 3, 32–36.
Mironova, L. A., and Mironov, S. L. (2008). Approximate analytical time-dependent solutions to describe large-amplitude local calcium transients in the presence of buffers. Biophys. J. 94, 349–358.
Mittler, R., Vanderauwera, S., Suzuki, N., Miller, G., Tognetti, V. B., Vandepoele, K., et al. (2011). ROS signaling – the new wave. Trends Plant Sci. 16, 300–309.
Møller, I. M. (2001). Plant mitochondria and oxidative stress. Electron transport, NADPH turnover and metabolism of reactive oxygen species. Annu. Rev. Plant Physiol. Plant Mol. Biol. 52, 561–591.
Møller, I. M., Jensen, P. E., and Hansson, A. (2007). Oxidative modifications to cellular components in plants. Annu. Rev. Plant Biol. 58, 459–481.
Møller, I. M., and Sweetlove, L. J. (2010). ROS signaling – specificity is required. Trends Plant Sci. 15, 370–374.
Neill, S., Desikan, R., and Hancock, J. (2002). Hydrogen peroxide signaling. Curr. Opin. Plant Biol. 5, 388–395.
Norris, M. G. S., and Malys, N. (2011). What is the true enzyme kinetics in the biological system? An investigation of macromolecular crowding effect upon enzyme kinetics of glucose-6-phosphate dehydrogenase. Biochem. Biophys. Res. Commun. 405, 388–392.
Raven, E. L. (2003). Understanding functional diversity and substrate specificity in haem peroxidases: what can we learn from ascorbate peroxidase? Nat. Prod. Rep. 20, 367–381.
Reape, T. J., and McCabe, P. F. (2008). Apoptotic-like programmed cell death in plants. New Phytol. 180, 13–26.
Schwarzländer, M., Logan, D. C., Johnston, I. G., Jones, N. S., Meyer, A. J., Fricker, M. D., et al. (2012). Pulsing of membrane potential in individual mitochondria: a stress-induced mechanism to regulate respiratory bioenergetics in Arabidopsis. Plant Cell 24, 1188–1201.
Stael, S., Wurzinger, B., Mair, A., Mehlmer, N., Vothknecht, U. C., and Teige, M. (2012). Plant organellar calcium signaling: an emerging field. J. Exp. Bot. 63, 1525–1542.
Straube, R., and Ridgway, D. (2009). Investigating the effects of molecular crowding on Ca2+ diffusion using a particle-based simulation model. Chaos 19, 037110.
van Stroe-Biezen, S. A. M., Everaerts, F. M., Janssen, L. J. J., and Tacken, R. A. (1993). Diffusion coefficients of oxygen, hydrogen peroxide and glucose in a hydrogel. Anal. Chim. Acta 273, 553–560.
Zhou, H., Rivas, G., and Minton, A. P. (2008). Macromolecular crowding and confinement: biochemical, biophysical, and potential physiological consequences. Annu. Rev. Biophys. 37, 375–397.
Keywords: diffusion, hydrogen peroxide, modeling, intracellular signaling, waves
Citation: Vestergaard CL, Flyvbjerg H and Møller IM (2012) Intracellular signaling by diffusion: can waves of hydrogen peroxide transmit intracellular information in plant cells? Front. Plant Sci. 3:295. doi: 10.3389/fpls.2012.00295
Received: 18 September 2012; Accepted: 10 December 2012;
Published online: 31 December 2012.
Edited by:
Tatjana Kleine, Ludwig-Maximilians-Universität München, GermanyReviewed by:
Eva Hideg, University of Pecs, HungaryCopyright: © 2012 Vestergaard, Flyvbjerg and Møller. This is an open-access article distributed under the terms of the Creative Commons Attribution License, which permits use, distribution and reproduction in other forums, provided the original authors and source are credited and subject to any copyright notices concerning any third-party graphics etc.
*Correspondence: Ian Max Møller, Department of Molecular Biology and Genetics, Science and Technology, Aarhus University, Forsøgsvej 1, DK-4200 Slagelse, Denmark. e-mail:aWFuLm1heC5tb2xsZXJAYWdyc2NpLmRr
Disclaimer: All claims expressed in this article are solely those of the authors and do not necessarily represent those of their affiliated organizations, or those of the publisher, the editors and the reviewers. Any product that may be evaluated in this article or claim that may be made by its manufacturer is not guaranteed or endorsed by the publisher.
Research integrity at Frontiers

Learn more about the work of our research integrity team to safeguard the quality of each article we publish.