- Institute of Vegetables and Flowers, Chinese Academy of Agricultural Sciences, Beijing, China
Chromosomal synteny analysis is important in genome comparison to reveal genomic evolution of related species. Shared synteny describes genomic fragments from different species that originated from an identical ancestor. Syntenic genes are orthologs located in these syntenic fragments, so they often share similar functions. Syntenic gene analysis is very important in Brassicaceae species to share gene annotations and investigate genome evolution. Here we designed and developed a direct and efficient tool, SynOrths, to identify pairwise syntenic genes between genomes of Brassicaceae species. SynOrths determines whether two genes are a conserved syntenic pair based not only on their sequence similarity, but also by the support of homologous flanking genes. Syntenic genes between Arabidopsis thaliana and Brassica rapa, Arabidopsis lyrata and B. rapa, and Thellungiella parvula and B. rapa were then identified using SynOrths. The occurrence of genome triplication in B. rapa was clearly observed, many genes that were evenly distributed in the genomes of A. thaliana, A. lyrata, and T. parvula had three syntenic copies in B. rapa. Additionally, there were many B. rapa genes that had no syntenic orthologs in A. thaliana, but some of these had syntenic orthologs in A. lyrata or T. parvula. Only 5,851 genes in B. rapa had no syntenic counterparts in any of the other three species. These 5,851 genes could have originated after B. rapa diverged from these species. A tool for syntenic gene analysis between species of Brassicaceae was developed, SynOrths, which could be used to accurately identify syntenic genes in differentiated but closely-related genomes. With this tool, we identified syntenic gene sets between B. rapa and each of A. thaliana, A. lyrata, T. parvula. Syntenic gene analysis is important for not only the gene annotation of newly sequenced Brassicaceae genomes by bridging them to model plant A. thaliana, but also the study of genome evolution in these species.
Introduction
The genomes of species from Brassicaceae are composed of 24 basic genomic blocks, A–X (24 GBs, also called the ancestral karyotypes, AK) (Schranz et al., 2006), as detected by studies using comparative chromosomal painting (CCP) (Mandakova and Lysak, 2008), and also directly observed in Arabidopsis thaliana (Initiative, 2000), and the newly sequenced genomes of Arabidopsis lyrata (Hu et al., 2011), Brassica rapa (Wang et al., 2011), and Thellungiella parvula (Dassanayake et al., 2011). Brassicaceae genomes have experienced different levels of genomic reshuffling, fragmentation, deletion, segmental or whole genome duplication (Schranz et al., 2006; Mandakova and Lysak, 2008). Along with drastic genome changes, gene contents have also rapidly evolved (Cheng et al., 2012; Tang et al., 2012). However, as they share a common AK, the chromosomal synteny relationship among these genomes is considered to be well preserved despite the long time for evolution following the divergence of these species (Tang et al., 2008; Cheng et al., 2012).
Chromosomal synteny analysis is important in genome comparison to reveal the genomic evolution of related species (Tang et al., 2008). Shared synteny describes genomic fragments from different species that originated from a certain common ancestor (Lyons et al., 2008). Syntenic genes are orthologs located in these syntenic fragments, so they often share similar functions, and we can be highly confident when sharing their functional annotation information.
Determining syntenic genes and genomic regions among closely related species is important to both gene and genome studies (Lyons et al., 2008). On one hand, with a well-defined synteny relationship, we can share gene annotation information between well-studied genomes (such as the model species A. thaliana) and newly annotated genomes (such as B. rapa), and investigate the syntenic gene's differentiation after the species' divergence. On the other hand, syntenic fragments shared among genomes of different species offer us a chance to deduce the evolutionary processes of related species, or could even provide clues to the mechanisms behind these processes.
Three plant species, B. rapa, B. juncea, and B. oleracea, (also called genomes A, B, and C) and their allopolyploidies form the famous U's triangle (U, 1935). Many of these are important vegetable or oil crop species, and the sequencing of more genomes from these species is being planned. The A genome sequence of B. rapa has been released (Wang et al., 2011), and compared to three other sequenced species from Brassicaceae (A. thaliana, A. lyrata, and T. parvula), B. rapa has experienced an extra genome triplication event after their divergence (Wang et al., 2011; Cheng et al., 2012).
To share gene annotations between B. rapa and the other annotated genomes specially for A. thaliana and dig for clues of the B. rapa genome evolution, we developed a tool, SynOrths, which is well suited for detecting syntenic orthologs between closely related species, and applied it to the synteny analysis between B. rapa and other sequenced genomes from Brassicaceae: the model plant A. thaliana, A. lyrata, and T. parvula. The datasets generated in this study will help the gene annotation and further genomic evolution analysis of these species.
Results
Development of the Synorths Tool to Identify Gene Pairs with Syntenic Relationships
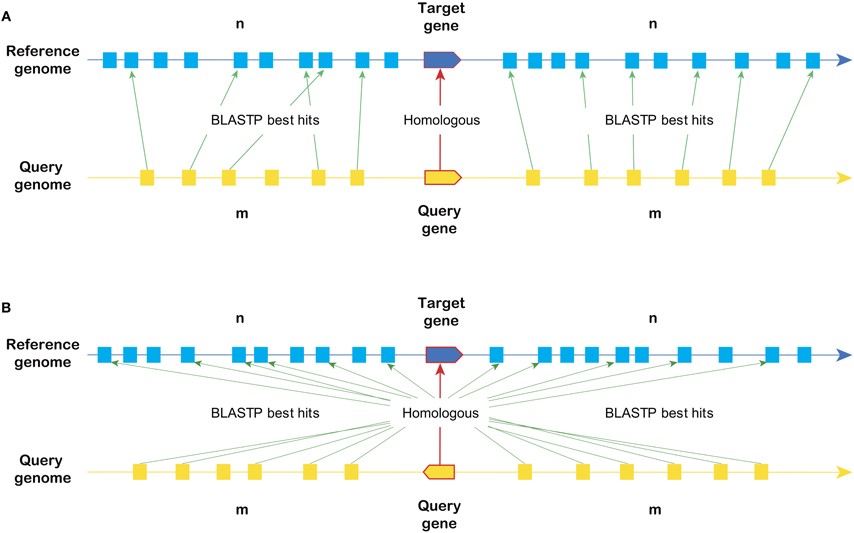
A tool named SynOrths was developed to identify syntenic genes based on the protein sequences of B. rapa and other related species (http://brassicadb.org/brad/tools/SynOrths/). As shown in Figure 1, SynOrths determines two genes to be syntenic orthologs based on both their own sequence similarity and the homology of their flanking genes.

Figure 1. The principles of syntenic gene identification in SynOrths. When determining whether two genes are under synteny, both the sequence homology of the two genes themselves and their flanking genes are considered. (A) Syntenic genes in the same direction in each genome. (B) Two syntenic genes located in inverted syntenic fragments.
There are four main steps embedded in SynOrths: (1) finding orthologous gene pairs; (2) redundant tandem gene removal; (3) locating potential syntenic orthologs by the support of flanking genes; and (4) final syntenic gene pair determination. In the first step, SynOrths runs Blastp to get basic protein sequence homology information from pairwise genomes. Gene pairs that are the best hits or with Blastp e-values <1E-20 are selected for further analysis. For tandem duplicated genes, which would add complexity to syntenic gene finding, SynOrths keeps one gene from each tandem gene array as a representative. In the second step, we identify all tandem gene arrays across the genomes being compared. Each tandem array is composed of continuously distributed homologous genes (Blastp E-value <1E-20) and should not be interrupted by more than one non-homologous gene. After that, the genes of each tandem array are replaced by the first one in the corresponding tandem. The revised homologous gene pairs are then sent to step 3 to compute the supporting strength of the flanking genes. Here, we set a threshold to check if the gene pair in question is supported by their flanking genes and thus potentially syntenic. Genes located in both flanking regions of the two genes are selected and named as the flanking gene set. We then count the number of best hit genes between the pairwise genomes in the flanking gene set. If the ratio of the best hit genes is higher than the threshold, then the homologous gene pair is considered as potentially syntenic. In the fourth step, we further screen for the best syntenic gene pairs. After the first three steps, a certain gene might have more than one potential syntenic partner, so these candidate syntenic gene pairs are then compared based on the ratio of flanking gene support and their sequence homology. The gene pair with the highest supporting ratio of flanking genes and comparably higher sequence homology is finally determined as the best syntenic pair.
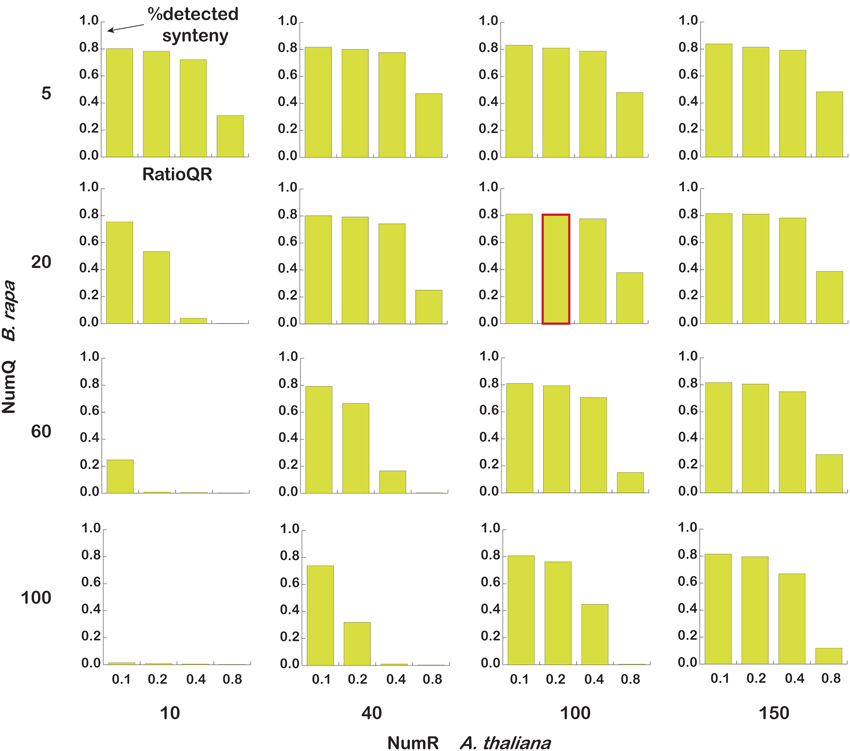
There are three main parameters that should be considered when using SynOrths. They are NumQ, the number of flanking genes on each side of the query gene; NumR, the number of flanking genes on each side of the reference gene; RatioQR, the ratio of best hit pairs among these flanking genes. Because B. rapa experienced whole genome triplication and subsequent intensive gene loss, the parameters should be carefully selected when using SynOrths to determine its syntenic genes with other species. Here, we chose three arrays for the three parameters (NumQ [5, 20, 60, 100], NumR [10, 40, 100, 150], and RatioQR [0.1, 0.2, 0.4, 0.8]) to perform SynOrths analysis between B. rapa and A. thaliana. As shown in Figure 2, the parameters NumQ = 20, NumR = 100, RatioQR = 0.2 gave a considerably better result. This parameter set was then chosen to identify syntenic gene pairs between B. rapa and A. thaliana, A. lyrata, and T. parvula.

Figure 2. Parameter estimation in SynOrths. The number of query (B. rapa) flanking genes [5, 20, 60, 100], the number of reference (A. thaliana) flanking genes [10, 40, 100, 150], and the threshold of the flanking genes' support ratio [0.1, 0.2, 0.4, 0.8] were set to run SynOrths. The bars indicate the proportions of syntenic genes identified out of 38,161 B. rapa genes, “%detected synteny” means percent of identified syntenic genes to the 38,161 B. rapa genes. The bar with a red border is the run with parameters NumQ = 20, NumR = 100, and RatioQR = 0.2; SynOrths returned stable and relatively more syntenic genes under these parameters.
Syntenic Gene Determination between B. rapa and Each of A. thaliana, A. lyrata, and T. parvula
Syntenic gene pairs between B. rapa and A. thaliana, B. rapa and A. lyrata, and B. rapa and T. parvula were identified using SynOrths. There were a total of 41,174, 27,379, 33,410, and 28,910 annotated proteins for B. rapa, A. thaliana, A. lyrata, and T. parvula, respectively. After removing the redundancy of duplicated tandem genes (keeping one gene from each tandem array), 38,161, 24,939, 30,773, and 27,344 genes were left for syntenic gene determination (Table 1). B. rapa returned 30,615 genes syntenic to 18,410 genes in A. thaliana; 30,250 genes syntenic to 18,125 A. lyrata genes; and 29,473 genes syntenic to 17,303 T. parvula genes. A. thaliana had the highest syntenic gene ratio (80.1%) compared to A. lyrata (79.6%) and T. parvula (77.5%).

Table 1. The homologous relationships of genes between B. rapa and A. thaliana, A. lyrata, or T. parvulla.
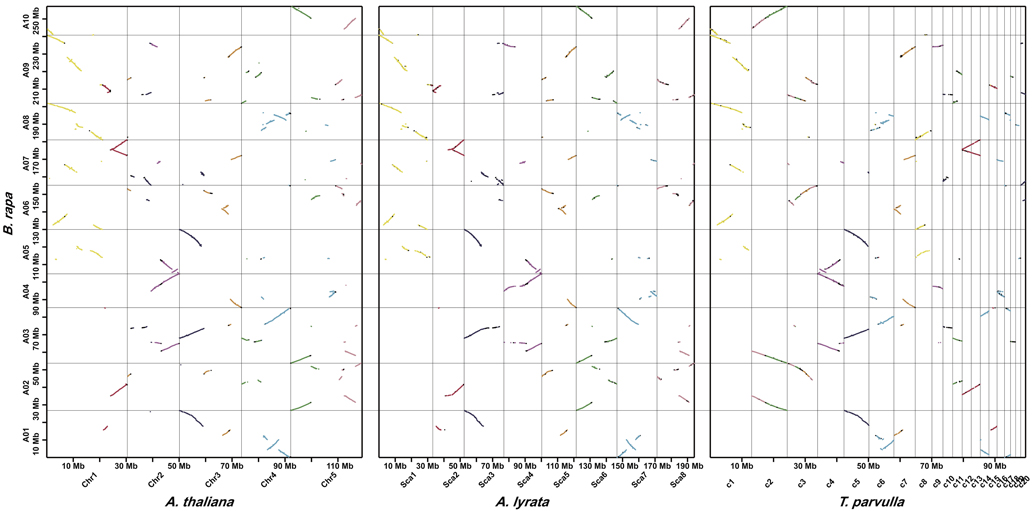
The genome triplication event in B. rapa was well supported (Figure 3), because many genes that were evenly distributed in genomes of A. thaliana (14.3%), A. lyrata (14.6%), and T. parvula (16.1%) had three syntenic copies in B. rapa. Additionally, among the 7,546 B. rapa genes that had no syntenic orthologs in A. thaliana, 849 were syntenic to genes in A. lyrata, and 1,416 syntenic to T. parvulla genes. In total, there were 32,310 B. rapa genes with at least one syntenic ortholog in either A. thaliana, A. lyrata, or T. pavula, and only 5,851 B. rapa genes that had no syntenic counterparts in any of the other species.

Figure 3. Syntenic genes identified by SynOrths between B. rapa and A. thaliana, A. lyrata, or T. parvula. For each segment in A. thaliana, A. lyrata, or T. parvula, there were three syntenic copies observed in B. rapa, which clearly reflected the genome triplication experienced by B. rapa. Colors of the dots represent for the 24 ancestral blocks of Brassicaceae species, which has been defined previously (Schranz et al., 2006).
For these non-syntenic genes between B. rapa and the other species, we considered them non-syntenic orthologs if their similarity satisfied sequence identity >70%, and coverage for each of the two genes >60%. B. rapa returned 1,391, 1,226, and 1,605 non-syntenic orthologs to 2,561 genes in A. thaliana, 1,877 in A. lyrata, 3,909 in T. parvula, respectively. However, for the 5,851 genes that had no syntenic orthologs in all three species, only 808 genes were non-syntenic orthologs of at least one gene in the other three species. These 808 genes could have been generated by gene transposition in B. rapa after its divergence from A. thaliana, A. lyrata, and T. parvula.
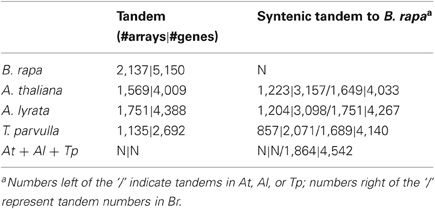
Most of the tandem arrays in B. rapa showed a syntenic relationship to A. thaliana, A. lyrata, or T. parvula (Table 2). For all 2,137 tandem arrays in B. rapa, 1,649 (77.16%) were syntenic to A. thaliana; 1,751 (81.94%) syntenic to A. lyrata, and 1,689 (79.04%) syntenic to T. parvula. In total, 1,864 (87.23%) tandem arrays in B. rapa had syntenic counterparts in at least one of the other species.
The dataset of genes' syntenic relationship among above four species had been integrated into BRAD (Brassica Database, http://brassicadb.org/brad/searchBrMultiSynteny.php) (Cheng et al., 2011). This resource built bridges between model plant A. thaliana and other Brassicaceae species, so the information of genes' function studies in A. thaliana were linked to the newly sequenced and annotated Brassicaceae genomes. For crop species such as B. rapa, B. oleracea, and B. napus, with the resource of syntenic relationships we can rapidly transfer knowledges from A. thaliana to the breeding research and apllication, and further production of the crops.
Discussion
Because SynOrths determines syntenic orthologs and genomic regions based on protein sequences, it cannot be applied to genomes without protein annotation. Coding regions are one of the most conserved elements in the genome, as most active genes are functionally conserved to defend against non-synonymous mutations. Even after long periods of divergent evolution, proteins with the same function still show high levels of sequence homology. Thus, proteins that preserve ancestral traits provide good data for synteny analysis. After the determination of syntenic orthologs, syntenic gene pairs could be used as anchors to identify genomic regions that are in synteny. Conversely, most non-coding genomic regions (except conserved non-coding DNA) are under almost neutral selection. These regions can be rapidly changed in the evolutionary process, even in true syntenic regions non-coding sequences almost always show complete non-homology. SynOrths is not suited for synteny analysis of genomes without protein sets, but methods that include a step to search for conserved non-coding elements for synteny analysis might handle this problem.
The performance of SynOrths is impacted by gene annotation; the more accurate the gene annotation sets, the more accurately syntenic orthologs would be identified. However, the impact is acceptable and can even be very limited when we tune down the parameters to deny gene pairs to be in synteny. Because the annotation of different genomes is completed by different software with different parameters, the robustness of synteny analysis is very important. Furthermore, where the annotation of different genomes is unbalanced, we cannot draw genetic relationships based on the number or ratio of identified syntenic genes. Syntenic gene sets could be used to address whole genome genetic variation patterns, but for research issues focusing on individual genes, more detailed work should be done to confirm the results, or the parameters should be turned up to generate more stringent results.
Synteny analysis is one of the most important fields in comparative genome analysis as it is the basis of evolutionary studies at both the gene and genome levels. Most practically, it helps improve the gene annotation of newly sequenced genomes. In this study, we used synteny analysis to link bulk gene information from the model plant A. thaliana to the newly sequenced Brassicaceae genomes B. rapa, A. lyrata, and T. parvula.
We designed and developed a direct and efficient tool, SynOrths, to identify pairwise syntenic genes between B. rapa and other sequenced genomes of Brassicaceae species. With this tool we conducted syntenic gene analysis between B. rapa and A. thaliana, A. lyrata, and T. parvula, and generated valuable datasets for further analysis. Whole genome synteny analysis and the datasets generated are important for both gene annotation of the newly sequenced Brassicaceae genomes and the study of genomic and chromosomal evolution in Brassicaceae species.
Materials and Methods
Gene annotation and protein sequences of B. rapa version 1.2 were downloaded from BRAD (http://brassicadb.org) (Cheng et al., 2011). The A. thaliana dataset was retrieved from TAIR (http://www.arabidopsis.org/index.jsp), and version TAIR9 was used. Genome and gene annotation files of version 6 for A. lyrata were downloaded from the JGI database (http://genome.jgi-psf.org/Araly1/Araly1.home.html) (Hu et al., 2011). T. parvula datasets version 7 were obtained from the T. parvula genome sequencing group (Dassanayake et al., 2011).
Blastp (NCBI-BLAST package, ftp://ftp.ncbi.nih.gov/blast/) was used for protein sequence alignment in SynOrths. SynOrths now is freely available at http://brassicadb.org/brad/tools/SynOrths/. The data generated in this study can be searched through http://brassicadb.org/brad/searchBrMultiSynteny.php or by contacting Feng Cheng.
Author Contributions
Xiaowu Wang and Feng Cheng conceived the study. Feng Cheng developed SynOrths and performed the synteny analysis. Feng Cheng prepared the manuscript, Xiaowu Wang and Jian Wu improved the manuscript. Jian Wu and Lu Fang tested SynOrths and provided feedback. All authors read and approved the final manuscript.
Conflict of Interest Statement
The authors declare that the research was conducted in the absence of any commercial or financial relationships that could be construed as a potential conflict of interest.
Acknowledgments
We thank Dong-Ha Oh for his help in retrieving the T. parvula dataset. The work was funded by National Program on Key Basic Research Projects (The 973 Program: 2012CB113900), and the National High Technology R&D Program of China (2012AA100201) to Xiaowu Wang. The work was done in the Key Laboratory of Biology and Genetic Improvement of Horticultural Crops, Ministry of Agriculture, P. R. China.
References
Cheng, F., Liu, S., Wu, J., Fang, L., Sun, S., Liu, B., Li, P., Hua, W., and Wang, X. (2011). BRAD, the genetics and genomics database for Brassica plants. BMC Plant Biol. 11, 136.
Cheng, F., Wu, J., Fang, L., Sun, S., Liu, B., Lin, K., Bonnema, G., and Wang, X. (2012). Biased Gene Fractionation and Dominant Gene Expression among the Subgenomes of Brassica rapa. PLoS ONE 7:e36442. doi: 10.1371/journal.pone.0036442
Dassanayake, M., Oh, D. H., Haas, J. S., Hernandez, A., Hong, H., Ali, S., Yun, D. J., Bressan, R. A., Zhu, J. K., Bohnert, H. J., and Cheeseman, J. M. (2011). The genome of the extremophile crucifer Thellungiella parvula. Nat. Genet. 43, 913–918.
Hu, T. T., Pattyn, P., Bakker, E. G., Cao, J., Cheng, J. F., Clark, R. M., Fahlgren, N., Fawcett, J. A., Grimwood, J., Gundlach, H., Haberer, G., Hollister, J. D., Ossowski, S., Ottilar, R. P., Salamov, A. A., Schneeberger, K., Spannagl, M., Wang, X., Yang, L., Nasrallah, M. E., Bergelson, J., Carrington, J. C., Gaut, B. S., Schmutz, J., Mayer, K. F., Van de Peer, Y., Grigoriev, I. V., Nordborg, M., Weigel, D., and Guo, Y. L. (2011). The Arabidopsis lyrata genome sequence and the basis of rapid genome size change. Nat. Genet. 43, 476–481.
Initiative, A. G. (2000). Analysis of the genome sequence of the flowering plant Arabidopsis thaliana. Nature 408, 796–815.
Lyons, E., Pedersen, B., Kane, J., Alam, M., Ming, R., Tang, H., Wang, X., Bowers, J., Paterson, A., Lisch, D., and Freeling, M. (2008). Finding and comparing syntenic regions among Arabidopsis and the outgroups papaya, poplar, and grape: CoGe with rosids. Plant Physiol. 148, 1772–1781.
Mandakova, T., and Lysak, M. A. (2008). Chromosomal phylogeny and karyotype evolution in x=7 crucifer species (Brassicaceae). Plant Cell 20, 2559–2570.
Schranz, M. E., Lysak, M. A., and Mitchell-Olds, T. (2006). The ABC's of comparative genomics in the Brassicaceae: building blocks of crucifer genomes. Trends Plant Sci. 11, 535–542.
Tang, H., Bowers, J. E., Wang, X., Ming, R., Alam, M., and Paterson, A. H. (2008). Synteny and collinearity in plant genomes. Science 320, 486–488.
Tang, H., Woodhouse, M. R., Cheng, F., Schnable, J. C., Pedersen, B. S., Conant, G., Wang, X., Freeling, M., and Pires, J. C. (2012). Altered patterns of fractionation and exon deletions in Brassica rapa support a two-step model of paleohexaploidy. Genetics 190, 1563–1574.
U. N. (1935). Genome analysis in Brassica with special reference to the experimental formation of B. napus and peculiar mode of fertilication. Jpn. J. Bot. 7, 389–452.
Wang, X., Wang, H., Wang, J., Sun, R., Wu, J., Liu, S., Bai, Y., Mun, J. H., Bancroft, I., Cheng, F., Huang, S., Li, X., Hua, W., Freeling, M., Pires, J. C., Paterson, A. H., Chalhoub, B., Wang, B., Hayward, A., Sharpe, A. G., Park, B. S., Weisshaar, B., Liu, B., Li, B., Tong, C., Song, C., Duran, C., Peng, C., Geng, C., Koh, C., Lin, C., Edwards, D., Mu, D., Shen, D., Soumpourou, E., Li, F., Fraser, F., Conant, G., Lassalle, G., King, G. J., Bonnema, G., Tang, H., Belcram, H., Zhou, H., Hirakawa, H., Abe, H., Guo, H., Jin, H., Parkin, I. A., Batley, J., Kim, J. S., Just, J., Li, J., Xu, J., Deng, J., Kim, J. A., Yu, J., Meng, J., Min, J., Poulain, J., Hatakeyama, K., Wu, K., Wang, L., Fang, L., Trick, M., Links, M. G., Zhao, M., Jin, M., Ramchiary, N., Drou, N., Berkman, P. J., Cai, Q., Huang, Q., Li, R., Tabata, S., Cheng, S., Zhang, S., Sato, S., Sun, S., Kwon, S. J., Choi, S. R., Lee, T. H., Fan, W., Zhao, X., Tan, X., Xu, X., Wang, Y., Qiu, Y., Yin, Y., Li, Y., Du, Y., Liao, Y., Lim, Y., Narusaka, Y., Wang, Z., Li, Z., Xiong, Z., and Zhang, Z. (2011). The genome of the mesopolyploid crop species Brassica rapa. Nat. Genet. 43, 1035–1039.
Keywords: synteny, ortholog, Brassica rapa, Arabidopsis thaliana, Arabidopsis lyrata, Thellugiella parvula, Brassicaceae
Citation: Cheng F, Wu J, Fang L and Wang X (2012) Syntenic gene analysis between Brassica rapa and other Brassicaceae species. Front. Plant Sci. 3:198. doi: 10.3389/fpls.2012.00198
Received: 19 July 2012; Paper pending published: 07 August 2012;
Accepted: 08 August 2012; Published online: 30 August 2012.
Edited by:
Michael Freeling, University of California, Berkeley, USAReviewed by:
Michael Freeling, University of California, Berkeley, USAHaibao Tang, J. Craig Venter Institute, USA
Copyright © 2012 Cheng, Wu, Fang and Wang. This is an open-access article distributed under the terms of the Creative Commons Attribution License, which permits use, distribution and reproduction in other forums, provided the original authors and source are credited and subject to any copyright notices concerning any third-party graphics etc.
*Correspondence: Xiaowu Wang, Institute of Vegetables and Flowers, Chinese Academy of Agricultural Sciences, Beijing 100081, China. e-mail:d2FuZ3h3QG1haWwuY2Fhcy5uZXQuY24=


