- 1Department of Cellular and Molecular Physiology, Yale University School of Medicine, New Haven, CT, United States
- 2Department of Biology, Valparaiso University, Valparaiso, IN, United States
- 3Preclinical Sciences Division, Kent State University College of Podiatric Medicine, Independence, OH, United States
- 4Department of Physiology & Biophysics Case Western Reserve University School of Medicine, Cleveland, OH, United States
- 5Department of Mathematics & Statistics, Valparaiso University, Valparaiso, IN, United States
Metabolic acidosis (MAc)—an extracellular pH (pHo) decrease caused by a [HCO3−]o decrease at constant [CO2]o—usually causes intracellular pH (pHi) to fall. Here we determine the extent to which the pHi decrease depends on the pHo decrease vs the concomitant [HCO3−]o decrease. We use rapid-mixing to generate out-of-equilibrium CO2/HCO3− solutions in which we stabilize [CO2]o and [HCO3−]o while decreasing pHo (pure acidosis, pAc), or stabilize [CO2]o and pHo while decreasing [HCO3−]o (pure metabolic/down, pMet↓). Using the fluorescent dye 2′,7′-bis-2-carboxyethyl)-5(and-6)carboxyfluorescein (BCECF) to monitor pHi in rat hippocampal neurons in primary culture, we find that—in naïve neurons—the pHi decrease caused by MAc is virtually the sum of those caused by pAc (∼70%) + pMet↓ (∼30%). However, if we impose a first challenge (MAc1, pAc1, or pMet↓1), allow the neurons to recover, and then impose a second challenge (MAc2, pAc2, or pMet↓2), we find that pAc/pMet↓ additivity breaks down. In a twin-challenge protocol in which challenge #2 is MAc, the pHo and [HCO3−]o decreases during challenge #1 must be coincident in order to mimic the effects of MAc1 on MAc2. Conversely, if challenge #1 is MAc, then the pHo and [HCO3−]o decreases during challenge #2 must be coincident in order for MAc1 to produce its physiological effects during the challenge #2 period. We conclude that the history of challenge #1 (MAc1, pAc1, or pMet↓1)—presumably as detected by one or more acid-base sensors—has a major impact on the pHi response during challenge #2 (MAc2, pAc2, or pMet↓2).
Introduction
Neuronal activity produces transient shifts in extracellular pH (pHo). The direction of these shifts depends on the location in the brain, and their peak magnitude depends on the intensity and duration of the activity (for review, see Chesler, 2003). Conversely, changes in pHo can alter neuronal excitability by modulating pH-sensitive ion channels (Meech and Thomas, 1987; Tang et al., 1990; Church et al., 1998). Moreover, changes in pHo also cause intracellular pH (pHi) to shift in the same direction (Ellis and Thomas, 1976; Vaughan-Jones, 1986; Tolkovsky and Richards, 1987; Bouyer et al., 2004) and such changes in pHi also modulate neuronal excitability (Filosa et al., 2002; Wang et al., 2002). In addition to these effects on ion channels, changes in pHo and/or pHi can modulate other components of the machinery of neurotransmission, such as vesicular amine transporters, and transporters that mediate the reuptake of glutamate and serotonin (Keyes and Rudnick, 1982; Kanai et al., 1995; Eiden et al., 2004). Therefore, it is important for a neuron to maintain an appropriate pHi in the face of shifting values of pHo. To achieve this task, neurons like other cells, are armed with acid-base transporters (Ruffin et al., 2014). Among these, Na-H exchangers play important roles in maintaining steady-state pHi as well as in extruding acid during the recovery of pHi from an acid-load (Bevensee et al., 1996; Raley-Susman et al., 1991; Tolkovsky and Richards, 1987; Yao et al., 1999). In neurons exposed to CO2/HCO3−, the Na+-coupled HCO3− transporters—the Na+-driven Cl/HCO3 exchanger (Boron and De Weer, 1976; Russell and Boron, 1976; Thomas, 1977) and the electroneutral Na/HCO3 cotransporters NBCn1 and NBCn2 (Cooper et al., 2005; Parker et al., 2008)—are among the most potent acid extruders (i.e., transporters that mediate the efflux of H+ or influx of alkali; see refs. Schwiening and Boron, 1994; Cooper et al., 2005; 2009; Gurnett et al., 2008). In the presence of CO2/HCO3−, the Cl-HCO3 exchanger AE3 is a potent acid loader that helps neurons to recover after alkaline loads (Kopito et al., 1989; Raley-Susman et al., 1993; Brett et al., 2002; Hentschke et al., 2006; Svichar et al., 2009; Ruffin et al., 2014; Salameh et al., 2017).
Although the field has witnessed substantial progress in clarifying the molecular nature of the Na-H exchangers (Donowitz et al., 2013) and HCO3− transporters (Parker and Boron, 2013; Romero et al., 2013; Thornell et al., 2025) that are involved in pHi homeostasis, the same is not true for understanding how changes in the key extracellular acid-base parameters—pHo, [CO2]o, and [HCO3−]o—modulate these transporters and, thus, pHi. Of course, changes in the above parameters could directly affect transporters. For example, a change in pHo would modulate Na-H exchange because H+ competes with extracellular Na+ (Aronson et al., 1982). Change in pHo or [HCO3−]o would modulate the Na+-coupled HCO3− transporters because in at least two cases, and possibly all, the HCO3−-related substrate is CO3= or NaCO3− (Lee et al., 2023), the concentrations of which are very sensitive to changes in pHo and [HCO3−]o. One mechanism by which metabolic acidosis (MAc; a decrease in [HCO3−]o that causes pH to fall) causes pHi in neurons to fall (Bouyer et al., 2004; Salameh et al., 2014) is an enhanced activity of an acid loader, the Cl-HCO3 exchanger AE3 (Salameh et al., 2017).
One mechanism for the aforementioned enhanced AE3 activity is the fall in [HCO3−]o that accompanies MAc. However, other potential mechanisms could involve sensors for pH, CO2, or HCO3− (Tresguerres et al., 2010) that respond to changes in acid-base status by modulating acid-base transporters. Established acid-base sensors include three G-protein–coupled proteins—GPR68 (aka, OGR1; see (Ludwig et al., 2003; Tomura et al., 2005; Mohebbi et al., 2012), GPR4 (Ludwig et al., 2003; Sun et al., 2010), and GPR65 (aka, TDAG8; see Ishii et al., 2005)—that activate in response to decreases in pHo. In addition, the soluble adenylyl cyclase sAC (Chen et al., 2000) and certain receptor guanylyl cyclases (Schulz et al., 1998; Sun et al., 2009) become more active in response to increases in [HCO3−]i; numerous ion channels (e.g., TASK, ASIC, TRPV) respond to changes in pHo or pHi (for reviews, see Montell, 2001; Lesage, 2003a; Holzer, 2009; Tresguerres et al., 2010); and the tyrosine kinase Pyk2 becomes more active in response to decreases in pHi (Li et al., 2004). In Drosophila, Gr21a and Gr63a are reported to be CO2 receptors; ectopic expression of Gr21a and Gr63a confers chemosensitivity to olfactory neurons, whereas gene deletion prevents behavioral response of Drosophila to CO2 (Jones et al., 2007). Finally, the receptor protein tyrosine phosphatase γ (RPTPγ) appears to respond oppositely to changes in both [CO2]o and [HCO3−]o but is insensitive to pHo changes (Boedtkjer et al., 2016; Zhou et al., 2016). The review by Thornell et al. (2024) discusses such acid-base sensors.
The development of out-of-equilibrium (OOE) CO2/HCO3− solutions (Zhao et al., 1995)—which can have virtually any combination of [CO2], [HCO3−], and pH in the pathophysiological range of pH values—makes it possible to ask whether cells have a mechanism for sensing extracellular CO2 or HCO3− per se, independent of pH. Indeed, using OOE solutions, Zhou et al. demonstrated that isolated renal proximal tubules increase their rate of bicarbonate reabsorption (i.e., H+ secretion) in response to isolated decreases in basolateral [HCO3−] (i.e., holding basolateral [CO2] and pH constant) or to isolated increases of basolateral [CO2], but not to isolated changes in basolateral pHo (Zhou et al., 2005). These results were the first to demonstrate unequivocally that, independent of pH, the two components of the major blood buffer—CO2/HCO3−—can act as potent modulators of a biological function.
An earlier study of cultured rat neurons showed that the pHi responses to extracellular respiratory acidosis (i.e., an increase in [CO2]o that causes pHo to fall), to extracellular respiratory alkalosis (i.e., a decrease in [CO2]o), or to metabolic alkalosis (i.e., an increase in [HCO3−]o, at fixed [CO2]o, that causes pHo to rise) were each indistinguishable between medullary-raphé (MR) vs hippocampal (HC) neurons. In all cases, neuronal pHi changed in the same direction as pHo, with a steady-state ΔpHi/ΔpHo of ∼60%. However, the responses to extracellular metabolic acidosis were not uniform. The majority of the MR neurons and the minority of HC neurons exhibited the expected response to MAc: a reversible pHi decrease and a ΔpHi/ΔpHo of ∼65%. In contrast to these “MAc-sensitive” neurons, a minority subpopulation of MR neurons and the majority of HC neurons exhibited a ΔpHi/ΔpHo of only ∼9% (Bouyer et al., 2004). Moreover, returning these “MAc-resistant” neurons from the MAc solution to a solution with a normal acid-base status causes pHi to rebound above the initial baseline. An analysis of various possibilities (see the discussion of Bouyer et al., 2004), led to the hypothesis that MAc-resistant MR and HC neurons have an extracellular “HCO3− sensor” that can detect decreases in [HCO3−]o per se, and respond with a near-instantaneous increase in the rate of acid extrusion over acid loading, the effect of which is to minimize decreases in pHi.
In the present study, we re-examine the effect of MAc on the pHi of rat HC neurons by using OOE technology to break MAc artificially into its two component parts, “pure” acidosis (pAc: ↓pHo at fixed [CO2]o and [HCO3−]o) and pure metabolic/down (pMet↓: ↓[HCO3−]o at fixed [CO2]o and pHo). We also examined acidosis (Ac) in the nominal absence of CO2/HCO3−. Finally, we performed seven twin-challenge protocols in which we examined the effect on pHi of a challenge (e.g., pMet↓), followed by a recovery period, and then a second challenge (e.g., MAc). Surprisingly, we find that the effects of pAc and pMet↓ do not necessarily sum, and that neurons often respond to pMet↓ by with a paradoxical pHi increase.
Methods
Cell culture
We performed experiments on rat cultured hippocampal neurons, with approval for all animal procedures from the Yale University Animal Care and Use Committee. The methods to culture neurons are essentially the same as previously described (Brewer et al., 1993) and subsequently modified in the Boron laboratory (Chen et al., 2008). Briefly, a pregnant rat was deeply anesthetized using halothane, prior to cervical dislocation. Rat embryos (18 days) were quickly removed from the uterus and decapitated. Approximately ten brains were collected and placed in filtered HEPES-buffered solution (HBS) containing (in mM): NaCl, 143.7; KCl, 3; and HEPES, 10. Hippocampi were extracted using fine forceps and a scalpel and then exposed to 0.03% (w/v) trypsin (Sigma-Aldrich, St Louis, MO) dissolved in HBS for 15 min at 37°C. Using flamed Pasteur pipettes with reduced tip diameter, we triturated the tissues to disperse cells. Neurons were plated in neurobasal medium supplemented with B-27 (GIBCO-Invitrogen, Carlsbad, CA), 10% fetal calf serum (FCS), plus penicillin-streptomycin on poly-L-lysine (MP Biomedical, Irvine, CA) coated glass coverslips (Warner Instruments, Hamden CT, USA) or photoetched grid coverslips (Bellco Biotechnology, Vineland, NJ). After 3–4 h the medium was changed to a similar one without FCS. Neurons cultures were kept in a 5% CO2-air incubator at 37°C for at least seven and up to 61 days (average 23 days).
Solutions
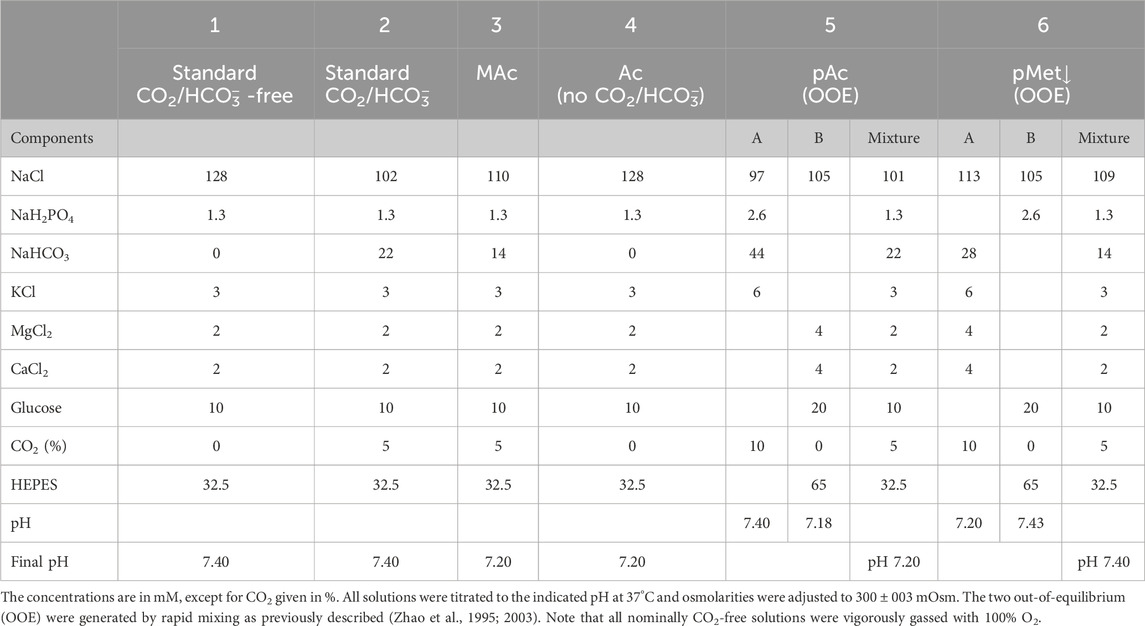
Table 1 lists the compositions of the physiological solutions, which were adjusted to 300 ± 3 mosmoles/kg using a vapor pressure osmometer (Model 5520C, Wescor, Inc., Logan UT). All solutions were delivered by syringe pumps (model #55-2222, Harvard Apparatus, South Holliston, MA, USA) at 7 mL min–1 through Tygon tubing that connected to a water-jacket system for warming before being delivered to a chamber (Bouyer et al., 2003). The temperature in the chamber was 37°C.
To generate CO2/HCO−3 out-of-equilibrium solutions, we followed the procedures originally described by the Boron laboratory (Zhao et al., 1995; 2003; Zhou et al., 2005), and we adapted them for hippocampal neuron solutions. For a review, see (Boron, 2004). In addition, the accompanying Hypothesis and Theory contribution contains a figure and an examples of how we implemented the OOE approach in the present study (Bouyer et al., 2024). Briefly the contents of two syringes (having the composition A and B in Table 1) were rapidly mixed at T connector connected to short Tygon tubing containing nylon mesh to promote mixing. The short length of Tygon tubing filled with mesh was connected to a chamber with a channel 2.5 mm wide × 14 mm long to promote laminar flow.
Fluorescence measurements
We followed the same protocol previously described for fluorescence measurements in cultured neurons (Bouyer et al., 2004). Neurons were loaded with the pH-sensitive dye 2′,7′-bis-2-carboxyethyl)-5(and-6) carboxyfluorescein (BCECF) by incubating cells at room temperature for ∼15 min in solution 1 (Table 1) containing 10 μM of the esterified BCECF (Molecular Probes Inc., Eugene, OR). Fluorescence measurements started ∼5 min after we began to flow solution one or 2 (Table 1) through the chamber to warm cells and flush unhydrolyzed BCECF.
We used an Olympus IX70 inverted microscope equipped for epi-fluorescence (oil immersion ×40 objective, NA 1.35, with a ×1.5 magnification knob) to locate neurons on the field. The light was generated by 75-W xenon arc lamp and the two excitations wavelength of 440 nm and 490 nm were obtained by two excitations filters (440 ± 5 nm and 495 ± 5 nm, Omega Optical Inc., Brattleboro, VT) mounted on a filter wheel (Ludl Electronic Products Ltd., Hawthorne, NY) in the excitation light path. Selected neutral density filters (Omega Optical, Inc.), mounted on a second wheel, were used to equalize as nearly as possible the emitted light and avoid over-illumination of the cells. The excitation light was directed to the cells via a long-pass dichroic mirror (DM 510, Omega Optical Inc.), and we collected the emission light via a band-pass filter (530 ± 35 nm, Omega Optical Inc.) connected to intensified CCD camera (Model 350F, Video Scope International LTD, Dulles, VA). We averaged signals from 4 video frames at an acquisition rate of ranging from once every 2.5–20 s; a shutter on the filter wheel protected the cells and filters from the light between acquisitions. The data acquisition was controlled by software developed in our laboratory using the Optimas (Media Cybernetics, Inc., Silver Spring, MD) platform. Using Optimas, we delineated an area of interest (AOI) corresponded mostly to the soma of the cell and the pixel intensity of the AOI at 490 (I490) was divided by the pixel intensity at 440 (I440) nm. The fluorescence ratio I490/I440 was converted to pHi values by using the high-K+/nigericin technique (Thomas et al., 1979), as modified in the Boron laboratory to obtain a one-point calibration at pHi 7.00 (Boyarsky et al., 1988).
We generated, in a separate set of experiments, the calibration curve for BCECF, by flowing through the chamber 10 different solutions with pH values ranging from 5.8 to 8.5 to generate the parameters for the aforementioned one-point calibration. The best fit value pK was 7.13 ± 0.005 (SD), and the b value (i.e., the difference between Rmax and Rmin) was 1.97 ± 0.009 (SD). High-K+/nigericin solutions were delivered to the chamber though a system independent of that used to superfuse the cells to avoid nigericin contamination in the lines during the actual experiments (Richmond and Vaughan-Jones, 1997; Bevensee et al., 1999). At the end of each experiment, we washed extensively the chamber with 70% ethanol and deionized water.
Definitions
State
Our definitions of the states of MAc “resistance” vs MAc “sensitivity” follow the criteria adopted by Salameh et al. (2014). State applies to the size of a single pHi change (ΔpHi) during a single acid-base challenge. In a twin-pulse protocol, each challenge has its own state. For each challenge, a neuron is resistant when (∆pHi/∆pHo) ≤ 40%, where ΔpHi is the change in pHi caused by ΔpHo, the imposed change in pHo. Conversely a neuron is sensitive when (∆pHi/∆pHo) is larger than 40%. Although figure 40% is somewhat arbitrary, it coincides with a natural break in the data of Salameh et al. (2014). In the twin-pulse protocols in Figure 3B through Figure 9B in Results, we use the subscript “1” to refer to the first of the two challenges, and the subscript “2” to refer to the second. In these seven figures, we plot (ΔpHi)1 for each neuron on the x-axis, and the corresponding (ΔpHi)2 on the y-axis. We indicate the resistant-sensitive boundaries by dashed blue lines, vertical for (ΔpHi)1 and horizontal for (ΔpHi)2.
“State” is defined by the location of the cell on the [(ΔpHi)1,(ΔpHi)2] coordinate system, with respect to the dashed blue lines. Thus, if a neuron is to the left of the vertical dashed blue line, the state is MAc1 sensitive; if below the horizontal dashed blue line, the state is MAc2 sensitive. If the neuron lies on the opposite side of either line, the state is resistant. The intersecting dashed blue lines define four “quadrants” that we will discuss, with examples, in conjunction with Figure 3B.
Behavior
Our definitions of the behaviors of “adaptation” vs “consistency” vs “decompensation” also follow the criteria adopted by Salameh et al. (2014). “Behavior” has meaning only during a twin-pulse protocol in which a cell (1) is subjected to acid-base challenge #1, (2) is allowed to recover, and (3) is subjected to acid-base challenge #2. The pHi changes during the two challenges are (ΔpHi)1 and (ΔpHi)2. The determination of behavior revolves around the hourglass analysis (see B panels in Figure 3 through Figure 9) In brief, the dashed gray line that slopes upward from lower left to upper right at 45° represents identity, that is, (ΔpHi)1 = (ΔpHi)2. The sets of solid gray curves shaped like a tilted hour glass indicate our upper and lower confidence limits, based on (1) a requirement that (ΔpHi)2 be (100.05–1), which is ∼12.2%, greater than (ΔpHi)1 in the case of the upper asymptote of the hourglass or (100.05–1) less than (ΔpHi)1 in the case of the lower asymptote, and (2) an assumed experimental uncertainty of ±0.02 pH units. Thus,
where |(ΔpHi)1| indicates the absolute value.
“Behavior” is defined by the location of the cell on the [(ΔpHi)1, (ΔpHi)2] coordinate system, with respect to the upper and lower asymptotes. Thus, if (∆pHi)2 lies above the upper asymptote of the hourglass—that is, when (ΔpHi)2 is sufficiently > (ΔpHi)1—Salameh et al. (2014) defines the neuron as showing adaptation. If (ΔpHi)2 lies within the limits of the hourglass)—that is, (ΔpHi)2 ≅ (ΔpHi)1—Salameh et al. defines the neuron as showing consistency. Finally, if (ΔpHi)2 lies below the lower asymptote of the hourglass—that is, when (ΔpHi)2 is sufficiently < (ΔpHi)1—Salameh et al. defines the neuron as showing decompensation. We will provide examples in conjunction with Figure 3B.
Data analysis and statistics
For each pHi experiment, we computed the fractional rate of the BCECF dye loss (–k440) to assess cell viability with time (Bevensee et al., 1995). We choose to reject experiments with a rate–k440 > 5%.mn−1. Data are reported as mean ± SD, followed by the number of cells (n), the number of coverslips (N), and the number of cultures (
Results
Ability of metabolic acidosis to change pHi
In a previous study (Bouyer et al., 2004), we found that exposing cultured rat hippocampal neurons (a total of 14) to a single challenge of metabolic acidosis caused relatively little fall in pHi in the majority of HC neurons, and a larger acidification in a minority of HC neurons. In the present study, we subject a much larger number of HC neurons to extracellular MAc (5% CO2/14 mM HCO3−, pH = 7.20; solution 3, Table 1). Moreover, we now impose two sequential acid-base challenges per cell, and exploit out-of-equilibrium solutions to tease apart the contributions of a decreased pHo per se and a decreased [HCO3−]o per se. For HC neurons in which we present MAc as the first acid-base challenge, we find that the average MAc-induced pHi change (measured at times that we judged pHi to be approximately stable) is −0.11 ± 0.10 (n = 235 cells, N = 86 coverslips,
Figure 1 summarizes the distribution of pHi changes (∆pHi). Using the definitions of MAc-resistant and MAc-sensitive cells (see Definitions1) and previously established (Salameh et al., 2014) we find that 90 neurons (∼38%) were MAc-resistant and 145, MAc-sensitive (∼62%). These percentages are nearly identical to those from a study on cultured mouse HC neurons (Salameh et al., 2014). We will refer to MAc-resistant vs MAc-sensitive as physiological “states.”
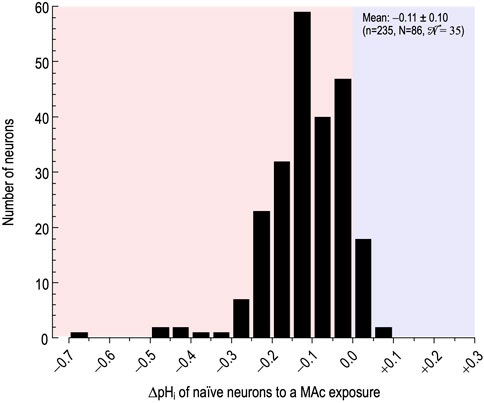
Figure 1. Effect of metabolic acidosis (MAc) on the pHi of naïve rat hippocampal neurons. The histogram represents the distribution of the change in pHi (∆pHi)—judged after a time in MAc when we judged pHi to be approximately stable—of neurons, caused by switching the extracellular solution from standard CO2/HCO3− (solution 2, Table 1) to MAc (solution 3, Table 1). Here, we restrict the analysis to naïve neurons, that is, those for which MAc was the first challenge. The bin width is 0.05 pH units. n, number of neurons; N number of cover slips;
Note that, although the vast majority of neurons respond to MAc with the expected acidification (i.e., negative ΔpHi values in Figure 1, reddish background), in few cells, MAc paradoxically elicits an alkalinization (i.e., positive ΔpHi values at the extreme right of Figure 1, blueish background).
Relationships between MAc-induced ΔpHi and time in culture, and initial steady state pHi
Time in culture and ΔpHi during MAc
To determine whether the pHi response to MAc depends on time in culture, in Figure 2A we plot the ∆pHi of naïve neurons as a function of time, and find no correlation (R2 = 0.002).
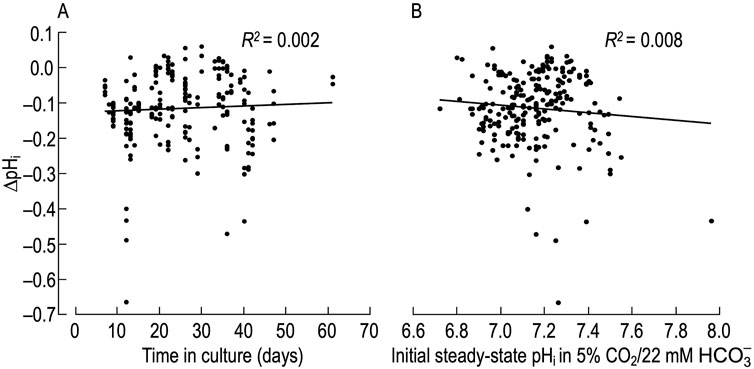
Figure 2. Relationship between pHi change induced by metabolic acidosis (MAc) in naïve rat hippocampal neurons versus time in culture and initial steady-state pHi (A), change in pHi (ΔpHi)—judged after a time in MAc when we judged pHi to be approximately stable—vs. time in culture. We induced the ΔpHi by switching the extracellular solution from standard CO2/HCO3− (solution 2, Table 1) to MAc (solution 3, Table 1). As in Figure 1, we restrict the analysis to naïve neurons, that is, those for which MAc was the first challenge. The linear fit regression fit shows no correlation between ΔpHi vs time in culture. (B), change in pHi vs initial steady-state pHi value. These are the same ΔpHi data as in panel (A). The linear regression fit shows no correlation between ΔpHi and pHi values.
Impact of culture date on ΔpHi
We maintained uniform conditions for each of the seven twin-challenge protocols that we present in the remainder of Results: MAc-MAc, Ac-MAc, MAc-Ac, pAc-MAc, MAc-pAC, pMet↓-MAc and MAc-pMet↓. Thus, we should not expect to observe systematic differences in ∆pHi according to the culture date. To examine that possibility, we used a linear mixed-effects model to determine if culture date represents a significant predicator of the relationship between the pHi just before the first of two challenges and the ΔpHi during that challenge. Of the seven protocols, the random effect of culture date was significant only for two, MAc-MAc (χ2(1) = 15.8, p < 0.001) and pAc-MAc (χ2(1) = 28.2, p < 0.001). The most likely explanation is that these two instances of significance reflect random fluctuations, rather than biological effects, inasmuch as experimental conditions were uniform for each of the seven protocols.
Correlation between initial pHi and ΔpHi
We know from work of the Boron and the Church laboratories on HC neurons that, upon switching from a HEPES-buffered to a CO2/HCO3−-buffered extracellular solution, the initial steady-state pHi impacts the direction (i.e., acidification vs alkalinization) and magnitude of the ensuing pHi response (Schwiening and Boron, 1994; Bevensee et al., 1996; Smith et al., 1998). To test the hypothesis that the initial steady-state pHi in CO2/HCO3− may also influence the degree of MAc-induced acidification, in Figure 2B we plot the ΔpHi of naïve neurons vs the initial pHi, and find no correlation between the two parameters (R2 = 0.008). Therefore, we conclude that factors other than time in culture and initial steady-state pHi are responsible for the different pHi responses observed during an exposure to MAc.
We reach a similar conclusion when examining all initial-pHi/∆pHi data pairs in the four protocols in which MAc is the first challenge—that is, MAc1—experienced by naïve neurons: MAc-MAc, MAc-Ac, MAc-pAC and MAc-pMet↓. The best fit regression line for these data (not shown) has R2 = 0.00056, indicating no relationship.
Relationship between (pHi)1 and (pHi)2
In six of the seven twin-pulse protocols—all except Ac-MAc—we found a positive and significant correlation (p < 0.001; not shown) between the pHi before the first challenge, (pHi)1, and the pHi before the second challenge, (pHi)2. That is, higher (pHi)1 values correlate with higher (pHi)2 values.
Twin MAc exposures
In work on cultured mouse HC neurons, Salameh et al. (2014) monitored pHi while subjecting the cells to two consecutive MAc challenges—MAc1 and MAc2—separated by a period of recovery. As set out in Methods (see Definitions), Salameh et al. (2014) characterized cell “state” as resistant vs sensitive based upon the magnitude of (ΔpHi)1 during MAc1 and (ΔpHi)2 during MAc2. Comparing (ΔpHi)2 vs the previous (ΔpHi)1, those authors also defined neuron “behavior” as “adaptation”, “consistency,” and “decompensation” based on the position of the neuron on a [(ΔpHi)1, (ΔpHi)2] coordinate system, with respect to the hourglass defined by Equations 1, 2 in Methods.
Salameh et al. worked with mouse (rather than rat) HC neurons, and cultured the HC neurons together with abundant (rather than depleted) astrocytes. In this first Results section, we ask whether the Salameh results for twin MAc pulses are generalizable to the present conditions for rat HC neurons.
Sample pHi records
Figure 3A shows pHi records—colored blue, green, and red—from three rat HC neurons, each challenged with two consecutive MAc pulses. For the green record, we label [1] (pHi)1, the pHi just before MAc1; [2] (ΔpHi)1, the pHi change by the end of MAc1; [3] (pHi)2, the pHi just before MAc2; and [4] (ΔpHi)2, the pHi change by the end of MAc2. The blue and red2 pHi records show neurons with relatively large acidifications during the first MAc exposure (i.e., they are MAc1 sensitive), and relatively large acidifications during the second MAc exposure (i.e., they are MAc2 sensitive as well). The green pHi trace shows a neuron with a relatively large acidification during the first MAc exposure (i.e., it is MAc1 sensitive), but a smaller pHi change during the second MAc exposure (i.e., it is MAc2 resistant).
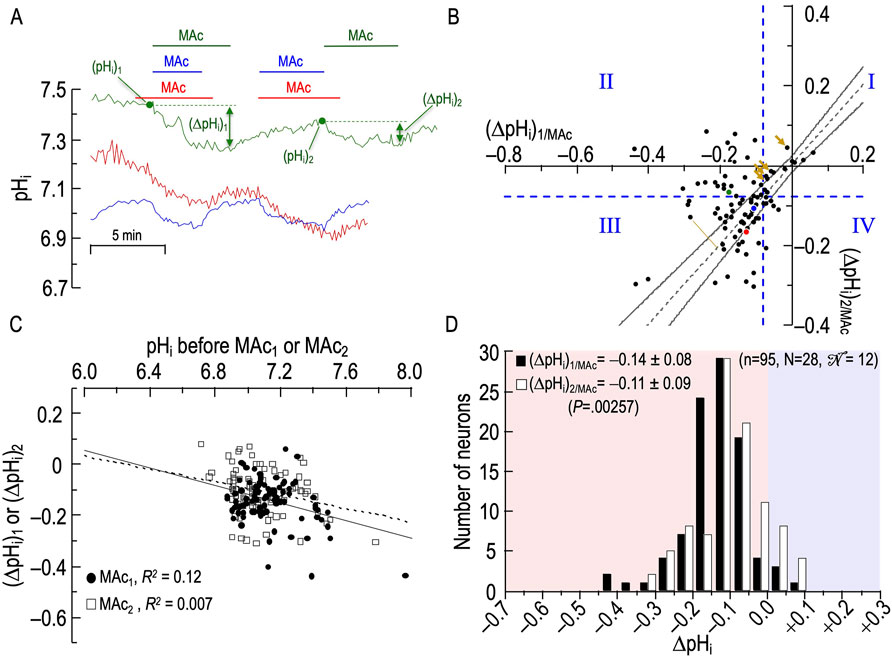
Figure 3. Effect of twin exposures to metabolic acidosis (MAc) on pHi of rat hippocampal neurons (A), examples of pHi responses of three neurons to twin challenges in which we switched from standard CO2/HCO3− (solution 2, Table 1) to MAc (solution 3, Table 1). Unless otherwise indicated, the extracellular solution was standard CO2/HCO3− (solution 2, Table 1). (B), relationship between the ΔpHi during the first exposure to MAc—that is, (ΔpHi)1/MAc—and ΔpHi during the second exposure to MAc—that is, (ΔpHi)2/MAc. The vertical dashed blue line is the resistant-sensitive demarcation for MAc1, and the horizontal dashed blue line is the same for MAc2. Both demarcations are at ΔpHi/ΔpHo = 40%. Together, these dashed lines define quadrants QI through QIV and “pHi states.” Because the blue and red dots, representing the blue and red neurons in (A), are in QIII, those neurons are both MAc1 sensitive and MAc2 sensitive. Because the green dot is in QII, the green neuron in panel A is MAc1 sensitive but MAc2 resistant. The four bronze arrows indicate four neurons that were MAc resistant in both challenges. The dashed gray line represents the line of identity, for which (ΔpHi)1/MAc = (ΔpHi)2/MAc. The upper and lower bending asymptotes—the hourglass, which defines “pHi behavior”—represent the confidence interval as described in Methods. Using these criteria, the blue neuron in panel A displays consistency because the blue point in (B) lies within the hourglass, that is, (ΔpHi)2 ≅ (ΔpHi)1. The green neuron displays adaptation because the green point lies above the upper asymptote of the hourglass. The red neuron displays decompensation because the red point lies just below the lower asymptote of the hourglass. (C), dependence of (ΔpHi)1 (black circles) or (ΔpHi)2 (white squares) on the initial pHi before MAc1 and MAc2, respectively. The solid and dashed lines represent the linear regressions for MAc1 and MAc2, respectively. (D), frequency distribution of (ΔpHi)1/MAc (black bars) and (ΔpHi)2/MAc (white bars) with a pHi bin width of 0.05 pH units. In the upper left, we report means ± standard deviation as well as the p-value (paired t-test, two-tails). In the upper right, we report n, number of neurons; N, number of cover slips;
Figure 3B is the basis for three analyses, identified below as #1 (State), #2 (Behavior), and #3 (d±). The first two are based on approaches of Salameh et al. (2014) as defined in Methods. The third is novel to the present paper Figure 3A shows how 95 individual neurons (n = 95, N = 28,
Analysis #1 state
As noted in Methods, we can represent state by the position of a cell with respect to the vertical dashed blue line (the resistant-sensitive demarcation for MAc1) and the horizontal dashed blue line (the resistant-sensitive demarcation for MAc2). The two dashed blue lines define four “quadrants”, QI through QIV. As we will see below, the position of a neuron in one of the four quadrants describes how the state of the neuron changes3 (or does not change) in the progression from MAc1 to MAc2.
Consistent with our analysis of Figure 1 (a data set of 235 neurons that includes the 95 here), we see here in Figure 3B that a minority of the neurons (19/95 or 20%) lie to the right of the vertical dashed line. That is, according to the definition of Salameh et al. (2014), the state of these neurons during MAc1 is MAc resistant; the left side of Table 3A provides a numerical summary of these neurons. The majority (80%) of neurons, however, lie to the left of the vertical dashed line; that is, their state is sensitive during MAc1 (Table 3A, right). The remainder of Table 3 summarizes the state transition from MAc1 to MAc2 (Table 3B), the behavior (i.e., adaptation, consistency, decompensation) between MAc1 and MAc2 (Table 3C), and the state during MAc2 (Table 3D). During the second MAc challenge, 33 of 95 or 35% of the neurons lie above the horizontal dashed line in Figure 3B; that is, these neurons are resistant during MAc2, as also summarized in Table 3D/left. On the other hand, 65% lie below this line (Table 3D/right) and are therefore MAc2 sensitive. Note that the distribution of MAc-resistant to MAc-sensitive neurons is 35%/65% during MAc2, compared to 20%/80% during MAc1. That is, from MAc1 to MAc2, we see a general trend toward MAc resistance.
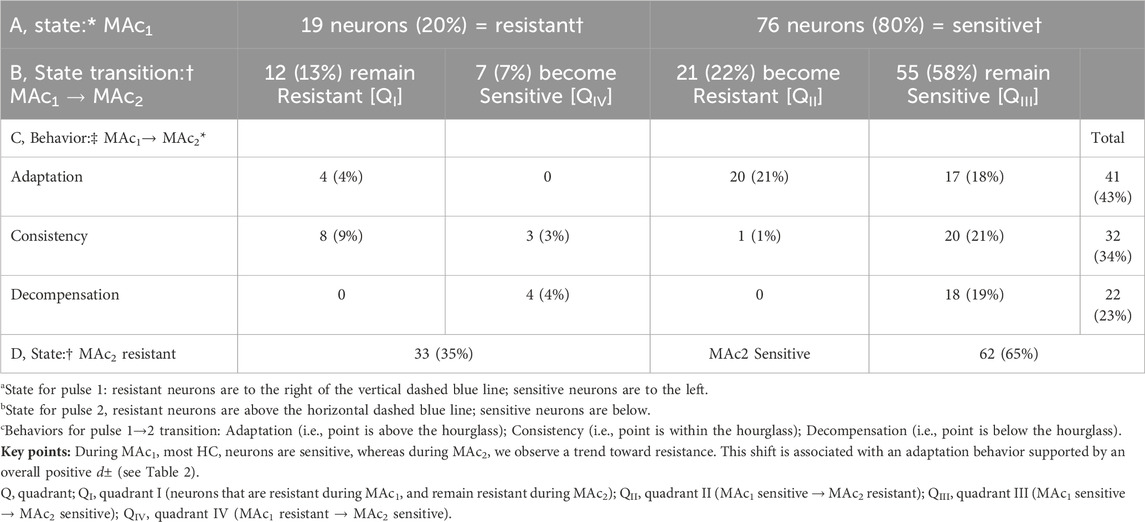
Table 3. State and behavior of 95 hippocampal neurons during twin pulses of metabolic acidosis (MAc).
Table 3B traces the fates (i.e., behavior) of the neurons identified as resistant or sensitive during MAc1:
• Of the 19 neurons identified as resistant during MAc1, 12 remain resistant during MAc2. By definition, these 12 MAc1-resistant/MAc2-resistant neurons all lie in the first quadrant (QI, upper right) in Figure 3B.
• Of the seven previously resistant neurons become sensitive during MAc2 and therefore lie in QIV (lower right), which contains all MAc1-resistant/MAc2-sensitive neurons.
• Of the 76 neurons identified as sensitive during MAc1, 55 remain sensitive during MAc2, and thus lie in QIII, (lower left), which contains all MAc1-sensitive/MAc2-sensitive neurons.
• Finally, 21 of the 76 become resistant and thus lie in QII (upper left), which contains all MAc1-sensitive/MAc2-resistant neurons.
Thus, of the 33 neurons resistant during MAc2 (Table 3D), only 12 were originally resistant in MAc1, whereas 21 more were sensitive during MAc1 but became resistant. Similarly, of the 62 neurons identified as sensitive during MAc2 (Table 3D), 55 were sensitive during MAc1, and seven others that were resistant during MAc1 became sensitive. Thus, although shifts in state are not uncommon—the more common being from MAc1-sensitive to MAc2-resistant (i.e., QII) rather than from MAc1-resistant to MAc2- sensitive (i.e., QIV)—neurons tend to maintain their resistant/sensitive state-phenotypes between MAc1 and MAc2 (i.e., QI and QIII).
For the remainder of Results, we present tabular data analogous to that in Table 3 (see Table 4 through Table 9) but limit the presentation to a few salient features in the table legends. Thus, the above presentation of Table 3 serves as a guide for the six later tables.
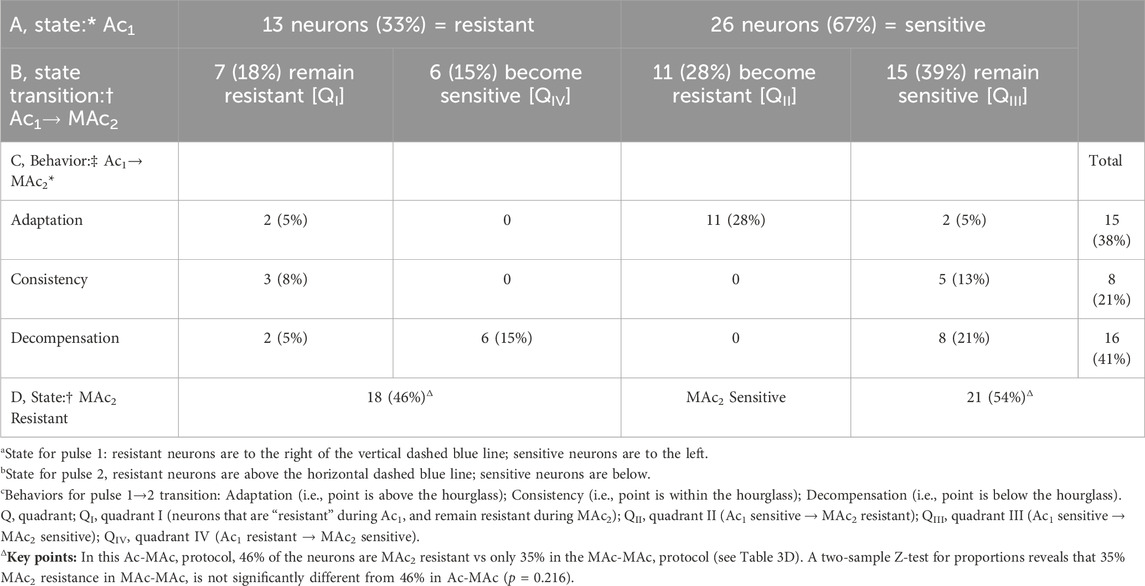
Table 4. State and behavior of 39 hippocampal neurons during exposure to extracellular acidosis (Ac) and metabolic acidosis (MAc).
Analysis #2: Behavior (i.e., hourglass)
The second approach for examining the data in Figure 3B is the hourglass analysis of behavior, introduced by Salameh et al. (2014) and summarized in Methods4, as well as the legend of Figure 3. Table 3C lists the behaviors of the 95 neurons. For example, of the 12 MAc1-resistant/MAc2-resistant neurons that lie in QI, four lie above the hourglass (bronze arrows in Figure 3B); that is, their behavior is adaptation. The other eight neurons lie within the hourglass; their behavior is consistency. None of these 12 neurons lie below the hourglass; that is, none has a decompensation behavior.
In the rightmost column of Table 3C, we summarize the behaviors of all 95 neurons. For example, 41 of 95 neurons or 43%—including the one represented by the green point here and the green record in panel A—lie above the hourglass. These 41 neurons have an adaptation behavior. In fact, seven of these 41 points lie at least ∼0.02 pH units above the x-axis; that is, these neurons adapted to such an extent that they exhibit a frank alkalinization during MAc2. Table 3C also shows that 32 of 95 or 34% of the neurons—including the one represented by the blue point and record—lie within the hourglass; that is, their behavior is consistent between MAc1 and MAc2. Finally, 22 of 95 or 23% of the neurons—including the one represented by the red point and record—lie below the hourglass; that is, these neurons exhibit a decompensation behavior between MAc1 and MAc2. Note that four of these decompensating neurons were MAc1 resistant but MAc2 sensitive, whereas 18 were MAc1 sensitive and remained sensitive during MAc2 (albeit with a greater magnitude of ΔpHi).
Analysis #3: d±
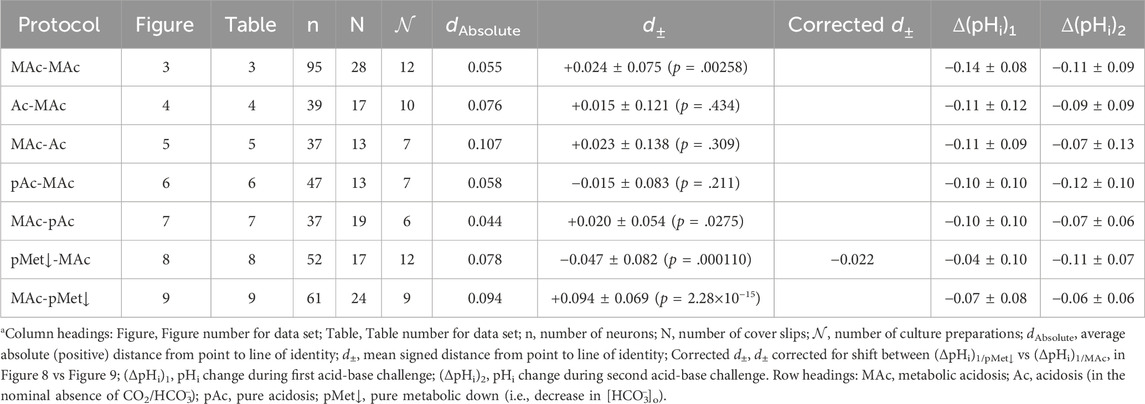
The third analysis, which we introduce in the present paper is actually two closely related calculations. In the first, we compute the mean absolute distance (dAbsolute) between each neuron-point to the nearest point5 on the line of identity (LOI). All dAbsolute values are positive. We indicate this relationship in Figure 3B with the gold line segment between one neuron in QIII and the LOI. For each protocol, the mean dAbsolute value is in the seventh column of Table 2. In the second calculation, we compute the mean signed distance (d±). Individual values are positive if the corresponding point lies to the upper left of the LOI (as for the gold line segment in Figure 3B)—this is analogous to adaptation behavior, but does not take into account the confidence interval represented by the hourglass. Individual values are negative if the corresponding point lies to the lower right of the LOI analogous to decompensation behavior. Mean d± values for each protocol are in the eighth column of Table 2. For this MAc-MAc protocol, the mean d± is ∼ +0.024 (p = .00258; Table 2, row 1), which indicates that the average point is significantly to the upper-left of the LOI, consistent with an overall tendency toward an adaptation behavior.
ΔpHi vs initial pHi
To determine whether the pHi just before MAc1 or MAc2 correlates with the ΔpHi during the subsequent MAc, in Figure 3C we plot ΔpHi vs the initial pHi for both MAc pulses. As described above for Figure 2B, taking all 95 points together, we find the overall correlation strength to be “absent” (see Methods6), both between (ΔpHi)1 and (pHi)1 (filled circles; R2 = 0.12), and between (ΔpHi)2 and (pHi)2 (open squares; R2 = 0.007).
Returning to Figure 3A, we see that the red record is from a neuron in which (ΔpHi)1 was relatively large, and for which the pHi recovery from MAc1 was small, so that (pHi)2 was substantially lower than (pHi)1. Indeed, our analysis (not shown) of the 95 neurons in Figure 3 shows a weak correlation (R2 = 0.36) between (ΔpHi)1 and the difference [(pHi)2 – (pHi)1]. That is, as the acidification during MAc1 increases in magnitude, (pHi)2 tends to fall increasingly below (pHi)1.
Frequency distributions
Figure 3D shows the frequency distributions of ΔpHi for both MAc1 and MAc2 and reveals a statistically significant shift to the right (i.e., smaller negative ΔpHi values, larger positive ones) between MAc1 and MAc2. This result is consistent with an overall trend to adaptation and the observed positive value of d±. Note that this traditional histogram cannot capture the rich diversity among neurons, as revealed in Figures 3B, C and Table 3.
Summary of MAc-MAc
Most rat HC neurons have a MAc-sensitive “state”, both during MAc1 and MAc2 (QIII). From MAc1 to MAc2, the neurons tend to show adaptation-like “behavior”, being both above the hourglass and having a positive d±.
Extracellular acidosis in the absence of CO2/HCO3− (Ac) and then MAc
To begin exploring the role of ΔpHo per se in producing the ΔpHi observed during MAc, we examine neurons exposed to a CO2/HCO3−-free solution at pH 7.40 (solution 1, Table 1) and then subject the neurons—in the continuing absence of CO2/HCO3−—to extracellular acidosis (Ac; pHo 7.20; solution 4, Table 1). To compare this Ac-induced pHi response with our previous MAc data, we return the neurons to the pH-7.4 solution 1, then switch to our standard CO2/HCO3− solution (solution 2, Table 1), and then finally impose a standard MAc (solution 3, Table 1).
Nomenclature
We do not expect the response to Ac—or other single-parameter challenges presented later—to be the same as the response to MAc. Ac, for one, occurs in the nominal absence of CO2 and HCO3−, where minimal CO2 or HCO3− is present for sensing or effector mechanisms (e.g., transport of HCO3−-related species). Moreover, we do not expect the response to the twin challenge Ac-MAc—and other twin challenges presented later—to be the same as the response to MAc-MAc. Nevertheless, for the sake of consistent comparisons, we analyze them all as we do for MAc-MAc. Thus, we will use terms like “resistant” and “adaptation” the same way as we use them for MAc and MAc-MAc, respectively, understanding that this use is for our convenience and does not necessarily imply equivalence of the physiological challenges.
Sample pHi records
Figure 4A shows the pHi responses of three neurons to the aforementioned protocol. We focus first on the blue record. Imposing Ac1 (first challenge) produces a slow decrease in pHi, the final magnitude of which is (ΔpHi)1/Ac. Returning pHo to 7.40 produces a slow pHi recovery, presumably due to Na-H exchange (Baxter and Church, 1996; Bevensee et al., 1996). Adding CO2/HCO3− (downward blue arrow) produces a rapid pHi decrease due to CO2 influx, followed by a brisk pHi recovery due to acid extrusion mediated to some extent by Na-H exchangers, but predominantly by Na+-coupled HCO3− transporters (Schwiening and Boron, 1994; Baxter and Church, 1996; Bevensee et al., 1996). Here, the evidence that HCO3− transport is dominant is the far more rapid pHi-recovery in the presence of CO2/HCO3−, even though total intracellular buffering power must have been far higher in CO2/HCO3− (Roos and Boron, 1981; Boron, 2004). The subsequent MAc2, like the preceding Ac1, produces a slow pHi decline; the pHi change—(ΔpHi)2/MAc—is approximately the same magnitude as (ΔpHi)1/Ac.
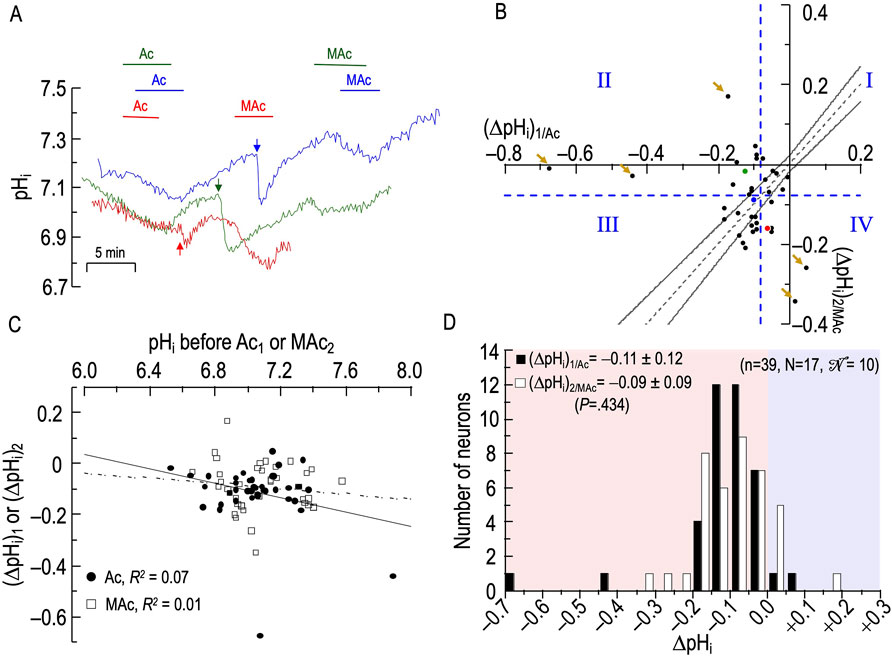
Figure 4. Effect extracellular acidosis (Ac) followed by metabolic acidosis (MAc) on the pHi of rat hippocampal neurons (A), examples of the pHi responses in three hippocampal neurons to an exposure to Ac (solution 4, Table 1) and then to MAc (solution 3, Table 1). Before the arrows, unless otherwise indicated, the bath solution was our standard nominally CO2/HCO3−-free solution (solution 1, Table 1). After the arrows, unless otherwise indicated, the bath solution was standard CO2/HCO3− (solution 2, Table 1). (B), relationship between the ΔpHi during exposure to Ac—that is, (ΔpHi)1/Ac—and ΔpHi during exposure to MAc—that is, (ΔpHi)2/MAc. The horizontal and vertical dashed blue lines are the resistant-sensitive demarcations that define quadrants I–IV and “pHi states” (see Figure 3). The blue dot that represents the blue neuron in panel A is in QIII (i.e., neuron is both Ac1 sensitive and MAc2 sensitive). The green dot is in QII (i.e., green neuron in panel A is Ac1 sensitive but MAc2 resistant). The red dot is in QIV (i.e., red neuron in panel A is Ac1 resistant but MAc2 sensitive). The five bronze arrows indicate neurons that are particularly distant from the hourglass. Moreover, all five are either near or paradoxically above the x-axis, or to the right of the y-axis. The dashed gray line is the line of identity; the gray hourglass represents the confidence interval and defines “pHi behavior” (see Figure 3). Because the blue point lies within the hourglass, the behavior of the blue neuron is consistency. The green point lies above the upper asymptote of the hourglass; the behavior is adaptation. The red neuron lies below the lower asymptote of the hourglass; the behavior is decompensation. (C), dependence of (ΔpHi)1 (black circles) on the initial pHi before Ac1, which we refer to as (ΔpHi)1/Ac, or dependence of (ΔpHi)2 (white squares) on the initial pHi before and MAc2, which we refer to as (ΔpHi)2/MAc. The solid and dashed lines represent the linear regressions for Ac1 and MAc2, respectively. (D), frequency distribution of (ΔpHi)1/Ac (black bars) and (ΔpHi)2/MAc (white bars) with a pHi bin width of 0.05 pH units. In the upper left, we report means ± standard deviation as well as the p-value (paired t-test, two-tails). n, number of neurons; N, number of cover slips;
The green and red traces in Figure 4A represent two other neurons. Note that, whereas the pHi response to MAc generally results in a clear shift in steady-state pHi (see Figure 3A), the response to Ac often results in a continuous downward drift in pHi. Thus, our (ΔpHi)1/Ac values do not necessarily reflect a shift in steady-state pHi per se, but an evolving pHi change over a time period similar to that in MAc challenges. We present these Ac1 data so that the reader may be aware that pHo changes under non-physiological conditions often lead to unexpected consequences. The pHi data for MAc2 are rather nominal except for the red trace, which may have been drifting downward just before the MAc2 challenge.
Analyses #1–3
Figure 4B and Table 4 summarize state and behavior for the full Ac-MAc dataset (n = 39, N = 17,
The blue point, which corresponds to the neuron represented by the same color in Figure 4A, lies in QIII (i.e., its “state” fulfills the MAc criteria for Ac1 sensitivity and is MAc2 sensitive) and falls within the hourglass, near the LOI (its “behavior” fulfills the MAc-MAc criteria for consistency (see Figures 3A,B).
The green point lies in QII (i.e., its states are Ac1 sensitive but MAc2 resistant), and above the hourglass (i.e., behavior is adaptation).
The red point lies in QIV (i.e., states are Ac1 resistant and MAc2 sensitive), and just outside of the lower bound of the hourglass (i.e., behavior is decompensation).
The d± of +0.015 (Table 2, row 2) is not significantly different from zero, consistent with our subjective impression of a general clustering near the hourglass.
ΔpHi vs initial pHi
Figure 4C shows that the correlation strengths, taking all 39 points together, were “absent” for both (ΔpHi)1/Ac vs (pHi)1, and for (ΔpHi)2/MAc vs (pHi)2.
Frequency distributions
Figure 4D shows the frequency distributions of ΔpHi for both Ac1 and MAc2. Unlike the situation for MAc-MAc (see Figure 3D), (ΔpHi)2 is not significantly different from (ΔpHi)1 in the Ac-MAc protocol. Note that the MAc response during pulse two in the Ac-MAc protocol (ΔpHi)2/MAc = −0.09 ± 0.09 (see Figure 4D) is not significantly different from its counterpart in the MAc-MAc protocol ((ΔpHi)2/MAc = −0.11 ± 0.09, p = 0.333, unpaired t-test, in Figure 3D).
Summary of Ac-MAc
Ac1 often causes a slow, continuing decline in pHi, and—compared to MAc-MAc—has a negligible effect on (ΔpHi)2/MAc.
MAc and then Ac
In this new experimental series, we reverse the order of the challenges in Figure 4, exposing the neurons first to MAc then to Ac (in absence of CO2/HCO3−).
Sample pHi records
Figure 5A shows three examples of pHi responses of HC neurons during an exposure to MAc and then to Ac. Focusing first on the blue record, we see that the neuron responds to MAc1 with a modest acidification. Unexpectedly, the removal of CO2/HCO3− (blue arrow in Figure 5A; solution 2 → solution 1; Table 1) does not elicit the usual abrupt pHi increase due to CO2 efflux. It is possible that strong AE3 activity (Salameh et al., 2017) produced a HCO3− efflux that nullified the pHi effects of CO2 efflux. In the continued absence of CO2/HCO3−, imposing Ac2 produces a slow but sustained pHi decrease. It is not clear whether this pHi decrease would have subsided, had we extended the Ac exposure.8 Restoring pHo 7.40 produces the expected pHi recovery.
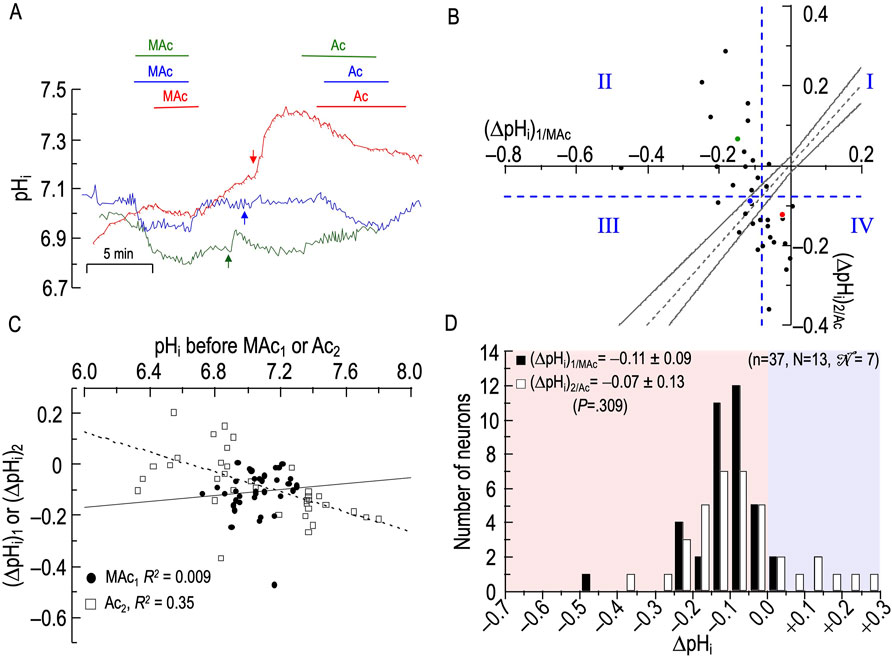
Figure 5. Effect of metabolic acidosis (MAc) followed by extracellular acidosis (Ac) on the pHi of rat hippocampal neurons (A), examples of the pHi responses in three hippocampal neurons to an exposure to MAc (solution 3, Table 1) and then to Ac (solution 4, Table 1). Before the arrows, unless otherwise indicated, the bath solution was standard CO2/HCO3− (solution 2, Table 1 After the arrows, unless otherwise indicated, the bath solution was our standard nominally CO2/HCO3−-free solution (solution 1; Table 1). (B), relationship between the ΔpHi during exposure to MAc—that is, (ΔpHi)1/MAc—and ΔpHi during exposure to Ac—that is, (ΔpHi)2/Ac. The horizontal and vertical dashed blue lines are the resistant-sensitive demarcations that define quadrants I–IV and “pHi states” (see Figure 3). The blue dot that represents the blue neuron in panel A is in QIII (i.e., neuron is both MAc1 sensitive and Ac2 sensitive). The green dot is in QII (i.e., green neuron in panel (A) is MAc1 sensitive but Ac2 resistant). The red dot is in QIV (i.e., red neuron in panel (A) is MAc1 resistant but Ac2 sensitive). Note that, for the green neuron, (ΔpHi)2/Ac is paradoxically positive. The dashed gray line is the line of identity; the gray hourglass represents the confidence interval and defines “pHi behavior” (see Figure 3). Because the blue point lies within the hourglass, the behavior of the blue neuron is consistency. The green point lies above the upper asymptote of the hourglass; the behavior is adaptation. The red neuron lies below the lower asymptote of the hourglass; the behavior is decompensation. (C), dependence of (ΔpHi)1 (black circles) on the initial pHi before MAc1, which we refer to as (ΔpHi)1/MAc, or dependence of (ΔpHi)2 (white squares) on the initial pHi before and Ac2, which we refer to as (ΔpHi)2/Ac. The solid and dashed lines represent the linear regressions for MAc1 and Ac2, respectively. (D), frequency distribution of (ΔpHi)1/MAc (black bars) and (ΔpHi)2/Ac (white bars) with a pHi bin width of 0.05 pH units. In the upper left, we report means ± standard deviation as well as the p-value (paired t-test, two-tails). n, number of neurons; N, number of cover slips;
The neuron represented by the green record has a larger response to MAc1, a small pHi recovery after removal of MAc, and a modest pHi increase due to CO2 efflux upon removal of CO2/HCO3−. Ac2 paradoxically causes a frank alkalinization. The red record slowly approaches a stable pHi in CO2/HCO3−, and MAc1 elicits only a small pHi decrease, the magnitude of which we may have slightly underestimated because pHi may not have been entirely stable before the MAc1. Nevertheless, the return to pHo 7.40 in CO2/HCO3− elicits a robust pHi increase. The subsequent removal of CO2/HCO3− produces a very large pHi increase (perhaps reflecting a low AE3 activity), and the Ac2 challenge leads to a slow, seemingly interminable pHi decrease. Removing Ac2 does not elicit a pHi recovery, at least in the brief time allotted. We present these Ac2 data so that the reader may be aware that pHo changes under non-physiological conditions often lead to unexpected consequences.
Analyses #1–3
Figure 5B and Table 5 summarize state and behavior for the full MAc-Ac dataset (n = 37, N = 13,
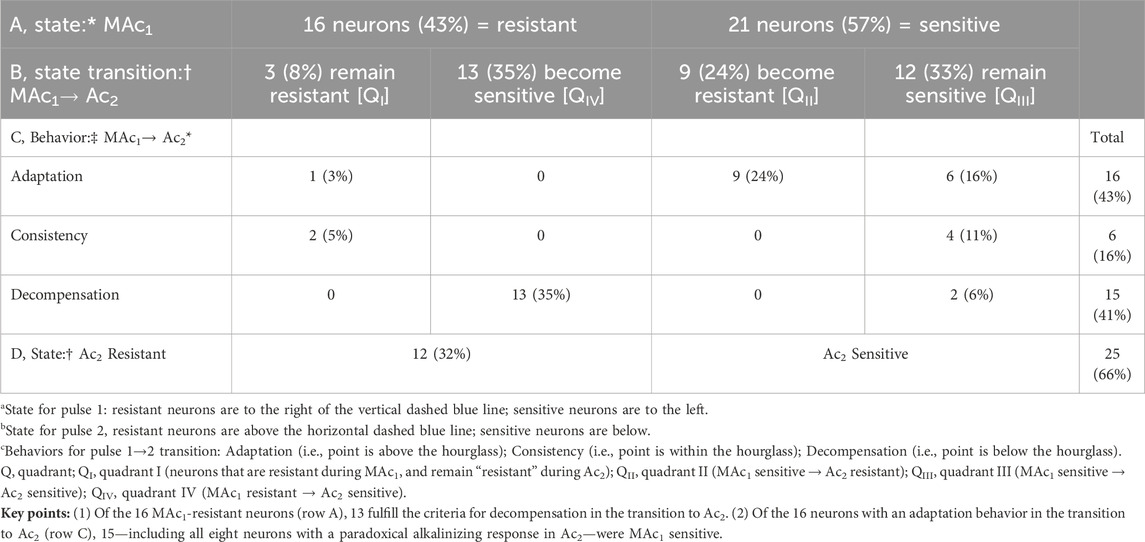
Table 5. State and behavior of 37 hippocampal neurons during exposure to metabolic acidosis (MAc) and extracellular acidosis (Ac).
The blue point lies in QIII (i.e., states are MAc1 and Ac2 sensitive), and within the hourglass (i.e., behavior is consistency).
The green point lies in QII (i.e., states are MAc1 sensitive but Ac2 resistant), and well above the hourglass (i.e., behavior is adaptation). In fact, this is one of eight neurons that fall at least 0.02 above the x-axis. This frequency of frank alkalinization during Ac2 (8 of 37 neurons = 19%) is far higher than for Ac1 in Figure 4B (2 of 39 = 5% are to the right of the y-axis). Thus, the MAc1 pretreatment promotes paradoxical alkalinization during Ac2—a theme that repeats itself below when MAc1 precedes pAc2 or pMet↓2. Because the extracellular solution is nominally free of CO2/HCO3−, Na-H exchange most likely mediates this paradoxical alkalization, to the extent that it is opposed by background acid loading (Bevensee and Boron, 2013).
The red point in Figure 5B lies in QIV (i.e., states are MAc1 resistant but Ac2 sensitive), and below the hourglass (i.e., behavior is decompensation).
The d± of +0.023 (Table 2, row 3) reveals a trend toward adaptation. However, this is not significantly different from zero because the SD of 0.138 is so large, consistent with our subjective impression of a broad dispersion of neurons from QII to QIV.
ΔpHi vs initial pHi
Figure 5C reveals a correlation strength, taking all 52 points together, of “absent” between (ΔpHi)1/MAc and (pHi)1. The weak correlation strength between (ΔpHi)2/Ac and (pHi)2 is consistent with a greater acidification for neurons with a higher pre-Ac2 pHi.
Frequency distributions
Figure 5D shows the frequency distributions of ΔpHi for both MAc1 and Ac2. Although the Ac2 distribution tends to shift to the right, the difference is not statistically significant.
Summary of MAc-Ac
With some neurons, Ac2 causes seemingly continuous pHi decreases and strong decompensating behavior. In others, perhaps primed by the preceding MAc1, Ac2 leads to strong adaptive behavior and often frank, paradoxical alkalinization.
An isolated pHo decrease (pAc) and then MAc
A limitation of the Ac-MAc and MAc-Ac studies is that the absence of CO2/HCO3− during the fall of pHo could limit both the sensor and effector arms of any cellular response. To gain further understanding on the behavior of HC neurons during extracellular acid-base challenges, in the remainder of the present paper we exploit CO2/HCO−3 out-of-equilibrium solutions to modify only one parameter of the Henderson-Hasselbalch equation. First, we use OOE technology to lower pHo to 7.20—the same acidification that we achieve during MAc—while maintaining a stable [CO2]o and [HCO−3]o. This pure acidosis protocol begins with neurons bathed in our standard CO2/HCO3− solution, followed by challenges first with pAc (solution 5, Table 1) and then with MAc.
Sample pHi records
Figure 6A shows three pHi responses of HC neurons. The blue trace represents a neuron with modest acidification responses to pAc and MAc.
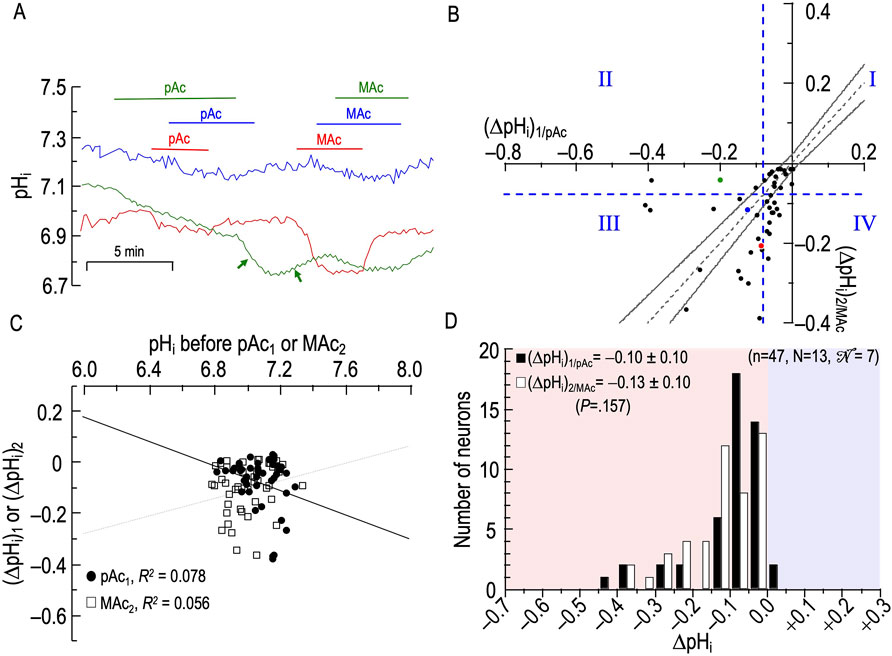
Figure 6. Effect of an isolated decrease of pHo (pAc) followed by metabolic acidosis (MAc) on the pHi of rat hippocampal neurons (A), examples of the pHi responses in three hippocampal neurons to an exposure to pAc (solution 5, Table 1), and then to MAc (solution 3, Table 1). Unless otherwise indicated, the bath solution was standard CO2/HCO3− (solution 2, Table 1). The green arrows following pAc removal indicate an initial anomalous pHi decrease (left) followed by the expected but delayed pHi increase (right). (B), relationship between the ΔpHi during exposure to pAc—that is, (ΔpHi)1/pAc—and ΔpHi during exposure to MAc—that is, (ΔpHi)2/MAc. The horizontal and vertical dashed blue lines are the resistant-sensitive demarcations that define quadrants I–IV and “pHi states” (see Figure 3). The blue dot that represents the blue neuron in panel A is in QIII (i.e., neuron is both pAc1 sensitive and MAc2 sensitive). The green dot is in QII (i.e., green neuron in panel A is pAc1 sensitive but MAc2 resistant). Because the red dot is slightly to the left of the vertical dashed blue line, it is in QIV (i.e., red neuron in panel A is both pAc1 sensitive and MAc2 sensitive). The dashed gray line is the line of identity; the gray hourglass represents the confidence interval and defines “pHi behavior” (see Figure 3). Because the blue point lies within the hourglass, the behavior of the blue neuron is consistency. The green point lies above the upper asymptote of the hourglass; the behavior is adaptation. The red neuron lies below the lower asymptote of the hourglass; the behavior is decompensation. (C), dependence of (ΔpHi)1 (black circles) on the initial pHi before pAc1, which we refer to as (ΔpHi)1/pAc, or dependence of (ΔpHi)2 (white squares) on the initial pHi before and MAc2, which we refer to as (ΔpHi)2/MAc. The solid and dashed lines represent the linear regressions for pAc1 and MAc2, respectively. (D), frequency distribution of (ΔpHi)1/pAc (black bars) and (ΔpHi)2/MAc (white bars) with a pHi bin width of 0.05 pH units. In the upper left, we report means ± standard deviation as well as the p-value (paired t-test, two-tails). N, number of neurons; N, number of cover slips;
The green trace represents a neuron in which pAc1 elicits a modestly rapid pHi decline that shows no sign of abating. The removal of the pAc challenge, rather than heralding a pHi recovery, initially produces an even more rapid acidification (first green arrow); we observed this pattern, though less dramatically, in four other neurons. Eventually, pHi spontaneously reverses direction and rises fairly rapidly (second green arrow); we observed this pattern only in this neuron. Finally, the subsequent MAc2 challenge in the green neuron now elicits only a small pHi decrease. It is possible that the spontaneous reversal of the pHi decline (green arrow) is adaption in the making.
Finally, the red trace represents a neuron that displays a small acidification during pAc1 but acidifies markedly during the subsequent MAc2.
Analyses #1–3
Figure 6B and Table 6 summarize state and behavior for the full pAc-MAc dataset (n = 47, N = 13,
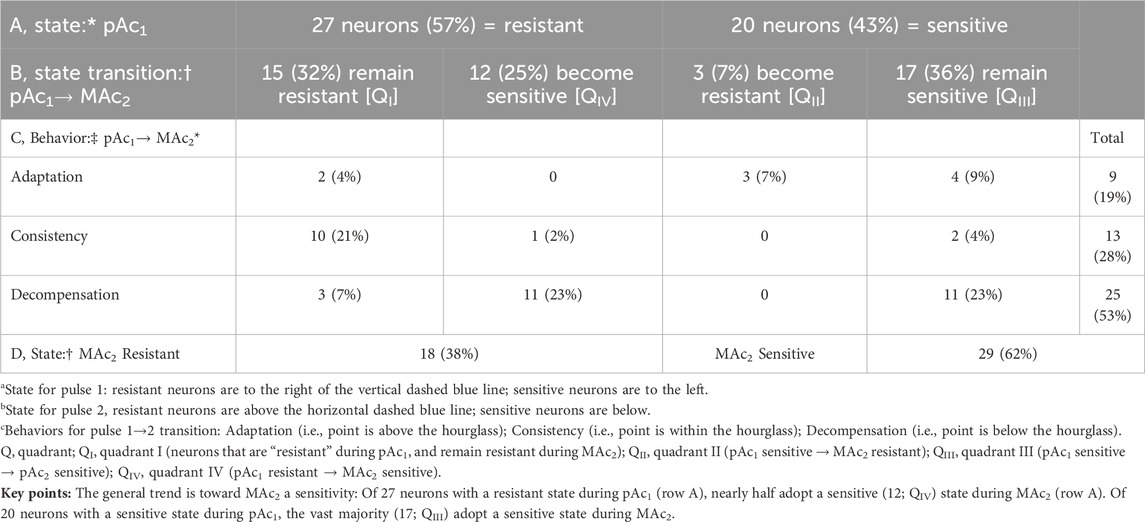
Table 6. State and behavior of 47 hippocampal neurons during exposure to isolated decrease of pHo (pAc) and metabolic acidosis (MAc).
The blue point lies in QIII (i.e., states are pAc1 and MAc2 sensitive), and nearly on the gray dashed line within the hourglass (i.e., behavior is consistency).
The green point lies in QII (i.e., states are pAc1 sensitive but MAc2 resistant), and well above the hourglass (i.e., behavior is adaptation).
The red point lies in QIII, just to the left of the vertical dashed blue line (i.e., states are barely pAc1 sensitive but solidly MAc2 sensitive), and below the hourglass (i.e., behavior is decompensation).
Although the mean d± of −0.015 (Table 2, row 4) trends toward decompensation, this value is not significantly different from zero.
ΔpHi vs initial pHi
Figure 6C reveals correlation strengths, taking all 47 points together, of “absent” both between (ΔpHi)1/pAc and (pHi)1, and between (ΔpHi)2/MAc and (pHi)2.
Frequency distributions
Figure 6D summarizes the distribution of ΔpHi during the two conditions, and shows that, although we see a tendency for a leftward shift during the second challenge, (ΔpHi)2/MAc is not significantly different from(ΔpHi)1/pAc.
Summary of pAc-MAc
pAc1 generally produces a small acidification (resistant “state”), followed during MAc2 by a trend toward decompensation.
MAc and then pAc
In this experimental series, we invert the sequence of exposure from the previous protocol, challenging neurons first with MAc then with pAc.
Sample pHi records
Figure 7A shows three pHi responses of HC neurons. The blue pHi trace represents a neuron that exhibits almost no change in pHi during MAc1 exposure, and acidifies only slightly during pAc2. The green trace reflects large acidifications during both MAc1 and, to a lesser extent, pAc2. Finally, the red pHi trace reports only a small acidification during MAc1 but a much larger one during pAc2.
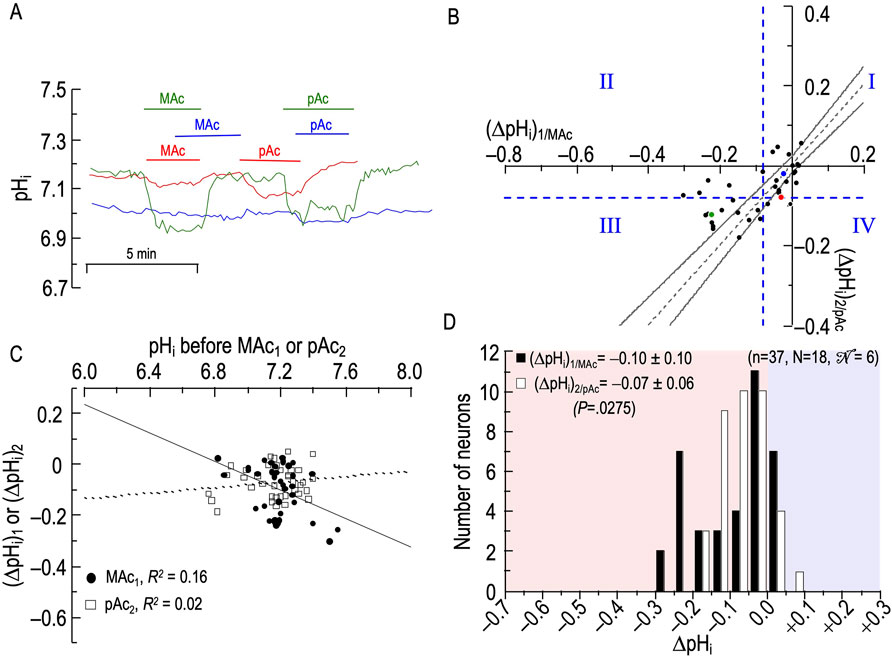
Figure 7. Effect of metabolic acidosis (MAc) followed by pure acidosis (pAc) on the pHi of rat hippocampal neurons (A), examples of the pHi responses in three hippocampal neurons to an exposure to MAc (solution 3, Table 1), and then to pAc (solution 5, Table 1). Unless otherwise indicated, the bath solution was standard CO2/HCO3− (solution 2, Table 1). (B), relationship between the ΔpHi during exposure to MAc—that is, (ΔpHi)1/MAc—and ΔpHi during exposure to pAc—that is, (ΔpHi)2/pAc. The horizontal and vertical dashed blue lines are the resistant-sensitive demarcations that define quadrants I–IV and “pHi states” (see Figure 3). The blue dot that represents the blue neuron in panel A is in QI (i.e., neuron is both MAc1 and pAc2 resistant). The green dot is in QIII (i.e., green neuron in panel A is both MAc1 and pAc2 sensitive). Because the red dot is on the horizontal dashed blue line, it is in QI (i.e., red neuron in panel A is both MAc1 and pAc2 resistant). The dashed gray line is the line of identity; the gray hourglass represents the confidence interval and defines “pHi behavior” (see Figure 3). Because the blue point lies within the hourglass, the behavior of the blue neuron is consistency. The green point lies above the upper asymptote of the hourglass; the behavior is adaptation. The red neuron lies below the lower asymptote of the hourglass; the behavior is decompensation. (C), dependence of (ΔpHi)1 (black circles) on the initial pHi before MAc1, which we refer to as (ΔpHi)1/MAc, or dependence of (ΔpHi)2 (white squares) on the initial pHi before and pAc2, which we refer to as (ΔpHi)2/pAc. The solid and dashed lines represent the linear regressions for MAc1 and pAc2, respectively. (D), frequency distribution of (ΔpHi)1/MAc (black bars) and (ΔpHi)2/pAc (white bars) with a pHi bin width of 0.05 pH units. In the upper left, we report means ± standard deviation as well as the p-value (paired t-test, two-tails). n, number of neurons; N, number of cover slips;
Analyses #1–3
Figure 7B and Table 7 summarize state and behavior for the full MAc-pAc dataset (n = 37, N = 18,
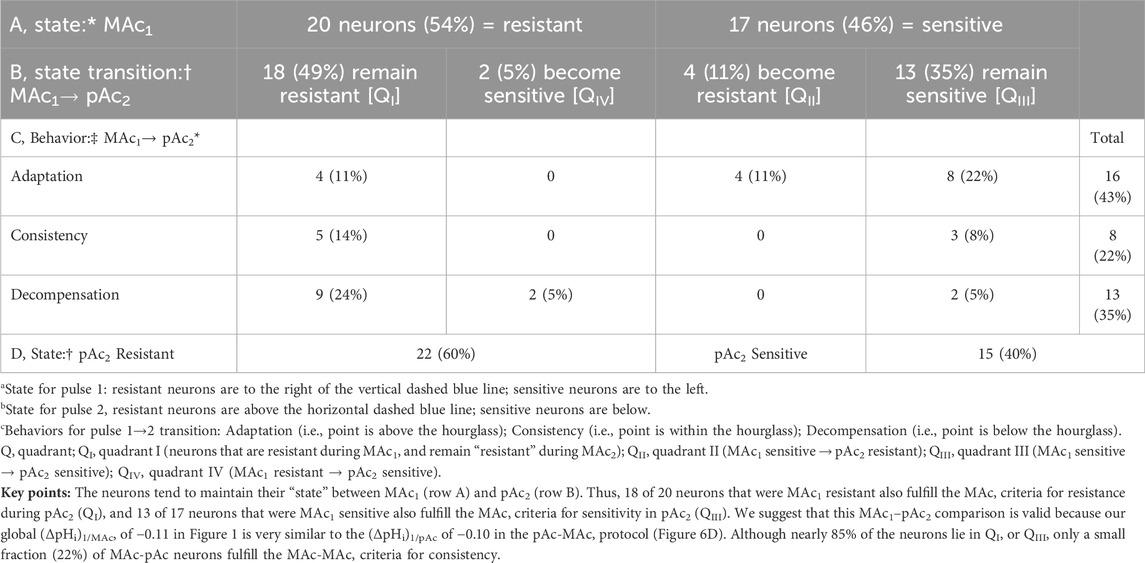
Table 7. State and behavior of 37 hippocampal neurons behavior during metabolic acidosis (MAc) and to an isolated decrease of pHo (pAc) exposure.
The blue point lies in QI (i.e., states are both MAc1 and pAc2 resistant), and virtually on the LOI within the hourglass (i.e., behavior is consistency).
The green point lies in QIII (i.e., states are both MAc1 and pAc2 sensitive), and above the hourglass (i.e., behavior is adaptation).
The red point lies on the QI/QIV boundary (i.e., states are MAc1 resistant and barely pAc2 resistant), and just below the hourglass (i.e., behavior is decompensation).
Consistent with our subjective impression of a predominance of adaptation (i.e., a plurality of neurons lying above the hourglass), the mean d± is +0.020 (Table 2, row 5), a value significantly different from zero (p = .0275).
ΔpHi vs initial pHi
Figure 7C shows correlation strengths, taking all 37 points together, of “absent”, both for (ΔpHi)1 vs (pHi)1, and for (ΔpHi)2 vs (pHi)1.
Frequency distributions
Figure 7D shows that the mean (ΔpHi)2/pAc is less than the mean (ΔpHi)1/MAc, and that the difference is statistically significant.
Summary of MAc-pAc
Following MAc1, pAc2 tends to produce relatively small acidifications.
An isolated decrease in [HCO3−]o (pMet↓) and then MAc
In the two previous experimental series, we explored the effects of an isolated decrease of pHo—one component of MAc—on neuronal pHi. In this and the next section, we investigate the effects of the other component of MAc, an isolated decrease of [HCO3−]o. Our approach is to use an OOE CO2/HCO−3 solution to keep [CO2]o and pHo constant as we lower [HCO3−]o to the same extent as we would in a MAc solution. This pure metabolic/decreasing [HCO3−]o (pMet↓) protocol begins with neurons bathed in our standard CO2/HCO3− solution, followed by two challenges, pMet↓ (solution 6, Table 1) and then MAc.
Sample pHi records
Figure 8A shows three responses of HC neurons. The blue trace represents a neuron with a small paradoxical alkalinization in response to pMet↓1—paradoxical because an isolated decrease in [HCO3−]o elicits a rise in pHi and thus (because [CO2]i ≅ [CO2]o) a rise in [HCO3−]i—and a small acidification in response to MAc2. The green trace also reports a paradoxical alkalinization during pMet↓1, followed by almost no change during MAc2. Finally, the red trace again reveals a paradoxical alkalinization during pMet↓1, but then a marked acidification during MAc2.
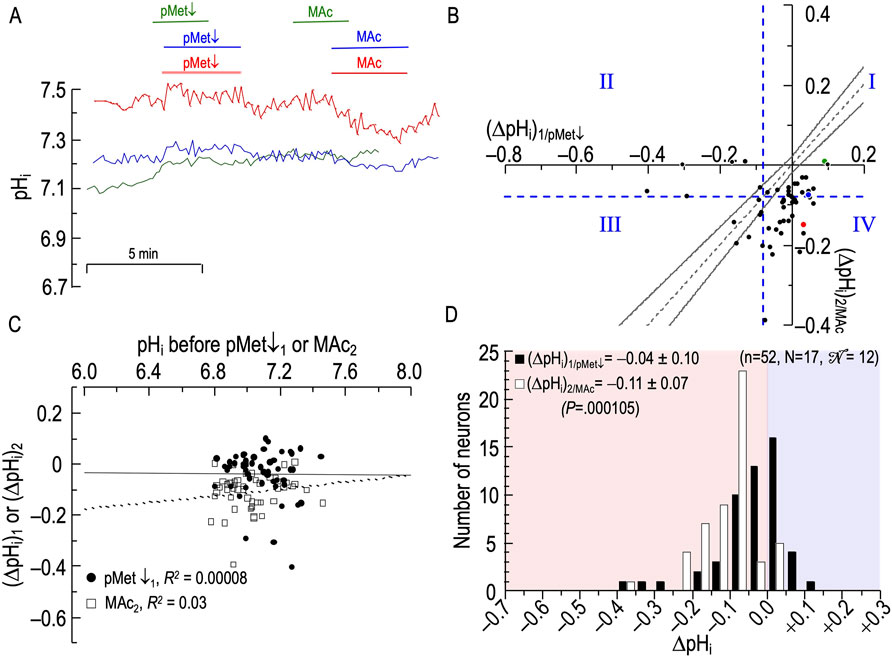
Figure 8. Effect of an isolated decrease of [HCO3−]o (pMet↓) followed by metabolic acidosis (MAc) on the pHi of rat hippocampal neurons (A), examples of the pHi responses in three hippocampal neurons to an exposure to pMet↓ (solution 6, Table 1), and then to MAc (solution 3, Table 1). Unless otherwise indicated, the bath solution was standard CO2/HCO3− (solution 2, Table 1). (B), relationship between the ΔpHi during exposure to pMet↓—that is, (ΔpHi)1/pMet↓—and ΔpHi during exposure to MAc—that is, (ΔpHi)2/MAc. The horizontal and vertical dashed blue lines are the resistant-sensitive demarcations that define quadrants I–IV and “pHi states” (see Figure 3). The blue dot that represents the blue neuron in panel (A) is in QI (i.e., neuron is both pMet↓ and MAc2 resistant). The green dot also is in QI (i.e., green neuron in panel (A) is both pMet↓ and MAc2 resistant). The red dot is in QIV (i.e., red neuron in panel (A) is pMet↓1 resistant but MAc2 sensitive). Note that, for all three neurons, (ΔpHi)1/pMet↓ is paradoxically positive. Additionally, for the green neuron, (ΔpHi)2/MAc is positive. The dashed gray line is the line of identity; the gray hourglass represents the confidence interval and defines “pHi behavior” (see Figure 3). Because the blue, green, and red points all lie below the lower asymptote of the hourglass, the behavior of the three corresponding neurons is decompensation. (C), dependence of (ΔpHi)1 (black circles) on the initial pHi before pMet↓, which we refer to as (ΔpHi)1/pMet↓, or dependence of (ΔpHi)2 (white squares) on the initial pHi before and MAc2, which we refer to as (ΔpHi)2/MAc. The solid and dashed lines represent the linear regressions for pMet↓1 and MAc2, respectively. (D), frequency distribution of (ΔpHi)1/pMet↓ (black bars) and (ΔpHi)2/MAc (white bars) with a pHi bin width of 0.05 pH units. In the upper left, we report means ± standard deviation as well as the p-value (paired t-test, two-tails). n, number of neurons; N, number of cover slips;
Analyses #1–3
Figure 8B and Table 8 summarize the state and behavior for the full pMet↓-MAc dataset (n = 52; N = 17,
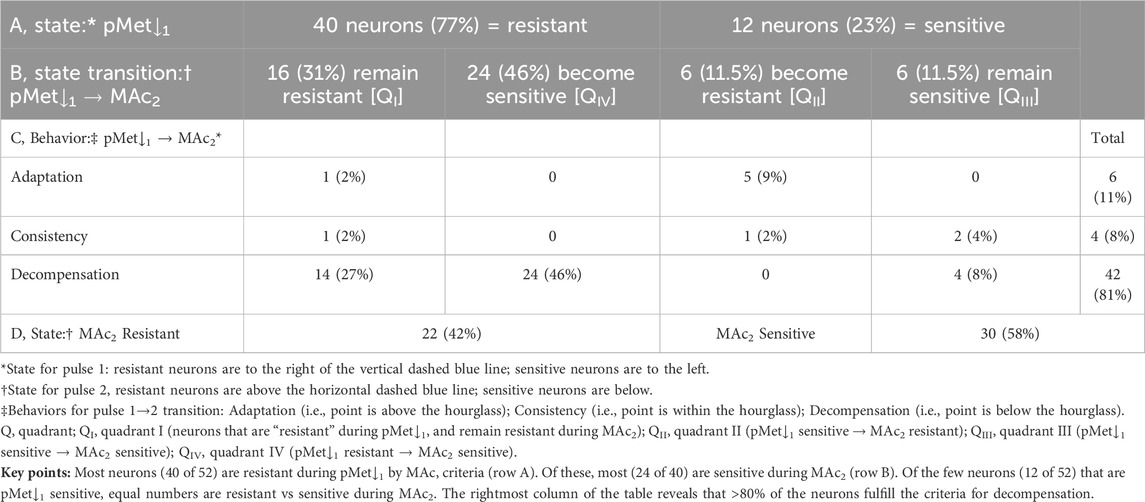
Table 8. State and behavior of 52 hippocampal neurons behavior during an isolated decrease of [HCO−3]o (pMet↓) and MAc exposure.
The most striking characteristic of Figure 8B is that the vast majority of points fall to the right of the vertical dashed blue line, and all but five of 52 neurons lie in or below the hourglass. In other words, in a naïve neuron, pMet↓ produces only small pHi decreases or even paradoxical pHi increases, and the subsequent MAc2 nearly always produces larger pHi decreases that fulfill the criteria for decompensation behavior.
The blue point lies in QI (i.e., states are both pMet↓1 and MAc2 resistant), well below the hourglass (i.e., behavior is decompensation), and lies to the right of the y-axis (i.e., pMet↓1 elicits a paradoxical alkalinization).
The green point, like the blue point, lies in QI (i.e., states are both pMet↓1 and MAc2 resistant) and is below the hourglass (i.e., behavior is decompensation). It is not only to the right of the y-axis, it is just above the x-axis (i.e., pMet↓1 elicits a strong paradoxical alkalinization).
The red point lies in QIV (i.e., states are pMet↓1 resistant but MAc2 sensitive), and well below the hourglass (i.e., behavior is decompensation).
The mean d± is −0.047 (Table 2, row 6), the most strongly negative value (consistent with decompensation) in the present study; this value is significantly different from zero (P ≅ 0.0001).
ΔpHi vs initial pHi
Figure 8C reveals correlation strengths, taking all 52 points together, of “absent” for both (ΔpHi)1/pMet↓ vs (pHi)1, and (ΔpHi)2/MAc vs (pHi)2.
Frequency distributions
Figure 8D shows that the mean (ΔpHi)1/pMet↓ is substantially less than the mean for (ΔpHi)2/MAc, and that the difference is highly significant.
Summary of pMet↓-MAc
pMet↓1 produces the smallest pHi decrease of any first challenge in the present study, and often produces paradoxical pHi increases.
MAc and then pMet↓
In this final experimental series, we reverse the order of pMet↓ and MAc from Figure 8, challenging the neurons first with MAc, and then with pMet↓.
Sample pHi records
Figure 9A shows the remarkable pHi responses of three HC neurons. The blue record is that of a neuron that acidifies slightly in response to MAc1, hardly recovers upon withdrawal of the MAc1 challenge, and then paradoxically alkalinizes during pMet↓2. The green trace shows a large acidification during MAc1 but a modest, paradoxical alkalinization with pMet↓2. Finally, the red trace reports a small, paradoxical alkalinization in response to MAc1, a paradoxical acidification upon removal of the MAc1 challenge, and a large, paradoxical alkalinization during pMet↓2.
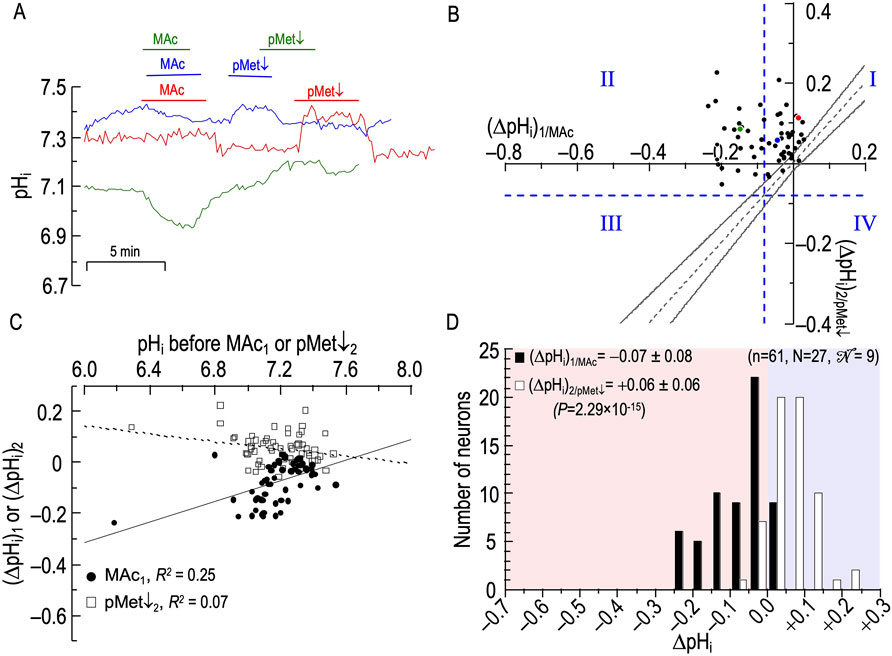
Figure 9. Effect of metabolic acidosis (MAc) followed by pure metabolic/down (pMet↓) on the pHi of rat hippocampal neurons (A), examples of the pHi responses in three hippocampal neurons to an exposure to MAc (solution 3, Table 1), and then to pMet↓ (solution 6, Table 1). Unless otherwise indicated, the bath solution was standard CO2/HCO3− (solution 2, Table 1). (B), relationship between the ΔpHi during exposure to MAc—that is, (ΔpHi)1/MAc—and ΔpHi during exposure to pMet↓—that is, (ΔpHi)2/pMet↓. The horizontal and vertical dashed blue lines are the resistant-sensitive demarcations that define quadrants I–IV and “pHi states” (see Figure 3). The blue dot that represents the blue neuron in panel (A) is in QI (i.e., neuron is both pMet↓ and MAc2 resistant). The green dot is in QII (i.e., green neuron in panel (A) is MAc1 sensitive but pMet↓2 resistant). The red dot is in QI (i.e., red neuron in panel (A) is both MAc1 pMet↓2 resistant). Note that, for all three neurons, (ΔpHi)2/pMet↓ is paradoxically positive. Additionally, for the red neuron, (ΔpHi)1/MAc is positive. The dashed gray line is the line of identity; the gray hourglass represents the confidence interval and defines “pHi behavior” (see Figure 3). Because the blue, green, and red points are all above the upper asymptote of the hourglass, the behavior is adaptation. (C), dependence of (ΔpHi)1 (black circles) on the initial pHi before MAc1, which we refer to as (ΔpHi)1/MAc, or dependence of (ΔpHi)2 (white squares) on the initial pHi before and pMet↓2, which we refer to as (ΔpHi)2/pMet↓. The solid and dashed lines represent the linear regressions for Ac1 and MAc2, respectively. (D), frequency distribution of (ΔpHi)1/MAc (black bars) and (ΔpHi)2/pMet↓ (white bars) with a pHi bin width of 0.05 pH units. In the upper left, we report means ± standard deviation as well as the p-value (paired t-test, two-tails). n, number of neurons; N, number of cover slips;
Analyses #1–3
Figure 9B and Table 9 summarize state and behavior for the full MAc-pMet↓ dataset (n = 61; N = 24,
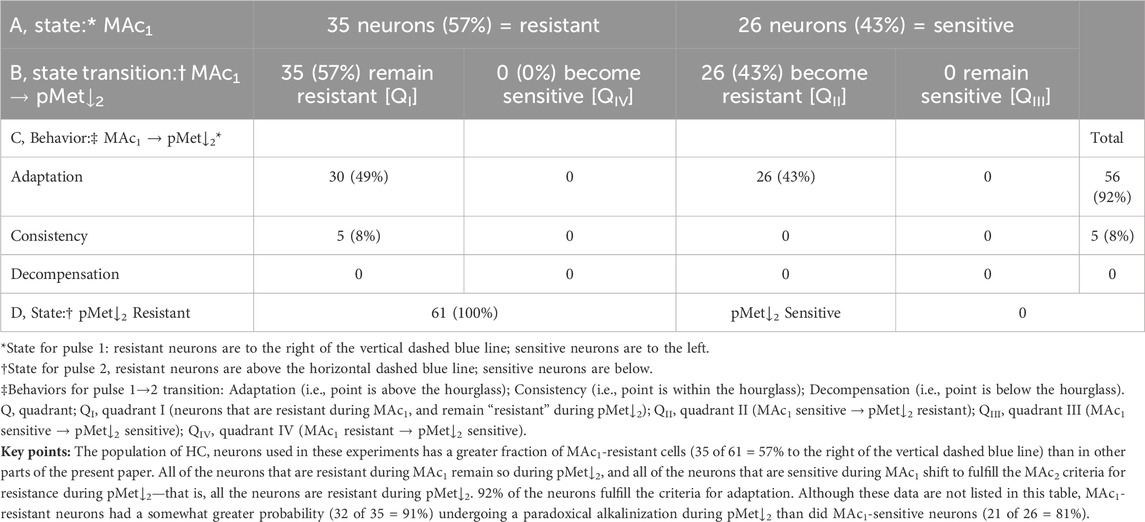
Table 9. State and behavior of 61 hippocampal neurons behavior during exposure to MAc and an isolated decrease of [HCO3−]o (pMet↓).
The most striking aspects of Figure 9B are that few neurons are below the x-axis, and none are below either the horizontal dashed blue line or the hourglass. Thus, MAc pretreatment produces a dramatic alkaline-shift of the pHi response to pMet↓2 during the second challenge. In fact, 87% of the neurons exhibit a frank alkalinization.
The blue point lies in QI (i.e., states are both MAc1 and pMet↓2 resistant), above the hourglass (i.e., behavior is adaptation), and above the x-axis (i.e., pMet↓2 elicits a paradoxical alkalinization).
The green point lies in QII (i.e., states are MAc1 sensitive but pMet↓2 resistant), above the hourglass (i.e., behavior is adaptation), and above the x-axis (i.e., pMet↓2 elicits a paradoxical alkalinization).
The red point lies on the QI (i.e., states are both MAc1 and pMet↓2 resistant), above the hourglass (i.e., behavior is adaptation), as well as to the right of the y-axis and above the x-axis (i.e., both MAc1 and pMet↓2 elicit paradoxical alkalinizations).
The mean d± is +0.094 (Table 2, row 7), the most strongly positive value in the present study; this value is significantly different from zero (p ≅ 2.3×10⁻¹⁵), consistent with adaptation.
ΔpHi vs initial pHi
Figure 9C reveals correlation strengths, taking all 61 points together, of “absent” for (ΔpHi)1/MAc vs (pHi)1, and “weak” (ΔpHi)2/pMet↓ vs (pHi)2.
Frequency distributions
The subset of neurons summarized Figure 9D has a mean (ΔpHi)1/MAc of −0.07, less than the global value of −0.11 across the entire study (see Figure 1). However, far more striking is the mean (ΔpHi)2/pMet↓, which is shifted far to the right, at a positive value of +0.06. The difference is highly significant.
Summary of MAc-pMet↓
Pretreatment with MAc causes 87% of neurons to alkalinize paradoxically in response to pMet↓2.
Discussion
Historical background and comparisons
Previous work from this laboratory has shown that, in response to MAc, the cytosol of hippocampal neurons acidifies to varying extents, with some neurons undergoing relatively small pHi decreases and being described as “resistant” (Bouyer et al., 2004). In a subsequent study of ten different cell types, including co-cultured mouse HC neurons and astrocytes, Salameh et al. (2014) numerically defined “MAc resistant” and “MAc sensitive”. Salameh et al. (2014) also introduced and defined the terms “adaptation,” “consistency,” and “decompensation” to describe the change in MAc-induced ΔpHi values between the first and second of two MAc challenges. Salameh et al. (2017) later established that the acceleration of the Cl-HCO3 exchanger AE3 (a potent acid loader) plays a central role in determining the rate and extent of the MAc-induced acidification of HC neurons. Thus, we expect that the fall in [HCO3−]o per se—one component of MAc—to accelerate AE3 and thereby contribute to the MAc-induced fall in pHi. However, we do not know whether the fall in [HCO3−]o, by other mechanisms (e.g., effects on other transporters or regulatory processes), contributes to the fall in pHi. Nor do we know whether the concomitant fall in pHo per se—the other component of MAc—also contributes to the MAc-induced fall in pHi.
Understanding the mechanism of action of MAc is crucial for two reasons. First, several diseases can cause MAc. These include sepsis, diabetic ketoacidosis, ischemia/hypoxia (causing lactic acidosis), kidney disease (causing renal tubular acidosis), and gastrointestinal diseases (causing severe diarrhea). Second, MAc can negatively affect various organ systems, even to the extent of being life-threatening (Lim, 2007; Gennari and Weise, 2008; Raphael et al., 2016; Raphael, 2018).
Of the 235 naïve neurons exposed to MAc in the present study, ∼62% were MAc sensitive and ∼38% were resistant. This distribution is similar to the one reported by Salameh et al. (2014) but differs from our first study, in which we reported that the majority of hippocampal neurons were resistant (Bouyer et al., 2004). Part of this difference is due to the resistant/sensitive criteria later established by Salameh et al. (2014), and the rest presumably arises from the small number of neurons (14 neurons) in that first study, compared to 25 in the work by Salameh et al. (2014), and 235 in the present study.
Zhou et al. (2005) previously reported the effects of select OOE solutions on steady-state pHi in rabbit proximal tubules. The present study is the first on vertebrate cells to report pHi time courses during the application and removal of OOE solutions. Following up on previous work on the effects of MAc and MAc-MAc on neurons and other cells by Salameh et al. (2014), our major goal in the present study was to use OOE technology as a tool to dissect the effects of MAc into two of its major component parts (1) an isolated decrease in pHo (i.e., pAc): and (2) an isolated decrease in [HCO3−]o (i.e., pMet↓).
Effects of acid-base challenges on [CO3=]o
As noted by Zhao et al. (2003) and Bouyer et al. (2024), the approach for creating OOE solutions does not permit independent control over CO3= or NaCO3−. These solutes are important because, as suggested earlier (Boron and Boulpaep, 1983; Boron and Russell, 1983; Boron, 1985; Boron and Knakal, 1989; 1992), a combination of electrophysiological and modeling approaches now shows that either CO3= or the NaCO3− ion pair is the actual substrate of both the electrogenic Na/HCO3 cotransporter NBCe1 and the Na+-driven Cl-HCO3 exchanger NDCBE (Lee et al., 2023). Because both transporters play important roles in pHi regulation of both neurons and astrocytes, it is instructive to consider how our experimental challenges impact [CO3=]o:
• During MAc in our experiments, [HCO3−]o falls from 22 mM to ∼14 mM, which is ∼63% of the initial value. Simultaneously, pHo falls from 7.40 to 7.20, which means that [H+]o rises by a factor of 1/(∼63%) or ∼58%. The rise in [H+]o produces a reciprocal fall in [CO3=]o. Thus, this combination of [HCO3−]o and pHo changes in MAc causes [CO3=]o to fall to about 63 % × 63 % or ∼40% of its initial value.
• During pAc, where [CO2]o and [HCO3−]o are fixed, [H+]o rises by ∼58% (i.e., corresponding to the same 0.2 pHo decrease as in MAc), which causes a reciprocal decrease in [CO3=]o, which falls to ∼63% of its initial value.
• During pMet↓, where [CO2]o and [H+]o are fixed, [HCO3−]o falls to ∼63% of its initial value (as in MAc), which causes [CO3=]o to fall to ∼63% of its initial value.
In summary, pAc and pMet↓ each produce 37% decreases in [CO3=]o, and also [NaCO3−]o, whereas MAc produces a 60% decrease.
Comparison of effects of MAc vs those of pAc + pMet↓
In this section, we ask whether the effects of MAc are merely the sum of the individual effects of pAc and pMet↓. Based on our discussion of how each challenge affects [CO3=]o, we expect the decrease in [CO3=]o during MAc (∼60%) to be modestly less than the sum of the decreases during pAc (∼37%) and pMet↓ (∼37%).9
(1) Effects on (ΔpHi)1: MAc1 vs pAc1 + pMet↓1
The simplest question addresses “state”: is the effect of MAc on ΔpHi in a naïve neuron merely the sum of the acidosis (i.e., pAc) and the decrease in [HCO3−]o (i.e., pMet↓)? To address this query, we compare MAc1 (Figure 3) vs pAc1 (Figure 6) and pMet↓1 (Figure 8). The answer seems to be approximately “yes.” If we sum the ΔpHi for the first challenge in each of these figures (compare Figure 3D vs Figures 6D vs; Figure 8D), we have a near-exact match:10
If instead, we use the global (ΔpHi)1/MAc from Figure 1, we observe only a modest difference
One note of caution is that, because we did not set out to perform a systematic comparison of MAc vs pAc and pMet↓, we did not routinely perform all three protocols on the same day on naïve neurons from the same cultures. Nevertheless, we are comparing data from a large number of neurons, coverslips, and cultures across a large portion of the present study.
A second note of caution is that, as noted above under “Effects of acid-base challenges on [CO3=]o”, the sum (Δ[CO3=]o)1/pAc + (Δ[CO3=]o)1/pMet↓ is a somewhat larger negative number than (Δ[CO3=]o)1/MAc:
This inequality could contribute to the any imbalance in Equation 3 and Equation 4. Moreover, the three acid-base challenges presumably also lead to different changes in various cytosolic parameters (see Bouyer et al., 2024) that could contribute to ΔpHi in ways that are not algebraically additive. For example, in all three disturbances, [CO2]o is fixed, so that the induced changes in pHi translate directly to changes in [HCO3−]i and [CO3=]i, which could in turn have nonlinear effects on the kinetics of transporters.
Our conclusion from this first analysis is that for naïve neurons—cells experiencing a challenge for the first time—the whole (MAc1) is very nearly the sum of the parts (pAc1 + pMet↓1). We address this additivity in Bouyer et al. (2024).
(2) Effects of MAc1 on (ΔpHi)2/MAc vs (ΔpHi)2/pAc + (ΔpHi)2/pMet↓
Question ‘2’ is similar to ‘1’, but addresses “behavior” across twin-pulse challenges. Here we ask whether the effect of MAc1 on MAc2 (Figure 3B) is the sum of the effects of MAc1 on pAc2 (Figure 7B) and MAc1 on pMet↓2 (Figure 9B). First, examining the ΔpHi values:
In Equation 6, the three (ΔpHi) values refer to the mean (ΔpHi)2 in protocols in which the first challenge was always MAc1, but the second challenges were MAc2 on the left vs pAc2 and pMet↓2 on the right. Thus, observing (ΔpHi)2, we see that the effects of MAc1 on (ΔpHi)2/pAc and (ΔpHi)2/pMet↓ very nearly cancel one another (i.e., −0.01), as they sum to a value that is markedly smaller than the effect of MAc1 on (ΔpHi)2/MAc (i.e., −0.11).
Viewed from the perspective of d±, in the MAc-MAc protocol, d± is +0.024 (see Table 2), compared to a d± of +0.020 in the MAc-pAc protocol and a d± of +0.094 in the MAc-pMet↓ protocol. Thus, for these three protocols that have in common that the first challenge is MAc, we ask in equation form:
In other words, with MAc1 as the first challenge and MAc2 as the second, we see a modest adaptive effect (+0.024), whereas the two component second challenges—pAc2 (modest adaptive effect) and pMet↓2 (strong adaptive effect)—produce effects that sum to an extremely strong adaptive effect (+0.114). Clearly, the whole is much less than the sum of the parts.
From this third analysis, whether we examine ΔpHi or d±, we conclude that—when the first challenge is MAc1—the whole (MAc2) is very different from sum of the parts (pAc2 + pMet↓2).
Similar to what we proposed above regarding question ‘2’, we suggest that—following MAc1—the machinery triggered by pAc2 and pMet↓2 intersect in such a way that, in combination but not alone, the two produce a modest, net adaptation behavior. In other words, the ↓(pHo)2 and ↓([HCO3−]o)2 signals must be coincident in order to produce the physiological effect of MAc2. We address the issue of coincidence in Bouyer et al. (2024).
(3) Effects on (ΔpHi)2/MAc: Ac1 vs pAc1
It is instructive to compare the effects of Ac1 vs pAc1 on (ΔpHi)2/MAc because Ac1 and pAc1 (from the perspective of pHo) differ only in the absence vs presence of CO2/HCO3−. In the Ac-MAc protocol (see Figure 4D), (ΔpHi)2/MAc is −0.09, whereas in the pAc-MAc protocol (see Figure 6D), (ΔpHi)2/MAc is −0.13. Although these means are not significantly different (p = .0982), the trend is for acidosis in the presence of CO2/HCO3− to produce a more negative (ΔpHi)2/MAc, consistent with a trend towards greater decompensation.
We see an analogous but stronger pattern when we compare d± values (see Table 2). The d± of +0.015 for Ac-MAc (see also Figure 4B) is exactly opposite the d± of −0.015 for pAc-MAc (see also Figure 6B). Again, although the difference in mean d± values is not statistically significant (p = .0919), the trend is toward greater decompensation when the acidosis in the first challenge, occurs in the presence of CO2/HCO3−.
Paradoxical effects of pMet↓
The effects of pMet↓ are truly unique. In the naïve neurons of Figure 8A and B, 19 of 52 (36%) of neurons exhibit a paradoxical pHi increase—a positive (ΔpHi)1/pMet↓.
Even more striking is the MAc-pMet↓ protocol (see Figures 9A, B), where MAc1 pretreatment causes the response to pMet↓2 to be a frank pHi increase in 53 of 61 (∼87%) of the neurons. In Figure 10, we use the pHi data from Figure 9B to produce a plot of (Δ[HCO3−]i)1/MAc vs (Δ[HCO3−]i)2/pMet↓. All but one of the points lie above the LOI; that is, in 60 of 61 neurons, (Δ[HCO3−]i)2/pMet↓ > (Δ[HCO3−]i)1/MAc. Moreover, 53 of 61 neurons (the same 53 as in Figure 9B) lie above the x-axis. In other words, in these 87% of neurons, pMet↓2 (i.e., reducing [HCO3−]o from 22 to ∼14 mM) causes [HCO3−]i to rise. This effect is analogous to putting 61 glasses of room-temperature water into a (functioning) refrigerator and removing the glasses 5 min later, only to find that the water temperature has paradoxically risen in 53 of 61 glasses (!).
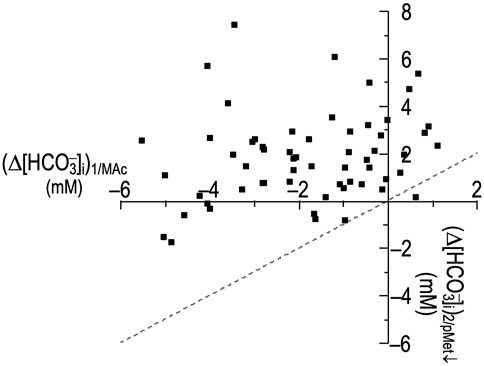
Figure 10. Effect of the MAc-pMet↓ protocol on computed [HCO3−]i. Here we plot [HCO3−]i values that we computed from the same primary pHi data that yielded the ΔpHi data in Figure 9B, with the assumption that [CO2]o = [CO2]o. On the abscissa is the Δ[HCO3−]i during MAc1, and on the ordinate, the Δ[HCO3−]i during pMet↓2. The dashed gray line represents the line of identity. Note that the pH-driven concepts of resistant/sensitive (which gave us the vertical and horizontal dashed blue lines in Figure 3B through Figure 9B) and the hourglass have no meaning in the plot we show here because the Δ[HCO3−]i depends not just on ΔpHi but also on the pHi just before the imposition of MAc1.
As we speculate in Bouyer et al. (2024), the paradoxical pHi increase during pMet↓1 in many naïve neurons in Figures 8A, B—a “state”—likely reflects a novel response to the decrease in [HCO3−]o per se, perhaps mediated by receptor protein tyrosine phosphatases γ (RPTPγ) and/or ζ (RPTPζ), both of which are expressed in mouse HC neurons (Taki et al., 2024).
The paradoxical pHi increase during pMet↓2 of the twin MAc-pMet↓ challenge in Figures 9A, B—a “behavior”—could reflect the actions of intracellular and extracellular acid-base sensors (including the RPTPs) during MAc1, as well as the RPTPs during pMet↓2. It may be that, during a MAc-MAc protocol, the collection of all intra- and extracellular sensors acting during MAc1 make the neuron better able to withstand a subsequent MAc2. However, when pMet↓2 replaces MAc2, the lone immediate challenge to the now-prepared neuron is a decrease in [HCO3−]o. The unbalanced response of the hypothetical receptor to low [HCO3−]o could be a massive stimulation of acid extruders (vs acid loaders), resulting in the strong and nearly uniform paradoxical pHi increase.
Summary and conclusions
• Sensing: Rat HC neurons can separately sense and respond to ↓(pHo) and ↓([HCO3−]o).
• State: In naïve HC neurons, the separate ↓(pHo) and ↓([HCO3−]o) signals summate to yield the same ΔpHi as the simultaneous ↓(pHo)/↓([HCO3−]o) signals.
• Behavior: When HC neurons cross the boundary between two acid-base challenges, the ΔpHi or d± response is a complex event that requires coincident pAc and pMet↓ signals.
Data availability statement
The raw data supporting the conclusions of this article will be made available by the authors, without undue reservation.
Ethics statement
The animal study was approved by J. Michael Oakes/Senior Vice President for Research, Office of Research and Technology Management. The study was conducted in accordance with the local legislation and institutional requirements.
Author contributions
PB: Investigation, Writing–review and editing, Writing–original draft, Validation, Project administration, Methodology, Formal Analysis, Data curation, Conceptualization. AS: Validation, Writing–review and editing, Formal Analysis, Data curation. YZ: Validation, Writing–review and editing, Methodology, Formal Analysis, Data curation. TK: Writing–review and editing, Methodology, Data curation, Formal Analysis. WB: Writing–review and editing, Writing–original draft, Validation, Supervision, Resources, Project administration, Methodology, Funding acquisition, Formal Analysis, Data curation, Conceptualization.
Funding
The author(s) declare that financial support was received for the research, authorship, and/or publication of this article. This work was supported by NIH grants NS 18400 and DK128315, and program project grant P01-HD32573 (PI: Gabriel Haddad). MLK was supported by grants institutional training grant T32-NS07455 (PI: Emile Boulpaep). WB was supported in part by a USAF studies and analysis grant 20-012.
Acknowledgments
The authors are very thankful to Annette Kolar for her input with the neurons culture and to Duncan Wong for computer and technical assistance during the project. We thank Michelle L. Kelly for her valuable input during early phases of the project. W.F.B gratefully acknowledges the support of the Myers/Scarpa endowed chair.
Conflict of interest
The authors declare that the research was conducted in the absence of any commercial or financial relationships that could be construed as a potential conflict of interest.
Publisher’s note
All claims expressed in this article are solely those of the authors and do not necessarily represent those of their affiliated organizations, or those of the publisher, the editors and the reviewers. Any product that may be evaluated in this article, or claim that may be made by its manufacturer, is not guaranteed or endorsed by the publisher.
Footnotes
1See Methods > Definitions.
2For the neuron represented by the red record, pHi at the outset of the experiment at first appears to decline and then nearly stabilize just before MAc1. The pHi declines are initially slow but continuous throughout the MAc periods—reminiscent of AE3-KO neurons in the study by Salameh et al. (2017). They proposed that, during MAc, AE3 exchanges intracellular HCO3− for extracellular Cl−, which causes (a) an initial rapid fall of pHi, (b) loads the cell with Cl−, thereby maintaining [Cl−]i, thereby (c) maximizing acid extrusion and stabilizing pHi during the latter portion of the MAc. Thus, AE3 would promote a rapid but limited pHi decline. A cell with low AE3 activity (or any phenotype that would lower [Cl−]i) could behave like the red neuron.
3Note that using the quadrants to track the “state” of a neuron from MAc1 to MAc2 is not necessarily the same as using the hourglass (discussed below under #2) to define “behavior”.
4See Methods > Definitions > Behavior.
5The line segment between the point and the line of identity is, by definition, orthogonal to the line of identity. Because the x-axis scale in Figure 3B is slightly smaller than the y-axis scale, the gold-colored line segment is not quite orthogonal to the dashed line of identity.
6Methods > Data analysis and statistics.
7For an example of how to interpret this table, see the analogous presentation in the MAc-MAc section.
8The duration of experiments is limited by the health of the neuron, which we judge by –k440.
9In the present study, we examine only a subset of properties related to acid-base physiology. One could address our question to a far greater range of pHi-related properties, let alone those related to a host of other areas such as the homeostasis of other ions and electrophysiological activity.
10In this and subsequent equations, the bolded subscripts indicate the parameters on which we are focusing.
References
Aronson P. S., Nee J., Suhm M. A. (1982). Modifier role of internal H+ in activating the Na+-H+ exchanger in renal microvillus membrane vesicles. Nature 299, 161–163. doi:10.1038/299161a0
Baxter K. A., Church J. (1996). Characterization of acid extrusion mechanisms in cultured fetal rat hippocampal neurones. J. Physiol. (Lond.) 493 (Pt 2), 457–470. doi:10.1113/jphysiol.1996.sp021396
Bevensee M. O., Bashi E., Boron W. F. (1999). Effect of trace levels of nigericin on intracellular pH and acid-base transport in rat renal mesangial cells. J. Membr. Biol. 169, 131–139. doi:10.1007/s002329900525
Bevensee M. O., Boron W. F. (2013). “Control of intracellular pH,” in Seldin and giebisch’s the kidney: physiology and pathophysiology (Academic Press), 1773–1835.
Bevensee M. O., Cummins T. R., Haddad G. G., Boron W. F., Boyarsky G. (1996). pH regulation in single CA1 neurons acutely isolated from the hippocampi of immature and mature rats. J. Physiol. (Lond) 494, 315–328. doi:10.1113/jphysiol.1996.sp021494
Bevensee M. O., Schwiening C. J., Boron W. F. (1995). Use of BCECF and propidium iodide to assess membrane integrity of acutely isolated CA1 neurons from rat hippocampus. J. Neurosci. Meth 58, 61–75. doi:10.1016/0165-0270(94)00159-e
Boedtkjer E., Hansen K. B., Boedtkjer D. M., Aalkjaer C., Boron W. F. (2016). Extracellular HCO₃− is sensed by mouse cerebral arteries: regulation of tone by receptor protein tyrosine phosphatase γ. J. Cereb. Blood Flow. Metab. 36, 965–980. doi:10.1177/0271678X15610787
Boron W. F. (1985). Intracellular pH-regulating mechanism of the squid axon. Relation between the external Na+ and HCO3− dependences. J. Gen. Physiol. 85, 325–345. doi:10.1085/jgp.85.3.325
Boron W. F. (2004). Regulation of intracellular pH. Adv. Physiol. Educ. 28, 160–179. doi:10.1152/advan.00045.2004
Boron W. F., Boulpaep E. L. (1983). Intracellular pH regulation in the renal proximal tubule of the salamander. Basolateral HCO₃− transport. J. Gen. Physiol. 81, 53–94. doi:10.1085/jgp.81.1.53
Boron W. F., De Weer P. (1976). Intracellular pH transients in squid giant axons caused by CO2, NH3, and metabolic inhibitors. J. Gen. Physiol. 67, 91–112. doi:10.1085/jgp.67.1.91
Boron W. F., Knakal R. C. (1989). Intracellular pH-regulating mechanism of the squid axon. Interaction between DNDS and extracellular Na+ and HCO₃−. J. Gen. Physiol. 93, 123–150. doi:10.1085/jgp.93.1.123
Boron W. F., Knakal R. C. (1992). Na+-dependent Cl−-HCO₃− exchange in the squid axon. Dependence on extracellular pH. J. Gen. Physiol. 99, 817–837. doi:10.1085/jgp.99.5.817
Boron W. F., Russell J. M. (1983). Stoichiometry and ion dependencies of the intracellular-pH-regulating mechanism in squid giant axons. J. Gen. Physiol. 81, 373–399. doi:10.1085/jgp.81.3.373
Bouyer P., Bradley S. R., Zhao J., Wang W., Richerson G. B., Boron W. F. (2004). Effect of extracellular acid-base disturbances on the intracellular pH of neurones cultured from rat medullary raphe or hippocampus. J. Physiol. (Lond.) 559, 85–101. doi:10.1113/jphysiol.2004.067793
Bouyer P., Zhou Y., Boron W. F. (2003). An increase in intracellular calcium concentration that is induced by basolateral CO2 in rabbit renal proximal tubule. Am. J. Physiol. Ren. Physiol. 285, F674–F687. doi:10.1152/ajprenal.00107.2003
Bouyer P. G., Taki S., Moss F., Boron W. (2024). Hypothesis and Theory: effects of extracellular metabolic acidosis on the homeostasis of intracellular pH in hippocampal neurons. Front. Physiology 15. doi:10.3389/fphys.2024.1406448
Boyarsky G., Ganz M. B., Sterzel R. B., Boron W. F. (1988). pH regulation in single glomerular mesangial cells. I. Acid extrusion in absence and presence of HCO₃−. Am. J. Physiol. Cell Physiol. 255, C844–C856. doi:10.1152/ajpcell.1988.255.6.C844
Brett C. L., Kelly T., Sheldon C., Church J. (2002). Regulation of Cl−/HCO3− exchangers by cAMP-dependent protein kinase in adult rat hippocampal CA1 neurons. J. Physiol. (Lond.) 545, 837–853. doi:10.1113/jphysiol.2002.027235
Brewer G. J., Torricelli J. R., Evege E. K., Price P. J. (1993). Optimized survival of hippocampal neurons in B27-supplemented Neurobasal, a new serum-free medium combination. J. Neurosci. Res. 35, 567–576. doi:10.1002/jnr.490350513
Chen L.-M., Kelly M. L., Rojas J. D., Parker M. D., Gill H. S., Davis B. A., et al. (2008). Use of a new polyclonal antibody to study the distribution and glycosylation of the sodium-coupled bicarbonate transporter NCBE in rodent brain. Neuroscience 151, 374–385. doi:10.1016/j.neuroscience.2007.10.015
Chen Y., Cann M. J., Litvin T. N., Iourgenko V., Sinclair M. L., Levin L. R., et al. (2000). Soluble adenylyl cyclase as an evolutionarily conserved bicarbonate sensor. Science 289, 625–628. doi:10.1126/science.289.5479.625
Chesler M. (2003). Regulation and modulation of pH in the brain. Physiol. Rev. 83, 1183–1221. doi:10.1152/physrev.00010.2003
Church J., Baxter K. A., McLarnon J. G. (1998). pH modulation of Ca2+ responses and a Ca2+-dependent K+ channel in cultured rat hippocampal neurones. J. Physiol. (Lond.) 511 (Pt 1), 119–132. doi:10.1111/j.1469-7793.1998.119bi.x
Cooper D. S., Saxena N. C., Yang H. S., Lee H. J., Moring A. G., Lee A., et al. (2005). Molecular and functional characterization of the electroneutral Na/HCO3 cotransporter NBCn1 in rat hippocampal neurons. J. Biol. Chem. 280, 17823–17830. doi:10.1074/jbc.M408646200
Cooper D. S., Yang H. S., He P., Kim E., Rajbhandari I., Yun C. C., et al. (2009). Sodium/bicarbonate cotransporter NBCn1/slc4a7 increases cytotoxicity in magnesium depletion in primary cultures of hippocampal neurons. Eur. J. Neurosci. 29, 437–446. doi:10.1111/j.1460-9568.2008.06611.x
Donowitz M., Ming Tse C., Fuster D. (2013). SLC9/NHE gene family, a plasma membrane and organellar family of Na+/H+ exchangers. Mol. Asp. Med. 34, 236–251. doi:10.1016/j.mam.2012.05.001
Eiden L. E., Schäfer M. K.-H., Weihe E., Schütz B. (2004). The vesicular amine transporter family (SLC18): amine/proton antiporters required for vesicular accumulation and regulated exocytotic secretion of monoamines and acetylcholine. Pflugers Arch. 447, 636–640. doi:10.1007/s00424-003-1100-5
Ellis D., Thomas R. C. (1976). Direct measurement of the intracellular pH of mammalian cardiac muscle. J. Physiol. (Lond.) 262, 755–771. doi:10.1113/jphysiol.1976.sp011619
Filosa J. A., Dean J. B., Putnam R. W. (2002). Role of intracellular and extracellular pH in the chemosensitive response of rat locus coeruleus neurones. J. Physiol. (Lond.) 541, 493–509. doi:10.1113/jphysiol.2001.014142
Gennari F. J., Weise W. J. (2008). Acid-base disturbances in gastrointestinal disease. Clin. J. Am. Soc. Nephrol. 3, 1861–1868. doi:10.2215/CJN.02450508
Gurnett C. A., Veile R., Zempel J., Blackburn L., Lovett M., Bowcock A. (2008). Disruption of sodium bicarbonate transporter SLC4A10 in a patient with complex partial epilepsy and mental retardation. Arch. Neurol. 65, 550–553. doi:10.1001/archneur.65.4.550
Hentschke M., Wiemann M., Hentschke S., Kurth I., Hermans-Borgmeyer I., Seidenbecher T., et al. (2006). Mice with a targeted disruption of the Cl−/HCO3− exchanger AE3 display a reduced seizure threshold. Mol. Cell. Biol. 26, 182–191. doi:10.1128/MCB.26.1.182-191.2006
Holzer P. (2009). Acid-sensitive ion channels and receptors. Handb. Exp. Pharmacol., 283–332. doi:10.1007/978-3-540-79090-7_9
Ishii S., Kihara Y., Shimizu T. (2005). Identification of T cell death-associated gene 8 (TDAG8) as a novel acid sensing G-protein-coupled receptor. J. Biol. Chem. 280, 9083–9087. doi:10.1074/jbc.M407832200
Jones W. D., Cayirlioglu P., Kadow I. G., Vosshall L. B. (2007). Two chemosensory receptors together mediate carbon dioxide detection in Drosophila. Nature 445, 86–90. doi:10.1038/nature05466
Kanai Y., Nussberger S., Romero M. F., Boron W. F., Hebert S. C., Hediger M. A. (1995). Electrogenic properties of the epithelial and neuronal high affinity glutamate transporter. J. Biol. Chem. 270, 16561–16568. doi:10.1074/jbc.270.28.16561
Keyes S. R., Rudnick G. (1982). Coupling of transmembrane proton gradients to platelet serotonin transport. J. Biol. Chem. 257, 1172–1176. doi:10.1016/s0021-9258(19)68170-6
Kopito R. R., Lee B. S., Simmons D. M., Lindsey A. E., Morgans C. W., Schneider K. (1989). Regulation of intracellular pH by a neuronal homolog of the erythrocyte anion exchanger. Cell 59, 927–937. doi:10.1016/0092-8674(89)90615-6
Lee S.-K., Occhipinti R., Moss F. J., Parker M. D., Grichtchenko I. I., Boron W. F. (2023). Distinguishing among HCO₃−, CO₃=, and H+ as substrates of proteins that appear to be “bicarbonate” transporters. J. Am. Soc. Nephrol. 34, 40–54. doi:10.1681/ASN.2022030289
Lesage F. (2003). Pharmacology of neuronal background potassium channels. Neuropharmacology 44, 1–7. doi:10.1016/s0028-3908(02)00339-8
Li S., Sato S., Yang X., Preisig P. A., Alpern R. J. (2004). Pyk2 activation is integral to acid stimulation of sodium/hydrogen exchanger 3. J. Clin. Invest. 114, 1782–1789. doi:10.1172/JCI18046
Ludwig M.-G., Vanek M., Guerini D., Gasser J. A., Jones C. E., Junker U., et al. (2003). Proton-sensing G-protein-coupled receptors. Nature 425, 93–98. doi:10.1038/nature01905
Meech R. W., Thomas R. C. (1987). Voltage-dependent intracellular pH in Helix aspersa neurones. J. Physiol. (Lond.) 390, 433–452. doi:10.1113/jphysiol.1987.sp016710
Mohebbi N., Benabbas C., Vidal S., Daryadel A., Bourgeois S., Velic A., et al. (2012). The proton-activated G protein coupled receptor OGR1 acutely regulates the activity of epithelial proton transport proteins. Cell. Physiol. biochem. 29, 313–324. doi:10.1159/000338486
Montell C. (2001). Physiology, phylogeny, and functions of the TRP superfamily of cation channels. Sci. STKE 2001, re1. doi:10.1126/stke.2001.90.re1
Parker M. D., Boron W. F. (2013). The divergence, actions, roles, and relatives of sodium-coupled bicarbonate transporters. Physiol. Rev. 93, 803–959. doi:10.1152/physrev.00023.2012
Parker M. D., Musa-Aziz R., Rojas J. D., Choi I., Daly C. M., Boron W. F. (2008). Characterization of human SLC4A10 as an electroneutral Na+/HCO₃− cotransporter (NBCn2) with Cl− self-exchange activity. J. Biol. Chem. 283, 12777–12788. doi:10.1074/jbc.M707829200
Raley-Susman K. M., Cragoe E. J., Sapolsky R. M., Kopito R. R. (1991). Regulation of intracellular pH in cultured hippocampal neurons by an amiloride-insensitive Na+/H+ exchanger. J. Biol. Chem. 266, 2739–2745. doi:10.1016/s0021-9258(18)49907-3
Raley-Susman K. M., Sapolsky R. M., Kopito R. R. (1993). Cl−/HCO3− exchange function differs in adult and fetal rat hippocampal neurons. Brain Res. 614, 308–314. doi:10.1016/0006-8993(93)91049-x
Raphael K. L. (2018). Metabolic acidosis and subclinical metabolic acidosis in CKD. J. Am. Soc. Nephrol. 29, 376–382. doi:10.1681/ASN.2017040422
Raphael K. L., Murphy R. A., Shlipak M. G., Satterfield S., Huston H. K., Sebastian A., et al. (2016). Bicarbonate concentration, acid-base status, and mortality in the health, aging, and body composition study. Clin. J. Am. Soc. Nephrol. 11, 308–316. doi:10.2215/CJN.06200615
Richmond P. H., Vaughan-Jones R. D. (1997). Assessment of evidence for K+-H+ exchange in isolated type-1 cells of neonatal rat carotid body. Pflugers Arch. 434, 429–437. doi:10.1007/s004240050417
Romero M. F., Chen A.-P., Parker M. D., Boron W. F. (2013). The SLC4 family of bicarbonate (HCO₃−) transporters. Mol. Asp. Med. 34, 159–182. doi:10.1016/j.mam.2012.10.008
Roos A., Boron W. F. (1981). Intracellular pH. Physiol. Rev. 61, 296–434. doi:10.1152/physrev.1981.61.2.296
Ruffin V. A., Salameh A. I., Boron W. F., Parker M. D. (2014). Intracellular pH regulation by acid-base transporters in mammalian neurons. Front. Physiol. 5, 43. doi:10.3389/fphys.2014.00043
Russell J. M., Boron W. F. (1976). Role of choloride transport in regulation of intracellular pH. Nature 264, 73–74. doi:10.1038/264073a0
Salameh A. I., Hübner C. A., Boron W. F. (2017). Role of Cl−-HCO₃− exchanger AE3 in intracellular pH homeostasis in cultured murine hippocampal neurons, and in crosstalk to adjacent astrocytes. J. Physiol. (Lond.) 595, 93–124. doi:10.1113/JP272470
Salameh A. I., Ruffin V. A., Boron W. F. (2014). Effects of metabolic acidosis on intracellular pH responses in multiple cell types. Am. J. Physiol. Regul. Integr. Comp. Physiol. 307, R1413–R1427. doi:10.1152/ajpregu.00154.2014
Schulz S., Wedel B. J., Matthews A., Garbers D. L. (1998). The cloning and expression of a new guanylyl cyclase orphan receptor. J. Biol. Chem. 273, 1032–1037. doi:10.1074/jbc.273.2.1032
Schwiening C. J., Boron W. F. (1994). Regulation of intracellular pH in pyramidal neurones from the rat hippocampus by Na+-dependent Cl−-HCO₃− exchange. J. Physiol. (Lond) 475, 59–67. doi:10.1113/jphysiol.1994.sp020049
Smith G. A., Brett C. L., Church J. (1998). Effects of noradrenaline on intracellular pH in acutely dissociated adult rat hippocampal CA1 neurones. J. Physiol. (Lond.) 512 (Pt 2), 487–505. doi:10.1111/j.1469-7793.1998.487be.x
Sun L., Wang H., Hu J., Han J., Matsunami H., Luo M. (2009). Guanylyl cyclase-D in the olfactory CO2 neurons is activated by bicarbonate. Proc. Natl. Acad. Sci. U.S.A. 106, 2041–2046. doi:10.1073/pnas.0812220106
Sun X., Yang L. V., Tiegs B. C., Arend L. J., McGraw D. W., Penn R. B., et al. (2010). Deletion of the pH sensor GPR4 decreases renal acid excretion. J. Am. Soc. Nephrol. 21, 1745–1755. doi:10.1681/ASN.2009050477
Svichar N., Waheed A., Sly W. S., Hennings J. C., Hübner C. A., Chesler M. (2009). Carbonic anhydrases CA4 and CA14 both enhance AE3-mediated Cl−-HCO3− exchange in hippocampal neurons. J. Neurosci. 29, 3252–3258. doi:10.1523/JNEUROSCI.0036-09.2009
Taki S., Boron W. F., Moss F. J. (2024). Novel RPTPγ and RPTPζ splice variants from mixed neuron-astrocyte hippocampal cultures as well as from the hippocampi of newborn and adult mice. Front. Physiol. 15, 1406448. doi:10.3389/fphys.2024.1406448
Tang C. M., Dichter M., Morad M. (1990). Modulation of the N-methyl-D-aspartate channel by extracellular H+. Proc. Natl. Acad. Sci. U.S.A. 87, 6445–6449. doi:10.1073/pnas.87.16.6445
Thomas J. A., Buchsbaum R. N., Zimniak A., Racker E. (1979). Intracellular pH measurements in Ehrlich ascites tumor cells utilizing spectroscopic probes generated in situ. Biochemistry 18, 2210–2218. doi:10.1021/bi00578a012
Thomas R. C. (1977). The role of bicarbonate, chloride and sodium ions in the regulation of intracellular pH in snail neurones. J. Physiol. (Lond.) 273, 317–338. doi:10.1113/jphysiol.1977.sp012096
Thornell I. M., Michenkova M., Taki S., Bevensee M. O., Boron W. F. (2025). “Intracellular pH homeostasis,” in Seldin and giebisch’s the kidney: physiology and pathophysiology. Editors R. J. Alpern, M. J. Caplan, O. W. Moe, and S. E. Quaggin (London: Elsevier/Academic Press). Available at: https://www.barnesandnoble.com/w/seldin-and-giebischs-the-kidney-robert-j-alpern/1138252983 (Accessed August 29, 2023).
Tolkovsky A. M., Richards C. D. (1987). Na+/H+ exchange is the major mechanism of pH regulation in cultured sympathetic neurons: measurements in single cell bodies and neurites using a fluorescent pH indicator. Neuroscience 22, 1093–1102. doi:10.1016/0306-4522(87)92984-8
Tomura H., Mogi C., Sato K., Okajima F. (2005). Proton-sensing and lysolipid-sensitive G-protein-coupled receptors: a novel type of multi-functional receptors. Cell. Signal. 17, 1466–1476. doi:10.1016/j.cellsig.2005.06.002
Tresguerres M., Buck J., Levin L. R. (2010). Physiological carbon dioxide, bicarbonate, and pH sensing. Pflugers Arch. 460, 953–964. doi:10.1007/s00424-010-0865-6
Vaughan-Jones R. D. (1986). An investigation of chloride-bicarbonate exchange in the sheep cardiac Purkinje fibre. J. Physiol. (Lond.) 379, 377–406. doi:10.1113/jphysiol.1986.sp016259
Vittinghoff E., Shiboski S. C., Glidden D. V., McCulloch C. E. (2005). Regression methods in biostatistics Linear, logistic, survival, and repeated measures models. Springer Science and Business Media, Inc.
Wang W., Bradley S. R., Richerson G. B. (2002). Quantification of the response of rat medullary raphe neurones to independent changes in pHo and PCO2. J. Physiol. (Lond.) 540, 951–970. doi:10.1113/jphysiol.2001.013443
Yao H., Ma E., Gu X. Q., Haddad G. G. (1999). Intracellular pH regulation of CA1 neurons in Na(+)/H(+) isoform 1 mutant mice. J. Clin. Invest. 104, 637–645. doi:10.1172/JCI6785
Zhao J., Hogan E. M., Bevensee M. O., Boron W. F. (1995). Out-of-equilibrium CO₂/HCO₃− solutions and their use in characterizing a new K+/HCO₃− cotransporter. Nature 374, 636–639. doi:10.1038/374636a0
Zhao J., Zhou Y., Boron W. F. (2003). Effect of isolated removal of either basolateral HCO3− or basolateral CO2 on HCO3− reabsorption by rabbit S2 proximal tubule. Am. J. Physiol. Ren. Physiol. 285, F359–F369. doi:10.1152/ajprenal.00013.2003
Zhou Y., Skelton L. A., Xu L., Chandler M. P., Berthiaume J. M., Boron W. F. (2016). Role of receptor protein tyrosine phosphatase γ in sensing extracellular CO₂ and HCO₃−. J. Am. Soc. Nephrol. 27, 2616–2621. doi:10.1681/ASN.2015040439
Keywords: CO2/HCO3− out of equilibrium solutions, pH regulation, HCO3− sensor pHo sensor, acid base, neuron
Citation: Bouyer PG, Salameh AI, Zhou Y, Kolba TN and Boron WF (2024) Effects of extracellular metabolic acidosis and out-of-equilibrium CO2/HCO3− solutions on intracellular pH in cultured rat hippocampal neurons. Front. Physiol. 15:1434359. doi: 10.3389/fphys.2024.1434359
Received: 17 May 2024; Accepted: 28 August 2024;
Published: 09 October 2024.
Edited by:
Michael L Jennings, University of Arkansas for Medical Sciences, United StatesReviewed by:
Pawel Swietach, University of Oxford, United KingdomNazih Nakhoul, School of Medicine, Tulane University, United States
Copyright © 2024 Bouyer, Salameh, Zhou, Kolba and Boron. This is an open-access article distributed under the terms of the Creative Commons Attribution License (CC BY). The use, distribution or reproduction in other forums is permitted, provided the original author(s) and the copyright owner(s) are credited and that the original publication in this journal is cited, in accordance with accepted academic practice. No use, distribution or reproduction is permitted which does not comply with these terms.
*Correspondence: Patrice G. Bouyer, cGF0cmljZS5ib3V5ZXJAdmFscG8uZWR1; Walter F. Boron, V2FsdGVyLkJvcm9uQGNhc2UuZWR1
 Patrice G. Bouyer
 Ahlam I. Salameh3,4
 Walter F. Boron