- 1Department of Electrical, Electronic, and Information Engineering “Guglielmo Marconi”, University of Bologna, Cesena, Italy
- 2Department of Computer Science and Engineering, University of Bologna, Cesena, Italy
Background: Cardiac pacemaking remains an unsolved matter from many perspectives. Extensive experimental and computational studies have been performed to describe the sinoatrial physiology across different scales, from the molecular to clinical levels. Nevertheless, the mechanism by which a heartbeat is generated inside the sinoatrial node and propagated to the working myocardium is not fully understood at present. This work aims to provide quantitative information about this fascinating phenomenon, especially regarding the contributions of cellular heterogeneity and fibroblasts to sinoatrial node automaticity and atrial driving.
Methods: We developed a bidimensional computational model of the human right atrial tissue, including the sinoatrial node. State-of-the-art knowledge of the anatomical and physiological aspects was adopted during the design of the baseline tissue model. The novelty of this study is the consideration of cellular heterogeneity and fibroblasts inside the sinoatrial node for investigating the manner by which they tune the robustness of stimulus formation and conduction under different conditions (baseline, ionic current blocks, autonomic modulation, and external high-frequency pacing).
Results: The simulations show that both heterogeneity and fibroblasts significantly increase the safety factor for conduction by more than 10% in almost all the conditions tested and shorten the sinus node recovery time after overdrive suppression by up to 60%. In the human model, especially under challenging conditions, the fibroblasts help the heterogeneous myocytes to synchronise their rate (e.g. −82% in
Conclusion: Despite the limitations to the proposed model, this work suggests a quantitative explanation to the astonishing overall heterogeneity shown by the sinoatrial node.
1 Introduction
The mechanisms by which the sinoatrial node (SAN) excites the atrium to start the cardiac cycle are still incompletely understood. Starting from the study by Joyner and van Capelle (1986), several computational works have investigated the driving mechanisms in animal models (mostly rabbits) (Garny et al., 2003; Oren and Clancy, 2010; Inada et al., 2014; Kharche et al., 2017; Karpaev et al., 2018; Amsaleg et al., 2022). These studies have explored the roles of gradient and mosaic configurations, presence of transitional phenotypes in the SAN periphery, and presence of specialised conduction pathways (Ricci et al., 2023).
Specific to humans, Kharche et al. (2017) used a detailed 3D anatomy combined with a simplified electrophysiological description to study the mechanisms of micro and macro re-entry onset as well as how these were modulated by the sinoatrial exit pathways (SEPs). Cellular heterogeneity was considered phenomenologically as randomly distributed SAN cells having different cycle lengths (
Previous works by Campana et al. (2022) and Maltsev et al. (2022) have highlighted the primary role of moderated levels of heterogeneity in the SAN ionic properties that confer robustness to cardiac pacemaking. At the same time, experimental evidence of the much higher presence of fibrotic tissue in the mammalian SAN compared to the working myocardium (Camelliti et al., 2004; Csepe et al., 2015, 2016, 2017) remains to be clearly explained.
In this work, bidimensional computational models of the SAN-SEP-RA tissues featuring heterogeneity and fibroblasts were developed. State-of-the-art knowledge about the anatomy and physiology of the SAN was implemented with the aim of gaining quantitative information on the atrial driving mechanisms by the SAN as well as SAN modulation by the atrium under physiological and pathological conditions. The roles of different ionic electrophysiological properties among the SAN cells and presence of different cellular phenotypes (i.e. fibroblasts) inside the SAN were investigated.
The hypothesis proposed in this study is that both cellular heterogeneity and presence of fibroblasts in the SAN increase the robustness of driving capability in terms of the safety factor for conduction and a larger parameter space for which atrial excitation is achieved under physiological and pathological conditions. Therefore, we hypothesise that cellular heterogeneity and fibroblasts specifically contribute to overcoming hyperpolarisation from the atrium, providing a current source in the case of ionic current blocks in the SAN, and protecting the SAN from overdrive suppression under high-frequency stimulation. In the following section, we illustrate the methodology adopted to investigate these phenomena.
2 Methods
2.1 Tissue geometry and electrophysiological models
The model consists of a square matrix of
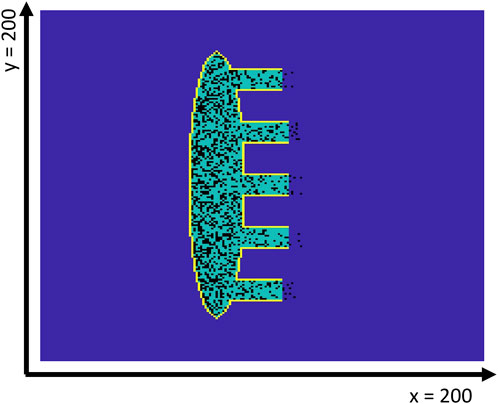
Figure 1. Geometry of the 2D SAN-SEP-RA human model. The yellow contour line shows the insulating border, while the dark blue interior indicates the atrial tissue. The SAN tissue is shown in green, while the fibroblasts are represented in black. Note that the latter may be present inside the atrial tissue just outside the SEPs, which are numbered #1–5 from top to bottom.
2.2 Heterogeneity and fibroblasts
A linear gradient in the fibroblasts density was implemented from the left side of the SAN to the atrial tissue. In particular, the central SAN had 45.7% fibroblasts (Csepe et al., 2015, 2017; Kalyanasundaram et al., 2021; Li et al., 2023) substituting the SAN cells. The gradient allowed the SEPs to have a lower fibroblast density of 27.7
To improve the generalisability of these results, five different virtual SAN tissues (#1–5) were implemented for each setup (H, UF, and HF). Each of these distributions of heterogeneity, fibroblasts, or both were generated using five different random seeds for sampling the log-normal (heterogeneity) and uniform (fibroblast) distributions.
2.3 Gap-junctional coupling
Coupling resistance values of 1 G
where
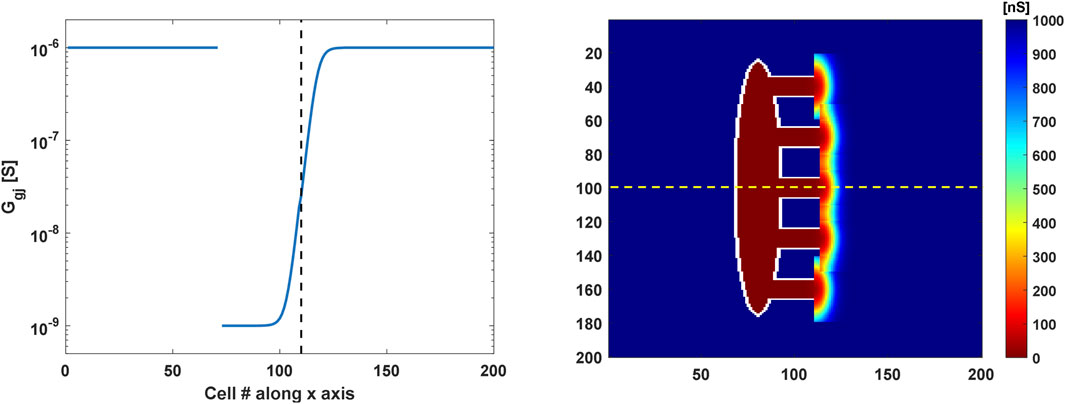
Figure 2. Coupling conductance profiles of the 2D SAN-SEP-RA model. (Left) Sigmoidal gradient in the gap-junctional conductance along the central SEP (yellow dashed line in the right panel). The vertical dashed black line indicates the interface between the SEP and atrium. (Right) Gap-junctional conductance values in the tissue. Bidimensional gradients of semicircular shapes were implemented in the atrium around the SEPs to allow stimulus propagation in the crista terminalis.
2.4 Simulation protocols
Simulations were performed starting from single cell steady-state conditions (500 s) and lasted for 50 s. The last 5 s of the output was saved and analysed. To simulate atrial tachycardia and to investigate the responses of the SAN to overdrive suppression, a high-frequency pacing protocol was applied (Li et al., 2020). A 15 × 15 cluster of atrial cells in the top-right corner of the tissue was stimulated at 2 Hz with a current of 5 nA for 1 ms from 32 to 41.5 s before stopping the pacing. In this case, the last 10 s of the simulations output was exported to compute the sinus node recovery time
To assess the effects of autonomic control over the atrial driving capability and to test the SAN responses under challenging conditions, the effects of 25 nM of acetylcholine (ACh) and 1 µM isoproterenol (ISO) continuous infusion were assessed under both baseline and stimulated conditions. Moreover, 50% and 25% blocks in
For clarity, we define ‘U’ as the uniform setup (no heterogeneity or fibroblasts), ‘H’ as the setup with SAN heterogeneity, ‘UF’ as the setup with fibroblasts and without heterogeneity, and ‘HF’ as the setup including both SAN heterogeneity and fibroblasts.
2.5 Analysis
The
where
Here,
In the externally paced model tissues, the
Statistical differences in the
2.6 Simulation code
The simulations were based on high-performance computing approaches. We developed an efficient CUDA/C program to update the state variables of the cells; the program implemented the forward Euler method to solve a set of ODEs by computing the current values of the state variables in parallel at each time step. Euler’s method is an instance of the bulk-synchronous parallel programming pattern (Valiant, 1990) comprising a sequence of parallel steps, where each parallel step updates the state variables. The bulk-synchronous pattern naturally maps to the architecture of a modern graphics processing unit (GPU) with a large number of computing cores that can operate in parallel. GPUs are particularly effective for implementing numerical algorithms over regular domains, such as vectors of matrices; indeed, we obtained a
The CUDA/C programs were written in a lightweight extension of the standard C++ programming language that included a few additional keywords and syntactic elements. A typical CUDA/C program includes ‘normal’ functions and data that are handled by the CPU as well as special functions (called kernels) that are executed by the GPU. Two different compilers were used to build the CPU and GPU executables, which were then linked in a single program.
The resulting CUDA program was implemented on a Linux server equipped with an NVidia Titan V GPU with 5,120 cores and 12 GB of device RAM, along with an AMD Ryzen Threadripper 2950x CPU operating at 3.5 GHz. A time step of 5 µs was used, and the data were undersampled at 200 µs; smaller time steps of 1 µs did not provide different results.
3 Results
3.1 Control conditions
The behaviour of the model under the control conditions was tested first to explore the roles of heterogeneity and fibroblasts in the absence of extrinsic modifications. As shown in Figure 3, the presence of fibroblasts (UF setup) only minimally prolonged the average atrial
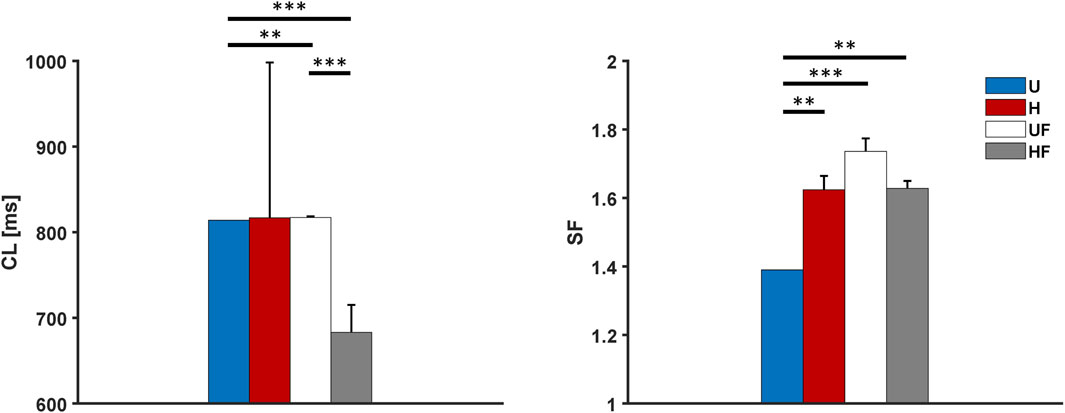
Figure 3. Cycle length and safety factor results for the human model under different setups: U, uniform tissue; H, SAN heterogeneity; UF, uniform SAN tissue with fibroblast; HF, SAN heterogeneity with fibroblast. *p
3.2 Overdrive suppression of the SAN
Next, we investigated the ability of the SAN to recover from external high-frequency pacing by delivering stimuli at 2 Hz to allow comparisons with prior experiments (Li et al., 2017, 2020). Excitation of the atrial tissue at this rate resulted in overdrive suppression of the SAN, with all the paced stimuli entering the SAN from all five SEPs. Once the pacing was stopped, the tissue showed
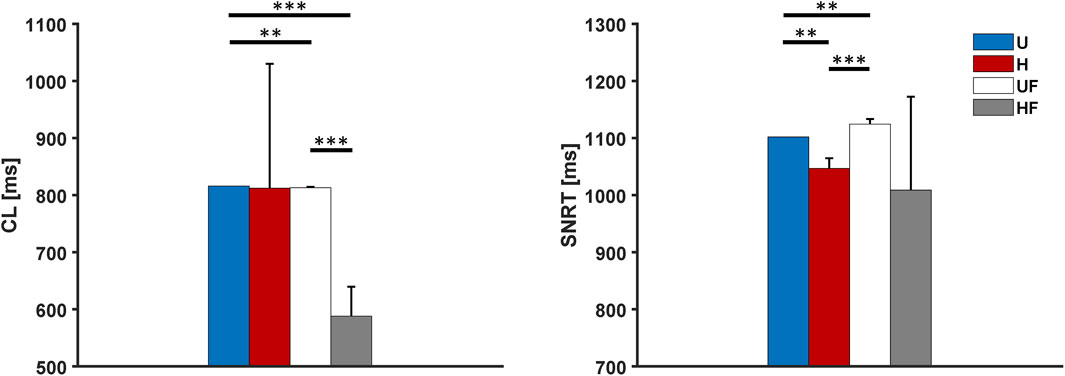
Figure 4. Cycle length and sinus node recovery time results for the human model after 2-Hz pacing under different setups: U, uniform tissue; H, SAN heterogeneity; UF, uniform SAN tissue with fibroblast; HF, SAN heterogeneity with fibroblast. *p
3.3 Acetylcholine administration
To study the effects of parasympathetic stimulation in the model, we simulated the administration of 25 nM of ACh to the SAN. The results in Figure 5 show profound bradycardia under the uniform (1,448 ms vs 814 ms without ACh, +78% equal to the responses of single cells), heterogeneous (1,489

Figure 5. Cycle length and safety factor results for the human model with 25 nM of acetylcholine administration under different setups: U, uniform tissue; H, SAN heterogeneity; UF, uniform SAN tissue with fibroblast; HF, SAN heterogeneity with fibroblast. *p
3.4 Overdrive suppression of the SAN with acetylcholine administration
We next tested a challenging condition in which the SAN underwent simultaneous 25 nM of ACh infusion and external 2 Hz pacing, as in case of the ex vivo human hearts in Li et al. (2017, 2020). In this setting, the CLs showed values of 2,102 ms, 1,333
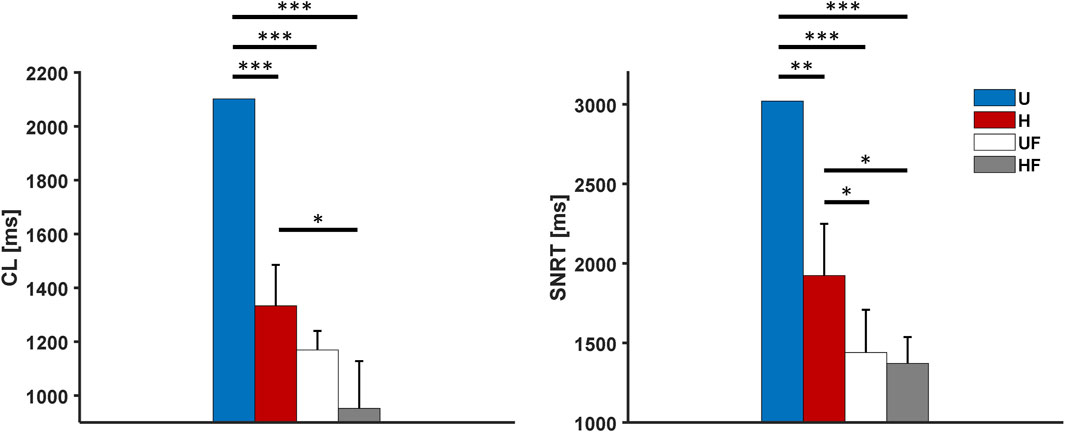
Figure 6. Cycle length and sinus node recovery time results for the human model with 25 nM of acetylcholine administration after 2-Hz pacing under different setups: U, uniform tissue; H, SAN heterogeneity; UF, uniform SAN tissue with fibroblast; HF, SAN heterogeneity with fibroblast. *p
3.5 Isoproterenol administration
After the experiments with ACh infusion, we evaluated the model responses to sympathetic stimulation. In this case, given the on/off behaviour of the FWS model with respect to adrenergic activation (calibrated to 1 µM release), it was not possible to use other concentrations, as reported in previous experiments (1 nM in Li et al. (2020)). We consequently simulated the infusion of 1 µM ISO, which shortened the
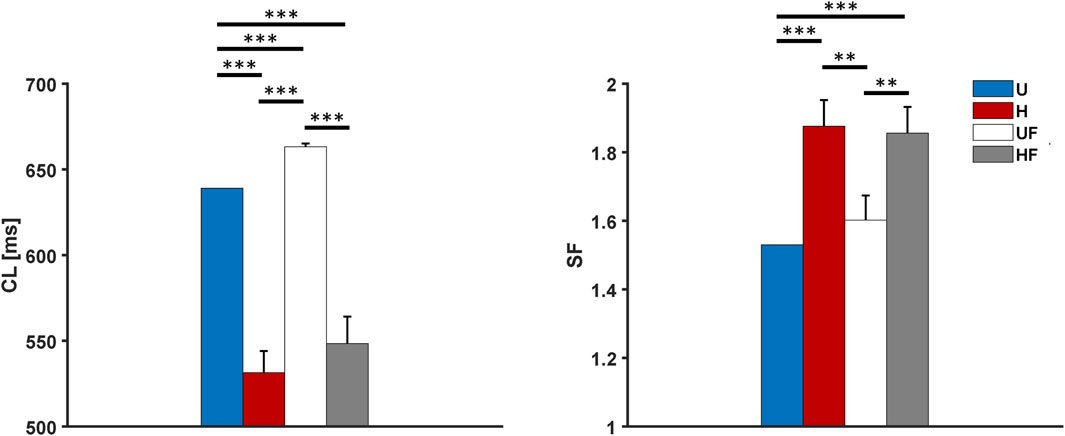
Figure 7. Cycle length and safety factor results for the human model with 1 µM of isoproterenol administration under different setups: U, uniform tissue; H, SAN heterogeneity; UF, uniform SAN tissue with fibroblast; HF, SAN heterogeneity with fibroblast. *p
3.6 Overdrive suppression of the SAN with isoproterenol administration
We next added external 2 Hz pacing along with 1 µM ISO infusion. The models showed average
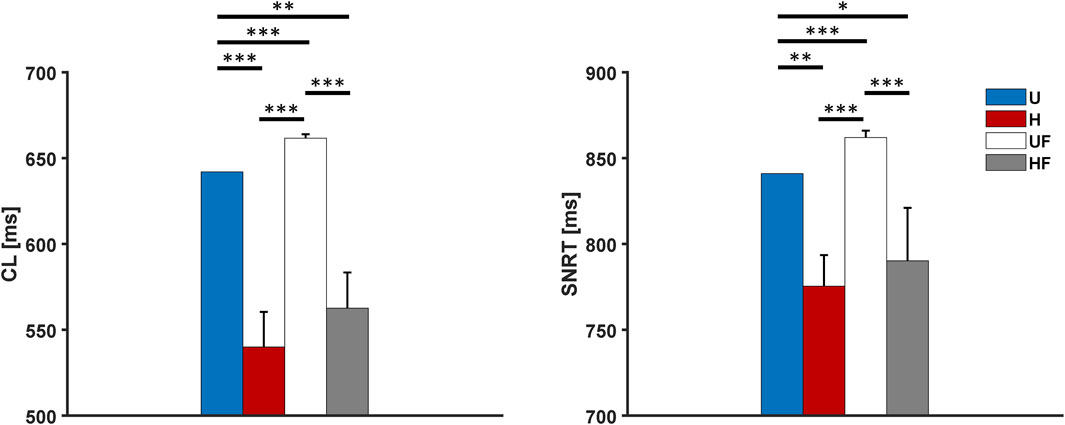
Figure 8. Cycle length and sinus node recovery time results for the human model with 1 µM of isoproterenol administration after 2-Hz pacing under different setups: U, uniform tissue; H, SAN heterogeneity; UF, uniform SAN tissue with fibroblast; HF, SAN heterogeneity with fibroblast. *p
3.7 Funny current block in the SAN
To evaluate if the model was robust to loss of depolarising current during diastole and if the heterogeneity and fibroblasts contributed to its strength, the funny current
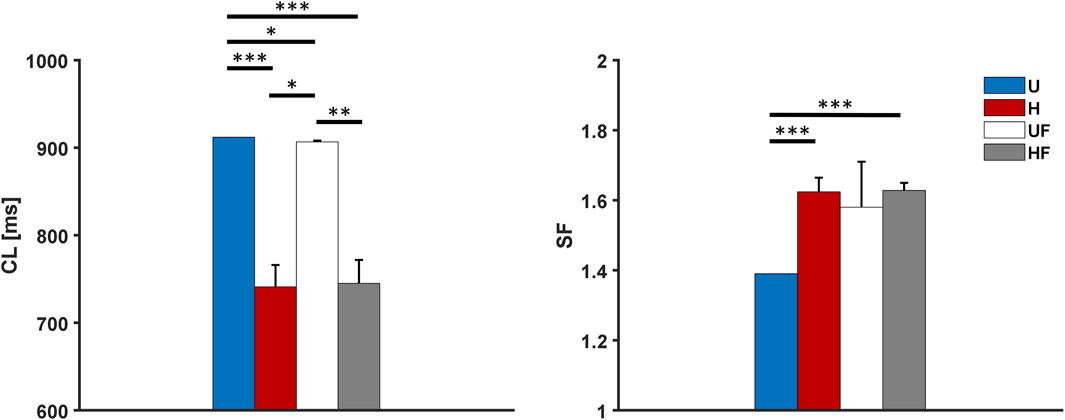
Figure 9. Cycle length and safety factor results for the human model with 50% funny current block under different setups: U, uniform tissue; H, SAN heterogeneity; UF, uniform SAN tissue with fibroblast; HF, SAN heterogeneity with fibroblast. *p
Both setups show lower
3.8 L-type calcium current block in the SAN
The L-type calcium current determines the slow SAN AP. Therefore, we simulated a 25% reduction in
Supplementary Figure S3 summarises the
3.9 Effects of SEP width and mosaic configuration on atrial driving
To gain further understanding of the driving mechanisms, two additional model parameters were investigated, namely the width of the exit pathways and cellular organisations at their interfaces. Table 1 reports the effects of the SEP width on the driving capability of the SAN, showing that there is a lower limit (width = 11 cells) for propagation. The results are similar for both the K and MBS models, with no modulations of the
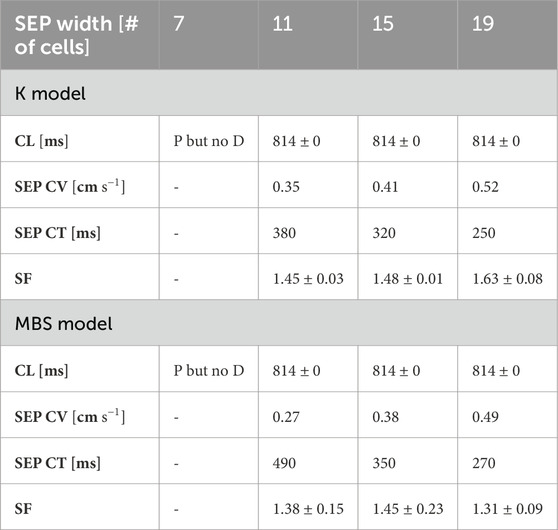
Table 1. Effects of SEP width on pacing and driving under the K and MBS models. P but no D, pace but no drive; CV, conduction velocity; CT, conduction time; CL, cycle length; SF, safety factor.
3.10 Combining heterogeneity, fibroblasts, and neural modulation
A final set of simulations including heterogeneity, fibroblasts (HF tissue #3 with K model), and simultaneous administration of 25 nM of ACh as well as 1 µM of ISO (hereafter called the ‘full’ model), was implemented to model a condition as close to the SAN physiology as possible. To reproduce the physiological activation sequence,
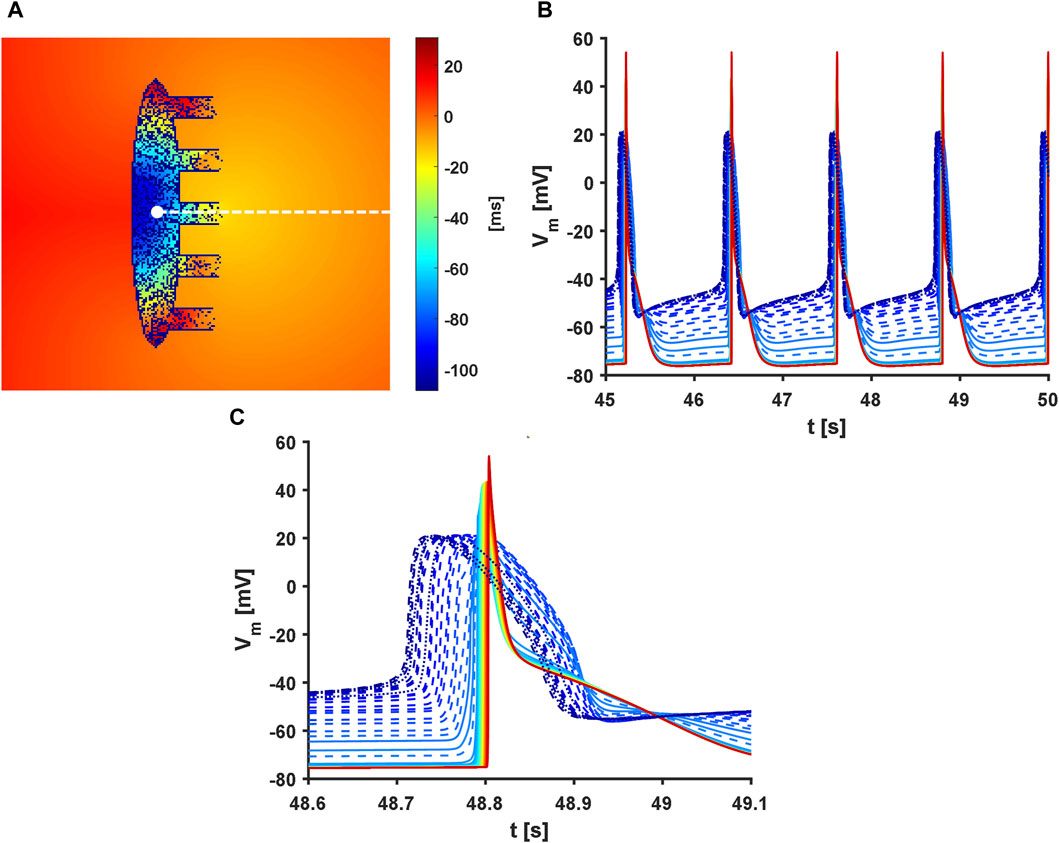
Figure 10. Activation sequence in the full model. Presence of heterogeneity and fibroblasts along with administration of 25 nM of acetylcholine and 1 µM of isoproterenol were considered. In addition,
When the
4 Discussion
The results reported above indicate that the proposed model shows atrial driving across both physiological and pathological conditions affecting the SAN. Furthermore, the simulation results suggest that heterogeneity and fibroblasts increase the driving capability of the SAN while also improving its recovery from overdrive suppression.
4.1 Heterogeneity and fibroblasts increase robustness of atrial driving
The important and novel roles of cellular heterogeneity and fibroblasts displayed by the proposed model include increasing the ability of the human SAN to drive the atrium (Figures 3, 5, 7, and 9). In all conditions, the H configuration showed substantially higher
The administration of 1 µM of ISO showed synergistic effects with both the H and HF configurations, producing greater increases in the
The full model showed an
4.2 Heterogeneity and fibroblasts provide protection from reductions of key ion currents
The simulations with
4.3 Heterogeneity and fibroblasts improve recovery from overdrive suppression
In this work, the indirect
After pacing at 2 Hz, all setups showed SNRT values close to experimental observations in two explanted human hearts: U = 1,102 ms, H = 1,047
Furthermore, simulations with administration of 25 nM of ACh showed that the fibroblasts greatly reduced the
4.4 Heart rate modulation by heterogeneity and fibroblasts
In the uniform setup, the models showed
The occurrences of exit blocks in the baseline H setups explain the large atrial
By itself, the presence of fibroblasts prolongs the
Interestingly, when ACh is applied, the combination of heterogeneity and fibroblasts prevents the occurrence of exit blocks in the H model and shortens the
In the full model, a heart rate of 50 bpm was obtained; this slight bradycardia was the consequence of the reduced
4.5 Heterogeneity and fibroblasts shift the leading pacemaker location
Depending on both the randomised ionic properties and the fibroblast distribution, clusters with different intrinsic properties (e.g. beating rate) are formed inside the tissue and become dominant. The activation sequence originates according to the locations of these clusters (Supplementary Figure S5 and Supplementary Movie S6) and more distally from the atrium compared to the uniform model.
Thus, the physiological levels of heterogeneity (
Interestingly, maintaining a fixed distribution of the diffused fibroblasts while changing the heterogeneity distribution always resulted in atrial activation from the same SEP (not shown), suggesting that the fibroblasts may guide propagation. This is further strengthened by symmetrical simulations in which the distribution of cellular heterogeneity was fixed and that of the fibroblasts was changed, resulting in atrial activation via different SEPs.
4.6 Gradients in the gap-junctional conductivity are necessary to achieve atrial driving
A steep gradient in the gap-junctional coupling was found to be necessary to achieve atrial driving. This suggests that the most important parameter for achieving robust atrial excitation is intercellular coupling, as highlighted in previous works (Kharche et al., 2017; Inada et al., 2014; Amsaleg et al., 2022). Indeed, the slope, half value, and transition shapes inside and outside the SEPs were seen to deeply affect propagation, with only a fine balance among these parameters allowing propagation in the model, as reported in the Methods.
4.7 Effects of exit pathway widths and numbers
The number of SEPs does not influence the average
As the SEP widths increased, slight increases in the conduction velocity (and consequent reductions in the conduction times) were obtained in both the K and MBS models (Table 1). However, the
4.8 Mosaic configuration helps to achieve atrial driving
In the last set of simulations, the MBS model was less easily excitable than the K model; the reason for this is that the present work only involved the 29 equations describing the APs of the atrial cells, while neglecting the ones devoted to modelling the mechanoelectric feedback and calmodulin-kinase activity. Although the AP features were still in accordance with experimental values (Supplementary Table S1), this set of equations was not optimised to describe the electrophysiology of single atrial cells. For example, the maximal upstroke velocity was lower than in the original MBS model (
Although further refinements are needed to use the electrophysiological equations of the MBS model in a standalone manner, these simulations provide some useful information on atrial driving. First, atrial cells interspersed in the exit pathways (so-called mosaic model) actually help propagation compared to a flat interface. Although this setup was not needed with the K model, its addition to the gradients in the gap-junctional coupling could represent a more robust and hence more likely anatomical architecture of the SAN (Karpaev et al., 2018; Amsaleg et al., 2022). Therefore, it was included in the full model. Second if the SAN heterogeneity increases the amount of charge delivered to the atrial cells (as discussed above), this is insufficient to overcome the gaps that can be addressed only by coupling or anatomical aspects (such as the gradient and mosaic configurations). Indeed, without the addition of the mosaic setup, only one SAN heterogeneous distribution was shown to drive atrial tissues comprising the MBS model (and to an unphysiologically low rate owing to exit blocks).
4.9 Limitations
The present model has several shortcomings. First, to the best of our knowledge, no SAN-specific fibroblast model exists for humans or any other species. In this work, we chose to use the model by Morgan et al. (2016) as it is a more similar phenotype (atrial) to other human fibroblast models (Sachse et al., 2008; Maleckar et al., 2009; Liu et al., 2021).
Second, the fibroblasts were distributed diffusely according to a concentration gradient, with higher amounts distally from the crista terminalis and lower amounts when approaching the ends of the SEPs (Li et al., 2023). However, histological sections of the SANs of different species of mammals showed that the fibroblasts actually formed structural networks supporting and protecting different clusters of SAN myocytes (Camelliti et al., 2004; Sánchez-Quintana et al., 2002; Smithers et al., 2021).
Third, the 2D geometry adopted herein represents a rough simplification of the complex structure of the SAN (Chandler et al., 2011; Fedorov et al., 2010; Csepe et al., 2016) and is simpler than other recent models that also consider fibre direction (Amsaleg et al., 2022; Zhao et al., 2023). Considering that the anatomy has a clear impact on function in an elaborate structure like the SAN (Nikolaidou et al., 2012), our stylised model geometry affects the results quantitatively. For example, conically shaped SEPs may increase the driving strength and limit re-entry occurrence by providing less favourable source–sink balance for the excitations entering the SAN. Moreover, we did not consider the presence of spatially dependent distributions of ACh receptors (Lang et al., 2011) or localisation of different intrinsic pacemaking properties in the specialised SAN clusters (Brennan et al., 2020; Maltsev et al., 2023), which were aspects proposed to explain the shifts in the leading pacemaker location following autonomic modulation.
However, the main drawback of the proposed model is the slow conduction within the exit pathways. Considering a SAN CL of 67 μm, the average conduction velocity in the SAN was
Finally, as a first approach, all the conditions tested in this work were only with regard to the SAN. This is reasonable considering the presence of fibroblasts and vagal tone, which are known to be minimal in the right atrium under physiological conditions. However, this approach neglects the heterogeneity in the ionic properties of the atrial tissue and its responses to sympathetic stimulation, which likely play roles in modulating the ability of the SAN to drive the atrium.
5 Conclusion
Despite the limitations noted above, our simulations predict that heterogeneity and fibroblasts, and particularly their synergistic actions, are beneficial to the physiology of the SAN since they enlarge the parametric space in which the SAN is able to effectively drive the atrium in the 2D human computational models. This represents a fascinating concept since these properties are usually deemed to be detrimental when dealing with the working myocardium. For example, heterogeneity in ventricular repolarisation times has been recognised as a mechanism of onset of arrhythmia and an underlying cause of sudden cardiac death (Amoni et al., 2023). Similarly, both fibroblast proliferation and fibrosis have been shown to serve as substrates for both ventricular and atrial arrhythmias (Nguyen et al., 2014; Pellman et al., 2016; Morgan et al., 2016; Cochet et al., 2018) as well as thought to have roles in sinus node dysfunction (Hao et al., 2011; Wolf et al., 2013; Glukhov et al., 2013; Lou et al., 2014; Glukhov et al., 2015; Kharche et al., 2017; Luo et al., 2013).
One of the reasons why previous computational works have obtained hampered SAN functions when simulating the presence of non-myocardial tissue is that resistive barriers (fibrosis) or passive loads were used as the modelling approaches (Oren and Clancy, 2010; Kharche et al., 2017), as opposed to the presence of fibroblast–myocyte coupling that was evaluated in this work. This overlooks the ability of the fibroblasts to act as current sources when the membrane voltages of the SAN cells are below their resting potentials—a feature that is actually beneficial to their pacemaking activity (Karpaev et al., 2018)—as reported in ventricular tissue cultures (Miragoli et al., 2007).
If validated through experimental studies, these model predictions can provide explanations to the extraordinary amounts of cellular heterogeneity and fibroblasts seen in sinoatrial tissue, without ruling out other hypothesis such as the role of fibroblasts in mechanical protection.
Data availability statement
The code used for this study (simulation and analysis) can be found in: https://github.com/Eugenio95/2D_SAN_ATRIUM. Further inquiries can be directed to the corresponding author.
Author contributions
ER: conceptualization, data curation, investigation, methodology, software, and writing–original draft. FM: writing–review and editing, data curation, investigation, and software. MM: conceptualization, methodology, software, and writing–original draft. SS: conceptualization, funding acquisition, methodology, resources, supervision, and writing–review and editing. CB: conceptualization, funding acquisition, resources, supervision, and writing–review and editing.
Funding
The author(s) declare that financial support was received for the research, authorship, and/or publication of this article. CB and SS received funding from the European Union - NextGenerationEU through the Italian Ministry of University and Research under the PNRR - M4C2-I1.3 Project PR_00000019 “HEAL ITALIA” (CUP J33C22002920006). MM received funding from the ICSC National Research Centre for High Performance Computing, Big Data and Quantum Computing within the NextGenerationEU program (CUP J33C22001170001).
Conflict of interest
The authors declare that the research was conducted in the absence of any commercial or financial relationships that could be construed as a potential conflict of interest.
Publisher’s note
All claims expressed in this article are solely those of the authors and do not necessarily represent those of their affiliated organizations, or those of the publisher, the editors, and the reviewers. Any product that may be evaluated in this article, or claim that may be made by its manufacturer, is not guaranteed or endorsed by the publisher.
Supplementary material
The Supplementary Material for this article can be found online at: https://www.frontiersin.org/articles/10.3389/fphys.2024.1408626/full#supplementary-material
References
Amoni M., Ingelaere S., Moeyersons J., Wets D., Tanushi A., Van Huffel S., et al. (2023). Regional beat-to-beat variability of repolarization increases during ischemia and predicts imminent arrhythmias in a pig model of myocardial infarction. Am. J. Physiology-Heart Circulatory Physiology 325, H54–H65. doi:10.1152/ajpheart.00732.2022
Amsaleg A., Sánchez J., Mikut R., Loewe A. (2022). Characterization of the pace-and-drive capacity of the human sinoatrial node: a 3D in silico study. Biophysical J. 121, 4247–4259. doi:10.1016/j.bpj.2022.10.020
Anumonwo J. M., Wang H. Z., Trabka-Janik E., Dunham B., Veenstra R. D., Delmar M., et al. (1992). Gap junctional channels in adult mammalian sinus nodal cells. Immunolocalization and electrophysiology. Circulation Res. 71, 229–239. doi:10.1161/01.RES.71.2.229
Boyett M., Honjo H., Kodama I. (2000). The sinoatrial node, a heterogeneous pacemaker structure. Cardiovasc. Res. 47, 658–687. doi:10.1016/S0008-6363(00)00135-8
Boyle P. M., Vigmond E. J. (2010). An intuitive safety factor for cardiac propagation. Biophysical J. 98, L57–L59. doi:10.1016/j.bpj.2010.03.018
Brennan J. A., Chen Q., Gams A., Dyavanapalli J., Mendelowitz D., Peng W., et al. (2020). Evidence of superior and inferior sinoatrial nodes in the mammalian heart. JACC Clin. Electrophysiol. 6, 1827–1840. doi:10.1016/j.jacep.2020.09.012
Cacciani F., Zaniboni M. (2015). Chronotropic modulation of the source-sink relationship of sinoatrial-atrial impulse conduction and its significance to initiation of af: a one-dimensional model study. BioMed Res. Int. 2015, 496418–18. doi:10.1155/2015/496418
Camelliti P., Green C. R., LeGrice I., Kohl P. (2004). Fibroblast network in rabbit sinoatrial node: structural and functional identification of homogeneous and heterogeneous cell coupling. Circulation Res. 94, 828–835. doi:10.1161/01.RES.0000122382.19400.14
Campana C., Ricci E., Bartolucci C., Severi S., Sobie E. A. (2022). Coupling and heterogeneity modulate pacemaking capability in healthy and diseased two-dimensional sinoatrial node tissue models. PLOS Comput. Biol. 18, e1010098. doi:10.1371/journal.pcbi.1010098
Chandler N., Aslanidi O., Buckley D., Inada S., Birchall S., Atkinson A., et al. (2011). Computer Three?Dimensional anatomical reconstruction of the human sinus node and a novel paranodal area. Anat. Rec. 294, 970–979. doi:10.1002/ar.21379
Cochet H., Dubois R., Yamashita S., Al Jefairi N., Berte B., Sellal J.-M., et al. (2018). Relationship between fibrosis detected on late gadolinium-enhanced cardiac magnetic resonance and Re-entrant activity assessed with electrocardiographic imaging in human persistent atrial fibrillation. JACC Clin. Electrophysiol. 4, 17–29. doi:10.1016/j.jacep.2017.07.019
Csepe T. A., Kalyanasundaram A., Hansen B. J., Zhao J., Fedorov V. V. (2015). Fibrosis: a structural modulator of sinoatrial node physiology and dysfunction. Front. Physiology 6, 37. doi:10.3389/fphys.2015.00037
Csepe T. A., Zhao J., Hansen B. J., Li N., Sul L. V., Lim P., et al. (2016). Human sinoatrial node structure: 3D microanatomy of sinoatrial conduction pathways. Prog. Biophysics Mol. Biol. 120, 164–178. doi:10.1016/j.pbiomolbio.2015.12.011
Csepe T. A., Zhao J., Sul L. V., Wang Y., Hansen B. J., Li N., et al. (2017). Novel application of 3D contrast-enhanced CMR to define fibrotic structure of the human sinoatrial node in vivo. Eur. Heart J. - Cardiovasc. Imaging 18, 862–869. doi:10.1093/ehjci/jew304
Fabbri A., Fantini M., Wilders R., Severi S. (2017a). Computational analysis of the human sinus node action potential: model development and effects of mutations. J. Physiology 595, 2365–2396. doi:10.1113/JP273259
Fabbri A., Loewe A., Wilders R., Severi S. (2017b). Pace-and-drive of the human sinoatrial node — a preliminary computational investigation. 2017 Comput. Cardiol. (CinC), 1–4. doi:10.22489/CinC.2017.120-218
Fahrenbach J. P., Mejia-Alvarez R., Banach K. (2007). The relevance of non-excitable cells for cardiac pacemaker function: non-excitable cells and cardiac pacemaker function. J. Physiology 585, 565–578. doi:10.1113/jphysiol.2007.144121
Fedorov V. V., Glukhov A. V., Chang R., Kostecki G., Aferol H., Hucker W. J., et al. (2010). Optical mapping of the isolated coronary-perfused human sinus node. J. Am. Coll. Cardiol. 56, 1386–1394. doi:10.1016/j.jacc.2010.03.098
Ferrer A., Sebastián R., Sánchez-Quintana D., Rodríguez J. F., Godoy E. J., Martínez L., et al. (2015). Detailed anatomical and electrophysiological models of human atria and torso for the simulation of atrial activation. PLOS ONE 10, e0141573. doi:10.1371/journal.pone.0141573
Garny A., Kohl P., Hunter P. J., Boyett M. R., Noble D. (2003). One-dimensional rabbit sinoatrial node models: benefits and limitations. J. Cardiovasc. Electrophysiol. 14, S121–S132. doi:10.1046/j.1540.8167.90301.x
Glukhov A. V., Hage L. T., Hansen B. J., Pedraza-Toscano A., Vargas-Pinto P., Hamlin R. L., et al. (2013). Sinoatrial node reentry in a canine chronic left ventricular infarct model: role of intranodal fibrosis and heterogeneity of refractoriness. Circulation Arrhythmia Electrophysiol. 6, 984–994. doi:10.1161/CIRCEP.113.000404
Glukhov A. V., Kalyanasundaram A., Lou Q., Hage L. T., Hansen B. J., Belevych A. E., et al. (2015). Calsequestrin 2 deletion causes sinoatrial node dysfunction and atrial arrhythmias associated with altered sarcoplasmic reticulum calcium cycling and degenerative fibrosis within the mouse atrial pacemaker complex1. Eur. Heart J. 36, 686–697. doi:10.1093/eurheartj/eht452
Hao X., Zhang Y., Zhang X., Nirmalan M., Davies L., Konstantinou D., et al. (2011). TGF-β1-mediated fibrosis and ion channel remodeling are key mechanisms in producing the sinus node dysfunction associated with SCN5A deficiency and aging. Circulation. Arrhythmia Electrophysiol. 4, 397–406. doi:10.1161/CIRCEP.110.960807
Inada S., Zhang H., Tellez J. O., Shibata N., Nakazawa K., Kamiya K., et al. (2014). Importance of gradients in membrane properties and electrical coupling in sinoatrial node pacing. PLoS ONE 9, e94565. doi:10.1371/journal.pone.0094565
Jæger K. H., Tveito A. (2023). The simplified Kirchhoff network model (SKNM): a cell-based reaction–diffusion model of excitable tissue. Sci. Rep. 13, 16434. doi:10.1038/s41598-023-43444-9
Joyner R., van Capelle F. (1986). Propagation through electrically coupled cells. How a small SA node drives a large atrium. Biophysical J. 50, 1157–1164. doi:10.1016/S0006-3495(86)83559-7
Kalyanasundaram A., Li N., Gardner M. L., Artiga E. J., Hansen B. J., Webb A., et al. (2021). Fibroblast-specific proteotranscriptomes reveal distinct fibrotic signatures of human sinoatrial node in nonfailing and failing hearts. Circulation 144, 126–143. doi:10.1161/CIRCULATIONAHA.120.051583
Karpaev A. A., Syunyaev R. A., Aliev R. R. (2018). Effects of fibroblast-myocyte coupling on the sinoatrial node activity: a computational study. Int. J. Numer. Methods Biomed. Eng. 34, e2966. doi:10.1002/cnm.2966
Kharche S. R., Vigmond E., Efimov I. R., Dobrzynski H. (2017). Computational assessment of the functional role of sinoatrial node exit pathways in the human heart. PLOS ONE 12, e0183727. doi:10.1371/journal.pone.0183727
Koivumäki J. T., Korhonen T., Tavi P. (2011). Impact of sarcoplasmic reticulum calcium release on calcium dynamics and action potential morphology in human atrial myocytes: a computational study. PLOS Comput. Biol. 7, e1001067. doi:10.1371/journal.pcbi.1001067
Kojodjojo P., Kanagaratnam P., Markides V., Davies D. W., Peters N. (2006). Age-related changes in human left and right atrial conduction. J. Cardiovasc. Electrophysiol. 17, 120–127. doi:10.1111/j.1540-8167.2005.00293.x
Lang D., Petrov V., Lou Q., Osipov G., Efimov I. R. (2011). Spatiotemporal control of heart rate in a rabbit heart. J. Electrocardiol. 44, 626–634. doi:10.1016/j.jelectrocard.2011.08.010
Li N., Hansen B. J., Csepe T. A., Zhao J., Ignozzi A. J., Sul L. V., et al. (2017). Redundant and diverse intranodal pacemakers and conduction pathways protect the human sinoatrial node from failure. Sci. Transl. Med. 9, eaam5607. doi:10.1126/scitranslmed.aam5607
Li N., Hansen B. J., Kennelly J., Kalyanasundaram A., Kanaan A., Simonetti O. P., et al. (2023). High-resolution 3-dimensional multimodality imaging to resolve intramural human sinoatrial node pacemakers and epicardial-endocardial atrial exit sites. Circulation Arrhythmia Electrophysiol. 16, e011528. doi:10.1161/CIRCEP.122.011528
Li N., Kalyanasundaram A., Hansen B. J., Artiga E. J., Sharma R., Abudulwahed S. H., et al. (2020). Impaired neuronal sodium channels cause intranodal conduction failure and reentrant arrhythmias in human sinoatrial node. Nat. Commun. 11, 512. doi:10.1038/s41467-019-14039-8
Liu F., Wu H., Yang X., Dong Y., Huang G., Genin G. M., et al. (2021). A new model of myofibroblast-cardiomyocyte interactions and their differences across species. Biophysical J. 120, 3764–3775. doi:10.1016/j.bpj.2021.06.040
Lou Q., Glukhov A. V., Hansen B., Hage L., Vargas-Pinto P., Billman G. E., et al. (2013). Tachy-brady arrhythmias: the critical role of adenosine-induced sinoatrial conduction block in post-tachycardia pauses. Heart rhythm. 10, 110–118. doi:10.1016/j.hrthm.2012.09.012
Lou Q., Hansen B. J., Fedorenko O., Csepe T. A., Kalyanasundaram A., Li N., et al. (2014). Upregulation of adenosine A1 receptors facilitates sinoatrial node dysfunction in chronic canine heart failure by exacerbating nodal conduction abnormalities revealed by novel dual-sided intramural optical mapping. Circulation 130, 315–324. doi:10.1161/CIRCULATIONAHA.113.007086
Luo M., Guan X., Luczak E. D., Lang D., Kutschke W., Gao Z., et al. (2013). Diabetes increases mortality after myocardial infarction by oxidizing CaMKII. J. Clin. Investigation 123, 1262–1274. doi:10.1172/JCI65268
Maleckar M. M., Greenstein J. L., Giles W. R., Trayanova N. A. (2009). Electrotonic coupling between human atrial myocytes and fibroblasts alters myocyte excitability and repolarization. Biophysical J. 97, 2179–2190. doi:10.1016/j.bpj.2009.07.054
Maltsev A. V., Stern M. D., Lakatta E. G., Maltsev V. A. (2022). Functional heterogeneity of cell populations increases robustness of pacemaker function in a numerical model of the sinoatrial node tissue. Front. Physiology 13, 845634. doi:10.3389/fphys.2022.845634
Maltsev A. V., Stern M. D., Lakatta E. G., Maltsev V. A. (2023). A novel conceptual model of heart rate autonomic modulation based on a small-world modular structure of the sinoatrial node. Front. Physiology 14, 1276023. doi:10.3389/fphys.2023.1276023
Mazhar F., Bartolucci C., Regazzoni F., Paci M., Dedá L., Quarteroni A., et al. (2023). A detailed mathematical model of the human atrial cardiomyocyte: integration of electrophysiology and cardiomechanics. J. Physiology. doi:10.1113/JP283974
Miragoli M., Salvarani N., Rohr S. (2007). Myofibroblasts induce ectopic activity in cardiac tissue. Circulation Res. 101, 755–758. doi:10.1161/CIRCRESAHA.107.160549
Morgan R., Colman M. A., Chubb H., Seemann G., Aslanidi O. V. (2016). Slow conduction in the border zones of patchy fibrosis stabilizes the drivers for atrial fibrillation: insights from multi-scale human atrial modeling. Front. Physiology 7, 474. doi:10.3389/fphys.2016.00474
Nguyen T. P., Qu Z., Weiss J. N. (2014). Cardiac fibrosis and arrhythmogenesis: the road to repair is paved with perils. J. Mol. Cell. Cardiol. 70, 83–91. doi:10.1016/j.yjmcc.2013.10.018
Nikolaidou T., Aslanidi O. V., Zhang H., Efimov I. R. (2012). Structure–function relationship in the sinus and atrioventricular nodes. Pediatr. Cardiol. 33, 890–899. doi:10.1007/s00246-012-0249-0
Opthof T. (2000). The normal range and determinants of the intrinsic heart rate in man. Cardiovasc. Res. 45, 177–184. doi:10.1016/S0008-6363(99)00322-3
Oren R. V., Clancy C. E. (2010). Determinants of heterogeneity, excitation and conduction in the sinoatrial node: a model study. PLoS Comput. Biol. 6, e1001041. doi:10.1371/journal.pcbi.1001041
Pellman J., Zhang J., Sheikh F. (2016). Myocyte-fibroblast communication in cardiac fibrosis and arrhythmias: mechanisms and model systems. J. Mol. Cell. Cardiol. 94, 22–31. doi:10.1016/j.yjmcc.2016.03.005
Peters C. H., Sharpe E. J., Proenza C. (2020). Cardiac pacemaker activity and aging. Annu. Rev. Physiology 82, 21–43. doi:10.1146/annurev-physiol-021119-034453
Ravelli F., Masá M., Del Greco M., Marini M., Disertori M. (2011). Acute atrial dilatation slows conduction and increases AF vulnerability in the human atrium. J. Cardiovasc. Electrophysiol. 22, 394–401. doi:10.1111/j.1540-8167.2010.01939.x
Ricci E., Bartolucci C., Severi S. (2021). Effects of density and distribution of non-spontaneous myocytes, scars and fibroblasts inside the human sinoatrial node. 2021 Comput. Cardiol. (CinC) 48, 1–4. doi:10.23919/CinC53138.2021.9662905
Ricci E., Bartolucci C., Severi S. (2023). The virtual sinoatrial node: what did computational models tell us about cardiac pacemaking? Prog. Biophysics Mol. Biol. 177, 55–79. doi:10.1016/j.pbiomolbio.2022.10.008
Rook M. B., van Ginneken A. C., de Jonge B., el Aoumari A., Gros D., Jongsma H. J. (1992). Differences in gap junction channels between cardiac myocytes, fibroblasts, and heterologous pairs. Am. J. Physiology-Cell Physiology 263, C959–C977. doi:10.1152/ajpcell.1992.263.5.C959
Sachse F. B., Moreno A. P., Abildskov J. A. (2008). Electrophysiological modeling of fibroblasts and their interaction with myocytes. Ann. Biomed. Eng. 36, 41–56. doi:10.1007/s10439-007-9405-8
Sánchez-Quintana D., Anderson R. H., Cabrera J. A., Climent V., Martin R., Farré J., et al. (2002). The terminal crest: morphological features relevant to electrophysiology. Heart 88, 406–411. doi:10.1136/heart.88.4.406
Smithers R. L., Kao H. K., Zeigler S., Yechikov S., Nolta J. A., Chan J. W., et al. (2021). Making heads or tails of the large mammalian sinoatrial node micro-organization. Circulation Arrhythmia Electrophysiol. 14, e010465. doi:10.1161/CIRCEP.121.010465
Sobie E. A. (2009). Parameter sensitivity analysis in electrophysiological models using multivariable regression. Biophysical J. 96, 1264–1274. doi:10.1016/j.bpj.2008.10.056
Valiant L. G. (1990). A bridging model for parallel computation. Commun. ACM 33, 103–111. doi:10.1145/79173.79181
Verheule S., van Kempen M. J. A., Postma S., Rook M. B., Jongsma H. J. (2001). Gap junctions in the rabbit sinoatrial node. Am. J. Physiology-Heart Circulatory Physiology 280, H2103–H2115. doi:10.1152/ajpheart.2001.280.5.H2103
Wang Y., Li Q., Tao B., Angelini M., Ramadoss S., Sun B., et al. (2023). Fibroblasts in heart scar tissue directly regulate cardiac excitability and arrhythmogenesis. Science 381, 1480–1487. doi:10.1126/science.adh9925
Wolf R. M., Glynn P., Hashemi S., Zarei K., Mitchell C. C., Anderson M. E., et al. (2013). Atrial fibrillation and sinus node dysfunction in human ankyrin-B syndrome: a computational analysis. Am. J. Physiology-Heart Circulatory Physiology 304, H1253–H1266. doi:10.1152/ajpheart.00734.2012
Xie Y., Garfinkel A., Camelliti P., Kohl P., Weiss J. N., Qu Z. (2009). Effects of fibroblast-myocyte coupling on cardiac conduction and vulnerability to reentry: a computational study. Heart rhythm. 6, 1641–1649. doi:10.1016/j.hrthm.2009.08.003
Zhao J., Sharma R., Kalyanasundaram A., Kennelly J., Bai J., Li N., et al. (2023). Mechanistic insight into the functional role of human sinoatrial node conduction pathways and pacemaker compartments heterogeneity: a computer model analysis. PLOS Comput. Biol. 19, e1011708. doi:10.1371/journal.pcbi.1011708
Zyantekorov D., Syunyaev R., Kharche S., Atkinson A., Dobrzynski H., McIntire M., et al. (2018). “Is insulating border necessary for human SAN?,” in CompBioMed conference. Available at: https://www.compbiomed-conference.org/wp-content/uploads/2019/07/CBMC19_paper_34.pdf.
Keywords: electrophysiology, mathematical model, sinoatrial node, pacemaking, heterogeneity, fibroblasts, high-performance computing
Citation: Ricci E, Mazhar F, Marzolla M, Severi S and Bartolucci C (2024) Sinoatrial node heterogeneity and fibroblasts increase atrial driving capability in a two-dimensional human computational model. Front. Physiol. 15:1408626. doi: 10.3389/fphys.2024.1408626
Received: 28 March 2024; Accepted: 04 June 2024;
Published: 30 July 2024.
Edited by:
Ana M. Gomez, Institut National de la Santé et de la Recherche Médicale (INSERM), FranceReviewed by:
Almudena Val-Blasco, Fundación para la Investigación Biomédica del Hospital Universitario La Paz (FIBHULP), SpainJoakim Sundnes, Simula Research Laboratory, Norway
Copyright © 2024 Ricci, Mazhar, Marzolla, Severi and Bartolucci. This is an open-access article distributed under the terms of the Creative Commons Attribution License (CC BY). The use, distribution or reproduction in other forums is permitted, provided the original author(s) and the copyright owner(s) are credited and that the original publication in this journal is cited, in accordance with accepted academic practice. No use, distribution or reproduction is permitted which does not comply with these terms.
*Correspondence: Chiara Bartolucci, Y2hpYXJhLmJhcnRvbHVjY2k0QHVuaWJvLml0
 Eugenio Ricci
 Fazeelat Mazhar
 Moreno Marzolla2
 Stefano Severi
 Chiara Bartolucci