 Praveena Ganesan1
 G. P. Ramesh
 Przemysław Falkowski-Gilski
94% of researchers rate our articles as excellent or good
Learn more about the work of our research integrity team to safeguard the quality of each article we publish.
Find out more
ORIGINAL RESEARCH article
Front. Physiol. , 09 July 2024
Sec. Computational Physiology and Medicine
Volume 15 - 2024 | https://doi.org/10.3389/fphys.2024.1380459
Introduction: Alzheimer’s Disease (AD) is a degenerative brain disorder characterized by cognitive and memory dysfunctions. The early detection of AD is necessary to reduce the mortality rate through slowing down its progression. The prevention and detection of AD is the emerging research topic for many researchers. The structural Magnetic Resonance Imaging (sMRI) is an extensively used imaging technique in detection of AD, because it efficiently reflects the brain variations.
Methods: Machine learning and deep learning models are widely applied on sMRI images for AD detection to accelerate the diagnosis process and to assist clinicians for timely treatment. In this article, an effective automated framework is implemented for early detection of AD. At first, the Region of Interest (RoI) is segmented from the acquired sMRI images by employing Otsu thresholding method with Tunicate Swarm Algorithm (TSA). The TSA finds the optimal segmentation threshold value for Otsu thresholding method. Then, the vectors are extracted from the RoI by applying Local Binary Pattern (LBP) and Local Directional Pattern variance (LDPv) descriptors. At last, the extracted vectors are passed to Deep Belief Networks (DBN) for image classification.
Results and Discussion: The proposed framework achieves supreme classification accuracy of 99.80% and 99.92% on the Alzheimer’s Disease Neuroimaging Initiative (ADNI) and Australian Imaging, Biomarker and Lifestyle flagship work of ageing (AIBL) datasets, which is higher than the conventional detection models.
The brain is the most complex and significant organ of the human being with numerous crucial functions like memory, imagination, decision-making, thinking, problem solving, and idea formation (Basaia et al., 2019; Li et al., 2018). AD is the common degenerative brain disorder; approximately 48 million people suffer from this disease and other types of dementias. AD occurs due to the abnormal chemical reactions, head injuries, genetic factors, and environmental factors (Sathiyamoorthi et al., 2021; Chui et al., 2022). The main symptoms of AD are behavior disruption, communication problems, recognition problems, cognition problems, and memory loss. AD leads to the death of brain cells, which causes cognitive power, thinking, and loss of memory (Vaithinathan and Parthiban, 2019). The speed of AD progression differs from patient to patient, but it has a low diagnosis rate. The behavioral disturbance caused by the AD impairs the social functioning of patients (Zhang et al., 2019). The AD generally affects elderly people and even leads to death, when it is not treated and detected at an early stage. Therefore, it is essential to detect AD at an early stage to reduce its progression and decrease the mortality rate (Yue et al., 2019; Ghazi et al., 2021; Ning et al., 2021).
In recent decades, several brain-imaging techniques such as computed tomography, sMRI, positron emission tomography, functional MRI, etc., are used for early diagnosis of AD (Puente-Castro et al., 2020; Chelladurai et al., 2023). Compared to other brain-imaging techniques, sMRI images provide functional information and complementary structural information about the abnormal brain regions (Liu et al., 2021). The simplicity and quickness are considered as two of its numerous advantages of Otsu’s approach. The best threshold value to distinguish the foreground from background portions of the processed image which can be automatically determined, eliminating the need for prior knowledge of the image. For automating the AD detection, several machine-learning models such as decision tree, Support Vector Machine (SVM), k-nearest neighbors, XGBoost, etc., are employed, but the conventional models are prone to outliers and overfitting risks (Alqahtani et al., 2023; Ghosh et al., 2023). On the other hand, the deep-learning models have got more attention among researchers and also brought dramatic advancements and improvements in medical imaging, computer vision, image processing, and pattern recognition applications (Venugopalan et al., 2021; Qu et al., 2023). Deep Belief Networks (DBN) provide certain advantages over traditional neural networks by utilizing supervised learning and probabilistic modeling. It can process enormous quantities of data and use hidden units to quickly identify underlying correlations through fast training. The above-stated information’s motivates to detect the AD with minimum execution time by employing DBN models. The main contributions of the present article are denoted as follows:
• TSA is integrated with the Otsu thresholding method for precise RoI segmentation in the acquired sMRI images. The main motivation behind the Otsu thresholding method is to maximize the between class variance for determining the optimal threshold value, but it consumes more time. Therefore, in the conventional Otsu thresholding method, the TSA is employed to select the optimal threshold value for accurate RoI segmentation with minimal execution time.
• Then combined the LBP and LDPv descriptors for extracting texture feature vectors from the segmented RoI. Because of high discriminative power, the extraction of global feature vectors from sMRI images is computationally effective and robust.
• The extracted global feature vectors are passed into the DBN model for classifying four classes in the AIBL dataset and three classes in the ADNI dataset. In comparison to other classification models, the suggested DBN model efficiently captures non-linear feature vectors from the extracted feature vectors, which improves its ability in discriminating different classes. The performance of the Otsu-TSA method and DBN model are validated in terms of Jaccard Similarity Coefficient (JSC), Dice Similarity Coefficient (DSC), Pixel Accuracy (PA), specificity, execution time, classification accuracy, and sensitivity.
The structure of this research is organized as follows; The recent research papers on the topic AD detection are reviewed in Section 2. The details about the proposed methods (Otsu-TSA method and DBN model), and its mathematical equations are described in Section 3; The results analysis and comparisons of the proposed method are demonstrated in Section 4; finally, the conclusion of this research is stated in Section 5.
Xiao et al. (2017) performed scaling correction, intensity based non-uniformity correction, B1 non-uniformity correction, and gradient warping for enhancing the quality of sMRI images. Further, the textural and morphometric vectors were extracted from the pre-processed sMRI images. Then, the discriminative optimal vectors were selected by applying a recursive feature elimination technique, which were further passed to the SVM classifier for AD detection. The developed framework was only appropriate in the binary-class classification.
Ebrahimi-Ghahnavieh et al. (2019) performed transfer learning on MRI images for precise detection of AD. In this study, various pre-trained CNNs were applied on the datasets with multi-view and single-view modes. Initially, the vectors were extracted from the MRI images by employing CNN model, and the extracted vectors were passed to the Recurrent Neural Network (RNN) for image classification. The RNN faces concerns like gradient vanishing or exploding, and the computation of the neural network was too slow in image classification.
Lian et al. (2020) presented a hierarchical based Fully-CNN model for determining the discriminative local regions and patches in the MRI images for early detection of AD. Additionally, Bi et al. (2020) implemented a stacked CNN model for AD diagnosis. The presented CNN models achieved significant performance in AD detection on the ADNI datasets, but showed high time complexity. Furthermore, Hu et al. (2020) used the GAN model for AD detection by addressing class imbalance problems. In the context of image classification, training the GAN model was time consuming and computationally intensive.
Zhu et al. (2021) developed a Dual Attention Multi Instance Deep Learning (DA-MIDL) model for AD and Mild Cognitive Impairment (MCI) detection in the sMRI images. The developed DA-MIDL model had three major processes; (i) incorporate numerous spatial attention blocks in the Patch-Net model to extract discriminative vectors, (ii) perform pooling operation to balance every sMRI patch, and (iii) use a global attention aware classification model for making classification decisions. The results demonstrate that the developed DA-MIDL model achieved better classification performance by precisely identifying the pathological locations. The generalizability and classification accuracy were better than traditional methods. However, overfitting and lack of interpretability were the major concerns in the DA-MIDL model.
Mehmood et al. (2021) performed the tissue segmentation and classification using Layer Wise Transfer Learning (LWTL) for early detection of AD. Here, the LWTL was carried-out in the Visual Geometry Group (VGG) model for segregating Normal Controls (NC), AD, Late MCI (LMCI), and Early MCI (EMCI).
Ashraf et al. (2021) used 2nd and 3rd generation neural networks for AD classification. Additionally, several image augmentation techniques were utilized for improving feature extraction in the MRI images. Around 13 deep learning models were fine-tuned and trained on the ImageNet datasets. Among the trained models, the DenseNet model was more impressive in the AD classification than other models. Janghel and Rathore (2021) initially resized the collected images, and further, the VGG-16 model was employed for discriminative feature extraction. Lastly, the image classification was carried out utilizing decision tree, k-means clustering, and SVM. The results indicated that the developed model had better classification accuracy, but the execution time was high on the ADNI datasets.
Kang et al. (2021) presented an effective ensemble learning system based on CNN model for precise AD detection. The presented system included two phases: a majority voting was carried out in the first phase for disease prediction, and in the second phase, ResNet50 and VGG-16 models were integrated for constructing an ensemble learning classifier. Here, two transfer-learning strategies (task adaptation transfer and domain transfer) were utilized to manage the biomedical classification problems. The results represented that the presented ensemble learning system achieved better classification results than the single classifiers, but it exhibited high time complexity.
Fan et al. (2021) implemented a U-Net model for precise classification of AD. The U-Net model was effective in both image segmentation and classification tasks, while the skip-connections in the U-Net model efficiently improved the classification performance. While working with smaller datasets, the skip-connections in the U-Net model were prone to overfitting problems.
Liu et al. (2021) presented an effective framework for AD classification based on the CNNs. Initially, the brain images were portioned into dissimilar regions, and then the K-means clustering technique was employed for grouping the similar patches from every region. Finally, the features were learned from the grouped regions by employing the DenseNet model for image classification. In the DenseNet model, excessive parameters that led to overfitting problems were processed.
Naz et al. (2022) used convolutional networks with freeze-features for classifying AD, NC, and MCI in MRI scans. The presented framework had limited computational complexity and underwent fast training in relation to the conventional methods. AlSaeed and Omar (2022) utilized the ResNet50 and stacked Convolutional Neural Network (CNN) models for effective AD detection. The efficacy of the presented model was compared with traditional methods by using various evaluation measures, including accuracy. Here, the performance of the convolutional networks completely depends on the image quality.
Alhassan (2022) initially performed image pre-processing using skull stripping, linear registration, and geometry correction techniques. Then, the region segmentation was carried out by integrating the Otsu thresholding method with the Enhanced Fuzzy Elephant Herding Optimization (EFEHO) algorithm. The EFEHO algorithm quickly selected the optimal threshold value in the Otsu thresholding method for precise segmentation. Finally, the DA-MIDL model was implemented for AD classification, and the model’s efficacy was analyzed in the light of specificity, accuracy, and sensitivity. As a result, the DA-MIDL model had problems such as lack of interpretability and overfitting.
Rani Kaka and Prasad (2022) used region growing and adaptive histogram equalization techniques for removing the skull region and improving contrast of the MRI images. Then, the interested regions were segmented using the fuzzy c means technique, and further, the vectors were extracted using a local directional pattern and Gabor features. Finally, the feature selection and classification were carried-out by implementing a correlation/ensemble-based feature selection technique and a Multi-class SVM (MSVM) classifier. However, the MSVM classifier was inappropriate in the larger datasets when the target classes were overlapped.
Yu et al. (2022) introduced a multi-directional perception based Generative Adversarial Network (GAN) model for determining the severity of AD. The presented model efficiently captures salient global features and learns class discriminative maps for dissimilar classes by integrating L1 penalty, cycle consistency loss, classification loss, adversarial loss, and multi-directional mapping process in the conventional GAN model. Wang et al. (2022) developed a consistent perception-based GAN for precise segmentation of stroke lesions. The suggested method has been used for solving the imbalance problems, but it was time consuming and computationally intensive.
Shukla et al. (2024a) has demonstrated Structural biomarker-based AD detection via ensemble learning approaches. This work used ensemble learning and standard machine learning models to detect AD and its subtypes. The relative impact scores of the different AD cortical and subcortical areas and their subtypes were also determined. Binary and multiclass classification are the two levels used in the experimental investigation. The parahippocampal and entorhinal areas of the right hemisphere were found to be the most significant in the cortical-subcortical study. In the left hemisphere, the inferior temporal and isthmus cingulate regions also had a notable impact. However, more study remains required to develop sustainable methods for detecting AD and its stages.
Shukla et al. (2024b) analyzed a subcortical structure in AD using ensemble learning approaches. The combination of MRI and PET modalities is shown in this work, which could boost result visualization. Second, we analyzed the various subcortical structures using the Ensemble Model (EM) and further machine learning (ML) techniques to ascertain which region is more crucial for AD identification than other subtypes. The findings showed that the best regions for identifying AD, Mild Cognitive Impairment (MCI), And Cognitive Normal (CN) were the hippocampal, neuroregion, and the amygdala in the left and right hemispheres. Still, further data may be required to properly categorize AD and its stages.
Shukla et al. (2023) has presented AD detection from fused PET and MRI modalities with the help of an ensemble classifier. The multimodal approach is used in this paper to extensively explore the prediction of AD and its stages. Through the affine registration method, two modalities (MRI and PET) can be combined with the use of an automatic pipeline method called Free Surfer. The entire method makes use of pixel-level fusion. Following that, feature extraction is performed once more on both the fused and non-fused results. the traits that were taken from several cortical and subcortical brain regions, such as the putamen, amygdala, and hippocampus. The optimal qualities for categorization are retained after superimposing the fused features of both modalities and eliminating extraneous aspects. The promise of image- and feature-level fusion approaches as features for ensemble classification models was demonstrated, and these models exhibit sustained performance in Binary and Multi Class classification. On the other hand, accuracy for Multi Class is also respectable, however it can still be improved upon when compared to the Binary findings. Table 1 provides the tabulation form for the summary of AD classification papers focused on ADNI and AIBL datasets.
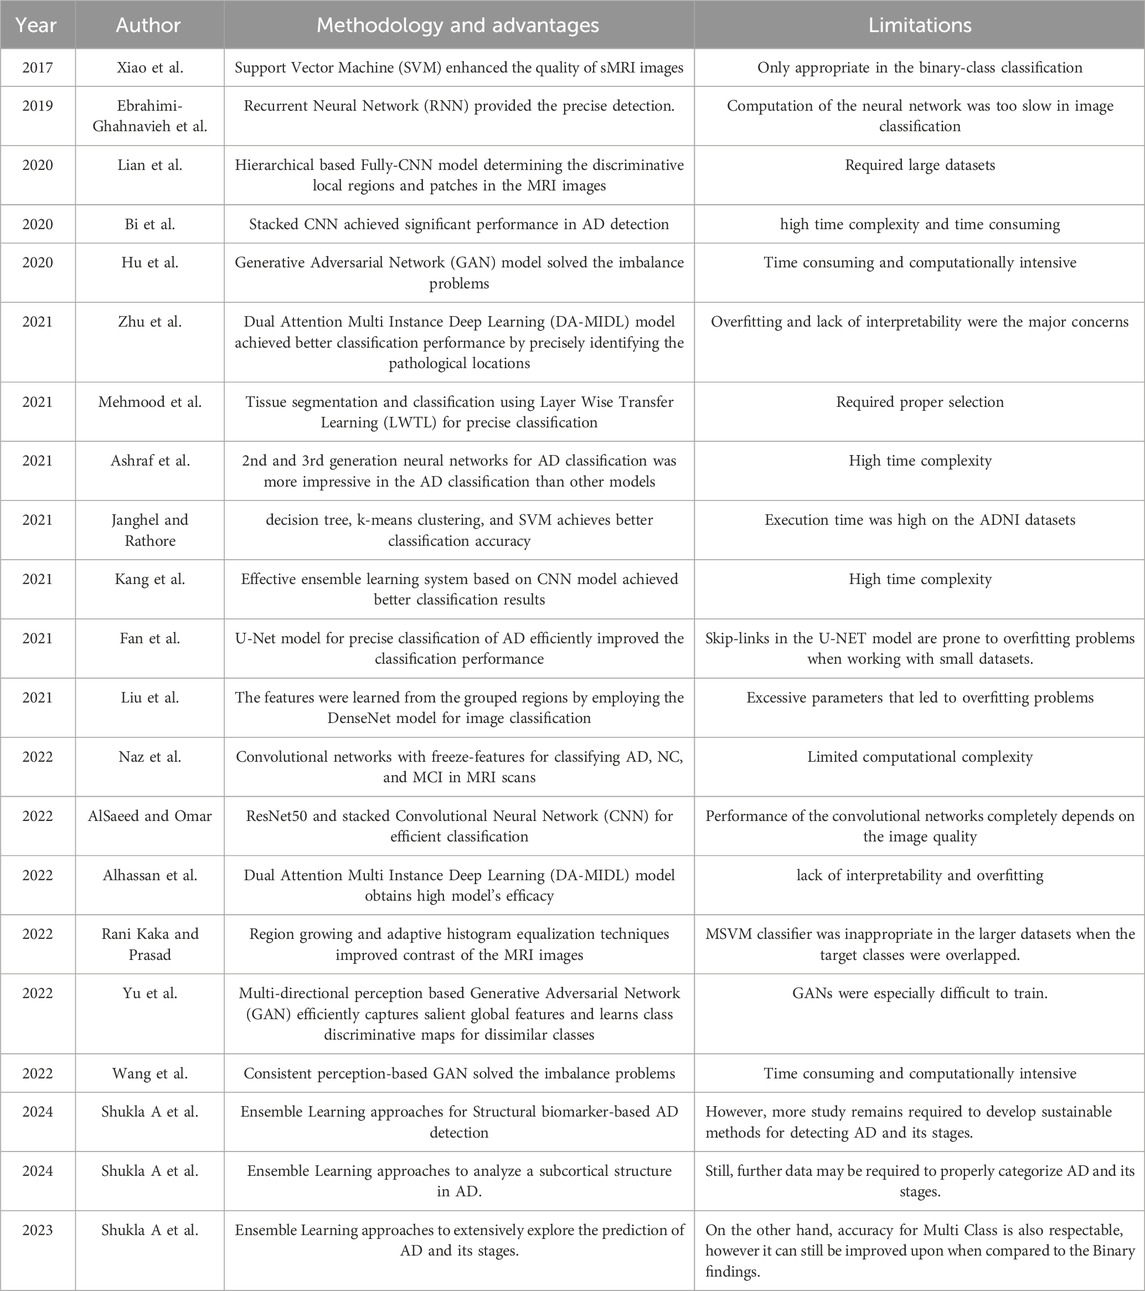
Table 1. Summary of Literature review of AD classification using ADNI and AIBL dataset.
By reviewing the previous studies, deep learning models gained more attention among the researchers for AD detection. In the image segmentation and classification tasks, the majority of the deep learning models often lack interpretability. Furthermore, brain image data results in higher dimensional feature spaces. Effective feature extraction techniques are required to improve the performance of classification models and to avoid the curse of dimensionality problems. In order to overcome the aforementioned issues, an effective automated framework is proposed in this article for precise detection of AD in the sMRI images. The automated framework includes Otsu-TSA method, LDPv descriptor, LBP descriptor, and DBN model for AD detection.
In the present scenario, the early detection of AD increases the survival rate of the patient. The deep learning and machine learning models on the sMRI images are extensively utilized in the detection of AD for accelerating the process of diagnosis and assisting clinicians in timely treatment. In this article, the proposed framework comprises of four steps in AD detection which include, dataset description: ADNI and AIBL datasets, region segmentation: Otsu-TSA method, feature extraction: LDPv and LBP descriptors, and classification: DBN model. The working process of the proposed AD detection framework is shown in Figure 1.
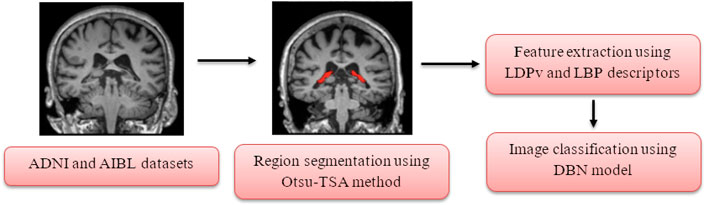
Figure 1. Working process of the proposed AD detection framework.
The performance of the proposed AD detection framework is evaluated on two benchmark-balanced datasets namely ADNI and AIBL. At first, the ADNI dataset has 1,662 sMRI images, where the subjects are classified into three types: NC, MCI, and AD based on the clinical dementia ratings and Mini-Mental State Examination (MMSE) scores. The clinical and demographic information of the ADNI and AIBL datasets are described in Table 2 (Yue et al., 2019). Secondly, the AIBL dataset has sMRI images (Zhu et al. (2021), which are recorded from 496 subjects, out of which 307 subjects belong to NC, 79 subjects are AD, 93 subjects are stable MCI (sMCI), and 17 subjects are progressive MCI (pMCI) (Alhassan, 2022). The sample acquired sMRI images from ADNI and AIBL datasets are specified in Figure 2.
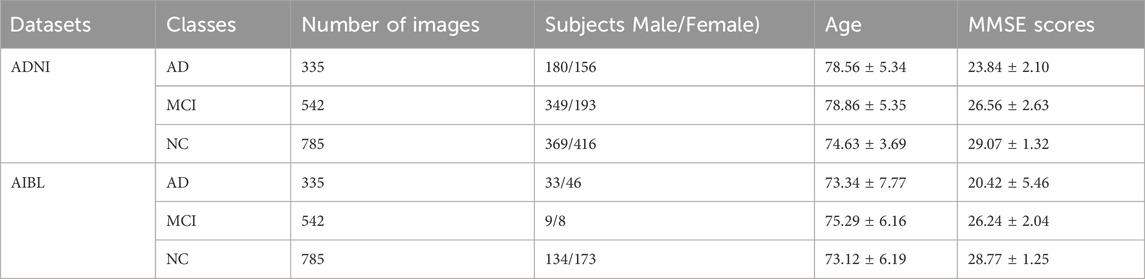
Table 2. Clinical and demographic information about the ADNI and AIBL dataset.
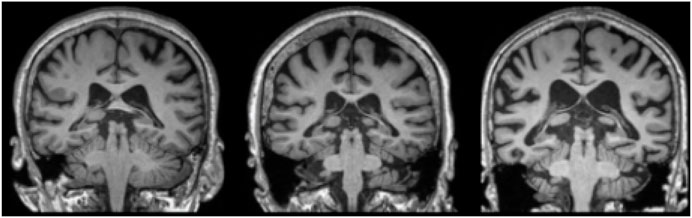
Figure 2. Sample acquired sMRI images from ADNI and AIBL datasets.
After collecting the sMRI images, the RoI segmentation is carried-out using the Otsu-TSA method. The conventional Otsu thresholding method determines the maximum separability between the classes (3 classes in the ADNI dataset and 4 classes in the AIBL dataset) (Feng et al., 2017). The conventional Otsu thresholding method improves the segmentation results by comparing the average pixel value of the sMRI images with the selected pixel value. This segmentation method initially partitioned the sMRI images into two regions: dark region
The term
where,
The optimal threshold value is determined with low class variance
TSA has drawn a lot of attention because of its straightforward design, small number of parameters, quick iteration, and high search functionality. TSA has been used by researchers to tackle optimization issues in a variety of domains, and they have discovered that TSA is rather effective in solving several real-world application issues. The TSA is one of the recent and effective optimization algorithms, which mimics the foraging behavior of the tunicates in ocean (Kaur et al., 2020). The TSA works based on two constraints: (i) it follows the positions of the qualified agents and, (ii) prevents the conflicts between the exploitation and exploration agents. The positions of the new agents are computed according to Eqs 7–9 for preventing the inter-agent conflicts (Houssein et al., 2021; Arabali et al., 2022).
where,
where, the random numbers are represented as
where,
where, the best position is represented as
where,
The parameters fixed in the TSA method are represented as follows: number of population is 30, maximum iteration number is 100,
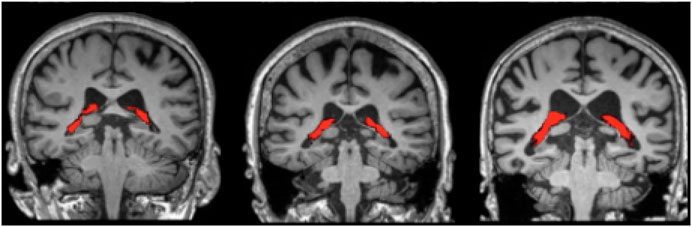
Figure 3. Sample segmented sMRI images.
After the RoI segmentation, the images are converted into vectors by employing the two global descriptors LDPv and LBP. At first, the LDPv descriptor extracts the vectors from the sMRI images by encoding the directional patterns and contrast information (Jabid et al., 2010). In this descriptor, a variance
The mean of all directional responses
where,
where,
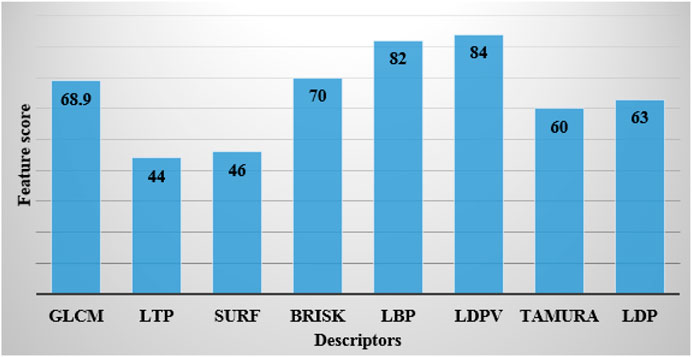
Figure 4. Calculation of feature importance scores.
The vectors extracted by using the LDPv and LBP descriptors are combined by performing feature level fusion. Around 6,542 and 5,189 vectors are extracted from the ADNI and AIBL datasets which are passed to the DBN model for image classification. The DBN is a probability generation model, which is trained in a greedy manner and stacked by Restricted Boltzmann Machine (RBM) (Sabar et al., 2020; Wang et al., 2020). In the DBN model, the previous layer’s output is passed as the input to the next layer. The hierarchical learning of the DBN model is inspired from the structure of the human brain (Hassan et al., 2019). Every layer in the DBN model is regarded as a logistic regression model.
The input of the DBN model are the two-dimensional vectors which are obtained during feature extraction. During pre-training, the RBM layers are trained with one another, and the visible values are considered as the duplicate of the hidden values in the prior layers. Here, the features are learned from the prior layers, and the learning parameters are transferred in a layer-wise manner. The linear regression is the final layer trained after fine-tuning. The cost function is updated by back propagation for optimizing the weights. The schematic diagram of the DBN model is shown in Figure 5.
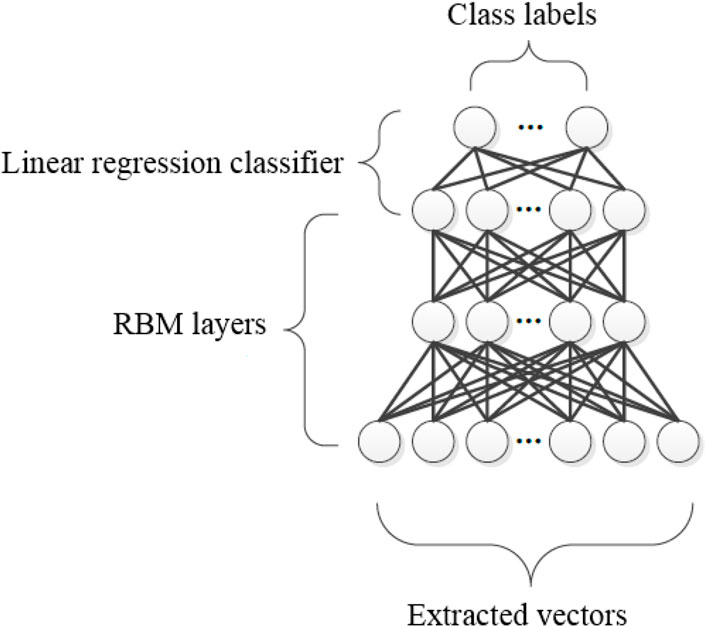
Figure 5. Schematic diagram of the DBN model.
By inspecting Figure 5, it is seen that the DBN model includes two major processes where: (i) RBM layers are trained unsupervised, and the inputs are mapped into dissimilar feature spaces, and (ii) linear regression layer is incorporated at the top of the DBN model as a supervised classifier. The parameters fixed in the DBN model are determined as follows: size of RBM layers is [8, 6], number of epochs is 100 for fine tuning, number of epochs is 10 for training RBM layers, batch size is 100 for training RBM layers, momentum is 0, learning rate is 0.01, activation function is sigmoid, and batch size is 100 for fine tuning. The numerical analysis of the Otsu-TSA method and DBN model is discussed in Section 4.
The performance of the proposed Otsu-TSA method and DBN model are analyzed using MATLAB R2022a software. The proposed framework is simulated on a system with 128GB RAM, NVIDIA GeForce RTX 3080 Ti graphics card, and Windows (64-bit) operating system. The Otsu-TSA method’s efficacy is investigated based on three different performance measures: JSC, DSC, and PA. In addition, the DBN’s effectiveness is validated on the basis of 4 performance measures, namely: specificity, classification accuracy, execution time, and sensitivity on the ADNI and AIBL datasets.
In the segmentation phase, the JSC estimates the degree of overlap between the masks or bounding boxes, while the DSC quantifies the similarity between the masks. The formulas to compute JSC and DSC are represented in Eqs 19, 20. The terms
Correspondingly, in the classification phase, specificity estimates the proportion of TNs that are precisely classified by the DBN model. On the other hand, the sensitivity estimates how well the DBN model detects positive instances in AD detection. The classification accuracy is determined as the ratio of the number of correct predictions to the total input samples. In this scenario, the performance measures: specificity, accuracy, and sensitivity are estimated using the default threshold value of 0.5. The mathematical formulas of the undertaken performance measures are described in Eqs 22–24. Where, TP states true positive, TN states true negative, FP depicts false positive, and FN represents false negative.
Here, the performance of the proposed segmentation method (Otsu-TSA) is compared with other segmentation methods like: region growing, K-means clustering, Watershed algorithm, superpixel clustering, and Otsu thresholding in terms of JSC, DSC, and PA on both ADNI and AIBL datasets which is clearly described in the following subsections.
The results of the Otsu-TSA method and the comparative methods are described in Table 3. By analyzing Table 3, it is clear that the proposed Otsu-TSA method achieves better segmentation than other segmentation methods. The proposed Otsu-TSA method achieved 0.95 of JSC, 0.96 of DSC, and 0.94 of PA on the ADNI dataset. The method achieved 0.94 of JSC, 0.93 of DSC, and 0.95 of PA on the AIBL dataset, which are far better than the results of the other segmentation methods. The conventional Otsu thresholding method uses an exhaustive search approach for region segmentation, which is computationally complex and consumes high processing time. Therefore, TSA is introduced in the conventional Otsu thresholding method to optimize the threshold value. The visual evaluation of the Otsu-TSA method and the comparative segmentation method’s results are shown in Figure 6.
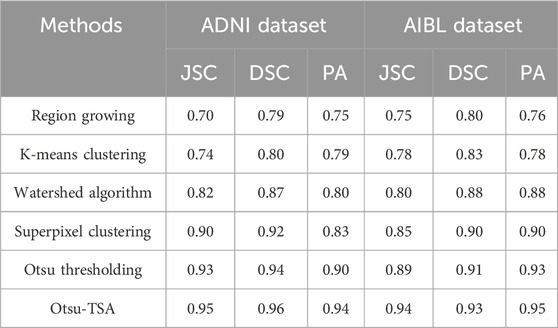
Table 3. Achieved results of the Otsu-TSA method and the comparative segmentation methods.
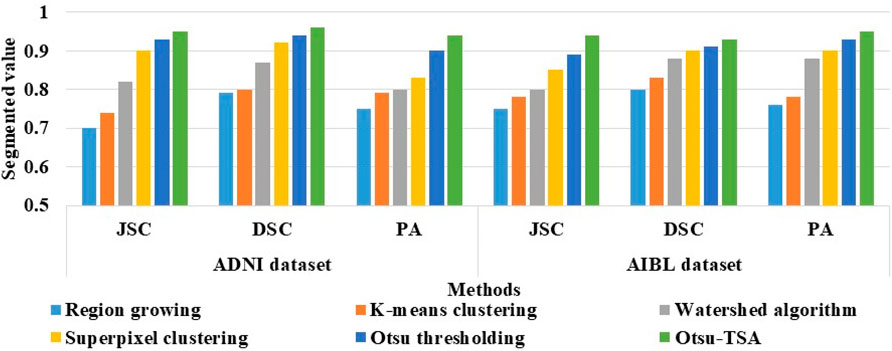
Figure 6. Visual evaluation of the Otsu-TSA method and the comparative segmentation methods.
The effectiveness of the DBN model is validated by comparing its results with other classification models (Autoencoder, LSTM, GRU, AlexNet, and DenseNet) on the ADNI and AIBL datasets. These five comparative models are also executed on the same environment and system configuration. The parameter settings of the comparative models for AD detection are presented as follows. Specifically, the parameters considered in the autoencoder model are as follows: learning rate is 0.001, batch size is 128, optimizer is Adam, dropout rate is 0.15, number of hidden layers is 5, number of nodes in every layer is 500, epochs are 100, and activation is ReLU. The common parameters assumed in the LSTM and GRU models are presented the following: cost function is cross entropy, activation functions are sigmoid and tangent, minimum batch size is 64, epochs is 100, and learning rate is 0.001. Further, the common parameters considered in the AlexNet and DenseNet models are set as follows: epochs are 100, train batch size is 128, dropout rate is 0.5, momentum is 0.9, and weight decay is 0.005.
The results of the DBN model and the comparative classification models on the ADNI and AIBL datasets are described in Tables 4, 5. As mentioned in Table 4, the DBN model’s efficacy is compared with 5 different classification models: autoencoder, Long Short Term Memory (LSTM) network, Gated Recurrent Unit (GRU), AlexNet, and DenseNet. In the ADNI dataset, the DBN model achieves supreme results with a specificity of 99.88%, classification accuracy of 99.80%, and sensitivity of 99.72%. The visual evaluation of the performances of DBN and the comparative classification models on the ADNI dataset are shown in Figure 7. In this scenario, the DBN is able to handle more feature vectors than the comparative classification models. Due to its usage and robustness of the hidden layers, the DBN assembles useful correlations of the feature vectors to achieve better image classification.
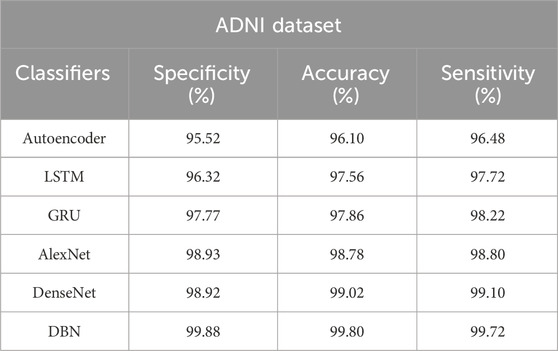
Table 4. Achieved results of the DBN model and the comparative classification models on the ADNI dataset.
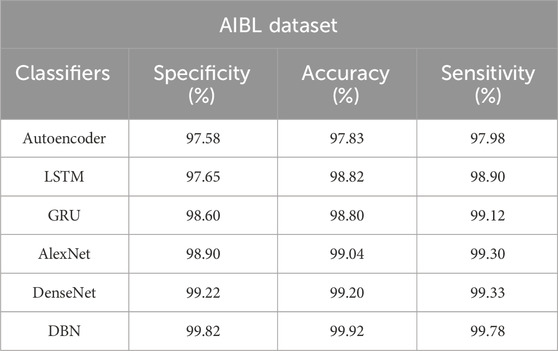
Table 5. Achieved results of the DBN model and the existing classification models on the AIBL dataset.
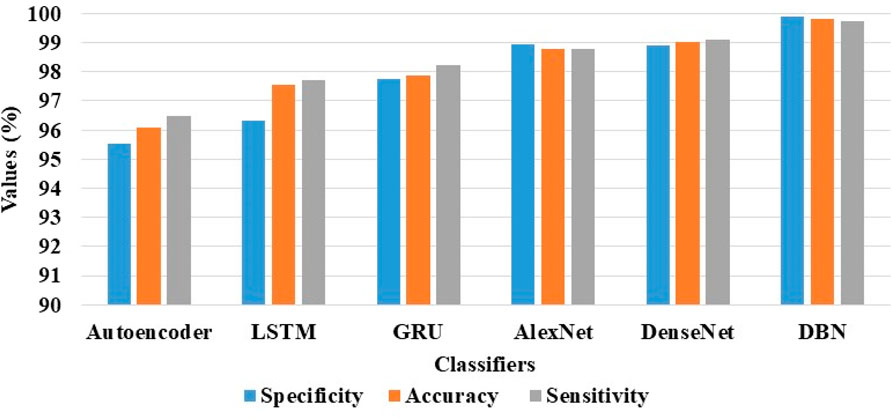
Figure 7. Visual evaluation of the DBN and the comparative classification models results on the ADNI dataset.
Correspondingly, in the AIBL dataset, the DBN model achieves supreme classification results with 99.82% of specificity, 99.92% of classification accuracy, and 99.78% of sensitivity, as mentioned in Table 5. Figure 8 is the visual evaluation of DBN and the comparative classification models’ results on the AIBL dataset.
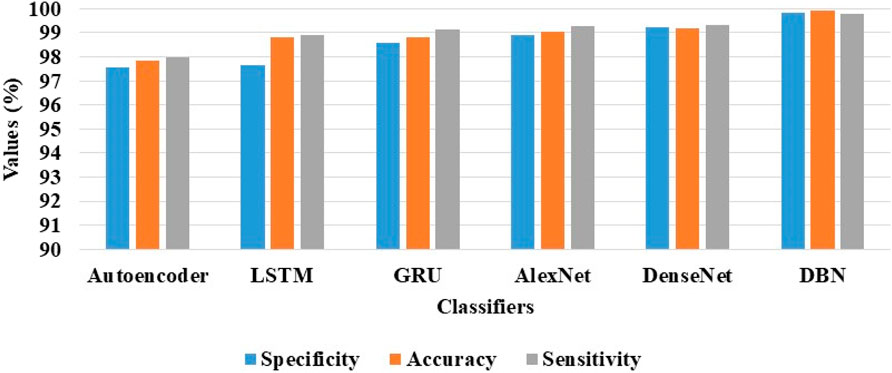
Figure 8. Visual evaluation of the DBN and the comparative classification models results on the AIBL dataset.
The effectiveness of the proposed framework is validated by comparing its results with the existing model developed by Yue et al. (2019) on the ADNI dataset. Initially, an automated anatomical labelling is performed to segment RoI from the acquired sMRI images. Then, the informative voxels are extracted in the segmented regions, which are finally fed to the CNN model for image classification (NC, MCI, and AD). The experimental outcomes of the proposed framework and the existing model developed by Yue et al. (2019) are described in Table 6. Here, the experiment was conducted for 1662 ADNI sMRI images.
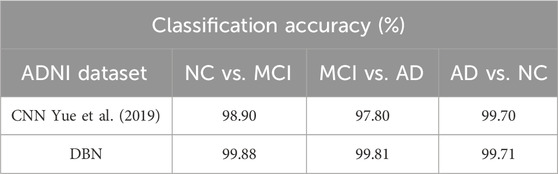
Table 6. Comparative outcomes on the ADNI dataset.
On the other hand, the proposed framework’s efficacy is compared with the existing model developed by Alhassan (2022) on the AIBL dataset. In the existing study, the sMRI image denoising is initially carried out utilizing linear registration, skull stripping, and geometry correction techniques. From the denoised sMRI images, the RoI segmentation is performed by combining the EFEHO algorithm with the Otsu thresholding method, and finally, the image classification is done by implementing the DA-MIDL model. By examining the experimental results, the DA-MIDL model obtained 86.50% of accuracy, 93% of sensitivity, and specificity on the AIBL dataset with 320 sMRI images. Whereas, the DBN model obtained 99.92% of classification accuracy, 99.82% of specificity, and 99.78% of sensitivity on the AIBL dataset with 320 sMRI images, which is described in Table 7. The benefits of proposing the Otsu-TSA method and the DBN model in AD detection are briefly detailed in the discussion section.
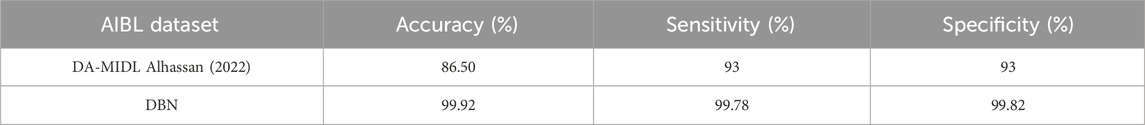
Table 7. Comparative outcomes on the AIBL dataset.
In AD detection, the proposed framework comprises of two important steps, which are: region segmentation carried out by the Otsu-TSA method, and the AD classification carried out by the DBN model. After the acquisition of sMRI images, the RoI is segmented by integrating the Otsu thresholding method with TSA. The TSA finds the optimal threshold value in the Otsu thresholding method for fast and precise segmentation, and the selection of optimal threshold value reduces the execution time of the proposed framework. In the segmented RoI, the vectors are extracted by implementing LDPv and LBP descriptors. The conversion of images into vectors boosts the learning rate, decreases redundant data, and improves the accuracy of the classification model. The extracted vectors are passed as the input to the DBN model for categorizing three classes (NC, MCI, and AD) in the ADNI dataset, and four classes (NC, AD, sMCI and pMCI) in the AIBL dataset. The DBN has high generalization and learning ability than the DenseNet model on the sMRI images, therefore, it is effective in obtaining maximum classification results in AD detection. The execution time of different classification models on the ADNI and AIBL datasets is described in Table 8, and it also shows the effectiveness of incorporating TSA in the Otsu thresholding method.
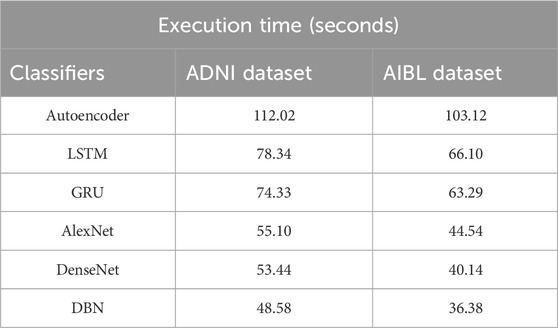
Table 8. Execution time of different classification models on the ADNI and AIBL datasets.
In this paper, an effective AD detection framework was proposed based on the Otsu-TSA method and DBN model. The proposed AD detection framework included three steps: RoI segmentation using the Otsu-TSA method, extraction of vectors using hybrid descriptors (LDPv and LBP) and image classification by the DBN model. The performance of the proposed segmentation method (Otsu-TSA) and classification model (DBN) were analyzed on 1662 ADNI subjects with 3 classes and 496 AIBL subjects with 4 classes. The performance measures: JSC, DSC, PA, specificity, classification accuracy, and sensitivity were used for evaluating the effectiveness of the proposed segmentation method and classification model. In comparison with the existing methods, the proposed Otsu-TSA method achieved higher PA of 0.94 and 0.95 on the ADNI and AIBL datasets, respectively. Additionally, the classification model DBN obtained maximum accuracy of 99.80% and 99.92% on the ADNI and AIBL datasets, which is superior to the conventional detection models like autoencoder, LSTM, GRU, AlexNet, and DenseNet. The results demonstrated that the proposed framework not only achieved better diagnosis performance, but also precisely identified the discriminative pathological locations in the sMRI images than the comparative systems. The selection of optimal threshold value in the Otsu thresholding method by TSA reduced the execution time of the proposed framework to 48.58 and 36.38 s on the ADNI and AIBL datasets.
However, the integration of an optimization algorithm in the segmentation method increases the computational complexity that needs to be overcome in the future. As a future extension, a novel unsupervised model can be developed with a grid search hyper-parameter optimization method for diminishing the computational complexity, and can be applied in other diseases like lung cancer and breast cancer detection.
The datasets generated during and/or analysed during the current study are available in the ADNI and AIBL datasets repository, https://adni.loni.usc.edu/data-samples/access-data/ and https://aibl.csiro.au/adni/index.html.
PG: Writing–review and editing, Writing–original draft, Conceptualization, GR: Writing–review and editing, Writing–original draft, Software. PF-G: Writing–review and editing, Writing–original draft, Funding acquisition. BF-G: Writing–review and editing, Writing–original draft, Formal Analysis.
The author(s) declare that no financial support was received for the research, authorship, and/or publication of this article.
The authors declare that the research was conducted in the absence of any commercial or financial relationships that could be construed as a potential conflict of interest.
All claims expressed in this article are solely those of the authors and do not necessarily represent those of their affiliated organizations, or those of the publisher, the editors and the reviewers. Any product that may be evaluated in this article, or claim that may be made by its manufacturer, is not guaranteed or endorsed by the publisher.
Alhassan A. M. (2022). Enhanced fuzzy elephant herding optimization-based OTSU segmentation and deep learning for Alzheimer’s disease diagnosis. Mathematics 10 (8), 1259. doi:10.3390/math10081259
Alqahtani N., Alam S., Aqeel I., Shuaib M., Mohsen Khormi I., Khan S. B., et al. (2023). Deep belief networks (DBN) with IoT-based Alzheimer’s disease detection and classification. Appl. Sci. 13 (13), 7833. doi:10.3390/app13137833
AlSaeed D., Omar S. F. (2022). Brain MRI analysis for Alzheimer’s disease diagnosis using CNN-based feature extraction and machine learning. Sensors 22 (8), 2911. doi:10.3390/s22082911
Arabali A., Khajehzadeh M., Keawsawasvong S., Mohammed A. H., Khan B. (2022). An adaptive tunicate swarm algorithm for optimization of shallow foundation. IEEE Access 10, 39204–39219. doi:10.1109/ACCESS.2022.3164734
Ashraf A., Naz S., Shirazi S. H., Razzak I., Parsad M. (2021). Deep transfer learning for alzheimer neurological disorder detection. Multimedia Tools Appl. 80 (20), 30117–30142. doi:10.1007/s11042-020-10331-8
Basaia S., Agosta F., Wagner L., Canu E., Magnani G., Santangelo R., et al. (2019). Automated classification of Alzheimer’s disease and Mild cognitive impairment using a single MRI and deep neural networks. NeuroImage Clin. 21, 101645. doi:10.1016/j.nicl.2018.101645
Bi X., Li S., Xiao B., Li Y., Wang G., Ma X. (2020). Computer aided Alzheimer’s disease diagnosis by an unsupervised deep learning technology. Neurocomputing 392, 296–304. doi:10.1016/j.neucom.2018.11.111
Chelladurai A., Narayan D. L., Divakarachari P. B., Loganathan U. (2023). fMRI-based Alzheimer’s disease detection using the SAS method with multi-layer perceptron network. Brain Sci. 13 (6), 893. doi:10.3390/brainsci13060893
Chui K. T., Gupta B. B., Alhalabi W., Alzahrani F. S. (2022). An MRI scans-based Alzheimer’s disease detection via convolutional neural network and transfer learning. Diagnostics 12 (7), 1531. doi:10.3390/diagnostics12071531
Ebrahimi-Ghahnavieh A., Luo S., Chiong R. (2019). “Transfer learning for Alzheimer’s disease detection on MRI images,” in 2019 IEEE international conference on industry 4.0, artificial intelligence, and communications technology (IAICT) (Bali, Indonesia: IEEE), 133–138.
Fan Z., Li J., Zhang L., Zhu G., Li P., Lu X., et al. (2021). U-Net based analysis of MRI for Alzheimer’s disease diagnosis. Neural Comput. Appl. 33 (20), 13587–13599. doi:10.1007/s00521-021-05983-y
Feng Y., Zhao H., Li X., Zhang X., Li H. (2017). A multi-scale 3D Otsu thresholding algorithm for medical image segmentation. Digit. Signal Process. 60, 186–199. doi:10.1016/j.dsp.2016.08.003
Ghazi M. M., Nielsen M., Pai A., Modat M., Jorge Cardoso M., Ourselin S., et al. (2021). Robust parametric modeling of Alzheimer’s disease progression. NeuroImage 225, 117460. doi:10.1016/j.neuroimage.2020.117460
Ghosh T., Palash M. I. A., Yousuf M. A., Hamid Md. A., Monowar M. M., Alassafi M. O. (2023). A robust distributed deep learning approach to detect Alzheimer’s disease from MRI images. Mathematics 11 (12), 2633. doi:10.3390/math11122633
Goh T. Y., Basah S. N., Yazid H., Aziz Safar M. J., Ahmad Saad F. S. (2018). Performance analysis of image thresholding: Otsu technique. Measurement 114, 298–307. doi:10.1016/j.measurement.2017.09.052
Hassan M. M., Alam M. G. R., Uddin M. Z., Huda S., Almogren A., Fortino G. (2019). Human emotion recognition using deep belief network architecture. Inf. Fusion 51, 10–18. doi:10.1016/j.inffus.2018.10.009
Houssein E. H., Helmy B. E.-D., Elngar A. A., Abdelminaam D. S., Shaban H. (2021). An improved tunicate swarm algorithm for global optimization and image segmentation. IEEE Access 9, 56066–56092. doi:10.1109/ACCESS.2021.3072336
Hu S., Yu W., Chen Z., Wang S. (2020). “Medical image reconstruction using generative adversarial network for alzheimer disease assessment with class-imbalance problem,” in 2020 IEEE 6th international conference on computer and communications (ICCC) (Chengdu, China: IEEE), 1323–1327.
JabidKabir T. M. H., Chae O. (2010). Robust facial expression recognition based on local directional pattern. ETRI J. 32 (5), 784–794. doi:10.4218/etrij.10.1510.0132
Janghel R. R., Rathore Y. K. (2021). Deep convolution neural network based system for early diagnosis of Alzheimer’s disease. IRBM 42 (4), 258–267. doi:10.1016/j.irbm.2020.06.006
Kabir M. H., Jabid T., Chae O. (2010). “A local directional pattern variance (LDPv) based face descriptor for human facial expression recognition,” in 2010 7th IEEE international conference on advanced video and signal based surveillance (Boston, MA, USA: IEEE), 526–532.
Kabir M. H., Jabid T., Chae O. (2012). Local directional pattern variance (LDPV): a robust feature descriptor for facial expression recognition. Int. Arab J. Inf. Technol. 9 (4), 382–391. doi:10.1109/AVSS.2010.9
Kang W., Lin L., Zhang B., Shen X., Wu S.Alzheimer's Disease Neuroimaging Initiative (2021). Multi-model and multi-slice ensemble learning architecture based on 2D convolutional neural networks for Alzheimer’s disease diagnosis. Comput. Biol. Med. 136, 104678. doi:10.1016/j.compbiomed.2021.104678
Kaplan K., Kaya Y., Kuncan M., Ertunç H. M. (2020). Brain tumor classification using modified local binary patterns (LBP) feature extraction methods. Med. Hypotheses 139, 109696. doi:10.1016/j.mehy.2020.109696
Kaur S., Awasthi L. K., Sangal A. L., Dhiman G. (2020). Tunicate swarm algorithm: a new bio-inspired based metaheuristic paradigm for global optimization. Eng. Appl. Artif. Intell. 90, 103541. doi:10.1016/j.engappai.2020.103541
Li F., Liu M.Alzheimer's Disease Neuroimaging Initiative (2018). Alzheimer’s disease diagnosis based on multiple cluster dense convolutional networks. Comput. Med. Imaging Graph. 70, 101–110. doi:10.1016/j.compmedimag.2018.09.009
Lian C., Liu M., Zhang J., Shen D. (2020). Hierarchical fully convolutional network for joint atrophy localization and Alzheimer’s disease diagnosis using structural MRI. IEEE Trans. Pattern Analysis Mach. Intell. 42 (4), 880–893. doi:10.1109/TPAMI.2018.2889096
Liu J., Li M., Luo Y., Yang S., Li W., Bi Y. (2021). Alzheimer’s disease detection using depthwise separable convolutional neural networks. Comput. Methods Programs Biomed. 203, 106032. doi:10.1016/j.cmpb.2021.106032
Mehmood A., Yang S., Feng Z., Wang M., Ahmad A. S., Khan R., et al. (2021). A transfer learning approach for early diagnosis of Alzheimer’s disease on MRI images. Neuroscience 460, 43–52. doi:10.1016/j.neuroscience.2021.01.002
Naz S., Ashraf A., Zaib A. (2022). Transfer learning using freeze features for alzheimer neurological disorder detection using ADNI dataset. Multimed. Syst. 28 (1), 85–94. doi:10.1007/s00530-021-00797-3
Ning Z., Xiao Q., Feng Q., Chen W., Zhang Y. (2021). Relation-induced multi-modal shared representation learning for Alzheimer’s disease diagnosis. IEEE Trans. Med. Imaging 40 (6), 1632–1645. doi:10.1109/TMI.2021.3063150
Pan Z., Hu S., Wu X., Wang P. (2021). Adaptive center pixel selection strategy in local binary pattern for texture classification. Expert Syst. Appl. 180, 115123. doi:10.1016/j.eswa.2021.115123
Puente-Castro A., Fernandez-Blanco E., Pazos A., Munteanu C. R. (2020). Automatic assessment of Alzheimer’s disease diagnosis based on deep learning techniques. Comput. Biol. Med. 120, 103764. doi:10.1016/j.compbiomed.2020.103764
Qu Z., Yao T., Liu X., Wang G. (2023). A graph convolutional network based on univariate neurodegeneration biomarker for Alzheimer’s disease diagnosis. IEEE J. Transl. Eng. Health Med. 11, 405–416. doi:10.1109/JTEHM.2023.3285723
Rani Kaka J., Prasad K. S. (2022). Alzheimer’s disease detection using correlation based ensemble feature selection and multi support vector machine. Int. J. Comput. Digital Syst. 12 (1), 9–20. doi:10.12785/ijcds/120102
Sabar N. R., Turky A., Song A., Sattar A. (2020). An evolutionary hyper-heuristic to optimise deep belief networks for image reconstruction. Appl. Soft Comput. 97, 105510. doi:10.1016/j.asoc.2019.105510
Sathiyamoorthi V., Ilavarasi A. K., Murugeswari K., Thouheed Ahmed S., Aruna Devi B., Kalipindi M. (2021). A deep convolutional neural network based computer aided diagnosis system for the prediction of Alzheimer’s disease in MRI images. Measurement 171, 108838. doi:10.1016/j.measurement.2020.108838
Shukla A., Tiwari R., Tiwari S. (2023). Alzheimer’s disease detection from fused PET and MRI modalities using an ensemble classifier. Mach. Learn. Knowl. Extr. 5 (2), 512–538. doi:10.3390/make5020031
Shukla A., Tiwari R., Tiwari S. (2024a). Analyzing subcortical structures in Alzheimer's disease using ensemble learning. Biomed. Signal Process. Control 87, 105407. doi:10.1016/j.bspc.2023.105407
Shukla A., Tiwari R., Tiwari S. (2024b). Structural biomarker-based Alzheimer's disease detection via ensemble learning techniques. Int. J. Imaging Syst. Technol. 34 (1), e22967. doi:10.1002/ima.22967
Tan Z. Y., Basah S. N., Yazid H., Safar M. J. A. (2021). Performance analysis of Otsu thresholding for sign language segmentation. Multimedia Tools Appl. 80 (14), 21499–21520. doi:10.1007/s11042-021-10688-4
Tuncer T., Dogan S., Ozyurt F. (2020). An automated residual exemplar local binary pattern and iterative ReliefF based COVID-19 detection method using chest X-ray image. Chemom. Intelligent Laboratory Syst. 203, 104054. doi:10.1016/j.chemolab.2020.104054
Vaithinathan K., Parthiban L. (2019). A novel texture extraction technique with T1 weighted MRI for the classification of Alzheimer’s disease. J. Neurosci. Methods 318, 84–99. doi:10.1016/j.jneumeth.2019.01.011
Venugopalan J., Tong L., Hassanzadeh H. R., Wang M. D. (2021). Multimodal deep learning models for early detection of Alzheimer’s disease stage. Sci. Rep. 11 (1), 3254. doi:10.1038/s41598-020-74399-w
Wang S., Chen Z., You S., Wang B., Shen Y., Lei B. (2022). Brain stroke lesion segmentation using consistent perception generative adversarial network. Neural Comput. Appl. 34 (11), 8657–8669. doi:10.1007/s00521-021-06816-8
Wang Y., Pan Z., Yuan X., Yang C., Gui W. (2020). A novel deep learning based fault diagnosis approach for chemical process with extended deep belief network. ISA Trans. 96, 457–467. doi:10.1016/j.isatra.2019.07.001
Xiao Z., Ding Y., Lan T., Zhang C., Luo C., Qin Z. (2017). Brain MR image classification for Alzheimer’s disease diagnosis based on multifeature fusion. Comput. Math. Methods Med. 2017, 1952373. doi:10.1155/2017/1952373
Yu W., Lei B., Wang S., Liu Y., Feng Z., Hu Y., et al. (2022). Morphological feature visualization of Alzheimer’s disease via multidirectional perception GAN. IEEE Trans. Neural Netw. Learn. Syst. 34 (8), 4401–4415. doi:10.1109/TNNLS.2021.3118369
Yue L., Gong X., Li J., Ji H., Li M., Nandi A. K. (2019). Hierarchical feature extraction for early Alzheimer’s disease diagnosis. IEEE Access 7, 93752–93760. doi:10.1109/ACCESS.2019.2926288
Zhang F., Tian S., Chen S., Ma Y., Li X., Guo X. (2019). Voxel-based morphometry: improving the diagnosis of Alzheimer’s disease based on an extreme learning machine method from the ADNI cohort. Neuroscience 414, 273–279. doi:10.1016/j.neuroscience.2019.05.014
Keywords: Alzheimer’s disease detection, classification accuracy, deep belief network, magnetic resonance imaging, Otsu thresholding, tunicate swarm algorithm
Citation: Ganesan P, Ramesh GP, Falkowski-Gilski P and Falkowska-Gilska B (2024) Detection of Alzheimer’s disease using Otsu thresholding with tunicate swarm algorithm and deep belief network. Front. Physiol. 15:1380459. doi: 10.3389/fphys.2024.1380459
Received: 01 February 2024; Accepted: 10 June 2024;
Published: 09 July 2024.
Edited by:
Carlos D. Maciel, University of São Paulo, BrazilReviewed by:
Victor Hugo Batista Tsukahara, University of São Paulo, BrazilCopyright © 2024 Ganesan, Ramesh, Falkowski-Gilski and Falkowska-Gilska. This is an open-access article distributed under the terms of the Creative Commons Attribution License (CC BY). The use, distribution or reproduction in other forums is permitted, provided the original author(s) and the copyright owner(s) are credited and that the original publication in this journal is cited, in accordance with accepted academic practice. No use, distribution or reproduction is permitted which does not comply with these terms.
*Correspondence: Przemysław Falkowski-Gilski, cHJ6ZW15c2xhdy5mYWxrb3dza2lAZXRpLnBnLmVkdS5wbA==
Disclaimer: All claims expressed in this article are solely those of the authors and do not necessarily represent those of their affiliated organizations, or those of the publisher, the editors and the reviewers. Any product that may be evaluated in this article or claim that may be made by its manufacturer is not guaranteed or endorsed by the publisher.
Research integrity at Frontiers
Learn more about the work of our research integrity team to safeguard the quality of each article we publish.