
94% of researchers rate our articles as excellent or good
Learn more about the work of our research integrity team to safeguard the quality of each article we publish.
Find out more
ORIGINAL RESEARCH article
Front. Physiol., 15 February 2024
Sec. Computational Physiology and Medicine
Volume 15 - 2024 | https://doi.org/10.3389/fphys.2024.1329145
 Qixing Liu1†
 Huogen Wang2†
 Cidan Wangjiu3†Tudan Awang4Meijie Yang4Puqiong Qiongda5Xiao Yang6Hui Pan7
 Fengdan Wang1*
Background: Manual bone age assessment (BAA) is associated with longer interpretation time and higher cost and variability, thus posing challenges in areas with restricted medical facilities, such as the high-altitude Tibetan Plateau. The application of artificial intelligence (AI) for automating BAA could facilitate resolving this issue. This study aimed to develop an AI-based BAA model for Han and Tibetan children.
Methods: A model named “EVG-BANet” was trained using three datasets, including the Radiology Society of North America (RSNA) dataset (training set n = 12611, validation set n = 1425, and test set n = 200), the Radiological Hand Pose Estimation (RHPE) dataset (training set n = 5491, validation set n = 713, and test set n = 79), and a self-established local dataset [training set n = 825 and test set n = 351 (Han n = 216 and Tibetan n = 135)]. An open-access state-of-the-art model BoNet was used for comparison. The accuracy and generalizability of the two models were evaluated using the abovementioned three test sets and an external test set (n = 256, all were Tibetan). Mean absolute difference (MAD) and accuracy within 1 year were used as indicators. Bias was evaluated by comparing the MAD between the demographic groups.
Results: EVG-BANet outperformed BoNet in the MAD on the RHPE test set (0.52 vs. 0.63 years, p < 0.001), the local test set (0.47 vs. 0.62 years, p < 0.001), and the external test set (0.53 vs. 0.66 years, p < 0.001) and exhibited a comparable MAD on the RSNA test set (0.34 vs. 0.35 years, p = 0.934). EVG-BANet achieved accuracy within 1 year of 97.7% on the local test set (BoNet 90%, p < 0.001) and 89.5% on the external test set (BoNet 85.5%, p = 0.066). EVG-BANet showed no bias in the local test set but exhibited a bias related to chronological age in the external test set.
Conclusion: EVG-BANet can accurately predict the bone age (BA) for both Han children and Tibetan children living in the Tibetan Plateau with limited healthcare facilities.
Bone age (BA), an indicator of skeletal development, objectively reflects the growth and bone maturity of children as compared to chronological age (CA) (Creo and Schwenk, 2017). BA is mainly determined from the radiographs of the left hand and wrist using the Greulich–Pyle (GP) (Greulich and Idell Pyle, 1959) or Tanner–Whitehouse method (Tanner, 1962; Tanner, 1983; Tanner et al., 2001). The GP method is generally favored for its simplicity and practicality and is, therefore, widely applied in clinical settings. The manual evaluation of BA, however, heavily relies on the reviewer’s experience, resulting in notable intra- and inter-observer variations. The considerable time invested in training clinical reviewers poses difficulties in implementing BA assessment (BAA) in areas with limited medical resources (Wang et al., 2020). In recent years, artificial intelligence (AI) and deep learning have emerged as new possibilities of automating BAA (Prokop-Piotrkowska et al., 2021), leading to the development of various autonomous approaches (Kim et al., 2017; Lee et al., 2017; Spampinato et al., 2017; Larson et al., 2018; Mutasa et al., 2018; Escobar et al., 2019; Ren et al., 2019; Zhou et al., 2020; Nguyen et al., 2022; Yang et al., 2023) that effectively address the drawbacks of traditional manual methods, thereby achieving a reduction in interpretation time and variability while concurrently enhancing accuracy (Tajmir et al., 2019; Eng et al., 2021; Lee et al., 2021).
However, concerns have been raised regarding the generalizability and bias of AI BAA systems (Beheshtian et al., 2023; Larson, 2023). The AI BAA models were primarily developed using certain population groups, such as the North American (Lee et al., 2017; Larson et al., 2018; Mutasa et al., 2018), Korean (Kim et al., 2017), and Chinese population of Han ethnicity (Ren et al., 2019; Zhou et al., 2020; Yang et al., 2023). China is a culturally diverse nation encompassing various ethnic groups; these include the Tibetan people who mainly reside in the Tibetan Plateau, which is located at 4000 m above sea level (asl) and has limited medical resources (Harris et al., 2001; Wang et al., 2021). To the best of our knowledge, there is currently no AI BAA model developed for Tibetan children. The constraints of training the population make the existing models potentially unsuitable for application beyond specific populations on which they were trained. Moreover, because of the limitation of models that may focus more on populations of specific groups, there is a possibility of introducing bias based on variables such as age, gender, and ethnicity. Systematic bias, unlike random errors, can be resolved through compensatory techniques such as sampling adjustments, augmentation, calibration, weighting adjustments, and the inclusion of additional input variables into the algorithm (Larson, 2023).
To address these concerns, we developed a fully automated AI BAA system termed “EVG-BANet” using data from three distinct datasets, one of which was our self-established dataset that includes both Han and Tibetan populations. Our model incorporates both gender and ethnicity information as independent variables into global and local visual features extracted by deep learning. To the best of our knowledge, EVG-BANet is the first model to achieve this. Based on evaluation using four different datasets, EVG-BANet outperformed BoNet, the current state-of-the-art model, in terms of accuracy and generalizability.
This multicenter study was approved by the Institutional Review Board of Peking Union Medical College Hospital (I-22PJ458), and the informed consent requirement was waived because of the retrospective nature of the study.
The EVG-BANet model was trained using data from three different datasets of radiographs acquired from the left hand and wrist of children: the Radiology Society of North America (RSNA) dataset (Halabi et al., 2019), the Radiological Hand Pose Estimation (RHPE) dataset (Escobar et al., 2019), and our self-established local dataset (Table 1). The RSNA dataset included 14236 images from Lucile Packard Children’s Hospital at Stanford University and Children’s Hospital Colorado; of these images, 12611 radiographs were randomly selected as the training set and 1425 radiographs were used as the validation set, with an additional test set (n = 200). The RHPE dataset comprised 6283 images that were divided into three sets: a training set (n = 5491), validation set (n = 713), and test set (n = 79). The local dataset included BA radiographs from two medical centers at different altitudes: Peking Union Medical College Hospital in Beijing at 43.5 m asl (n = 745, all were Han) (Wang et al., 2020) and Tibet Autonomous Region People’s Hospital in Lhasa at 3650 m asl (n = 431, including 114 Han children and 317 Tibetan children) (Wang et al., 2021). In total, 1176 cases were included in the local dataset and were randomly divided into the training set (n = 825) and test set (n = 351).
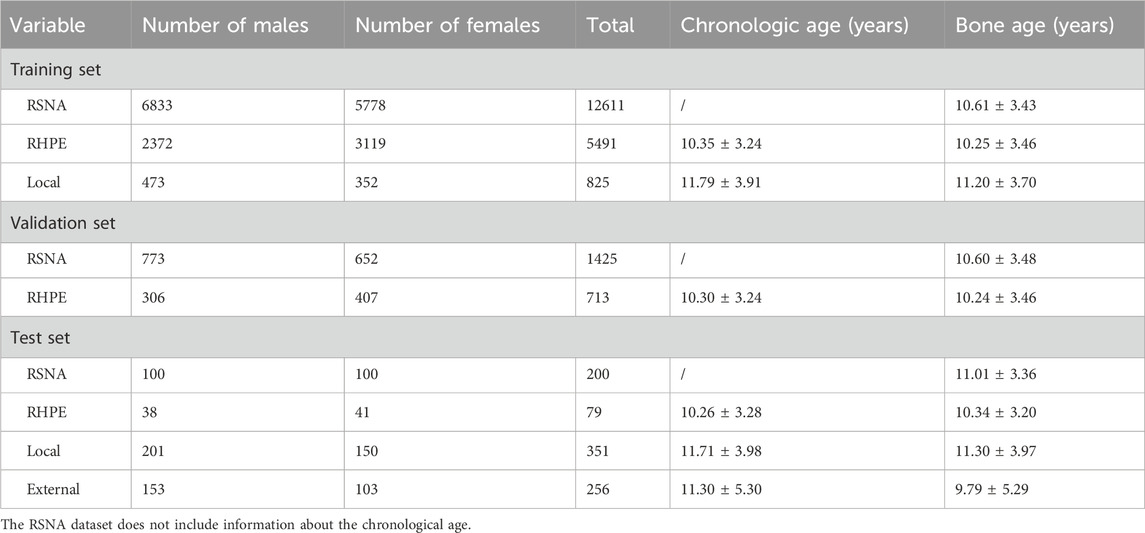
TABLE 1. Summary information for the training, validation, and test datasets.
Additionally, an external dataset comprising BA radiographs from Tibetan children at Nyima County People’s Hospital in Nagqu at 4500 m asl was included as a test set (n = 256, all were Tibetan). The detailed inclusion and exclusion criteria are provided in Supplementary Table S1.
The reference BA standards provided with the RSNA and RHPE datasets were used as the ground truth for training. The ground truth BA standards for the local dataset and the external test set were determined by two experienced doctors (a radiologist with 10 years of experience and an endocrinologist with 15 years of experience in BA reading) (Beheshtian et al., 2023) through mutual consensus using the GP method (Greulich and Idell Pyle, 1959). The readers were aware of only the age and gender of the patient and were blinded to ethnicity and clinical details. For any disagreement, a third reviewer, an endocrinologist specialized in child growth and development with over 20 years of experience in BA reading, was consulted. The atlas used for the assessment was “Skeletal Development of the Hand and Wrist—A Radiographic Atlas and Digital Bone Age Companion,” published by Oxford University Press in 2011.
Our method is inspired by the clinical practice of radiologists, who consider various factors when assessing BA, including both global and local visual features extracted from hand radiographs, CA, gender, and ethnicity. In this work, we introduce EVG-BANet, a novel deep learning model that integrates all these factors to accurately and unbiasedly assess BA. The global visual features are extracted from hand radiographs, while the local visual features are extracted from anatomical regions of interest (ROIs) and wrist parts. The schematic diagram of EVG-BANet is shown in Figure 1.
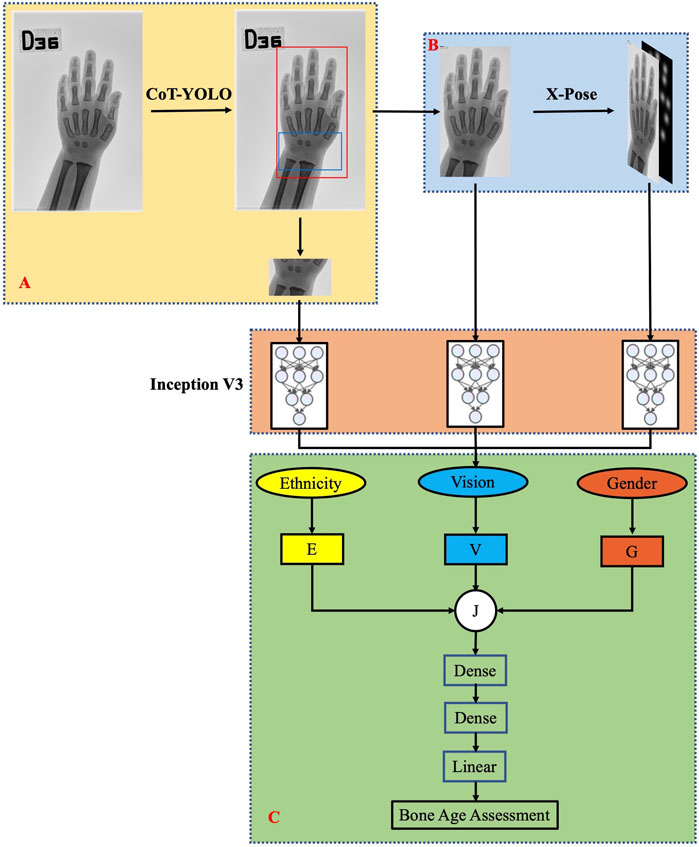
FIGURE 1. Schematic diagram of the EVG-BANet model. EVG-BANet comprises three modules: (A) CoT-YOLO for hand and wrist detection, (B) X-Pose for hand keypoint detection, and (C) BANet for BA prediction.
EVG-BANet is a deep learning model that requires radiographs of the hand and wrist and information regarding the CA, gender, and ethnicity of children as inputs. It comprises three modules: CoT-YOLO for hand and wrist detection, X-Pose for hand keypoint detection, and BANet for BA prediction. The model was implemented using PyTorch 1.7.0, and the training was completed on NVIDIA GeForce RTX 2080 Ti GPUs. Here, we provide a detailed overview of the individual components of EVG-BANet. The table illustrating the dataset utilization by each module is shown in Supplementary Table S2.
CoT-YOLO: CoT-YOLO was constructed by integrating the YOLOv5 and Contextual Transformer (CoT) networks (Li et al., 2023). The schematic diagram of CoT-YOLO is shown in Supplementary Figure S1. Darknet-53 was used as the backbone network (Redmon and Farhadi, 2018). CoT can leverage contextual information to enhance visual representation (Li et al., 2023). Therefore, we used CoT before the convolutional layers and the BottleneckCSP module. During training, we used the pretrained model from the COCO dataset (Lin et al., 2014) and iteratively trained it for 5,000 epochs with an initial learning rate of 0.001. CoT-YOLO was trained on the training set from the local dataset and validated using the local test set.
X-Pose: To meet the challenge of radiograph-based hand pose estimation, we leveraged the recent state-of-the-art encoder–decoder architecture proposed by Eng et al. (2021) for human pose estimation. The schematic diagram of X-Pose is shown in Supplementary Figure S2. Specifically, X-Pose uses keypoints including the center of the wrist joint, finger tips, and interphalangeal joints. This model consists of a ResNet-50 backbone network followed by a series of deconvolutional layers. We trained the model initialized on ImageNet using the suggested training parameters for 20 epochs and the Adam optimizer, with a learning rate of 0.001. X-Pose was trained solely on the training set from the RHPE dataset, validated on the validation set from the RHPE dataset, and then, applied to the other datasets.
BANet: BANet uses the Inception v3 model (Szegedy et al., 2015) to extract features from three independent pathways: the hand bones identified using the CoT-YOLO model, the wrist bones identified using the CoT-YOLO model, and the Gaussian distribution attention map of hand keypoints. The three types of features extracted from the three pathways are combined using a mixed inception module, which is a neural network architecture that combines features from different layers of the network. Instead of simply concatenating the features, we introduce multipliers wg and we to balance the relative importance of the inputs that are relevant to the final prediction. This allows our model to learn weighted representations of gender information G and ethnicity information E, according to their relevance to BAA. Information G and E can be represented as follows:
where g and e are the gender and ethnicity, respectively. Male gender is represented by g = 1, and female gender is represented by g = 0. Similarly, e = 1 denotes “Han” ethnicity, and e = 0 represents “Tibetan.” E and G are then concatenated with the visual feature V to form the feature J [J = (V; E; G)]. Finally, feature J is fed into two dense layers with ReLU activation functions to regress to the BA using an L1 loss. The Adam optimizer is used for training. The model is trained for 150 epochs using a batch size of 16. The initial learning rate is 0.001, and it is reduced by 20% every four epochs. The training of BANet relies on the training sets from the RSNA dataset, the RHPE dataset, and the local dataset. The validation of BANet is conducted using the validation sets from both the RSNA and RHPE datasets, as well as the test set from the local dataset.
EVG-BANet is the first BAA model to integrate visual features, gender, and ethnicity. This model has the potential to improve accuracy and reduce bias of BAA, particularly for children from diverse ethnicities.
Descriptive statistics were used to summarize the data as appropriate. Continuous variables were expressed as mean ± standard deviation (SD). Categorical variables were expressed as frequency and proportion. The children were categorized into three CA groups: group 1 (0–6 years old), group 2 (7–12 years old), and group 3 (13–18 years old).
To evaluate the accuracy and generalizability of EVG-BANet, an open-source state-of-the art model BoNet (Escobar et al., 2019) was used as a reference for comparison, and the overall performance of the two models was assessed by comparing the mean absolute difference (MAD) between the model estimates and the ground truth BA on the four datasets. BA accuracy, defined as the percentage of MAD within 1 year, was also compared. To determine agreement between models’ estimates and the ground truth BA, Bland–Altman plots were generated to show the difference between the estimates and the ground truth BA over the range of the mean of the two BA values. A paired t-test was used to compare the MAD between the two models. McNemar’s test was used to compare the accuracy of the two models. An ablation analysis was conducted to assess the impact of each module on the model performance. To evaluate the bias of EVG-BANet, the MADs between various demographic groups were compared using the t-test or analysis of variance. Scatterplots with the ground truth BA and model estimates on the horizontal and vertical axes, respectively, with superimposed identity lines (slope = 1 and intercept = 0) were generated to visualize differences between EVG-BANet predictions and the ground truth.
All analyses were performed using R version 4.2.2 (R Core Team, 2014). Statistical significance was defined as a two-tailed p-value of <0.05.
The summary information for the four datasets is shown in Table 1. A total of 21951 radiographs were evaluated in this study, including 18927 training, 2138 validation, and 886 test images. Table 2 shows the demographic characteristics of the local and external test sets. In the local test set, the CA and the ground truth BA of the children were 11.71 ± 3.98 and 11.30 ± 3.97 years, respectively. The male-to-female ratio was 1.34:1 (57%:43%). The test set included two ethnic groups: Han and Tibetan, with a ratio of 1.6:1 (67%:33%). In the external test set, the CA and the ground truth BA were 11.30 ± 5.30 and 9.79 ± 5.29 years, respectively. The male-to-female ratio was 1.49:1 (60%:40%). All the children were Tibetan. Figure 2 shows the distribution of the ground truth BA and ethnicity composition for both the local and external test sets.
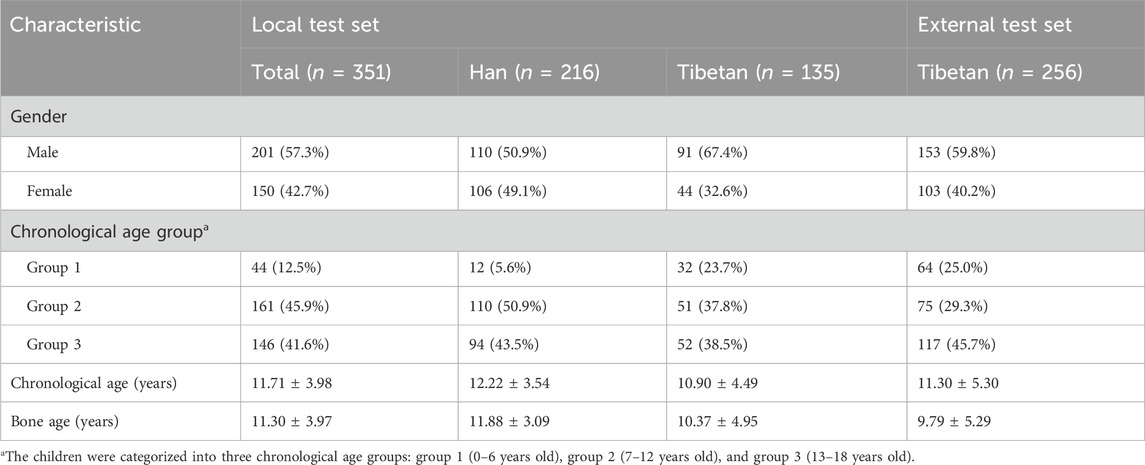
TABLE 2. Demographic characteristics of the local and external test sets.
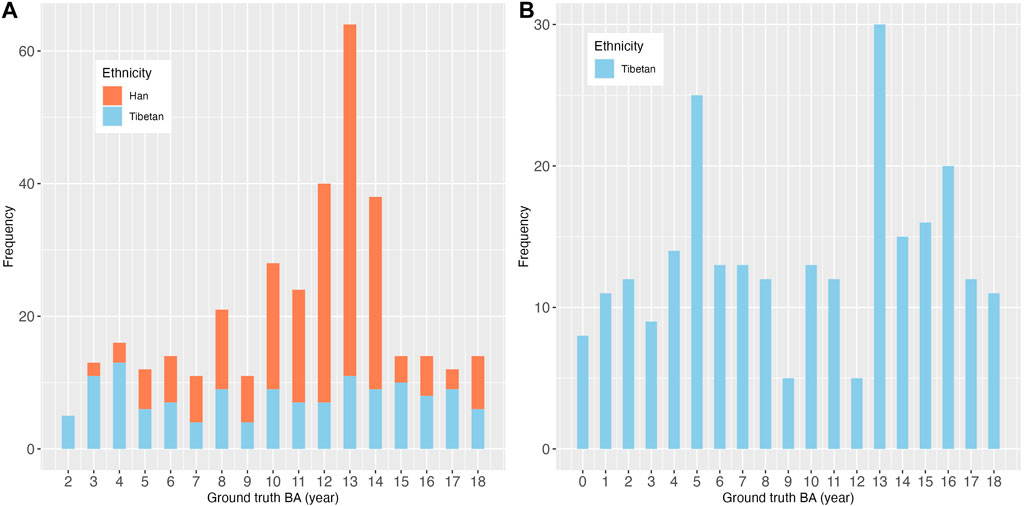
FIGURE 2. Distribution of ground truth BA and ethnicity composition of (A) the local test set and (B) the external test set.
RSNA and RHPE test sets: In the RSNA test set, EVG-BANet and BoNet exhibited comparable performance with an MAD of 0.34 ± 0.16 and 0.35 ± 0.18 years, respectively (p = 0.934). In the RHPE test set, EVG-BANet achieved an MAD of 0.52 ± 0.21 years, which was significantly more accurate than that of BoNet (0.63 ± 0.23 years, p < 0.001).
Local test set: In the local test set, EVG-BANet exhibited superior performance compared to BoNet, both in the overall assessment and within the subgroups stratified by CA, gender, and ethnicity (Table 3). Overall, EVG-BANet achieved an MAD of 0.47 ± 0.28 years, significantly outperforming BoNet with an MAD of 0.62 ± 0.40 years (p < 0.001); moreover, the accuracy within 1 year of EVG-BANet was 97.7%, while that of BoNet was 90% (p < 0.001) (Supplementary Table S3). The 95% limits of agreement for EVG-BANet and the ground truth BA were −1.13 to 0.97 years, according to the Bland–Altman plot (Figure 3A), while the limits of agreement for BoNet and the ground truth BA were −1.51 to 1.37 years (Figure 3B).
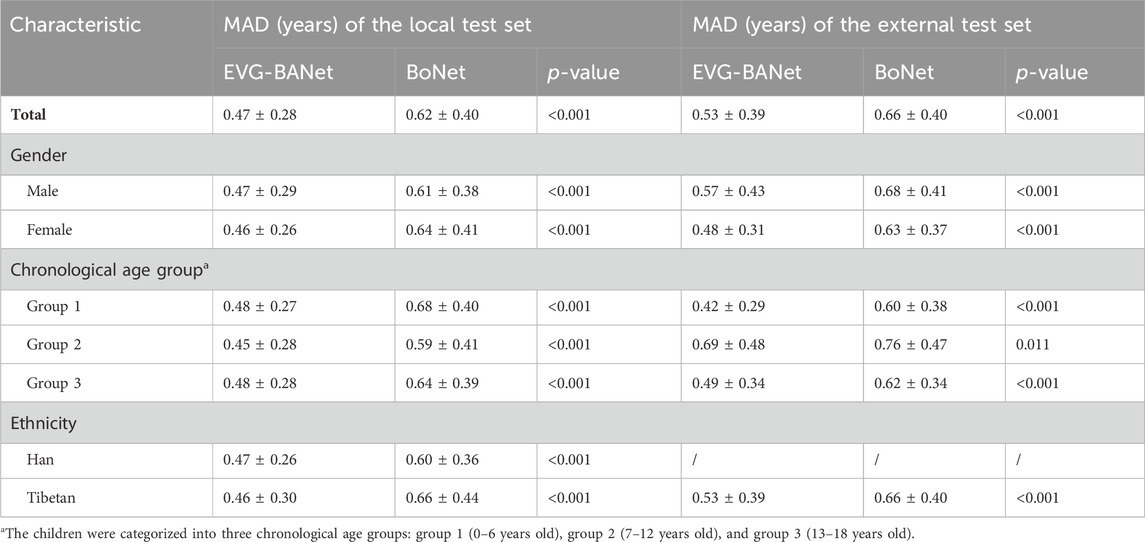
TABLE 3. Comparison of the MAD of EVG-BANet and BoNet for the local and external test sets.
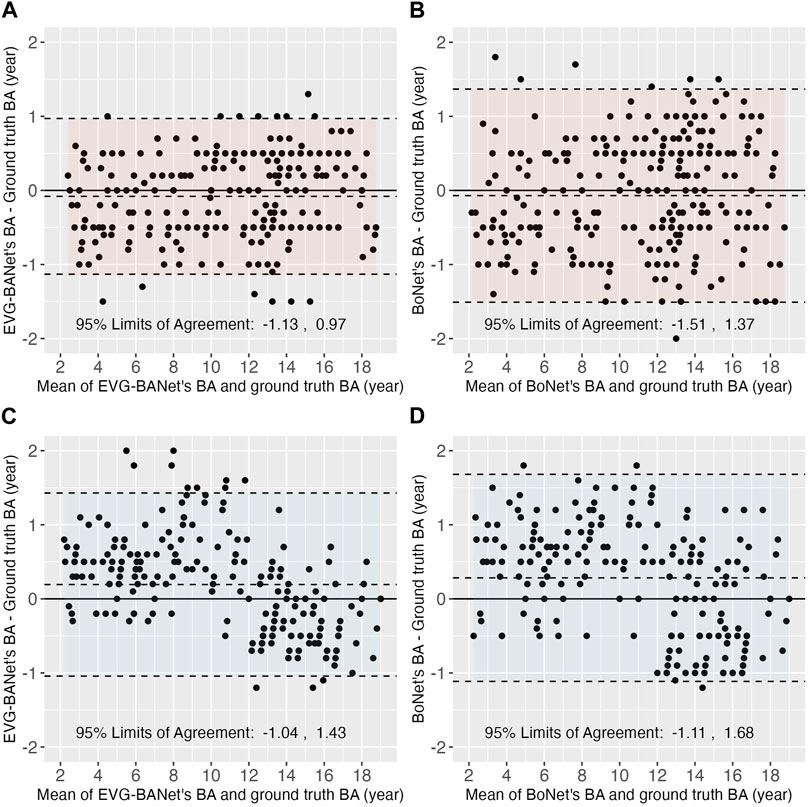
FIGURE 3. Bland–Altman plots showing the differences between the estimated BA by EVG-BANet/BoNet and the ground truth BA. In the local test set, the Bland–Atman plots for (A) EVG-BANet and (B) BoNet are shown; in the external test set, the Bland–Atman plots for (C) EVG-BANet and (D) BoNet are illustrated.
To assess the individual impact of each module on the performance of EVG-BANet, an ablation analysis was conducted on the local test set (Supplementary Table S4). The omission of visual features from wrist and keypoints resulted in a decrease in accuracy within 1 year by 6% and 8.2%, respectively. The exclusion of ethnicity information led to a reduction in accuracy by 3.2%.
External test set: In the external test set, EVG-BANet demonstrated a significantly lower MAD than BoNet, both in total (0.53 ± 0.39 vs. 0.66 ± 0.40 years, p < 0.001) and within the demographic subgroups (Table 3). The accuracy within 1 year of EVG-BANet was higher than that of BoNet in total (89.5% vs. 85.5%, p = 0.066) and within the subgroups, although the difference was not statistically significant (Supplementary Table S3). According to the Bland–Altman plot, the 95% limits of agreement for EVG-BANet and the ground truth BA were −1.04–1.43 years (Figure 3C), while those for BoNet and the ground truth BA were −1.11–1.68 years (Figure 3D).
Local test set: EVG-BANet showed no significant bias in the local test set. Regarding gender, CA group, and ethnicity, no significant differences were observed in the MAD of EVG-BANet across the subgroups [male, 0.47 ± 0.29 years vs. female, 0.46 ± 0.26 years (p = 0.794); group 1, 0.48 ± 0.27 years vs. group 2, 0.45 ± 0.28 years vs. group 3, 0.48 ± 0.28 years (p = 0.764); Han, 0.47 ± 0.26 years vs. Tibetan, 0.46 ± 0.30 years (p = 0.848)]. The MAD of EVG-BANet between the Han and Tibetan populations was further compared across the different subgroups, and no bias was detected (Table 4). The scatterplot illustrating the differences between the ground truth BA and EVG-BANet predictions in the Han and Tibetan populations did not show a clear tendency of bias (Figure 4A). No bias based on CA (Supplementary Figure S3) or gender (Supplementary Figure S4A) was found.
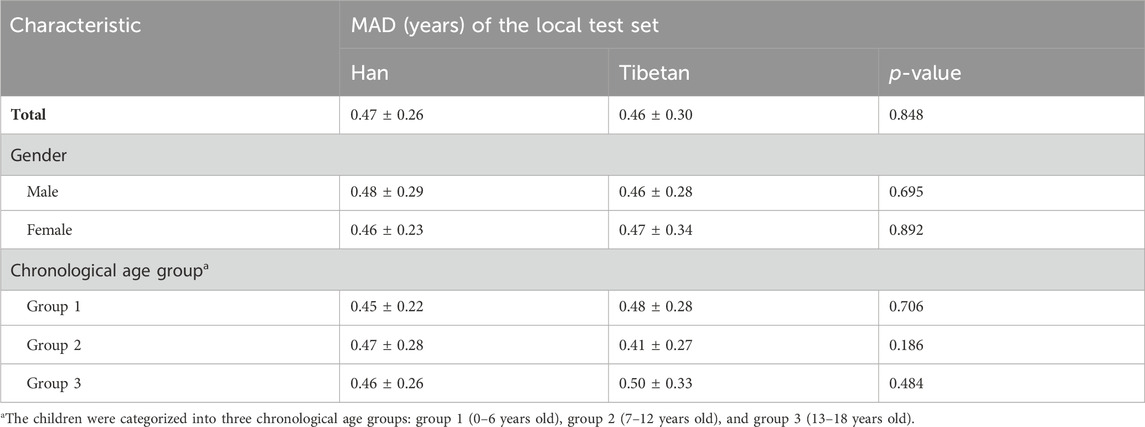
TABLE 4. The MAD of EVG-BANet stratified by demographic groups and ethnicity in the local test set.
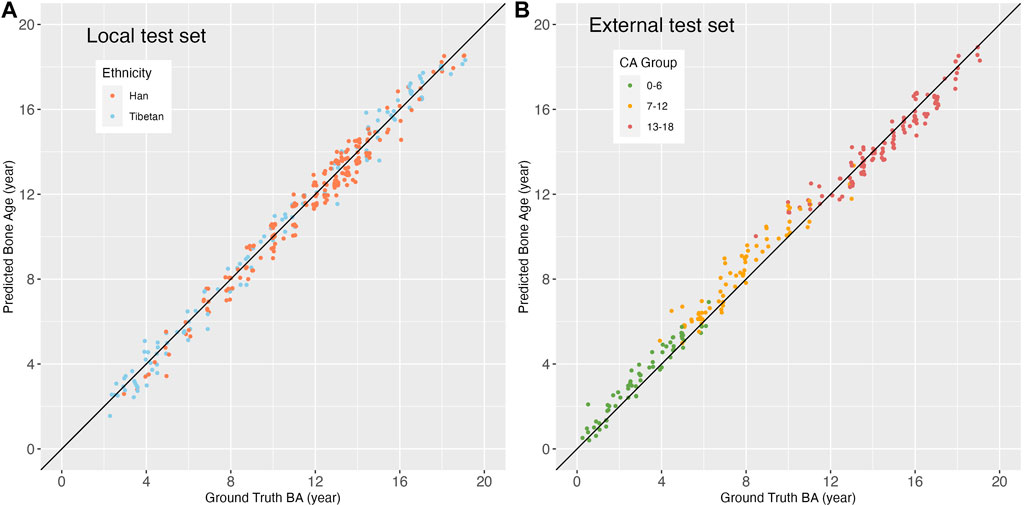
FIGURE 4. Scatterplots showing the differences between the ground truth BA and EVG-BANet prediction based on ethnicity and chronological age. (A) Scatterplot based on ethnicity in the local test set. (B) Scatterplot based on CA groups in the external test set. The identity line (black) has a slope and intercept of 1 and 0, respectively.
External test set: In the external test set, the MAD of EVG-BANet showed no significant difference between male and female subgroups (0.57 ± 0.43 vs. 0.48 ± 0.31 years, p = 0.068); however, a significant difference was noted among the different CA groups [group 1, 0.42 ± 0.29 years vs. group 2, 0.69 ± 0.48 years vs. group 3, 0.49 ± 0.34 years (p < 0.001)]. The scatterplot indicated a tendency where the BA assessed by EVG-BANet was overestimated in children aged 0–6 years and 7–12 years, while it was underestimated in children aged 13–18 years (Figure 4B). No bias based on gender was observed (Supplementary Figure S4B).
We developed a fully automated deep learning model named EVG-BANet for BAA based on the GP method. EVG-BANet was trained using radiographs from three distinct populations, one of which included both Han and Tibetan ethnic groups. This model incorporates ethnicity and gender as independent variables and integrates them with the global and local features extracted from radiographs for the final BA prediction. In all four test sets, including an external test set, EVG-BANet exhibited superior performance compared to BoNet.
Overall, EVG-BANet demonstrated good accuracy and generalizability. EVG-BANet was trained using 18927 images (12611 from the RSNA dataset, 5491 from the RHPE dataset, and 825 from the local dataset) and validated using 2138 images (1425 from the RSNA dataset and 713 from the RHPE dataset). EVG-BANet showed MAD values of 0.34, 0.52, and 0.47 years for the RSNA test set, RHPE test set, and local test set (including 216 Han children and 135 Tibetan children), respectively, and 0.53 years for the external test set (including 256 Tibetan children). The model achieved an accuracy within 1 year of 97.7% and 89.5% in the local and external test sets, respectively. In both the overall evaluation and evaluation within the various demographic groups (including gender, CA, and ethnicity), EVG-BANet consistently outperformed BoNet, with lower MAD and higher accuracy within 1 year.
We conducted ablation studies to assess the individual contributions of key modules within EVG-BANet on the local test set. Visual features from both wrist and keypoints significantly contribute to accuracy. The ethnicity information serves a complementary role in tailoring predictions to diverse populations. Recently, Nguyen et al. (2022) developed a BAA approach that integrates keypoint detection and gender information; however, our model integrates a more comprehensive array of visual and demographic features. To the best of our knowledge, EVG-BANet is the first BAA approach that combines both global and local visual features with crucial demographic factors such as gender and ethnicity. Global features are derived from the entire hand radiograph using a convolutional neural network, while local features are extracted from specific anatomical ROIs and wrist segments using a hand keypoint detection model. The coexistence of both global and local features in an assessment model is essential for accurate BAA, as global features provide insights into the overall development of the hand and wrist, while local features capture the fine-grained details of individual bones. EVG-BANet also considers ethnic information along with visual features. Previous studies have shown that conventional BAA methods can lead to substantial disparities in outcomes across different ethnic groups (Ontell et al., 1996; Zhang et al., 2009). EVG-BANet addresses this inherent bias by incorporating ethnicity into its model, which enables it to better account for these differences and improve the accuracy of BAA. The model exhibited good generalization in the external test set, which has markedly different demographic characteristics (e.g., CA distribution, gender ratio, altitude, and ethnic composition) compared to the training dataset.
Prior to this study, none of the models included the Tibetan population as part of the training set. The initial AI BAA models were primarily developed using North American and Korean populations (Kim et al., 2017; Lee et al., 2017; Larson et al., 2018; Mutasa et al., 2018), followed by studies based on the Chinese population (Ren et al., 2019; Zhou et al., 2020; Yang et al., 2023). However, the Chinese population-based models predominantly focused on the Han ethnic group and did not include the Tibetan ethnic group. Tibetan people mainly reside in the Tibetan Plateau of western China, where the average altitude is as high as 4000 m; consequently, this region has limited healthcare facilities because of its unique geographical location (Harris et al., 2001; Wang et al., 2021). Our model could assess BA accurately in Tibetan children, thus demonstrating its great potential in assisting radiologists, pediatricians, and endocrinologists to conduct accurate BAA with less labor cost and shorter time in Tibet.
Biases of EVG-BANet against specific demographic groups were also evaluated. EVG-BANet showed no bias based on gender, CA, or ethnicity in the local test set. However, in the external test set, EVG-BANet tended to overestimate BA in children aged 0–12 years and underestimate BA in children aged 13–18 years. BoNet also exhibited a similar tendency (data not shown). This is possibly due to the following two reasons: first, the appearance and development of ossification centers show considerable variation in younger children, while the wrist bones are matured in adolescents; the determination of BA mainly relies on the fusion stage of the epiphysis of the phalanges and metacarpals. AI models might focus on different maps as compared to human readers (Spampinato et al., 2017). Second, the external test set included a population that resides at an ultrahigh altitude of 4500 m asl; the development of BA in children residing at this altitude might be different from that in children residing in an area at 3600 m asl altitude and in plain areas (Cidanwangjiu et al., 2023). Therefore, this bias should be carefully monitored and corrected in the future application of the AI BA systems.
Our study has some limitations. First, similar to previous studies on BAA, there is no gold standard for BA evaluation. The ground truth BA used for training is determined by reviewers, which is inevitably influenced by inter- and intra-reviewer variations. Second, the ethnic composition of the external test set was exclusively Tibetan; therefore, we were unable to externally evaluate ethnic bias between the Han and Tibetan populations. Third, our model may not be able to identify certain disorders that a human reviewer could potentially detect from radiographic images, such as hypochondroplasia, rickets, and congenital syndromes (van Rijn and Thodberg, 2013). Fourth, our model could not handle missing values. We plan to investigate suitable strategies for the future versions of EVG-BANet.
In conclusion, we developed an AI BAA model termed EVG-BANet that estimates BA with high accuracy in both Han and Tibetan children. The EVG-BANet model could potentially enhance the efficiency and accuracy of BAA and can be applied in areas with limited medical resources, such as rural regions and the Tibetan plateau.
The raw data supporting the conclusion of this article will be made available by the authors, without undue reservation.
The studies involving humans were approved by the Institutional Review Board of Peking Union Medical College Hospital (I-22PJ458). The studies were conducted in accordance with the local legislation and institutional requirements. The ethics committee/institutional review board waived the requirement of written informed consent for participation from the participants or the participants’ legal guardians/next of kin because the informed consent requirement was waived due to the retrospective nature of the study.
QL: data curation, formal analysis, investigation, methodology, and writing–original draft. HW: conceptualization, data curation, methodology, software, writing–original draft, and investigation. CW: data curation, resources, and writing–review and editing. TA: data curation, resources, and writing–review and editing. MY: data curation, resources, and writing–review and editing. PQ: data curation, resources, and writing–review and editing. XY: data curation, resources, and writing–review and editing. HP: data curation, resources, and writing–review and editing. FW: conceptualization, data curation, funding acquisition, methodology, project administration, supervision, writing–original draft, and writing–review and editing.
The authors declare that financial support was received for the research, authorship, and/or publication of this article. This study was supported by the Youth Fund of National Natural Science Foundation of China (Grant No. 82001900), the National High Level Hospital Clinical Research Funding (Grant No. 2022-PUMCH-A-003), and the CAMS Innovation Fund for Medical Sciences (2021-I2M-1-051).
The authors declare that the research was conducted in the absence of any commercial or financial relationships that could be construed as a potential conflict of interest.
All claims expressed in this article are solely those of the authors and do not necessarily represent those of their affiliated organizations, or those of the publisher, the editors, and the reviewers. Any product that may be evaluated in this article, or claim that may be made by its manufacturer, is not guaranteed or endorsed by the publisher.
The Supplementary Material for this article can be found online at: https://www.frontiersin.org/articles/10.3389/fphys.2024.1329145/full#supplementary-material
Supplementary figure S1 | Schematic diagram of CoT-YOLO.
Supplementary figure S2 | Schematic diagram of X-Pose.
Supplementary figure S3 | Scatterplot showing the differences between the ground truth BA and EVG-BANet prediction based on the chronological age groups for the local test set.
Supplementary figure S4 | Scatterplots showing the differences between the ground truth BA and EVG-BANet prediction based on gender for (A) the local test set and (B) the external test set.
Beheshtian E., Putman K., Santomartino S. M., Parekh V. S., Yi P. H. (2023). Generalizability and bias in a deep learning pediatric bone age prediction model using hand radiographs. Radiology 306 (2), e220505. doi:10.1148/radiol.220505
Cidanwangjiu T., Yang M., Puqiongqiongda , Wang F., Pan H., Jin Z. (2023). Influence of high altitude on bone age development of children and adolescents. Basic & Clin. Med. 43 (4), 636–640.
Creo A. L., Schwenk W. F. (2017). Bone age: a handy tool for pediatric providers. Pediatrics 140 (6), e20171486. doi:10.1542/peds.2017-1486
Eng D. K., Khandwala N. B., Long J., Fefferman N. R., Lala S. V., Strubel N. A., et al. (2021). Artificial intelligence algorithm improves radiologist performance in skeletal age assessment: a prospective multicenter randomized controlled trial. Radiology 301 (3), 692–699. doi:10.1148/radiol.2021204021
Escobar M., González C., Torres F., Daza L., Triana G., Arbeláez P. (2019). “Hand pose estimation for pediatric bone age assessment,” in Medical Image Computing and Computer Assisted Intervention – MICCAI 2019, Shenzhen, China, October 13–17, 2019 (Cham: Springer International Publishing), 531–539.
Greulich W. W., Idell Pyle S. (1959). Radiographic atlas of skeletal development of the hand and wrist. Am. J. Med. Sci. 238, 393. doi:10.1097/00000441-195909000-00030
Halabi S. S., Prevedello L. M., Kalpathy-Cramer J., Mamonov A. B., Bilbily A., Cicero M., et al. (2019). The RSNA pediatric bone age machine learning challenge. Radiology 290 (2), 498–503. doi:10.1148/radiol.2018180736
Harris N. S., Crawford P. B., Yangzom Y., Pinzo L., Gyaltsen P., Hudes M. (2001). Nutritional and health status of Tibetan children living at high altitudes. N. Engl. J. Med. 344 (5), 341–347. doi:10.1056/NEJM200102013440504
Kim J. R., Shim W. H., Yoon H. M., Hong S. H., Lee J. S., Cho Y. A., et al. (2017). Computerized bone age estimation using deep learning based program: evaluation of the accuracy and efficiency. Am. J. Roentgenol. 209 (6), 1374–1380. doi:10.2214/AJR.17.18224
Larson D. B. (2023). Openness and transparency in the evaluation of bias in artificial intelligence. Radiology 306 (2), e222263. doi:10.1148/radiol.222263
Larson D. B., Chen M. C., Lungren M. P., Halabi S. S., Stence N. V., Langlotz C. P. (2018). Performance of a deep-learning neural network model in assessing skeletal maturity on pediatric hand radiographs. Radiology 287 (1), 313–322. doi:10.1148/radiol.2017170236
Lee H., Tajmir S., Lee J., Zissen M., Yeshiwas B. A., Alkasab T. K., et al. (2017). Fully automated deep learning system for bone age assessment. J. Digit. Imaging 30 (4), 427–441. doi:10.1007/s10278-017-9955-8
Lee K. C., Lee K. H., Kang C. H., Ahn K. S., Chung L. Y., Lee J. J., et al. (2021). Clinical validation of a deep learning-based hybrid (Greulich-Pyle and modified tanner-whitehouse) method for bone age assessment. Korean J. Radiol. 22 (12), 2017–2025. doi:10.3348/kjr.2020.1468
Li Y., Yao T., Pan Y., Mei T. (2023). Contextual transformer networks for visual recognition. IEEE Trans. Pattern Anal. Mach. Intell. 45 (2), 1489–1500. doi:10.1109/TPAMI.2022.3164083
Lin T.-Y., Maire M., Belongie S., Bourdev L., Girshick R., Hays J., et al. (2014). Microsoft COCO: common objects in context. arXiv:1405.0312. Available at: https://ui.adsabs.harvard.edu/abs/2014arXiv1405.0312L.
Mutasa S., Chang P. D., Ruzal-Shapiro C., Ayyala R. (2018). MABAL: a novel deep-learning architecture for machine-assisted bone age labeling. J. Digit. Imaging 31 (4), 513–519. doi:10.1007/s10278-018-0053-3
Nguyen Q. H., Nguyen B. P., Nguyen M. T., Chua M. C. H., Do T. T. T., Nghiem N. (2022). Bone age assessment and sex determination using transfer learning. Expert Syst. Appl. 200 (C), 116926. doi:10.1016/j.eswa.2022.116926
Ontell F. K., Ivanovic M., Ablin D. S., Barlow T. W. (1996). Bone age in children of diverse ethnicity. AJR Am. J. Roentgenol. 167 (6), 1395–1398. doi:10.2214/ajr.167.6.8956565
Prokop-Piotrkowska M., Marszalek-Dziuba K., Moszczynska E., Szalecki M., Jurkiewicz E. (2021). Traditional and new methods of bone age assessment-an overview. J. Clin. Res. Pediatr. Endocrinol. 13 (3), 251–262. doi:10.4274/jcrpe.galenos.2020.2020.0091
Redmon J., Farhadi A. (2018). YOLOv3: an incremental improvement. arXiv:1804.02767. Available at: https://ui.adsabs.harvard.edu/abs/2018arXiv180402767R.
Ren X., Li T., Yang X., Wang S., Ahmad S., Xiang L., et al. (2019). Regression convolutional neural network for automated pediatric bone age assessment from hand radiograph. IEEE J. Biomed. Health Inf. 23 (5), 2030–2038. doi:10.1109/JBHI.2018.2876916
Spampinato C., Palazzo S., Giordano D., Aldinucci M., Leonardi R. (2017). Deep learning for automated skeletal bone age assessment in X-ray images. Med. Image Anal. 36, 41–51. doi:10.1016/j.media.2016.10.010
Szegedy C., Vanhoucke V., Ioffe S., Shlens J., Wojna Z. (2015). Rethinking the inception architecture for computer vision. arXiv:1512.00567. Available at: https://ui.adsabs.harvard.edu/abs/2015arXiv151200567S.
Tajmir S. H., Lee H., Shailam R., Gale H. I., Nguyen J. C., Westra S. J., et al. (2019). Artificial intelligence-assisted interpretation of bone age radiographs improves accuracy and decreases variability. Skelet. Radiol. 48 (2), 275–283. doi:10.1007/s00256-018-3033-2
Tanner J. M. (1983). Assessement of skeletal maturity and predicting of adult height (TW2 method). Prediction of adult height, 22–37.
Tanner J. M., Healy M. J. R., Goldstein H. N. C. (2001). Assessment of skeletal maturity and 421 prediction of adult height (TW3 method). 3rd ed. London, United Kingdom: WB Saunders.
van Rijn R. R., Thodberg H. H. (2013). Bone age assessment: automated techniques coming of age? Acta Radiol. 54 (9), 1024–1029. doi:10.1258/ar.2012.120443
Wang F., Cidan W., Gu X., Chen S., Yin W., Liu Y., et al. (2021). Performance of an artificial intelligence system for bone age assessment in Tibet. Br. J. Radiol. 94 (1120), 20201119. doi:10.1259/bjr.20201119
Wang F., Gu X., Chen S., Liu Y., Shen Q., Pan H., et al. (2020). Artificial intelligence system can achieve comparable results to experts for bone age assessment of Chinese children with abnormal growth and development. PeerJ 8, e8854. doi:10.7717/peerj.8854
Yang C., Dai W., Qin B., He X., Zhao W. (2023). A real-time automated bone age assessment system based on the RUS-CHN method. Front. Endocrinol. (Lausanne). 14, 1073219. doi:10.3389/fendo.2023.1073219
Zhang A., Sayre J. W., Vachon L., Liu B. J., Huang H. K. (2009). Racial differences in growth patterns of children assessed on the basis of bone age. Radiology 250 (1), 228–235. doi:10.1148/radiol.2493080468
Keywords: bone age, artificial intelligence, deep learning, Tibetan, Han, children
Citation: Liu Q, Wang H, Wangjiu C, Awang T, Yang M, Qiongda P, Yang X, Pan H and Wang F (2024) An artificial intelligence-based bone age assessment model for Han and Tibetan children. Front. Physiol. 15:1329145. doi: 10.3389/fphys.2024.1329145
Received: 04 November 2023; Accepted: 02 February 2024;
Published: 15 February 2024.
Edited by:
Carlos D. Maciel, University of São Paulo, BrazilReviewed by:
Binh P. Nguyen, Victoria University of Wellington, New ZealandCopyright © 2024 Liu, Wang, Wangjiu, Awang, Yang, Qiongda, Yang, Pan and Wang. This is an open-access article distributed under the terms of the Creative Commons Attribution License (CC BY). The use, distribution or reproduction in other forums is permitted, provided the original author(s) and the copyright owner(s) are credited and that the original publication in this journal is cited, in accordance with accepted academic practice. No use, distribution or reproduction is permitted which does not comply with these terms.
*Correspondence: Fengdan Wang, d2FuZ2ZlbmdkYW5AcHVtY2guY24=
†These authors have contributed equally to this work and share first authorship
Disclaimer: All claims expressed in this article are solely those of the authors and do not necessarily represent those of their affiliated organizations, or those of the publisher, the editors and the reviewers. Any product that may be evaluated in this article or claim that may be made by its manufacturer is not guaranteed or endorsed by the publisher.
Research integrity at Frontiers
Learn more about the work of our research integrity team to safeguard the quality of each article we publish.