
94% of researchers rate our articles as excellent or good
Learn more about the work of our research integrity team to safeguard the quality of each article we publish.
Find out more
PERSPECTIVE article
Front. Physiol., 09 November 2023
Sec. Medical Physics and Imaging
Volume 14 - 2023 | https://doi.org/10.3389/fphys.2023.1281147
This article is part of the Research TopicStandardization, quantification and validation of imaging metrics of neurological diseasesView all 7 articles
 Nikola Stikov1,2,3*
 Agâh Karakuzu1,2
Relaxometry is a field with a glorious and controversial history, and no review will ever do it justice. It is full of egos and inventions, patents and lawsuits, high expectations and deep disillusionments. Rather than a paragraph dedicated to each of these, we want to give it an impressionistic overview, painted over with a coat of personal opinions and ruminations about the future of the field. For those unfamiliar with the Gartner hype cycle, here’s a brief recap. The cycle starts with a technology trigger and goes through a phase of unrealistically inflated expectations. Eventually the hype dies down as implementations fail to deliver on their promise, and disillusionment sets in. Technologies that manage to live through the trough reach the slope of enlightenment, when there is a flurry of second and third generation products that make the initial promise feel feasible again. Finally, we reach the slope of productivity, where mainstream adoption takes off, and more incremental progress is made, eventually reaching steady state in terms of the technology’s visibility. The entire interactive timeline can be viewed at https://qmrlab.org/relaxometry/.
In the context of relaxometry, there is no doubt that the technology trigger (Figure 1) is the invention of NMR and its ability to measure relaxation times. Researchers have been using NMR to characterize chemical compounds since the 1930s, but it was the insight of using in vivo relaxometry to tell a cancerous tissue sample from a healthy one, that gave birth to MRI. In 1970 Look and Locker published their seminal article on measuring relaxation times with NMR (Look and Locker, 1970), and in 1971 Damadian published a study on the use of NMR-based T1 and T2 values for detecting malignant tumors (Damadian, 1971). Based on this work, he issued a patent application titled “an apparatus and method for detecting cancer in tissue” in 1972, which was accepted in 1974 (Damadian, 1974).
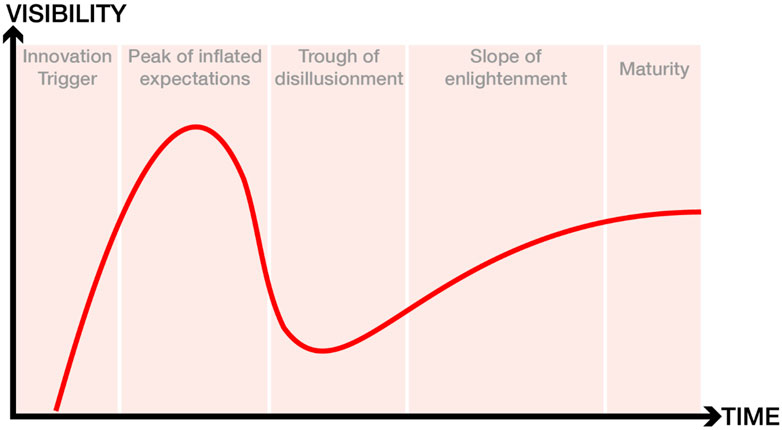
FIGURE 1. The five stages of the hype cycle. For an interactive version of this figure that features the cited research articles, please visit: https://qmrlab.org/relaxometry/.
With undeniable insight from the studies of Lauterbur and Mansfield, Damadian’s team built the first human MRI scanner in 1978 and made it commercially available in 2 years. This scanner was essentially a relaxometry device, using T1 and T2 measurements to create a malignancy index and to distinguish between cancerous and non-cancerous tissue. One could argue that the end of the 70s is the peak of inflated expectations, as many researchers believed that the future of MRI is relaxometry. Yet around the same time, GE started manufacturing scanners without paying royalty to Damadian as consideration for his patent. In the decade that followed, GE sold nearly 600 scanners, for which Damadian’s company Fonar filed a patent infringement lawsuit in the late 1990s and was awarded $128,705,766 as compensation for pecuniary damages1.
It is precisely this lawsuit that resulted in disillusionment about the potential of relaxometry to revolutionize medical imaging. Basically, the court reached the verdict that GE infringed on Damadian’s patent on most counts, except for the count of relaxometry. The original judgment on the verdict reads:
“The Court found that GE had infringed U.S. Patent 3,789,832, MRI’s first patent, which was filed with the U.S. Patent Office in 1972 by Dr. Damadian. The Court concluded that MRI machines rely on the tissue NMR relaxations that were claimed in the patent as a method for detecting cancer, and that MRI machines use these tissue relaxations to control pixel brightness and supply the image contrasts that detect cancer in patients.”
However, the court determined that GE did not infringe on the patent most closely related to relaxometry, as “Fonar failed to establish the existence of standard T1 and T2 values, which are limitations of the asserted claims”. In the years since, MRI manufacturers have insisted that their scanners are not measurement devices and their focus has been on T1-and T2-weighted images that can give visual (qualitative) information about the nature of tissue.
The relaxometry community spent the 1980s clawing its way out of the trough of disillusionment. The biggest problem was the time it took to generate a T1 or T2 map, as initial approaches were slow. A relaxometry scan under 10 min was impossible for most body parts, and even those techniques that showed promise were hampered by field inhomogeneities (Levitt and Freeman, 1981), artifacts (Crawley and Henkelman, 1987), and slow post-processing of the data.
The late 80s and early 90s resulted in several relaxometry breakthroughs, such as faster T1 (Fram et al., 1987) and T2 mapping (Poon and Henkelman, 1992), as well as multi-component T2 mapping (Mackay et al., 1994). There were also significant advances in T1rho and T2* mapping. Additionally, several articles were published on standard relaxation times (Gold et al., 2004; Stanisz et al., 2005) that leveled the field while contributing to the slope of enlightenment.
These initial efforts were followed by second-generation relaxometry techniques that provided shorter scan times and larger coverage, such as combining VFA and Look-Locker approaches with SSFP readouts (Messroghli et al., 2004; Deoni et al., 2005; Piechnik et al., 2010; Chow et al., 2014), non-cartesian data acquisitions (Li et al., 2009), and dictionary-based approaches (Marques et al., 2010).
Eventually advances in compressed sensing and dictionary-based approaches resulted in techniques such as MR fingerprinting (Ma et al., 2013) and synthetic MRI (Ji et al., 2022) that allow for simultaneous mapping of T1 and T2, making a full relaxometry scan clinically feasible for most body parts.
These technological innovations were complemented by the efforts of the National Institute of Standards and Technology (NIST) in the US and the National Physical Laboratory (NPL) in the UK to build standardized phantoms for quantitative MRI, as well as the efforts of the Quantitative Imaging Biomarker Alliance (QIBA) to create standards for interpreting quantitative MRI maps. Additionally, the first book on qMRI was published in 2005 (Tofts, 2005).
2012 saw the publication of a review article on practical medical applications of MR relaxometry (Margaret Cheng et al., 2012). It covered a broad range of relaxometry applications in the brain (multiple sclerosis, stroke, tumors and epilepsy), heart (iron overload, myocardial infarction, edema/inflammation, hemorrhage, methemoglobin, vasodilator function, infarct) and body (iron overload, cartilage disease, injury and infection, cancer). Three case studies with the greatest potential (MS, liver iron and acute myocardial infarction) were covered in-depth. Additionally the article explained the physics behind the pulse sequences and the methodological challenges associated with the technology.
Ten years later we asked the Twitter community to give us an update on what has happened since 2012. We received a number of responses from leaders in the field, and we think it is an informative snapshot of what researchers are most excited about. Most of the themes covered in the 2012 review article are still present, with incremental innovations that confirm that we have reached a plateau of productivity. Below is a Twitter thread2 that captures the zeitgeist.
The polled scientists were most excited about the adoption of standardized relaxometry protocols in multiple sclerosis (Sati et al., 2016; Schmierer et al., 2019) and cardiac relaxometry (Teixeira et al., 2016; Messroghli et al., 2017), reproducibility in liver T1 mapping (Tadimalla et al., 2022), T2 and T2* for iron load in Parkinson’s disease (Betts et al., 2016), relaxometry for radiotherapy (Gurney-Champion et al., 2020), and the rise of synthetic MRI (Hagiwara et al., 2017).
The space is short to go through each of these separately, but we have attempted to find the relevant articles and post them online3, so feel free to explore and join the conversation. Finally, the last few years saw the update of the Tofts book (Cercignani et al., 2018) and the publication of the most comprehensive textbook on qMRI (Seiberlich, 2020).
However, we cannot escape the impression that the field has reached another trough. The promise of relaxometry is to generate MR measurements that reproduce across sites. The qMRI community has not delivered on this promise, and clinicians are losing patience. Half a century has passed since the first quantitative T1 (spin-lattice relaxation time) measurements were first reported as a potential biomarker for tumors (Damadian, 1971), followed shortly thereafter by the first in vivo quantitative T1 maps (Pykett and Mansfield, 1978) of tumors, but there is still disagreement in reported values for this fundamental parameter across different sites, vendors, and implementations (Stikov et al., 2015; Bojorquez et al., 2017; Hafyane et al., 2018). Add to that the problem of scanner upgrades (Keenan et al., 2019), variability across vendors (Lee et al., 2019), and the inverse crimes that plague AI research in MRI (Shimron et al., 2022). Deep learning in particular cannot resist treating MRIs as measurements, when vendors explicitly tell us not to do that.
Fortunately, there is hope on the horizon. The qMRI community has ralied behind recent reproducibility efforts (Stikov et al., 2019), pushing for data standards (Karakuzu et al., 2022a), vendor-neutral sequences (Layton et al., 2017; Cordes et al., 2020; Karakuzu et al., 2022b) and open-source processing software (Karakuzu et al., 2020).
2023 is the year when a lot of these efforts are starting to formalize. The International Society for Magnetic Resonance in Medicine (ISMRM) has formed an ad hoc committee on standards and, and the MRathon4 (a hackathon for MRI professionals) is organizing its second edition focusing on comparable MRI. An idea for a vendor-neutral app store (MRI Fair) won a prize at the 2023 ISMRM shark tank, demonstrating the commercial potential of turning MRI scanners into measurement devices. Finally, we are working on community building by sharing the results of the T1 mapping challenge (Boudreau et al., 2023), publishing the eighth MRM Highlights magazine5, and reviving the MRathon Highlights after-party to celebrate reproducibility and transparency in research. There’s never been a more fun time to do relaxometry!
Half a century after its innovation trigger, relaxometry is still full of surprises. There have been peaks and troughs, but the field is slowly maturing thanks to the community contributions to standardization, reproducibility and vendor-neutrality. The relaxometry hype cycle gives us hope that by the end of the decade we will be able to turn the MRI scanner into a true measurement device.
The original contributions presented in the study are included in the article/supplementary material, further inquiries can be directed to the corresponding author.
NS: Supervision, Writing–original draft, Writing–review and editing. AK: Visualization, Writing–original draft.
The author(s) declare that no financial support was received for the research, authorship, and/or publication of this article.
The authors declare that the research was conducted in the absence of any commercial or financial relationships that could be construed as a potential conflict of interest.
All claims expressed in this article are solely those of the authors and do not necessarily represent those of their affiliated organizations, or those of the publisher, the editors and the reviewers. Any product that may be evaluated in this article, or claim that may be made by its manufacturer, is not guaranteed or endorsed by the publisher.
1https://en.wikipedia.org/wiki/Fonar_Corp._v._General_Electric_Co
2https://twitter.com/Stikov/status/1521757174967549952
3https://qmrlab.org/relaxometry/
5https://blog.ismrm.org/2023/06/02/mrm-highlights-magazine-volume-8/
Betts M. J., Acosta-Cabronero J., Cardenas-Blanco A., Nestor P. J., Düzel E. (2016). High-resolution characterisation of the aging brain using simultaneous quantitative susceptibility mapping (QSM) and R2* measurements at 7 T. Neuroimage 138, 43–63. doi:10.1016/j.neuroimage.2016.05.024
Bojorquez J. Z., Bricq S., Acquitter C., Brunotte F., Walker P. M., Lalande A. (2017). What are normal relaxation times of tissues at 3 T? Magn. Reson Imaging 35, 69–80. doi:10.1016/j.mri.2016.08.021
Boudreau M., Karakuzu A., Cohen-Adad J., Bozkurt E., Carr M., Castellaro M., Concha L., et al. (2023). Results of the ISMRM 2020 joint reproducible research and quantitative MR study groups reproducibility challenge on phantom and human brain T1 mappingNeuroLibre Reproducible Preprints. doi:10.55458/neurolibre.00014
Cercignani M., Dowell N. G., Tofts P. S. (2018). Quantitative MRI of the brain: principles of physical measurement. Oxfordshire: Routledge.
Chow K., Flewitt J. A., Green J. D., Pagano J. J., Friedrich M. G., Thompson R. B. (2014). Saturation recovery single-shot acquisition (SASHA) for myocardial T1 mapping. Magnetic Reson. Med. 71 (6), 2082–2095. doi:10.1002/mrm.24878
Cordes C., Konstandin S., Porter D., Günther M. (2020). Portable and platform-independent MR pulse sequence programs. Magnetic Reson. Med. 83 (4), 1277–1290. doi:10.1002/mrm.28020
Crawley A. P., Henkelman R. M. (1987). Errors in T2 estimation using multislice multiple-echo imaging. Magnetic Reson. Med. 4 (1), 34–47. doi:10.1002/mrm.1910040105
Damadian R. (1971). Tumor detection by nuclear magnetic resonance. Science 171 (3976), 1151–1153. doi:10.1126/science.171.3976.1151
Deoni S. C., Peters T. M., Rutt B. K. (2005). High-resolution T1 and T2 mapping of the brain in a clinically acceptable time with DESPOT1 and DESPOT2. Magnetic Reson. Med. Official J. Int. Soc. Magnetic Reson. Med. 53 (1), 237–241. doi:10.1002/mrm.20314
Fram E. K., Herfkens R. J., Johnson G. A., Glover G. H., Karis J. P., Shimakawa A., et al. (1987). Rapid calculation of T1 using variable flip angle gradient refocused imaging. Magn. Reson Imaging 5 (3), 201–208. doi:10.1016/0730-725x(87)90021-x
Gold G. E., Han E., Stainsby J., Wright G., Brittain J., Beaulieu C. (2004). Musculoskeletal MRI at 3.0 T: relaxation times and image contrast. Am. J. Roentgenol. 183 (2), 343–351. doi:10.2214/ajr.183.2.1830343
Gurney-Champion O. J., Mahmood F., van Schie M., Julian R., George B., Philippens M. E. P., et al. (2020). Quantitative imaging for radiotherapy purposes. Radiotherapy Oncol. 146, 66–75. doi:10.1016/j.radonc.2020.01.026
Hafyane T., Karakuzu A., Duquette C., Mongeon F. P., Cohen-Adad J., Jerosch-Herold M., et al. (2018). Let’s talk about cardiac T1 mapping. bioRxiv: 343079. Available at: https://doi.org/10.1101/343079.
Hagiwara A., Warntjes M., Hori M., Andica C., Nakazawa M., Kumamaru K. K., et al. (2017). SyMRI of the brain: rapid quantification of relaxation rates and proton density, with synthetic MRI, automatic brain segmentation, and myelin measurement. Invest Radiol. 52 (10), 647–657. doi:10.1097/RLI.0000000000000365
Ji S., Yang D., Lee J., Choi S. H., Kim H., Kang K. M. (2022). Synthetic MRI: technologies and applications in neuroradiology. J. Magnetic Reson. Imaging 55 (4), 1013–1025. doi:10.1002/jmri.27440
Karakuzu A., Appelhoff S., Auer T., Boudreau M., Feingold F., Khan A. R., et al. (2022a). qMRI-BIDS: an extension to the brain imaging data structure for quantitative magnetic resonance imaging data. Sci. data 9 (1), 517. doi:10.1038/s41597-022-01571-4
Karakuzu A., Biswas L., Cohen-Adad J., Stikov N. (2022b). Vendor-neutral sequences and fully transparent workflows improve inter-vendor reproducibility of quantitative MRI. Magnetic Reson. Med. 88 (3), 1212–1228. doi:10.1002/mrm.29292
Karakuzu A., Boudreau M., Duval T., Boshkovski T., Leppert I., Cabana J. F., et al. (2020). qMRLab: quantitative MRI analysis, under one umbrella. J. Open Source Softw. 5 (53), 2343. doi:10.21105/joss.02343
Keenan K. E., Gimbutas Z., Dienstfrey A., Stupic K. F. (2019). Assessing effects of scanner upgrades for clinical studies. J. Magnetic Reson. Imaging 50 (6), 1948–1954. doi:10.1002/jmri.26785
Layton K. J., Kroboth S., Jia F., Littin S., Yu H., Leupold J., et al. (2017). Pulseq: a rapid and hardware-independent pulse sequence prototyping framework. Magnetic Reson. Med. 77 (4), 1544–1552. doi:10.1002/mrm.26235
Lee Y., Callaghan M. F., Acosta-Cabronero J., Lutti A., Nagy Z. (2019). Establishing intra-and inter-vendor reproducibility of T1 relaxation time measurements with 3T MRI. Magnetic Reson. Med. 81 (1), 454–465. doi:10.1002/mrm.27421
Levitt M. H., Freeman R. (1981). Compensation for pulse imperfections in NMR spin-echo experiments. J. Magnetic Reson. (1969) 43 (1), 65–80. doi:10.1016/0022-2364(81)90082-2
Li Z., Graff C., Gmitro A. F., Squire S. W., Bilgin A., Outwater E. K., et al. (2009). Rapid water and lipid imaging with T2 mapping using a radial IDEAL-GRASE technique. Magnetic Reson. Med. Official J. Int. Soc. Magnetic Reson. Med. 61 (6), 1415–1424. doi:10.1002/mrm.21918
Look D. C., Locker D. R. (1970). Time saving in measurement of NMR and EPR relaxation times. Rev. Sci. Instrum. 41 (2), 250–251. doi:10.1063/1.1684482
Ma D., Gulani V., Seiberlich N., Liu K., Sunshine J. L., Duerk J. L., et al. (2013). Magnetic resonance fingerprinting. Nature 495 (7440), 187–192. doi:10.1038/nature11971
Mackay A., Whittall K., Adler J., Li D., Paty D., Graeb D. (1994). In vivo visualization of myelin water in brain by magnetic resonance. Magnetic Reson. Med. 31 (6), 673–677. doi:10.1002/mrm.1910310614
Margaret Cheng H. L., Stikov N., Ghugre N. R., Wright G. A. (2012). Practical medical applications of quantitative MR relaxometry. J. Magnetic Reson. Imaging 36 (4), 805–824. doi:10.1002/jmri.23718
Marques J. P., Kober T., Krueger G., van der Zwaag W., Van de Moortele P. F., Gruetter R. (2010). MP2RAGE, a self bias-field corrected sequence for improved segmentation and T1-mapping at high field. Neuroimage 49 (2), 1271–1281. doi:10.1016/j.neuroimage.2009.10.002
Messroghli D. R., Moon J. C., Ferreira V. M., Grosse-Wortmann L., Kellman P. (2017). Clinical recommendations for cardiovascular magnetic resonance mapping of T1, T2, T2* and extracellular volume: a consensus statement by the Society for Cardiovascular Magnetic Resonance (SCMR) endorsed by the European Association for Cardiovascular Imaging (EACVI). J. Cardiovasc. magnetic Reson. 19 (1), 75–24. doi:10.1186/s12968-017-0389-8
Messroghli D. R., Radjenovic A., Kozerke S., Higgins D. M., Sivananthan M. U., Ridgway J. P. (2004). Modified Look-Locker inversion recovery (MOLLI) for high-resolution T1 mapping of the heart. Magnetic Reson. Med. Official J. Int. Soc. Magnetic Reson. Med. 52 (1), 141–146. doi:10.1002/mrm.20110
Piechnik S. K., Ferreira V. M., Dall'Armellina E., Cochlin L. E., Greiser A., Neubauer S., et al. (2010). Shortened Modified Look-Locker Inversion recovery (ShMOLLI) for clinical myocardial T1-mapping at 1.5 and 3 T within a 9 heartbeat breathhold. J. Cardiovasc. magnetic Reson. 12 (1), 69–11. doi:10.1186/1532-429X-12-69
Poon C. S., Henkelman R. M. (1992). Practical T2 quantitation for clinical applications. J. Magnetic Reson. Imaging 2 (5), 541–553. doi:10.1002/jmri.1880020512
Pykett I., Mansfield P. (1978). A line scan image study of a tumorous rat leg by NMR. Phys. Med. Biol. 23 (5), 961–967. doi:10.1088/0031-9155/23/5/012
Sati P., Oh J., Constable R. T., Evangelou N., Guttmann C. R. G., Henry R. G., et al. (2016). The central vein sign and its clinical evaluation for the diagnosis of multiple sclerosis: a consensus statement from the North American Imaging in Multiple Sclerosis Cooperative. Nat. Rev. Neurol. 12 (12), 714–722. doi:10.1038/nrneurol.2016.166
Schmierer K., Campion T., Sinclair A., van Hecke W., Matthews P. M., Wattjes M. P. (2019). Towards a standard MRI protocol for multiple sclerosis across the UK. Br. J. Radiology 92 (1101), 20180926. doi:10.1259/bjr.20180926
Shimron E., Tamir J. I., Wang K., Lustig M. (2022). Implicit data crimes: machine learning bias arising from misuse of public data. Proc. Natl. Acad. Sci. 119 (13), e2117203119. doi:10.1073/pnas.2117203119
Stanisz G. J., Odrobina E. E., Pun J., Escaravage M., Graham S. J., Bronskill M. J., et al. (2005). T1, T2 relaxation and magnetization transfer in tissue at 3T. Magnetic Reson. Med. Official J. Int. Soc. Magnetic Reson. Med. 54 (3), 507–512. doi:10.1002/mrm.20605
Stikov N., Boudreau M., Levesque I. R., Tardif C. L., Barral J. K., Pike G. B. (2015). On the accuracy of T1 mapping: searching for common ground. Magnetic Reson. Med. 73 (2), 514–522. doi:10.1002/mrm.25135
Stikov N., Trzasko J. D., Bernstein M. A. (2019). Reproducibility and the future of MRI research. Magn. Reson Med. 82, 1981–1983. doi:10.1002/mrm.27939
Tadimalla S., Wilson D. J., Shelley D., Bainbridge G., Saysell M., Mendichovszky I. A., et al. (2022). Bias, repeatability and reproducibility of liver T1 mapping with variable flip angles. J. Magnetic Reson. Imaging 56 (4), 1042–1052. doi:10.1002/jmri.28127
Teixeira T., Hafyane T., Stikov N., Akdeniz C., Greiser A., Friedrich M. G. (2016). Comparison of different cardiovascular magnetic resonance sequences for native myocardial T1 mapping at 3T. J. Cardiovasc. magnetic Reson. 18 (1), 65–12. doi:10.1186/s12968-016-0286-6
Keywords: relaxometry, MRI, T1 mapping, T2 mapping, reproducibility, quantitative MRI (qMRI)
Citation: Stikov N and Karakuzu A (2023) The relaxometry hype cycle. Front. Physiol. 14:1281147. doi: 10.3389/fphys.2023.1281147
Received: 28 August 2023; Accepted: 13 October 2023;
Published: 09 November 2023.
Edited by:
Timothy Carroll, The University of Chicago, United StatesReviewed by:
Zenon Starčuk, Institute of Scientific Instruments of the CAS, CzechiaCopyright © 2023 Stikov and Karakuzu. This is an open-access article distributed under the terms of the Creative Commons Attribution License (CC BY). The use, distribution or reproduction in other forums is permitted, provided the original author(s) and the copyright owner(s) are credited and that the original publication in this journal is cited, in accordance with accepted academic practice. No use, distribution or reproduction is permitted which does not comply with these terms.
*Correspondence: Nikola Stikov, bmlrb2xhLnN0aWtvdkBwb2x5bXRsLmNh
Disclaimer: All claims expressed in this article are solely those of the authors and do not necessarily represent those of their affiliated organizations, or those of the publisher, the editors and the reviewers. Any product that may be evaluated in this article or claim that may be made by its manufacturer is not guaranteed or endorsed by the publisher.
Research integrity at Frontiers
Learn more about the work of our research integrity team to safeguard the quality of each article we publish.