- 1Department of Cybernetics and Biomedical Engineering, Faculty of Electrical Engineering and Computer Science, VSB—Technical University of Ostrava, Ostrava, Czechia
- 2Department of Surgical Studies, Faculty of Medicine of the University of Ostrava, Ostrava, Czechia
Introduction: This study proposes an algorithm for preprocessing VCG records to obtain a representative QRS loop.
Methods: The proposed algorithm uses the following methods: Digital filtering to remove noise from the signal, wavelet-based detection of ECG fiducial points and isoelectric PQ intervals, spatial alignment of QRS loops, QRS time synchronization using root mean square error minimization and ectopic QRS elimination. The representative QRS loop is calculated as the average of all QRS loops in the VCG record. The algorithm is evaluated on 161 VCG records from a database of 58 healthy control subjects, 69 patients with myocardial infarction, and 34 patients with bundle branch block. The morphologic intra-individual beat-to-beat variability rate is calculated for each VCG record.
Results and Discussion: The maximum relative deviation is 12.2% for healthy control subjects, 19.3% for patients with myocardial infarction, and 17.2% for patients with bundle branch block. The performance of the algorithm is assessed by measuring the morphologic variability before and after QRS time synchronization and ectopic QRS elimination. The variability is reduced by a factor of 0.36 for healthy control subjects, 0.38 for patients with myocardial infarction, and 0.41 for patients with bundle branch block. The proposed algorithm can be used to generate a representative QRS loop for each VCG record. This representative QRS loop can be used to visualize, compare, and further process VCG records for automatic VCG record classification.
1 Introduction
The development of algorithms for an automatic classification of vectorcardiographic (VCG) records for the purpose of heart disease recognition helps include VCG among the commonly used diagnostic methods. Based on the facts from recent studies [e.g., Lee et al., 1968; Simonson, 1976; Ge, 2008; Huebner et al., 2010; Romero et al., 2010; Dehnavi et al., 2011; Correa et al., 2016; Lingman et al., 2016], VCG achieves more accurate results than the standard 12-lead electrocardiographic (ECG) method. Compared to the empirically assessed 12-lead ECG, VCG diagnostics offers a quantitative description of the heart’s electrical field and of the objective view on the heart vector propagation. Thanks to the three orthogonal X, Y, and Z leads, VCG represents a suitable alternative for computerized data processing with no redundant information (Kral, 2006).
Preprocessing of a VCG record is an important initial step of the classification process commonly involving techniques of filtering, which meets the requirements for diagnostic ECG frequency bands (Kligfield et al., 2007), fiducial time instants of the QRS peak, QRS onset, and QRS end; P- and T-wave peaks, onsets, and ends; isoelectric PQ interval assessment (Pan and Tompkins, 1985; Dokur et al., 1996; Soria-Olivas et al., 1998; Vullings et al., 1998; Martínez et al., 2004; Mazomenos et al., 2012); spatiotemporal QRS loop alignment (van Alsté et al., 1986; Sörnmo, 1993; Sörnmo, 1998; Astrom et al., 2000; Vullings et al., 2013); and finally a representative P-QRS-T loops of a VCG record evaluation.
Recent studies (Sörnmo, 1998; Astrom et al., 2000; Vullings et al., 2013) propose various methods for QRS loop alignment by transformations which consist of rotation and lead-independent or lead-dependent scaling. A crucial modeling issue is, however, whether the diagnostic information of the signals is retained or becomes distorted when these transformations are applied, especially in pathological cases, where the QRS loop planarity is not retained (Schellong, 1939; Pipberger et al., 1962). Moreover, the performance of these methods is strongly dependent on signal-to-noise ratio (SNR) conditions or on a priori information about these transformations.
As a representative template of the QRS loop, characterizing a VCG record, theoretically any of the detected QRS loops of a record could be selected. However, a more accurate method is to evaluate an average QRS loop, where effects of heart movement during the respiration cycle and distance between surface electrodes and the heart variations, along with effects of random noises caused, e.g., by muscular activity, are minimized by the averaging. Ectopic heartbeats, if presented, should be automatically detected and excluded from the record before evaluation of the average heartbeat (Berbari et al., 1993).
Kijonka et al. (2022) focused on the fiducial points of P-QRS-T wave detection based on wavelet transform evaluated on the Physikalisch Technische Bundesanstalt (PTB) diagnostic database and validated on the Common Standards for Quantitative Electrocardiography (CSE) multilead database of 125 records of patients with various diagnoses, including healthy controls (HCs) and patients with myocardial infarction (MI), bundle branch block (BBB), and aspecific conduction defects with significant changes in the ECG image, causing a wide QRS (>120 ms). The QRS peak was evaluated correctly for all of 1,467 beats. The QRS onset and QRS end were detected with standard deviation comparable to or better than other well-known algorithms (Pan and Tompkins, 1985; SAHAMBI et al., 1997; MAZOMENOS, 2012; VULLINGS et al., 1998). The isoelectric interval was detected correctly between the P end and QRS onset for all the cases. The algorithm well-evaluated a wide QRS based on automated wavelet scale switching.
This study builds on the validated QRS loop boundaries and isoelectric coordinate detector presented in Kijonka et al. (2022) for the purpose of further signal processing—the representative QRS loop of a record evaluation technique presented here. This study deals with a suitable digital finite impulse response (FIR) filter design, including automatic notch filter design, a technique of QRS loop spatial alignment, QRS loop time-synchronization, and ectopic QRS loop elimination presented here. Compared to the QRS loop alignment techniques presented in Sörnmo (1998); Astrom et al. (2000); Vullings et al. (2013), the proposed algorithm omits transformation techniques, which could introduce a distortion in the average QRS loop of a record evaluation. Spatial and time synchronization to average the effect of heart movement during respiration, distance electrode variations, and muscular and random noises along with automatic detection to eliminate ectopic rhythms are used instead. To compare the results with those of the previous studies (Sörnmo, 1998; Astrom et al., 2000; Vullings et al., 2013), the ratio of the morphologic variability reduction before and after the proposed algorithm application was assessed separately for three diagnostic groups of HC, MI, and BBB subjects. To evaluate the signal morphologic variability, the maximum relative deviation
The proposed preprocessing algorithm was applied to VCG records of the PTB database of 58 HC, 69 MI, and 34 BBB subjects, where 1/3 of the records of each diagnostic group were used for the algorithm design. The records were 2 min long, containing approximately 120 beats for averaging. The records are sampled at 1.000 Hz (Bousseljot et al., 1995; Goldberger et al., 2000).
2 Materials and methods
The initialization step of the data preprocessing algorithm (Figure 1) is loading of an input database of VCG records accompanied by an anamnesis. In case of the PTB diagnostic database, a record is stored in a MAT/BIN file, accompanied by an anamnesis HEA file.
The VCG preprocessing algorithm is described by individual steps described below in Section 2.1 to Section 2.6.
2.1 Data filtering
In the first step of the algorithm, as shown in Figure 1, a baseline wander and noise motion artifacts are filtered by the FIR high-pass (HP) filter with a passband cutoff frequency of 1 Hz with respect to recommendations from Kligfield et al. (2007). Other artifacts caused by electromagnetic interference (EMI) of the 50-Hz power line are removed using a notch FIR filter. This type of filter was designed for offline biosignal processing due to its linear phase and minimal distortion of the filtered signal (Marchon and Naik, 2018).
2.1.1 High-pass filter design
According to the American Heart Association (AHA), the filter with a cutoff frequency
The experimental measurements show that the cutoff frequency
With respect to the requirement for
The requirement for
The filters are designed using the Parks–McClellan optimalization method. To determine the effectiveness and suitability of the equivalent FIR filter with a cutoff frequency
In order to eliminate the isoelectric baseline fluctuation effectively, the filter with
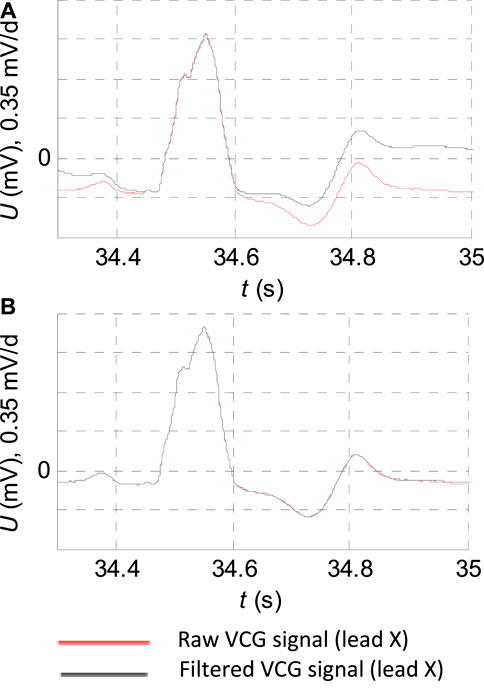
FIGURE 2. ECG record: “s0429_re” of the diagnostic PTB database of the patient with bundle branch block filtering detail. (A) FIR filter with the cutoff frequency
2.1.2 Automatic notch filter design
The designed notch filter is applied automatically only in the case of exceedance in the level of interference by the Eq. 3:
where
According to the European standard EN 50160, “Voltage characteristics of electricity supplied by public distribution systems” is the mains frequency
For electromagnetic interference (EMI) filtering, the FIR notch filter is designed using Parks–McClellan optimalization. The requirement for
The requirement for
2.2 QRS and PQ detection
One of the crucial steps in ECG analysis is to accurately detect the different waves forming the entire cardiac cycle. Most of the studies based on wavelet transformation identify almost all morphologies of ECG waveforms (Lingman et al., 2016). Especially, the wavelet transformation is worth investigating in P- and T-wave recognition (Addison, 2005; Martinez et al., 2004).
In this section, we present our previous work: a design of the QRS peak detector (detector of the R wave) including the time instants of the QRS onset and QRS end detection and the isoelectric PQ segment detection. The algorithm is based on biorthogonal wavelets since they excite various morphologies of ECGs better at different scales (Kijonka et al., 2022).
Here, we summarize the algorithm in eight points. The implementation with zero points and intervals detected is shown in Figure 3.
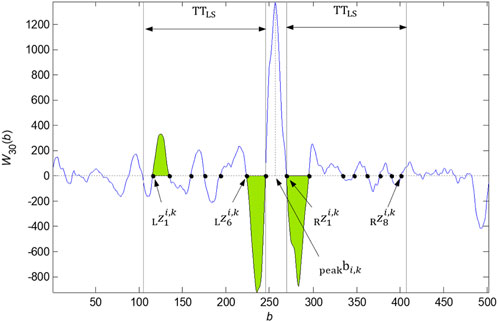
FIGURE 3. Zero points
2.2.1 Basics
The wavelet transform allows us to analyze nonstationary nature signals with localization in time. For analysis, the continuous form of wavelet transform (CWT) was used, described by the Eq. 4:
where
2.2.2 QRS peak detection
QRS peak detection is based on the wavelet transform
2.2.3 QRS onset and QRS end detection
The QRS onset and offset detection is based on zero crossing of
2.2.4 Wide QRS onset and QRS end adjustment
In some cases, e.g., blockades, a wide QRS might occur. The previous parameters of the defined neighborhood of
2.2.5 QRS onset and QRS end adjustment by slope
The adjustment of QRS onset and QRS end using the linear regression is based on the calculation of the slope at the temporal search window applied to the input signal in the area before the QRS onset or after the QRS end detected previously. The QRS onset or QRS end is shifted to the point that meets the specified threshold for the line slope (Kijonka et al., 2022) in the temporal search window.
2.2.6 PQ detection
The PQ segment detection using linear regression is based on finding a minimum slope on the temporal search window of the input signal in the neighborhood of the QRS onset. The time window with width
2.2.7 QRS onset and QRS end alignment between X, Y, and Z signals of a VCG record
The QRS onset and QRS end alignment between the
2.2.8 QRS loop boundary detection
The QRS boundaries of the record are given by the
where
2.3 QRS loop spatial alignment
The isoelectric baseline detection is one of the most important steps in VCG preprocessing for the purpose of quantitative description by the features, especially by the features describing the P-, QRS, and T-loop spatial location. These loops should have the initial point in the origin of the coordinate system; thus, the instantaneous magnitude of the vector given by the three coordinates
The correction on the isoelectric baseline is computed for each VCG signal and each QRS complex detected, by the Eq. 7:
where
Each detected QRS complex of the record with the sequence number
In the cases where the
is used. Based on this relation, the isoelectric baseline
2.4 QRS loop time synchronization
An objective of the QRS loop time synchronization is to move individual heartbeats of a record to a common time-synchronization mark. As the time-synchronization mark, the QRS peak detected in the signal X was selected. For the optimal alignment of the individual heartbeats, a method of root mean square error minimization by individual heartbeat (three signals X, Y, and Z) time shifting, where the individual heart beats are shifted relative to the median heartbeat, is proposed.
All the detected QRS loops adjusted by the isoelectric coordinates (three detected isoelectric levels) are temporally aligned by the method of minimalization of the mean quadratic error from the median for the moving parameter
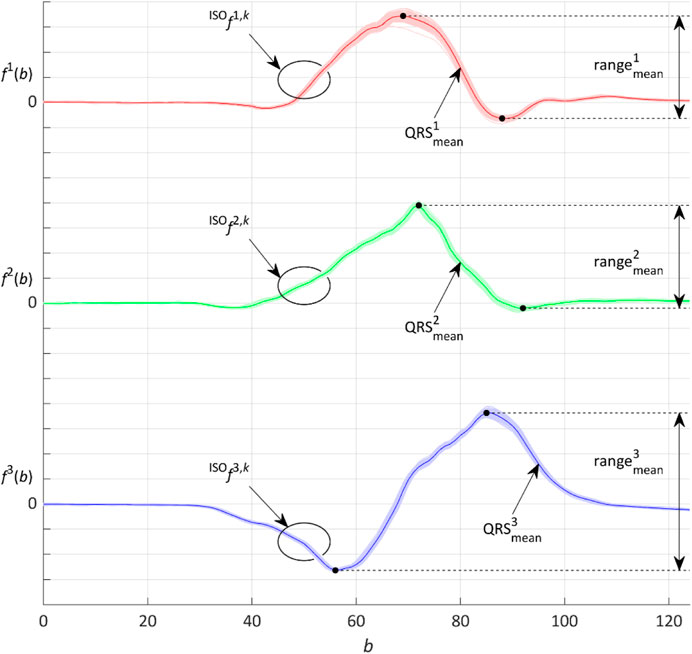
FIGURE 4. Representative QRS loop given by the three
The minimalization process and the
and the range of the median QRS:
where
where
Finally, the
where the moving parameter
The process according to Eqs. 9–12 repeats for the aligned QRS loops by the selected number of iterations. The greater the number of iterations is, the more precise the calculation of the median and of the mean quadratic deviations from the median can be achieved. A number of three iterations was chosen as an optimal value, where further increasing of iterations had a negligible effect on the mean quadratic deviation reduction.
2.5 Ectopic QRS loop elimination
The ectopic QRS loops can be presented in the record, e.g., due to the presence of ventricular extrasystoles, arrhythmias, or artifacts. To evaluate the representative QRS loop of the record, these ectopic QRS loops cannot be considered for the calculation. The ectopic QRS loops were identified by the extreme observation (outlier) method such that
where
Extreme observations with the interquartile range (IQR)
Then,
All the
2.6 Representative QRS loop evaluation
The output of the algorithm for VCG signal preprocessing is the representative QRS loop of a record calculated as the average of the QRS loops of the three
To assess the signal morphologic variability before and after performing the presented methods of spatial alignment, time synchronization, and ectopic QRS elimination, the maximum relative error
where
The results of
The
3 Results
The maximum relative error
A summary of the results of
For most of the records, only the HP filter is used. The automatically selected 50-Hz notch filter according to the Eq. 3 is especially used in the MI case (45%), subsequently in HC (26%), and least in BBB (18%) (Figure 5). For majority of the records, the isoelectric baseline detection is used by Eq. 7. The isoelectric baseline detection according to Eq. 8 is only used in the case of artifacts presented in the processed signal, which made it impossible to detect the PQ segments identically for all the QRS. The indicator of this state is also observable by a higher level of
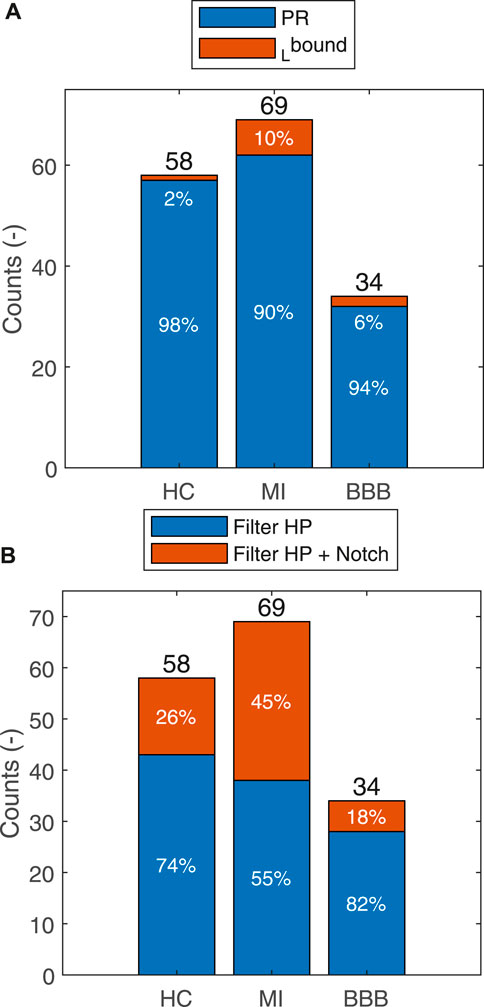
FIGURE 5. Summarization of the usage of the HP filter or HP filter in combination with the notch filter for each group for the HC, MI, and BBB diagnoses (A). Isoelectric baseline by
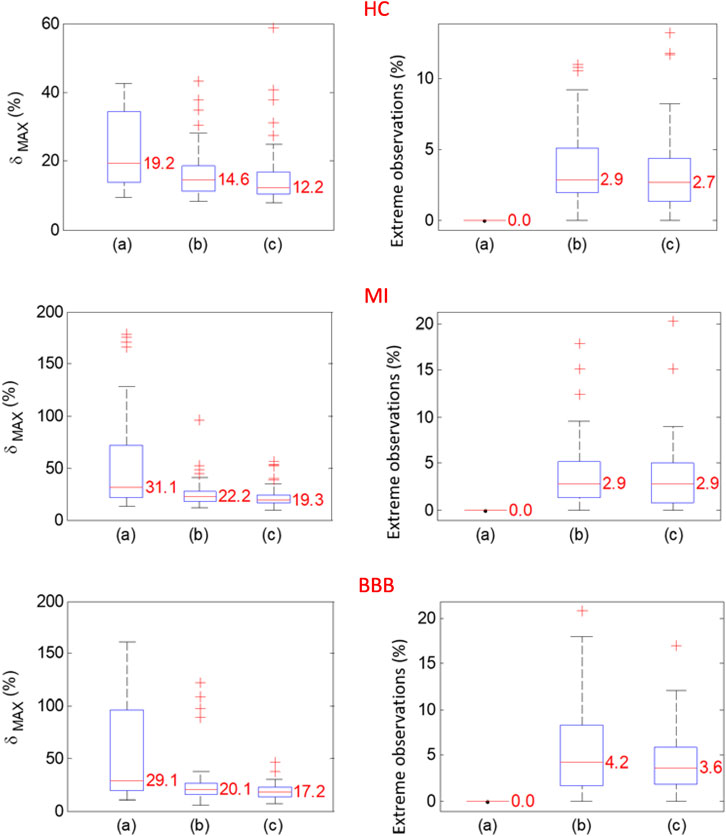
FIGURE 6. Probability distributions of
4 Discussion
The automatic classification of a VCG record requires data preprocessing of three X, Y, and Z orthogonal leads involving algorithms for the onset and end of individual P-QRS-T loop detection. A slow baseline wander requires that the origin of a VCG loop is translated to its isoelectric coordinates before further data processing (Kijonka et al., 2022). Loop translation is considered a part of the data preprocessing used for VCG loop alignment (Sörnmo, 1998; Vullings et al., 2013). Application of these methods allows for comparison of the translated VCG loops of a single record or a comparison between different records and is substantial for intra-individual variability of a record assessment (Penhaker, 2014) for further VCG processing and VCG feature extraction considering the topological arrangement of a VCG loop (Laufberger, 1980; Le et al., 2013). To compare multiple spatially aligned QRS loops with QRS onset, QRS peak and QRS end are detected, and the QRS loops should be first time-synchronized. The best alternative for time synchronization is using the most accurately detected time instant, that is represented by the QRS peak (e.g., in the X lead). However, due to morphologic variability caused in particular by respiration-induced movements of the heart and variability in physiological origin, the QRS loops synchronized by the QRS peak still have falsely high intra-individual variability. By applying the multipass time-synchronization method presented in this study, the QRS loops are synchronized by small time shifts (±8 ms) relative to the original synchronization of the QRS peak to minimize the maximum relative error. A relatively high reduction factor of the morphologic variability is achieved. The beat-to-beat amplitude changes caused by respiration cycles and white noise are averaged in the resulting representative QRS loop of a record, where the impact of additional geometric transformation methods (Sörnmo, 1998; Astrom et al., 2000; Vullings et al., 2013) would have a negligible effect on the resulting average curve.
5 Conclusion
The methods of VCG signal preprocessing to compute a representative QRS loop of a VCG record evaluation were presented and applied in the analysis of VCG records from the diagnostic PTB database of 58 healthy subjects, pathological cases of 69 MI subjects, and 34 BBB subjects. Relatively small intra-individual variability was measured after spatial alignment, and time synchronization implemented by algorithms was presented in this study. The maximum relative deviation of 12.2% for HC, 19.3% for MI, and 17.2% for BBB diagnostic groups was evaluated. The variability was reduced by a factor of 0.36 for HC, 0.38 for MI, and 0.41 for BBB after QRS time synchronization and ectopic QRS elimination were performed. The presented methods of the template QRS loop of a VCG record evaluation can better differentiate between morphologies of healthy and pathological subjects of individual diagnostic groups and different degrees of disability. Application of the proposed algorithm on the other databases of VCG records is expected based on the usage of the validated method of the fiducial point of the P-QRS-T wave detection.
Data availability statement
Publicly available datasets were analyzed in this study. These data can be found at: Xingwen Fu, 12 August 2021, “ptb-diagnostic-ecg-database-1.0.0,” IEEE Dataport, doi: https://dx.doi.org/10.21227/zx3d-d450.
Author contributions
JK: writing–original draft, investigation, methodology, software, and visualization. PV: writing–review and editing, and validation. MP: supervision and writing–review and editing. JK: supervision and writing–review and editing.
Funding
The author(s) declare that financial support was received for the research, authorship, and/or publication of this article. This article has been produced with the financial support of the European Union under the LERCO CZ.10.03.01/00/22_003/0000003 project via the Operational Programme Just Transition. The work and the contributions were supported by the project SP2023/028 “Biomedical Engineering systems XIX”.
Conflict of interest
The authors declare that the research was conducted in the absence of any commercial or financial relationships that could be construed as a potential conflict of interest.
Publisher’s note
All claims expressed in this article are solely those of the authors and do not necessarily represent those of their affiliated organizations, or those of the publisher, the editors, and the reviewers. Any product that may be evaluated in this article, or claim that may be made by its manufacturer, is not guaranteed or endorsed by the publisher.
References
Addison P. S. (2005). Wavelet transforms and the ECG: a review. Physiological Measurement 26 (5), R155–R199. PMID: 16088052. doi:10.1088/0967-3334/26/5/R01
Astrom M., Carro Santos E., Sörnmo L., Laguna P., Wohlfart B. (2000). Vectorcardiographic loop alignment and the measurement of morphologic beat-to-beat variability in noisy signals. IEEE Transactions on Biomedical Engineering 47 (4), 497–506. doi:10.1109/10.828149
Berbari E. J., Lander P. (1993). “The methods of recording and analysis of the signal averaged ECG,” in Signal averaged Electrocardiography. Editor J. A. Gomes (Dordrecht: Springer). doi:10.1007/978-94-011-0894-2_4
Bousseljot R., Kreiseler D., Allard S. (1995). Use of the PTB's ECG signal database CARDIODAT via the Internet. PhysioNet, 317–318.
Cipra T., Fuchs A., Formánek J., Kubát J., Mikisková H., Zajícek P. (1990). Detection and interpolation of outliers in biosignals. Activitas nervosa superior 32 (4), 283–291. PMID: 2082646.
Correa R., Arini P. D., Correa L. S., Valentinuzzi M., Laciar E. (2016). Identification of patients with myocardial infarction. Vectorcardiographic and electrocardiographic analysis. Methods of Information in Medicine 55 (3), 242–249. doi:10.3414/ME15-01-0101
Dehnavi A. R. M., Rabbani H., Farahabadi A., Mahjoob M. P., Dehnavi N. R. (2011). Detection and classification of cardiac ischemia using vectorcardiogram signal via neural network. Journal of Research in Medical Sciences 16 (2), 136–142.
Dokur Z., Olmez T., Korurek M., Yazgan E. (1996). “Detection of ECG waveforms by using artificial neural networks,” in Proceedings of the 18th Annual International Conference of the IEEE Engineering in Medicine and Biology Society, Amsterdam, The Netherlands, 31 October, 1996, 929–930. doi:10.1109/IEMBS.1996.652646
Ge D. (2008). “Detecting myocardial infraction using VCG leads,” in Proceedings of the 2nd international conference on bioinformatics and biomedical engineering, Shanghai, China, 16-18 May 2008 (IEEE).
Goldberger A. L., Amaral L. A., Glass L., Hausdorff J. M., Ivanov P. C., Mark R. G. (2000). PhysioBank, PhysioToolkit, and PhysioNet: components of a new research resource for complex physiologic signals. circulation 101 (23), e215–e220. doi:10.1161/01.cir.101.23.e215
Huebner T., Schuepbach W. M. M., Seeck A., Sanz E., Meier B., Voss A. (2010). Cardiogoniometric parameters for detection of coronary artery disease at rest as a function of stenosis localization and distribution. Medical and Biological Engineering and Computing 48 (5), 435–446. doi:10.1007/s11517-010-0594-1
Kijonka J., Vavra P., Zonca P., Penhaker M. (2022). A wavelet-based VCG QRS loop boundaries and isoelectric coordinates detector. Frontiers in Physiology 13, 2218. doi:10.3389/fphys.2022.941827
Kligfield P., Gettes L. S., Bailey J. J., Childers R., Deal B. J., Hancock E. W. (2007). Recommendations for the standardization and interpretation of the electrocardiogram: part I: the electrocardiogram and its technology: a scientific statement from the American heart association Electrocardiography and arrhythmias committee, council on clinical cardiology; the American college of cardiology foundation; and the heart rhythm society: endorsed by the international society for computerized electrocardiology. Circulation 115 (10), 1306–1324. doi:10.1161/CIRCULATIONAHA.106.180200
Kral V. (2006). Spaciokardiografie. K 20. Výročí úmrtí akademika viléma laufbergera. Cor Et Vasa: International Journal of Cardiology 48 (9). ISSN 0010-8650.
Le T. Q., Bukkapatnam S. T. S., Benjamin B. A., Wilkins B. A., Komanduri R. (2013). Topology and random-walk network representation of cardiac dynamics for localization of myocardial infarction. IEEE Transactions on Biomedical Engineering 60 (8), 2325–2331. doi:10.1109/TBME.2013.2255596
Lee G. B., Wilson W. J., Amplatz K., Tuna N. (1968). Correlation of vectorcardiogram and electrocardiogram with coronary arteriogram. Circulation 38, 189–200. doi:10.1161/01.cir.38.1.189
Lingman M., Hartford M., Karlsson T., Herlitz J., Rubulis A., Caidahl K. (2016). Value of the QRS-T area angle in improving the prediction of sudden cardiac death after acute coronary syndromes. International Journal of Cardiology 218, 1–11. doi:10.1016/j.ijcard.2016.05.005
Marchon N., Naik G. (2018). “A novel linear phase FIR high pass filter for biomedical signals,” in Proceedings of the 2018 IEEE Distributed Computing, VLSI, Electrical Circuits and Robotics (DISCOVER), Mangalore, India. doi:10.1109/DISCOVER.2018.8674120
Martinez J. P., Almeida R., Olmos S., Rocha A. P., Laguna P. (2004). ECG signal analysis and arrhythmia detection using wavelet transform. Journal of The Institution of Engineers (India): Series B 97, 499–507. doi:10.1007/s40031-016-0247-3
Martínez J. P., Almeida R., Olmos S., Rocha A. P., Laguna P. (2004). A wavelet-based ECG delineator: evaluation on standard databases. IEEE Biomedical Engineering 51, 570–581. doi:10.1109/TBME.2003.821031
Mazomenos E. B. (2012). “A time-domain morphology and gradient based algorithm for ECG feature extraction,” in Proceedings of the Industrial technology (ICIT), 2012 IEEE international conference on, Athens, Greece, March 2012 (IEEE), 117–122.
Mazomenos E. B., Chen T., Acharyya A., Bhattacharya A., Rosengarten J., Maharatna K. (2012). “A Time-Domain Morphology and Gradient based algorithm for ECG feature extraction,” in Proceedings of the 2012 IEEE International Conference on Industrial Technology, Athens, Greece, March 2012. doi:10.1109/ICIT.2012.6209924
Medteq (2023). “ECG filters”. [cit. 2023-02-15]. Available at: http://www.medteq.info/med/ECGFilters.
Pan J., Tompkins W. J. (1985). A real-time QRS detection algorithm. IEEE Transactions on Biomedical Engineering 32 (3), 230–236. doi:10.1109/TBME.1985.325532
Penhaker M. (2014). “Evaluation of electrocardiographic leads and establishing significance intra-individuality,” in Proceedings of the Innovations in Bio-inspired Computing and Applications: Proceedings of the 4th International Conference on Innovations in Bio-Inspired Computing and Applications, IBICA 2013, Ostrava, Czech Republic, August 22-24, 2013 (Springer International Publishing).
Pipberger H. V., Carter T. N., Pipberger H. A. (1962). Analysis of the normal and abnormal vectorcardiogram in its own reference frame. Circulation 25 (5), 827–840. doi:10.1161/01.cir.25.5.827
Reich D. L. (2011). Monitoring in anesthesia and perioperative care. Cambridge, UK: Cambridge University Press.
Romero D. (2010). “A vectorial approach for evaluation of depolarization changes during acute myocardial ischemia,” in Proceedings of the 2010 Computing in cardiology, Belfast, UK, 26-29 September 2010 (IEEE).
Sahambi J. S., Tandon S., Bhatt R. K. P. (1997). Using wavelet transforms for ECG characterization. An on-line digital signal processing system. IEEE Engineering in Medicine and Biology Magazine 16 (1), 77–83. doi:10.1109/51.566158
Schellong F. (1939). Grundzuge einer klinischen Vektorcardiographie des Herzens. Berlin, Germany: Springer-Verlag.
Simonson E. (1976). Vectorcardiographic (VCG) recognition and differentiation of myocardial infarction (MI). Advances in Cardiology 16, 386–393. doi:10.1159/000398429
Soria-Olivas E., Martínez-Sober M., Calpe-Maravilla J., Guerrero-Martínez J. F., Chorro-Gascó J., Espí-López J. (1998). Application of adaptive signal processing for determining the limits of P and T waves in an ECG. IEEE Transactions on Biomedical Engineering 45 (8), 1077–1080. doi:10.1109/10.704877
Sörnmo L. (1993). Time-varying digital filtering of ECG baseline wander. Medical and Biological Engineering and Computing 31, 503–508. doi:10.1007/BF02441986
Sörnmo L. (1998). Vectorcardiographic loop alignment and morphologic beat-to-beat variability. IEEE Transactions on Biomedical Engineering 45 (12), 1401–1413. doi:10.1109/10.730434
van Alsté J. A., van Eck W., Herrmann O. E. (1986). ECG baseline wander reduction using linear phase filters. Computers and biomedical research, an international journal 19 (5), 417–427. doi:10.1016/0010-4809(86)90037-6
Vullings H. J. L. M., Verhaegen M. H. G., Verbruggen H. B. (1998). “Automated ECG segmentation with dynamic time warping,” in Proceedings of the 20th Annual International Conference of the IEEE Engineering in Medicine and Biology Society. 20. Biomedical Engineering Towards the Year 2000 and Beyond (Cat. No.98CH36286), Hong Kong, China, November 1998 (IEEE), 163–166.
Keywords: digital filtering, ECG, intra-individuality, isoelectric line detection, QRS detection, QRS loop alignment, representative QRS loop, VCG
Citation: Kijonka J, Vavra P, Penhaker M and Kubicek J (2024) Representative QRS loop of the VCG record evaluation. Front. Physiol. 14:1260074. doi: 10.3389/fphys.2023.1260074
Received: 17 July 2023; Accepted: 04 December 2023;
Published: 04 January 2024.
Edited by:
Ahsan H. Khandoker, Khalifa University, United Arab EmiratesReviewed by:
Lisandro Lovisolo, Rio de Janeiro State University, BrazilDaniele Bibbo, Roma Tre University, Italy
Copyright © 2024 Kijonka, Vavra, Penhaker and Kubicek. This is an open-access article distributed under the terms of the Creative Commons Attribution License (CC BY). The use, distribution or reproduction in other forums is permitted, provided the original author(s) and the copyright owner(s) are credited and that the original publication in this journal is cited, in accordance with accepted academic practice. No use, distribution or reproduction is permitted which does not comply with these terms.
*Correspondence: Jan Kijonka, amFuLmtpam9ua2FAdnNiLmN6
 Jan Kijonka
 Petr Vavra2
