- 1School of Sports and Health, Shanghai University of Sport, Shanghai, China
- 2Shanghai Research Institute of Sports Science, Shanghai, China
Purpose: This study aims to explore the relationship between the dynamic changes in oxygen uptake (
Methods: 12 male modern pentathlon athletes were recruited and performed incremental exhaustive exercise in three different environments: normal condition (23°C, 45%RH, FiO2 = 21.0%, CON), high temperature and humidity environment (35°C, 70%RH, FiO2 = 21.0%, HOT), and hypoxic environment (23°C, 45%RH, FiO2 = 15.6%, HYP). Gas metabolism data of the athletes were collected, and muscle oxygen saturation (SmO2) and total hemoglobin content in the vastus lateralis muscles (VL) were measured to calculate the deoxyhemoglobin content. Linear and nonlinear function models were used to fit the characteristic parameters of
Results: The results showed that compared to the CON,
Conclusion: Incremental exhaustive exercise in hypoxic environment and high temperature and humidity environments inhibits gas exchange and oxygen supply to skeletal muscle tissue in athletes. For athletes, the accelerated deoxygenation response of skeletal muscles during incremental exhaustive exercise in high temperature and humidity environments, as well as the excessive deoxygenation response before BP of deoxyhemoglobin in hypoxic environment, may be contributing factors to peripheral fatigue under different environmental conditions.
1 Introduction
Competitive sports athletes frequently encounter various challenging training and competition environments, such as high temperature, high humidity, and hypoxic conditions. However, when the human body operates in these environments, it often experiences a decline in physical performance and an accelerated onset of exercise fatigue, among other negative effects (Osawa et al., 2017; Jung et al., 2021).
Hypoxia exposure, in comparison to normal environmental conditions, can restrict respiratory function and affect gas exchange in the human body. It can lead to a decrease in arterial oxygen saturation (SpO2), capillary oxygen partial pressure, and ultimately limit oxygen supply to peripheral tissues (Twomey et al., 2017). Numerous studies have consistently demonstrated that hypoxia exposure leads to a decrease in exercise time, maximal oxygen uptake (
The dynamic characteristics of Oxygen Uptake (
Therefore, it is crucial to investigate the characteristics of oxygen supply in peripheral tissues and body gas exchange among athletes in high temperature, high humidity, and hypoxic environments. In our study, we utilized Near-Infrared Spectroscopy (NIRS) as a non-invasive method to assess oxygen levels in micro vessels. By comparing the characteristic parameters of oxygen uptake kinetics and deoxyhemoglobin kinetics in athletes during incremental exhaustive exercise under high temperature and high humidity, hypoxic, and normal environments, we aim to explore the influence of these different special environments on the dynamic changes of
2 Materials and methods
2.1 Subject
Twelve male modern pentathletes (age = 17.91 ± 2.94 years; height = 1.81 ± 0.06 m; body mass = 70.95 ± 8.38 kg; body mass index = 21.69 ± 1.83 kg/m2; training years = 5.33 ± 2.92 years) participated in the study, with no dropouts recorded. Prior to the study, the participants were provided with detailed information about the experimental procedures and the purpose of the study. They were also informed about the potential risks and benefits associated with their participation. Informed consent forms were provided to the participants, and they were given sufficient time to review and understand the information before signing the consent forms. For athletes under the age of 18, approval was sought from the athlete’s legal guardian or close relative. The study specifically involved athletes from the modern pentathlon team of Shanghai Chongming Sports Training Base, who voluntarily agreed to participate in the research. Confidentiality and anonymity of the participants’ personal information were ensured throughout the study.
2.2 Experimental design
2.2.1 Environmental parameters
This study was conducted in the Special Environment Laboratory at the Shanghai Institute of Sports Science. Three different exercise environments were set up: high temperature and humidity with normoxia (HOT), normal temperature and humidity with hypoxia (HYP), and normal temperature and humidity with normoxia (CON). The environmental parameters were as follows: High temperature and humidity with normoxia: 35°C, 70% relative humidity (RH), and fractional inspired oxygen concentration (FiO2) = 21.0%. Normal temperature and humidity with hypoxia: 23°C, 45% RH, and FiO2 = 15.3%. Normal temperature and humidity with normoxia: 23°C, 45% RH, and FiO2 = 21.0%.
2.2.2 Experimental procedure
The athletes performed incremental exercise tests in the three different environments. The CPET test was administered by researchers following a standardized procedure tailored to the characteristics of modern pentathlon athletes, conducted on a treadmill. Prior to the experiment, athletes engaged in a 10-min standardized warm-up and stretching routine, donning necessary equipment such as breathing masks and heart rate monitors before commencing the formal test.
The initial load was set at 8 km/h with 0% incline. Subsequently, the speed was increased by 1 km/h every 1 min while maintaining the incline. When the treadmill speed reached 18 km/h, the speed was no longer increased, but instead, the incline was increased by 1% every 1 min. There were no breaks between the levels. Gas metabolism, heart rate, and other relevant data were continuously collected without intervals between levels. The test termination criteria included various indicators such as dyspnea, cyanosis, dizziness, tinnitus, nausea, chest pain, extreme fatigue, painful expression, pale face, and body shaking. Additionally, the test could be terminated if the participant’s heart rate reaches the expected maximum heart rate, if the subject requests to stop the test, if the Borg Rating of Perceived Exertion (RPE) reaches or exceeds 17, or if the participant is unable to maintain the required speed. In any of these situations, the test was immediately stopped to ensure the safety and wellbeing of the participants.
We implemented a randomized crossover design, conducting participant tests in diverse environments at the same time of day on days 1, 3, and 5, with a 48-h interval between each session. Before each test, the athletes’ physiological parameters were checked to ensure their good health and normal physical function.
2.2.3 Cardiopulmonary responses
Gas metabolism data during the incremental exercise tests were collected using the COSMED gas analyzer (COSMED Quark PFT ergo, OMNIA CPET, Italy). The following parameters were obtained:
2.2.4 Tissue oxygenation
The NIRS signal in human tissues predominantly originates from the absorption of light by hemoglobin (Hb) in arterioles, capillaries, and venules. In muscle tissue, myoglobin (Mb) contributes approximately 10% to the NIRS light absorption signal (Seiyama et al., 1988; Chance et al., 1992). However, due to the overlap of Mb and Hb absorption spectra, they are indistinguishable in NIR spectra. Near-infrared spectral signals primarily indicate the availability of oxygen in tissue microcirculation (Boushel et al., 2001). Furthermore, serving as a monitoring instrument, the MOXY (Moxy Muscle Oxygen Sensor, Hutchinson, Minnesota, United States) has demonstrated reliability in monitoring SmO2 and THb (Crum et al., 2017). Muscle oxygen saturation data were collected using the MOXY near-infrared spectroscopy (NIRS) device. The device utilizes NIRS to measure the concentrations of oxyhemoglobin (O2Hb), deoxyhemoglobin (HHb), and total hemoglobin (THb) in the muscle tissue during incremental exercise tests and recovery after exercise. The data were sampled at a frequency of 1 Hz. The NIRS probe was placed on the skin surface above the vastus lateralis muscles (VL) belly of the dominant lower limb and securely covered to prevent light interference (Yamaguchi et al., 2021). SmO2 was calculated based on a modified form of the Beer-Lambert law (Saitoh et al., 2010).
2.3 Data analyses
2.3.1 Oxygen uptake kinetics
In order to analyze the data in our study, we applied a smoothing technique to
To determine the GET during the exercise, we utilized the V-slope method (Beaver et al., 1986). The inflection point of the VE/
Where
2.3.2 Deoxyhemoglobin kinetics
In the incremental exhaustive exercise, the NIRS measurements of SmO2, [HHb], and [THb] were smoothed using a 10-s interval. To account for variations in athletes’ exercise time in different environments, the mean values of SmO2, [HHb], and [THb] were calculated for the last 30 s of each stage load during the initial 10 min of the exercise test.
The software Origin was utilized for analyzing the dynamic changes of [HHb] measured by NIRS during the exercise test and to calculate the dynamic parameters of [HHb] over the course of exercise. Formula (3) was employed to perform a linear fit between [HHb] and time during exercise. Additionally, the exercise duration was divided into two sections based on the BP, namely, from the start of exercise to BP and from BP to the point of exhaustion. Bilinear fitting using Formula (3) was applied to these two sections. The model parameters were estimated using linear least squares regression analysis, and the slopes of the linear fitting equations were represented as △EHHb-1 and △EHHb-2, respectively (Spencer et al., 2012).
To assess the dynamic relationship between oxygen uptake and oxygen utilization during exercise,
Where [HHb](t) is the deoxyhemoglobin value at time t, [HHb]baseline is the baseline deoxy hemoglobin value, and △EHHb is the linear fitting slope.
2.4 Statistical analysis
The statistical analysis of the experimental data was conducted using SPSS 21.0 software (IBM SPSS Statistics 21, IBM Cooperation, Chicago, IL). The data were presented as mean ± standard deviation (Mean ± SD). For normally distributed data with homogeneous variance, the parameter test was chosen. ANOVA with Repeated Measures was used to analyze the experimental data, and the Bonferroni method was employed for post hoc comparisons between groups to identify any significant differences. If the data did not meet the assumptions of normal distribution or homogeneity of variance, non-parametric tests were used instead. The goodness of fit of the regression model coefficients was evaluated using regression analysis and the Coefficient of Determination (R2). Additionally, the Pearson correlation coefficient (r) was utilized to analyze the correlation between △EHHb-1, △EHHb, and
3 Results
3.1 Gas metabolism
The results of the study showed that compared to the CON, athletes in the HOT and HYP exhibited reductions in
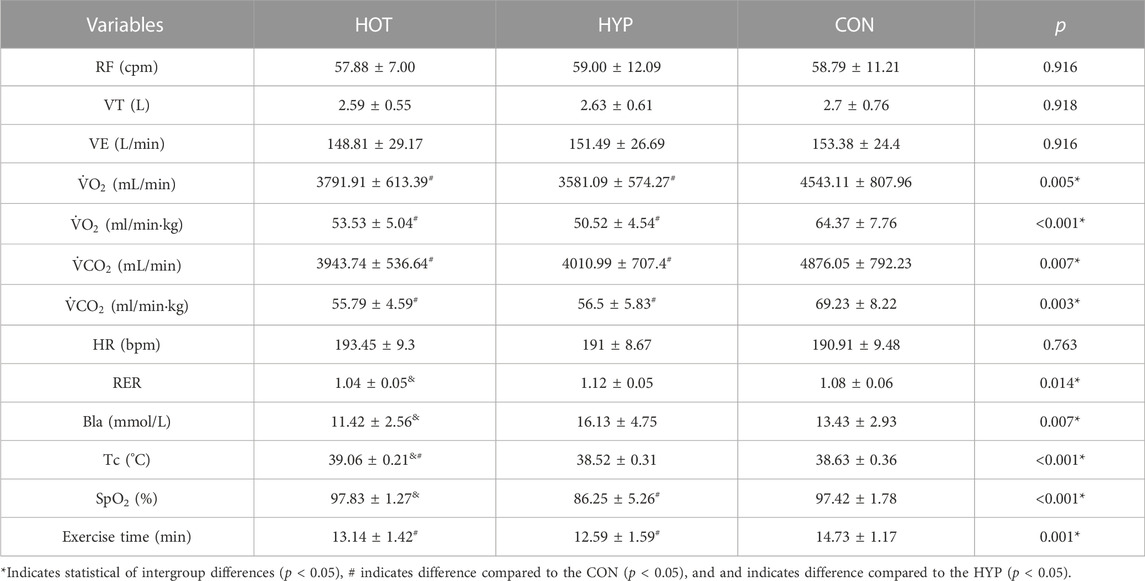
TABLE 1. Gas metabolism parameters at exhaustion during incremental exhaustive exercise in different environments.
After linear regression analysis of
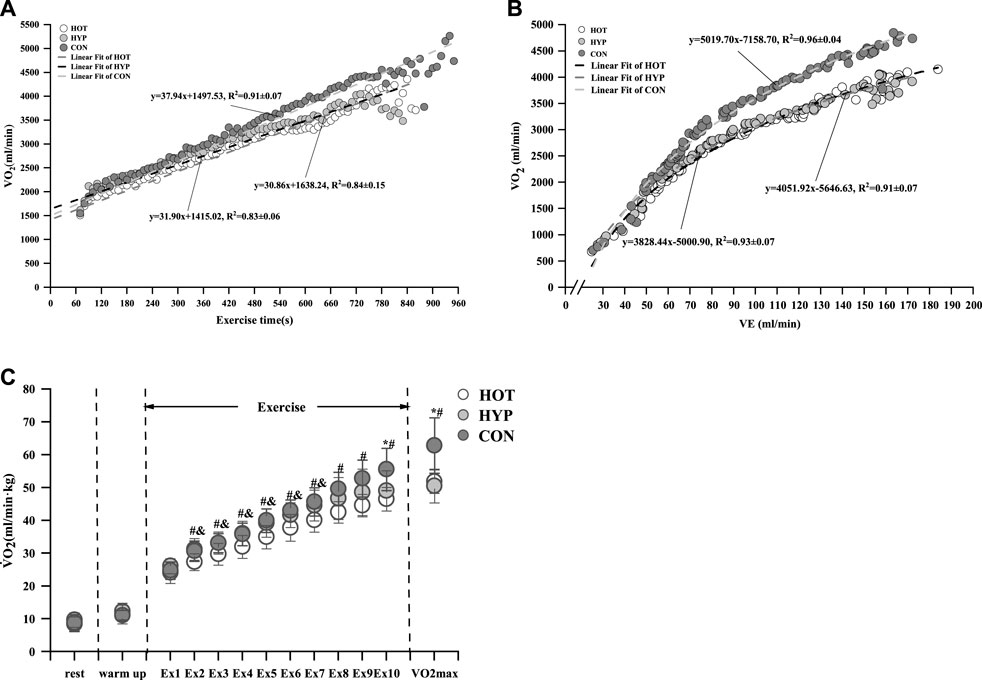
FIGURE 1. Linear fit of
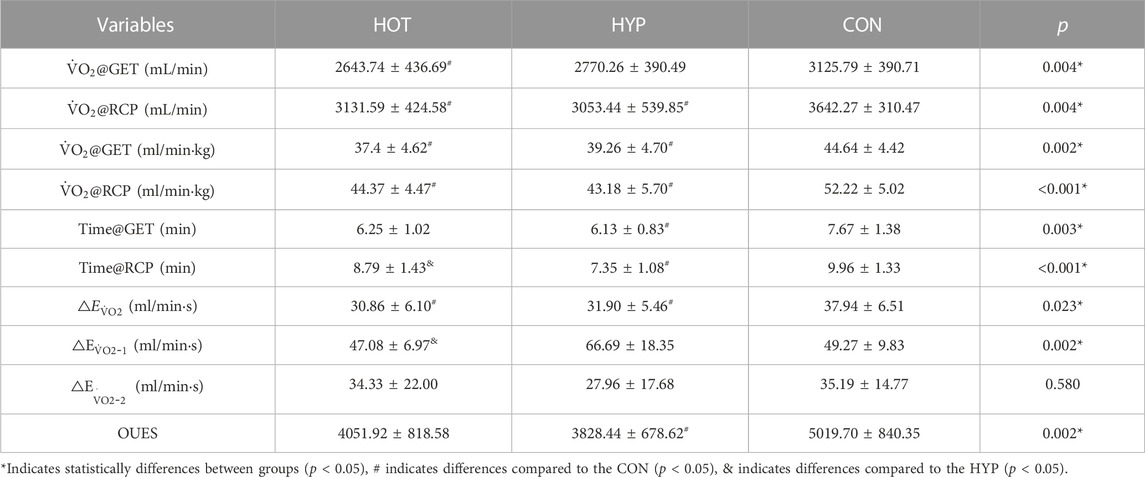
TABLE 2. Differences in kinetic parameters of
For the change in
For the change in VT during exercise, differences were observed in the main effect at various time points (F (9, 297) = 31.103, p < 0.001, ηp2 = 0. 485). There were disparities in group main effects (F (9, 297) = 31.103, p < 0.001, ηp2 = 0. 485), and differences in time and group interaction effects were also identified (F = 2.551, p = 0.001, ηp2 = 0.134). The results indicated that, in comparison to HYP, CON exhibited a lower VT at 210s (p < 0.05), and HOT showed a lower VT at 180s and 210s shown in Figure 2A.
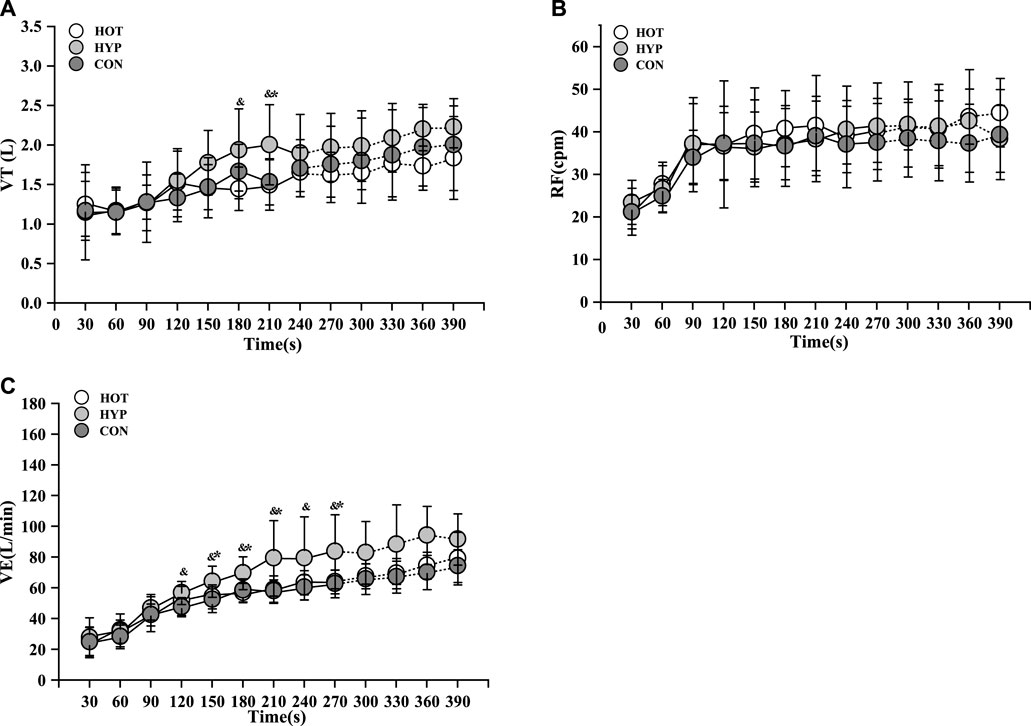
FIGURE 2. Changes of VT (A) and RF (B) and VE (C) in incremental exhaustive exercise in different environments. Note: * indicates a difference between the CON and HYP (p < 0.05), # indicates a difference between the CON and HOT (p < 0.05), and & indicates a difference between the HOT and HYP (p < 0.05).
For the change in RF during exercise, differences were observed in the main effect at various time points (F (9, 297) = 35.231, p < 0.001, ηp2 = 0.516). There was no discernible difference in the group main effect (F (2, 33) = 1.057, p = 0.359, ηp2 = 0.060), and no substantial difference in the time and group interaction effect (F = 1.122, p = 0.329, ηp2 = 0.064). While there was no increase in RF within the first 270s for HYP, the RF remained relatively high during this period shown in Figure 2B.
For the change in VE during exercise, differences were observed in the main effect at various time points (F (9, 297) = 150.155, p < 0.001, ηp2 = 0.820). There were disparities in group main effects (F (2, 33) = 5.468, p = 0.009, ηp2 = 0.249), and differences in time and group interaction effects were also identified (F = 3.901, p < 0.001, ηp2 = 0. 191). Additionally, in the comparison of VE, it was observed that CON had a lower VE than HYP from 120s to 270s (p < 0.05), and HOT had a lower VE than HYP at 180s, 210s, and 270s (p < 0.05) shown in Figure 2C.
3.2 Skeletal muscle hemoglobin
The study results indicate that after linear fitting of [HHb] values with exercise time for each group, the HOT had R2 = 0.86 ± 0.15 (p < 0.01), the HYP had R2 = 0.88 ± 0.09 (p < 0.01), and the CON had R2 = 0.91 ± 0.07 (p < 0.01), as shown in Figure 3A. The results show that compared to the CON, the HOT exhibits a increase in △EHHb (F (1.695, 18.643) = 3.796, p = 0.047, ηp2 = 0. 257, CON vs. HOT p = 0.044 95%CI [0.003, 0.248]). Additionally, the study results reveal that compared to the CON, both the HOT and HYP exhibit a decrease in the exercise time corresponding to BP (F (2, 22) = 4.860, p = 0.018, ηp2 = 0.306, CON vs. HOT p = 0.049 95%CI [0.004, 2.857]; CON vs. HYP p = 0.031, 95%CI [0.144, 2.420]). Furthermore, compared to the CON, the HOT shows a decrease in
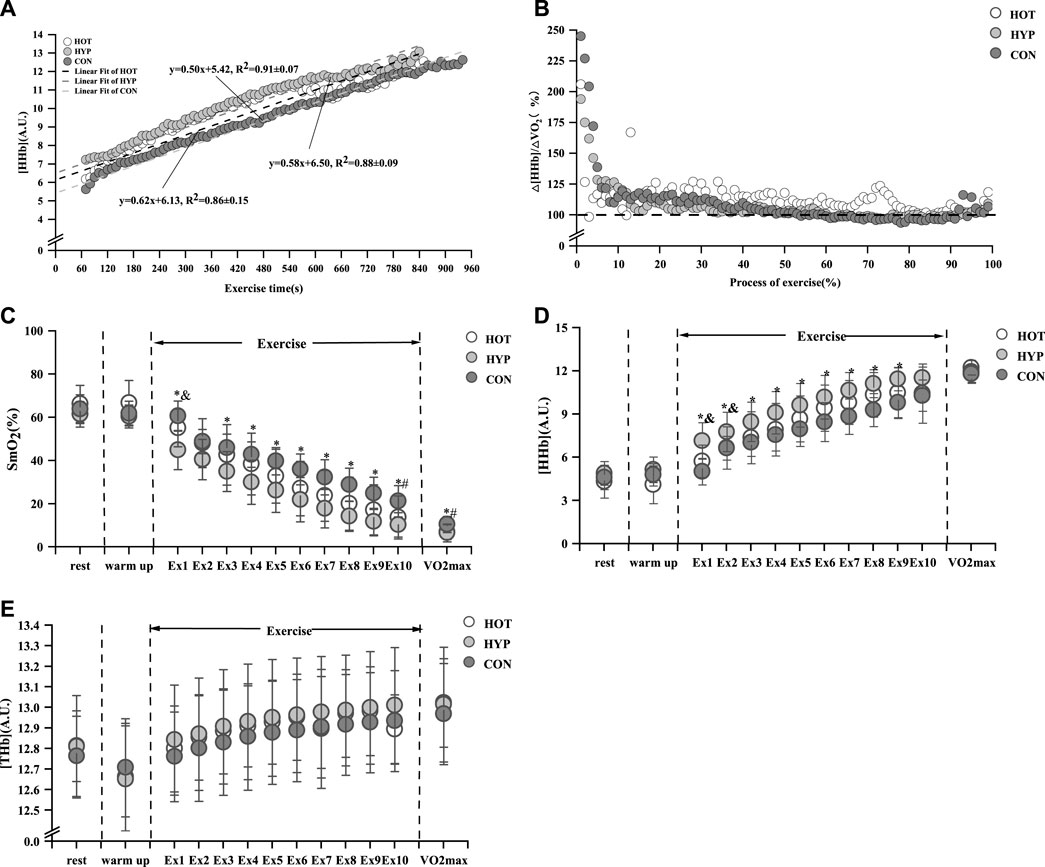
FIGURE 3. Linear fit of HHb (A) and characteristics of △[HHb]/△

TABLE 3. The dynamic parameter difference of HHb in the incremental exhaustive exercise under different environments.
Furthermore, there were differencesand CON reached in
After analyzing the data from the first 10min of exercise, For the change in SmO2 during exercise, differences were observed in the main effect at various time points (F (12, 396) = 323.664, p < 0.001, ηp2 = 0.907). There were disparities in group main effects (F (2, 33) = 7.509, p = 0.002, ηp2 = 0.313), and differences in time and group interaction effects were also identified (F = 2.790, p < 0.001, ηp2 = 0.145). It was found that in the first minute of incremental load testing, the HOT and CON had a increase in SmO2 compared to the HYP (p < 0.05). From the 3rd to the 9th minute, the HYP had a decrease in SmO2 compared to the CON (p < 0.05). At the 10th minute of the incremental load test, the HOT had a decrease in SmO2 compared to the CON (p < 0.05). When reaching
In addition, For the change in [THb] during exercise, differences were observed in the main effect at various time points (F (12, 396) = 31.572, p < 0.001, ηp2 = 0.489). There was no discernible difference in the group main effect (F (2, 33) = 0.208, p = 0.813, ηp2 = 0.012), and no substantial difference in the time and group interaction effect (F = 0.893, p = 0.612, ηp2 = 0.051). we found that no difference in [THb] during exercise among the three environments (p > 0.05), as shown in Figure 3E.
Additionally, the study analyzed the correlation between △EHHb and corresponding
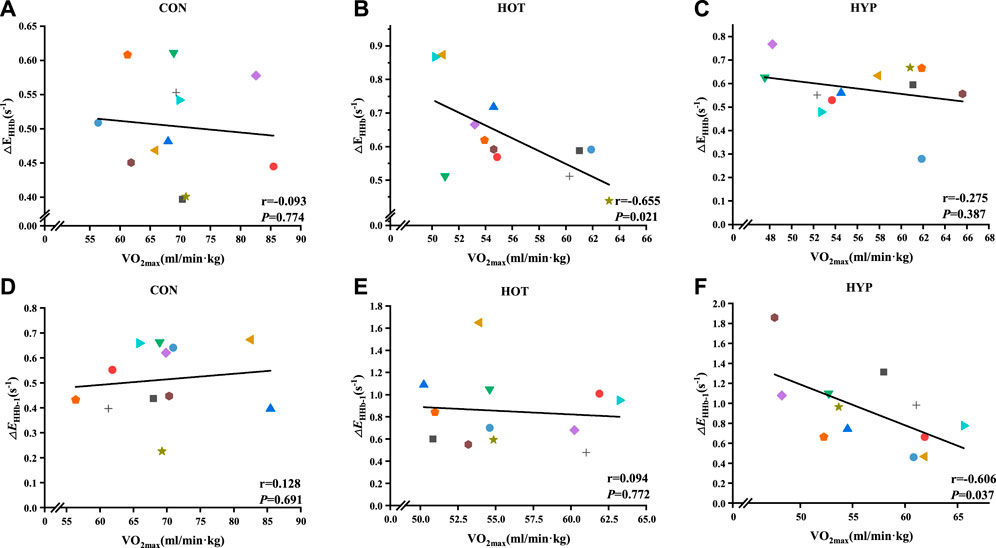
FIGURE 4. Correlation analysis results for △EHHb-1 and
4 Discussion
The aim of this study was to compare the effects of incremental exhaustive exercise on the dynamic changes of athletes’
When comparing the dynamic changes of
Regarding the oxygen supply to skeletal muscles, our findings are consistent with previous literature reports (Zhang et al., 2010), indicating a positive correlation between BP and GET. In terms of selecting the appropriate linear fitting model for HHb, Spencer (Spencer et al., 2012) have noted that the bilinear model provides a more accurate description of the potential physiological response of HHb in subjects compared to the S-type regression model. Thus, we employed the bilinear model to assess the dynamic changes in HHb in VL during exercise. To evaluate the HHb response throughout the entire exercise process, we also calculated the slope of HHb from the onset of exercise to the point of exhaustion. Interestingly, our observations demonstrate that the ΔEHHb in the HOT is higher than that in the CON, and the significance of SmO2 is lower in the HOT compared to the CON at the 10-min mark during exercise. Previous research by Dennis (Dennis et al., 2023) has shown that exercise at 35°C and 40°C, compared to a single exercise at 20°C, can enhance the deoxygenation reaction in skeletal muscles. Girard (Girard et al., 2016) have highlighted that high-intensity exercise in a high temperature and humidity environment can affect the efficiency of output power and accelerate peripheral fatigue. Our study indicates that the efficiency of output power of skeletal muscles increases during the initial stage of exercise in the high-temperature and high-humidity environment, offsetting some of the negative effects (Racinais et al., 2017). Consequently, we did not observe a significant decrease in SmO2 in the VL during the initial stage of exercise. However, as exercise intensity and duration increased, along with an increase in Tc, peripheral fatigue eventually set in. Throughout the entire exercise process, the significant increase in ΔEHHb may be attributed to the rightward shift of the oxygen dissociation curve caused by a decrease in Hb affinity for oxygen as temperature rises, promoting oxygen release (Webb et al., 2022). Simultaneously, in the analysis of
Hypoxia exposure negatively affects athletes during incremental exhaustive exercise, resulting in decreased SpO2, SmO2, and VO2max at the point of exhaustion. This is consistent with findings from previous studies (Osawa et al., 2011; Azevedo et al., 2020a). Osawa (Osawa et al., 2017) and Bowen (Bowen et al., 2016) have also demonstrated that the SmO2 curve of skeletal muscle decreases while the HHb curve increases during incremental exhaustive exercise in a hypoxic environment. However, these studies did not compare the slope of HHb during exercise. In the initial stage of incremental exhaustive exercise in a hypoxic environment, the metabolism is immediately affected. Hypoxia exposure causes the anaerobic energy supply system to be utilized earlier to maintain ATP demand (Linnarsson et al., 1974), leading to a left shift in BP and GET. Previous studies have shown that the value of ΔEHHb during incremental exhaustive exercise can be influenced by factors such as body position (DiMenna et al., 2010) and metabolic diseases (Gildea et al., 2019). In our study, we observed a significant increase in ΔEHHb-1 before BP, indicating that as skeletal muscle deoxygenation accelerates, the ability to increase peripheral oxygen delivery and meet the increased oxygen demand decreases. However, in the study by Azevedo (Azevedo et al., 2020b), only the leftward shift of BP and the increase in HHb during exercise under hypoxia were observed, without affecting ΔEHHb-1. In comparison, our study employed a lower FiO2 for exercise, which may explain the enhanced skeletal muscle deoxygenation response. Acute hypoxia exposure leads to a significant reduction in oxygen delivery to skeletal muscles during exercise, but this can be compensated by increased oxygen uptake in the body (Calbet et al., 2009). The increase in
In our study, we also observed that ΔEHHb-2 in the HHb plateau after BP appeared to be unaffected by the environmental factors, supporting the notion that the increase in HHb near the critical exercise intensity is not limited by the oxygen diffusion capacity (Murias et al., 2013). Iannetta (Iannetta et al., 2018) have indicated that an oxygen reserve can still be observed in the deep layer of the VL during incremental exhaustive exercise, and this is not influenced by gender or training level (Inglis et al., 2019). Therefore, the presence of an HHb plateau does not indicate the upper limit of oxygen extraction. After reaching BP, the diffusion capacity of oxygen from the capillaries to the muscle fibers may have reached its peak, and the subsequent increase in oxygen uptake depends more on increased oxygen delivery. In our study, we did not observe any difference in
Some criticisms persist regarding the use of near-infrared spectroscopy in the determination of tissue oxygenation. NIRS signals capture changes in hemoglobin Hb and Mb oxygenation, enabling a robust assessment of muscle oxygenation status throughout all exercise stages with high precision (Lucero et al., 2018). Muscle oxygenation reflects the equilibrium between oxygen delivery and oxygen utilization (Koga et al., 2007). However, the contributions of Hb and Mb to NIRS signals differ during muscle contraction (Spires et al., 2011). Other factors, including hematocrit, blood volume, arterioles, capillaries, and venous distribution, can also influence the interpretation of NIRS dynamics in oxygenation and deoxygenation (Koirala et al., 2021). With increased blood flow during exercise, THb may be affected (Alvares et al., 2020). However, even when skin and muscle blood flow increase simultaneously, changes in NIRS-derived oxygenation signals (SmO2, HHb) can still accurately reflect alterations in muscle oxygenation (Tew et al., 2010). Some studies have suggested that the oxygenated signal is influenced by increased skin blood flow, while the deoxygenation signal is not sensitive to changes in blood volume (Grassi et al., 2003; Grassi and Quaresima, 2016). Additionally, Koirala et al.'s study (Koirala et al., 2021) found that changes in blood volume have an additional impact on oxygenation Hb-Mb, primarily associated with capillary oxygenation Hb. In contrast, the effect on deoxidation HHb-Mb is less pronounced, given its association with abundant O2 delivery due to the high O2 saturation of Hb and Mb. Therefore, based on the aforementioned evidence, we maintain confidence in exploring deoxyhemoglobin dynamics in athletes during increasing load exercises under different environments.
5 Conclusion
When athletes engage in incremental exhaustive exercise in a hypoxic environment or a high temperature and high humidity environment, the gas exchange in the body and the oxygen supply to skeletal muscle tissue can be compromised. This can have implications for athletes, as accelerated deoxygenation of skeletal muscle during increasing load exercise under high temperature and high humidity, and excessive deoxygenation of skeletal muscle before the break point of deoxygenated hemoglobin under hypoxic environments, may contribute to peripheral fatigue in different conditions.
In high temperature and high humidity environments, exercise intensity can negatively impact the skeletal muscle deoxygenation response. On the other hand, low to moderate load training in a hypoxic environment can accelerate the skeletal muscle deoxygenation response. Therefore, coaches should take into account the specific characteristics of peripheral fatigue during training or competition in different environments and design appropriate training or competition programs accordingly. It is important to consider the limitations imposed by these environments and develop strategies to optimize performance and mitigate the negative effects of reduced oxygen availability and increased heat and humidity.
Data availability statement
The raw data supporting the conclusion of this article will be made available by the authors, without undue reservation.
Ethics statement
The studies involving humans were approved by the Shanghai Research Institute of Sports Science (Shanghai Anti-Doping Center) Research Ethics Committee. The studies were conducted in accordance with the local legislation and institutional requirements. The participants provided their written informed consent to participate in this study.
Author contributions
All authors of this study actively contributed to the design and development of the research. ZG took the lead in writing the manuscript, while JQ reviewed and edited the written content. All authors contributed to the article and approved the submitted version.
Funding
This study was supported by the Science and Technology Innovation Plan of Shanghai Science and Technology Commission (Project No. 22dz1204601).
Acknowledgments
We would like to express our gratitude to the Shanghai Science and Technology Commission (Project No. 22dz1204601) for providing funding for this project. Their support has been instrumental in the successful execution of our research. Additionally, we extend our heartfelt appreciation to all the members of the research team for their collaborative efforts and dedication. Their contributions have been invaluable in achieving the goals of this study.
Conflict of interest
The authors declare that the research was conducted in the absence of any commercial or financial relationships that could be construed as a potential conflict of interest.
Publisher’s note
All claims expressed in this article are solely those of the authors and do not necessarily represent those of their affiliated organizations, or those of the publisher, the editors and the reviewers. Any product that may be evaluated in this article, or claim that may be made by its manufacturer, is not guaranteed or endorsed by the publisher.
References
Alvares T. S., Oliveira G. V. D., Soares R., Murias J. M. (2020). Near-infrared spectroscopy-derived total haemoglobin as an indicator of changes in muscle blood flow during exercise-induced hyperaemia. J. sports Sci. 38, 751–758. doi:10.1080/02640414.2020.1733774
Amann M., Calbet J. (2008). Convective oxygen transport and fatigue. J. Appl. Physiology 104, 861–870. doi:10.1152/japplphysiol.01008.2007
Azevedo R. D., Je B. S., Inglis E. C., Iannetta D., Murias J. M. (2020a). Hypoxia equally reduces the respiratory compensation point and the NIRS-derived [HHb] breakpoint during a ramp-incremental test in young active males. Physiol. Rep. 8, e14478. doi:10.14814/phy2.14478
Azevedo R. D. A., BéJAR Saona J. E., Inglis E. C., Iannetta D., Murias J. M. (2020b). The effect of the fraction of inspired oxygen on the NIRS-derived deoxygenated hemoglobin “breakpoint” during ramp-incremental test. Am. J. Physiology-Regulatory, Integr. Comp. Physiol. 318, R399–R409. doi:10.1152/ajpregu.00291.2019
Beaver W. L., Wasserman K., Whipp B. J. (1986). A new method for detecting anaerobic threshold by gas exchange. J. Appl. Physiol. 60, 2020–2027. doi:10.1152/jappl.1986.60.6.2020
Benoit H., Busso T., Prieur F., Castells J., Freyssenet D., Lacour J. R., et al. (1997). Oxygen uptake during submaximal incremental and constant work load exercises in hypoxia. Int. J. sports Med. 18, 101–105. doi:10.1055/s-2007-972603
Boone J., Barstow T. J., Celie B., Prieur F., Bourgois J. (2015). The impact of pedal rate on muscle oxygenation, muscle activation and whole-body VO₂ during ramp exercise in healthy subjects. Eur. J. Appl. Physiol. 115, 57–70. doi:10.1007/s00421-014-2991-x
Boushel R., Langberg H., Olesen J., Gonzales-Alonzo J., Bülow J., Kjaer M. (2001). Monitoring tissue oxygen availability with near infrared spectroscopy (NIRS) in health and disease. Scand. J. Med. Sci. Sports 11, 213–222. doi:10.1034/j.1600-0838.2001.110404.x
Bowen T. S., Koga S., Amano T., Kondo N., Rossiter H. B. (2016). The spatial distribution of absolute skeletal muscle deoxygenation during ramp-incremental exercise is not influenced by hypoxia. Adv. Exp. Med. Biol. 876, 19–26. doi:10.1007/978-1-4939-3023-4_2
Calbet J. A., RåDEGRAN G., Boushel R., Saltin B. (2009). On the mechanisms that limit oxygen uptake during exercise in acute and chronic hypoxia: role of muscle mass. J. Physiol. 587, 477–490. doi:10.1113/jphysiol.2008.162271
Chance B., Dait M. T., Zhang C., Hamaoka T., Hagerman F. (1992). Recovery from exercise-induced desaturation in the quadriceps muscles of elite competitive rowers. Am. J. Physiology-Cell Physiol. 262, C766–C775. doi:10.1152/ajpcell.1992.262.3.C766
Cheuvront S. N., Kenefick R. W., Montain S. J., Sawka M. N. (2010). Mechanisms of aerobic performance impairment with heat stress and dehydration. J. Appl. Physiol. 109, 1989–1995. doi:10.1152/japplphysiol.00367.2010
Coast J., Rasmussen S., Krause K. M., O'Kroy J. A., Loy R. A., Rhodes J. (1993). Ventilatory work and oxygen consumption during exercise and hyperventilation. J. Appl. Physiol. 74, 793–798. doi:10.1152/jappl.1993.74.2.793
Crum E., O’Connor W., Van Loo L., Valckx M., Stannard S. R. (2017). Validity and reliability of the Moxy oxygen monitor during incremental cycling exercise. Eur. J. Sport Sci. 17, 1037–1043. doi:10.1080/17461391.2017.1330899
Dennis M. C., Goods P. S., Binnie M. J., Girard O., Wallman K. E., Dawson B., et al. (2023). Increased air temperature during repeated-sprint training in hypoxia amplifies changes in muscle oxygenation without decreasing cycling performance. Eur. J. Sport Sci. 23, 62–72. doi:10.1080/17461391.2021.2003868
Dimenna F. J., Bailey S. J., Jones A. M. (2010). Influence of body position on muscle deoxy [Hb+ Mb] during ramp cycle exercise. Respir. physiology Neurobiol. 173, 138–145. doi:10.1016/j.resp.2010.07.005
Engelen M., Porszasz J., Riley M., Wasserman K., Maehara K., Barstow T. J. (1996). Effects of hypoxic hypoxia on O2 uptake and heart rate kinetics during heavy exercise. J. Appl. Physiol. 81, 2500–2508. doi:10.1152/jappl.1996.81.6.2500
Gildea N., Rocha J., Mcdermott A., O'Shea D., Green S., Egaña M. (2019). Influence of type 2 diabetes on muscle deoxygenation during ramp incremental cycle exercise. Respir. Physiology Neurobiol. 269, 103258. doi:10.1016/j.resp.2019.103258
Girard O., Brocherie F., Morin J.-B., Millet G. P. (2016). Running mechanical alterations during repeated treadmill sprints in hot versus hypoxic environments. A pilot study. J. sports Sci. 34, 1190–1198. doi:10.1080/02640414.2015.1101482
GonzáLEZ-Alonso J., Calbet J. A. (2003). Reductions in systemic and skeletal muscle blood flow and oxygen delivery limit maximal aerobic capacity in humans. Circulation 107, 824–830. doi:10.1161/01.cir.0000049746.29175.3f
Grassi B., Pogliaghi S., Rampichini S., Quaresima V., Ferrari M., Marconi C., et al. (2003). Muscle oxygenation and pulmonary gas exchange kinetics during cycling exercise on-transitions in humans. J. Appl. Physiol. 95, 149–158. doi:10.1152/japplphysiol.00695.2002
Grassi B., Quaresima V. (2016). Near-infrared spectroscopy and skeletal muscle oxidative function in vivo in health and disease: a review from an exercise physiology perspective. J. Biomed. Opt. 21, 091313. doi:10.1117/1.JBO.21.9.091313
Iannetta D., Okushima D., Inglis E. C., Kondo N., Murias J. M., Koga S. (2018). Blood flow occlusion-related O2 extraction “reserve” is present in different muscles of the quadriceps but greater in deeper regions after ramp-incremental test. J. Appl. Physiol. 125, 313–319. doi:10.1152/japplphysiol.00154.2018
Inglis E. C., Iannetta D., Murias J. M. (2019). Evaluating the NIRS-derived microvascular O2 extraction “reserve” in groups varying in sex and training status using leg blood flow occlusions. Plos One 14, e0220192. doi:10.1371/journal.pone.0220192
José G. L.-A., Mora-Rodriguez R., Below P. R., Coyle E. F. (1997). Dehydration markedly impairs cardiovascular function in hyperthermic endurance athletes during exercise. J. Appl. Physiol. 82, 1229–1236. doi:10.1152/jappl.1997.82.4.1229
Jung W.-S., Kim S.-W., Park H.-Y., Kim J., Lim K. (2021). Effects of acute exposure to thermal stress on cardiorespiratory function, skeletal muscle oxygenation, and exercise performance in healthy males. Int. J. Environ. Res. Public Health 18, 7404. doi:10.3390/ijerph18147404
Koga S., Poole D. C., Ferreira L. F., Whipp B. J., Kondo N., Saitoh T., et al. (2007). Spatial heterogeneity of quadriceps muscle deoxygenation kinetics during cycle exercise. J. Appl. Physiol. 103, 2049–2056. doi:10.1152/japplphysiol.00627.2007
Koirala B., Concas A., Sun Y., Gladden L. B., Lai N. (2021). Blood volume versus deoxygenated NIRS signal: computational analysis of the effects muscle O2 delivery and blood volume on the NIRS signals. J. Appl. Physiol. 131, 1418–1431. doi:10.1152/japplphysiol.00105.2021
Lawler J. S., Powers S. K., Thompson D. (1988). Linear relationship between VO2max and VO2max decrement during exposure to acute hypoxia. J. Appl. Physiol. 64, 1486–1492. doi:10.1152/jappl.1988.64.4.1486
Linnarsson D., Karlsson J., Fagraeus L., Saltin B. (1974). Muscle metabolites and oxygen deficit with exercise in hypoxia and hyperoxia. J. Appl. Physiol. 36, 399–402. doi:10.1152/jappl.1974.36.4.399
Loeppky J., Salgado R., Sheard A., Kuethe D. O., Mermier C. M. (2020). Variations in exercise ventilation in hypoxia will affect oxygen uptake. Physiol. Int. 107, 431–443. doi:10.1556/2060.2020.00031
Lucero A. A., Addae G., Lawrence W., Neway B., Credeur D. P., Faulkner J., et al. (2018). Reliability of muscle blood flow and oxygen consumption response from exercise using near-infrared spectroscopy. Exp. Physiol. 103, 90–100. doi:10.1113/EP086537
Murias J. M., Spencer M. D., Keir D. A., Paterson D. H. (2013). Systemic and vastus lateralis muscle blood flow and O2 extraction during ramp incremental cycle exercise. Am. J. Physiology-Regulatory, Integr. Comp. Physiol. 304, R720–R725. doi:10.1152/ajpregu.00016.2013
Murias J. M., Spencer M. D., Paterson D. H. (2014). The critical role of O2 provision in the dynamic adjustment of oxidative phosphorylation. Exerc. Sport Sci. Rev. 42, 4–11. doi:10.1249/JES.0000000000000005
Nybo L., Jensen T., Nielsen B., González-Alonso J. (2001). Effects of marked hyperthermia with and without dehydration onV o 2 kinetics during intense exercise. J. Appl. Physiol. 90, 1057–1064. doi:10.1152/jappl.2001.90.3.1057
Osawa T., Arimitsu T., Takahashi H. (2017). Hypoxia affects tissue oxygenation differently in the thigh and calf muscles during incremental running. Eur. J. Appl. Physiol. 117, 2057–2064. doi:10.1007/s00421-017-3696-8
Osawa T., Kime R., Hamaoka T., Katsumura T., Yamamoto M. (2011). Attenuation of muscle deoxygenation precedes EMG threshold in normoxia and hypoxia. Med. Sci. Sports Exerc. 43, 1406–1413. doi:10.1249/MSS.0b013e3182100261
PéRIARD J. D., Thompson M. W., Caillaud C., Quaresima V. (2013). Influence of heat stress and exercise intensity on vastus lateralis muscle and prefrontal cortex oxygenation. Eur. J. Appl. Physiol. 113, 211–222. doi:10.1007/s00421-012-2427-4
Racinais S., Cocking S., PéRIARD J. D. (2017). Sports and environmental temperature: from warming-up to heating-up. Temperature 4, 227–257. doi:10.1080/23328940.2017.1356427
Rowell L. B., Marx H. J., Bruce R. A., Conn R. D., Kusumi F. (1966). Reductions in cardiac output, central blood volume, and stroke volume with thermal stress in normal men during exercise. J. Clin. Investigation 45, 1801–1816. doi:10.1172/JCI105484
Saitoh T., Ooue A., Kondo N., Niizeki K., Koga S. (2010). Active muscle oxygenation dynamics measured during high-intensity exercise by using two near-infrared spectroscopy methods. Adv. Exp. Med. Biol. 662, 225–230. doi:10.1007/978-1-4419-1241-1_32
Sawka M. N., Leon L. R., Montain S. J., Sonna L. A. (2011). Integrated physiological mechanisms of exercise performance, adaptation, and maladaptation to heat stress. Compr. Physiol. 1, 1883–1928. doi:10.1002/cphy.c100082
Sawka M. N., Young A. J., Cadarette B. S., Levine L., Pandolf K. B. (1985). Influence of heat stress and acclimation on maximal aerobic power. Eur. J. Appl. physiology Occup. Physiol. 53, 294–298. doi:10.1007/BF00422841
Seiyama A., Hazeki O., Tamura M. (1988). Noninvasive quantitative analysis of blood oxygenation in rat skeletal muscle. J. Biochem. 103, 419–424. doi:10.1093/oxfordjournals.jbchem.a122285
Spencer M. D., Murias J. M., Paterson D. H. (2012). Characterizing the profile of muscle deoxygenation during ramp incremental exercise in young men. Eur. J. Appl. Physiol. 112, 3349–3360. doi:10.1007/s00421-012-2323-y
Spires J., Lai N., Zhou H., Saidel G. M. (2011). Hemoglobin and myoglobin contributions to skeletal muscle oxygenation in response to exercise. Adv. Exp. Med. Biol. 701, 347–352. doi:10.1007/978-1-4419-7756-4_47
Subudhi A. W., Dimmen A. C., Roach R. C. (2007). Effects of acute hypoxia on cerebral and muscle oxygenation during incremental exercise. J. Appl. Physiol. 103, 177–183. doi:10.1152/japplphysiol.01460.2006
Tatterson A. J., Hahn A. G., Martini D. T., Febbraio M. A. (2000). Effects of heat stress on physiological responses and exercise performance in elite cyclists. J. Sci. Med. Sport 3, 186–193. doi:10.1016/s1440-2440(00)80080-8
Tew G. A., Ruddock A. D., Saxton J. M. (2010). Skin blood flow differentially affects near-infrared spectroscopy-derived measures of muscle oxygen saturation and blood volume at rest and during dynamic leg exercise. Eur. J. Appl. physiology 110, 1083–1089. doi:10.1007/s00421-010-1596-2
Twomey R., Wrightson J., Fletcher H., Avraam S., Ross E., Dekerle J. (2017). Exercise-induced fatigue in severe hypoxia after an intermittent hypoxic protocol. Med. Sci. Sports Exerc. 49, 2422–2432. doi:10.1249/mss.0000000000001371
Vieth E. (1989). Fitting piecewise linear regression functions to biological responses. J. Appl. Physiol. 67, 390–396. doi:10.1152/jappl.1989.67.1.390
Wagner P. D., Gale G. E., Moon R. E., Torre-Bueno J. R., Stolp B. W., Saltzman H. A. (1986). Pulmonary gas exchange in humans exercising at sea level and simulated altitude. J. Appl. Physiol. 61, 260–270. doi:10.1152/jappl.1986.61.1.260
Webb K. L., Dominelli P. B., Baker S. E., Klassen S. A., Joyner M. J., Senefeld J. W., et al. (2022). Influence of high hemoglobin-oxygen affinity on humans during hypoxia. Front. Physiol. 12, 763933. doi:10.3389/fphys.2021.763933
Whipp B. J., Davis J. A., Wasserman K. (1989). Ventilatory control of the ‘isocapnic buffering’region in rapidly-incremental exercise. Respir. Physiol. 76, 357–367. doi:10.1016/0034-5687(89)90076-5
Wingo J. E., Stone T., Ng J. (2020). Cardiovascular drift and maximal oxygen uptake during running and cycling in the heat. Med. Sci. Sports Exerc. 52, 1924–1932. doi:10.1249/MSS.0000000000002324
Yamaguchi K., Sumi D., Hayashi N., Ienaga K., Goto K. (2021). Effects of combined hot and hypoxic conditions on muscle blood flow and muscle oxygenation during repeated cycling sprints. Eur. J. Appl. Physiol. 121, 2869–2878. doi:10.1007/s00421-021-04738-w
Zerbini L., Spencer M. D., Grey T. M., Murias J. M., Kowalchuk J. M., Schena F., et al. (2013). Effect of acute hypoxia on muscle blood flow, VO₂p, and [HHb] kinetics during leg extension exercise in older men. Eur. J. Appl. Physiol. 113, 1685–1694. doi:10.1007/s00421-013-2599-6
Zhang Z., Wang B., Gong H., Xu G., Nioka S., Chance B. (2010). Comparisons of muscle oxygenation changes between arm and leg muscles during incremental rowing exercise with near-infrared spectroscopy. J. Biomed. Opt. 15, 017007. doi:10.1117/1.3309741
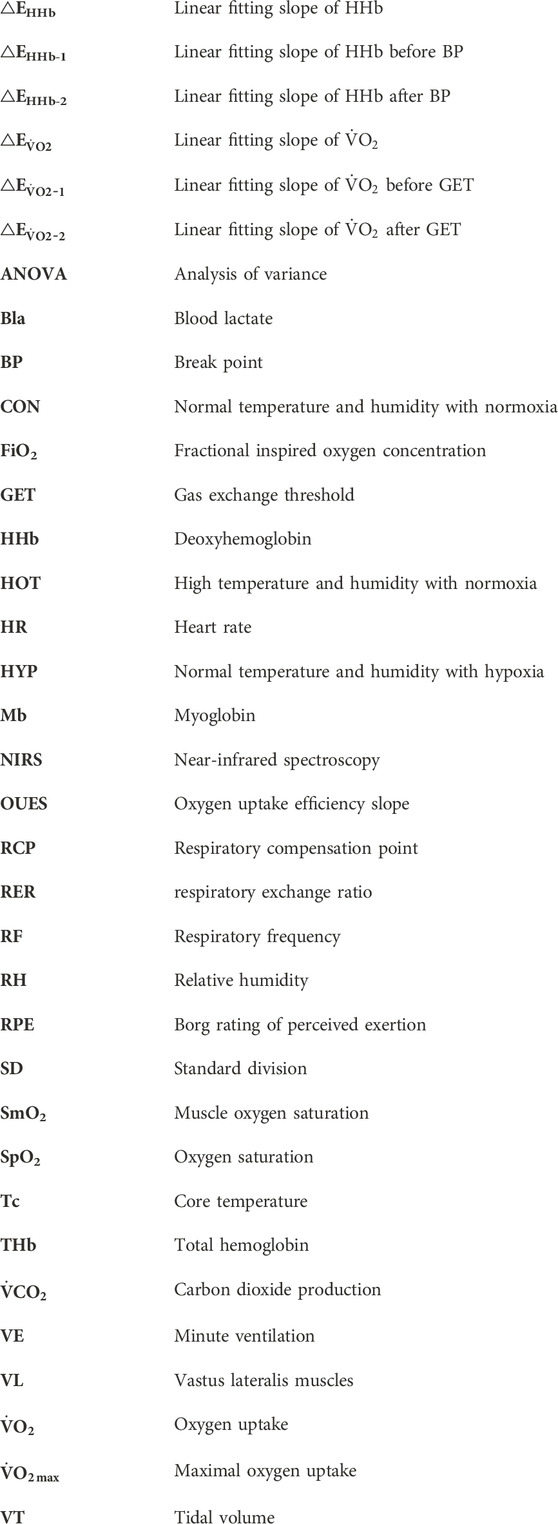
Glossary
Keywords: high temperature and humidity environment, hypoxic environment, incremental exhaustive exercise, deoxyhemoglobin dynamics, oxygen uptake dynamics
Citation: Geng Z, Wang J, Cao G, Tan C, Li L and Qiu J (2024) Differential impact of heat and hypoxia on dynamic oxygen uptake and deoxyhemoglobin parameters during incremental exhaustive exercise. Front. Physiol. 14:1247659. doi: 10.3389/fphys.2023.1247659
Received: 26 June 2023; Accepted: 13 December 2023;
Published: 08 January 2024.
Edited by:
Erich Hohenauer, University of Applied Sciences and Arts of Southern Switzerland, SwitzerlandReviewed by:
Gregory P. Barton, University of Texas Southwestern Medical Center, United StatesWillem J. Van Der Laarse, Independent Researcher, Amsterdam, Netherlands
Copyright © 2024 Geng, Wang, Cao, Tan, Li and Qiu. This is an open-access article distributed under the terms of the Creative Commons Attribution License (CC BY). The use, distribution or reproduction in other forums is permitted, provided the original author(s) and the copyright owner(s) are credited and that the original publication in this journal is cited, in accordance with accepted academic practice. No use, distribution or reproduction is permitted which does not comply with these terms.
*Correspondence: Jun Qiu, cWl1anVuZ0Bob3RtYWlsLmNvbQ==
 Zhizhong Geng
 Jinhao Wang2
 Guohuan Cao
 Chenhao Tan
 Jun Qiu