
95% of researchers rate our articles as excellent or good
Learn more about the work of our research integrity team to safeguard the quality of each article we publish.
Find out more
ORIGINAL RESEARCH article
Front. Physiol. , 06 October 2023
Sec. Medical Physics and Imaging
Volume 14 - 2023 | https://doi.org/10.3389/fphys.2023.1231793
This article is part of the Research Topic Measuring Resting Cerebral Perfusion using Magnetic Resonance Imaging (MRI) View all 14 articles
 Linh N. N. Le1*
 Gregory J. Wheeler1
 Emily N. Holy2
 Corinne A. Donnay2
 Nicholas P. Blockley3
 Alan H. Yee2
 Kwan L. Ng2
 Audrey P. Fan1,2
Introduction: We aimed to demonstrate non-invasive measurements of regional oxygen extraction fraction (OEF) from quantitative BOLD MRI modeling at baseline and after pharmacological vasodilation. We hypothesized that OEF decreases in response to vasodilation with acetazolamide (ACZ) in healthy conditions, reflecting compensation in regions with increased cerebral blood flow (CBF), while cerebral metabolic rate of oxygen (CMRO2) remained unchanged. We also aimed to assess the relationship between OEF and perfusion in the default mode network (DMN) regions that have shown associations with vascular risk factors and cerebrovascular reactivity in different neurological conditions.
Material and methods: Eight healthy subjects (47 ± 13 years, 6 female) were scanned on a 3 T scanner with a 32-channel head coil before and after administration of 15 mg/kg ACZ as a pharmacological vasodilator. The MR imaging acquisition protocols included: 1) A Gradient Echo Slice Excitation Profile Imaging Asymmetric Spin Echo scan to quantify OEF, deoxygenated blood volume, and reversible transverse relaxation rate (R2’) and 2) a multi-post labeling delay arterial spin labeling scan to measure CBF. To assess changes in each parameter due to vasodilation, two-way t-tests were performed for all pairs (baseline versus vasodilation) in the DMN brain regions with Bonferroni correction for multiple comparisons. The relationships between CBF versus OEF and CBF versus R2’ were analyzed and compared across DMN regions using linear, mixed-effect models.
Results: During vasodilation, CBF significantly increased in the medial frontal cortex (
Conclusion: Quantitative BOLD modeling can reliably measure OEF across multiple physiological conditions and captures vascular changes with higher sensitivity than R2’ values. The inverse correlation between OEF and CBF across regions in DMN, suggests that these two measurements, in response to ACZ vasodilation, are reliable indicators of tissue health in this healthy cohort.
The brain has a high metabolic demand for oxygen compared to other organs since the human brain comprises just 2% of the total body mass but consumes 20% of available oxygen for normal function (Rolfe and Brown, 1997), so regulation of cerebral blood flow (CBF) and oxygen delivery is critically important. Oxygen extraction fraction (OEF) is a key hemodynamic parameter to measure the brain’s energy metabolism and is altered in aging and disease processes, including cerebrovascular disorders (Watchmaker et al., 2018; Fan et al., 2022; Liu et al., 2023), neurodegeneration (Jiang et al., 2020; Robb et al., 2022), and neuroinflammation (Cleland et al., 2021). In some pathological mechanisms, OEF is reduced concurrently with hypoperfusion due to decreased neural activity and lower oxygen metabolic demand (Ishii et al., 1996; Brown and Thore, 2011); while in other distinct mechanisms, OEF is elevated in areas of hypoperfusion, indicating physiological compensation in tissue that is at ischemic risk (Gupta et al., 2014; Fan et al., 2020; Lin et al., 2022). Therefore, it is important to measure OEF in tandem with CBF to understand overall oxygen consumption and brain tissue health.
In addition to resting state, imaging brain hemodynamics in varying physiological conditions, such as those created by controlled vasoactive stimuli, adds valuable information about cerebrovascular reactivity (CVR) and brain vascular health. These cerebrovascular “stress tests” monitor the CVR, or the brain’s hemodynamic response to hypercapnic gas paradigms or to pharmacological vasodilation, e.g., with acetazolamide (ACZ) (Handwerker et al., 2007). CVR measurements reveal unique pathophysiological changes in intracranial stenosis (Lattanzi et al., 2018) and in aging that correlate with cognitive status (Silvestrini et al., 2006; Kim et al., 2021). During these vasoactive challenges, brain hemodynamics are typically monitored with the blood-oxygenation-level-dependent (BOLD) MRI signal due to its fast acquisition and ease of use; however, BOLD signal changes reflect multiple neuronal and vascular contributions and cannot be interpreted in the context of a specific hemodynamic parameter. Other investigations have used arterial spin labeling (ASL) MRI to directly assess the perfusion reactivity deficits in steno-occlusive disease and validate the BOLD response in the same patients (Mandell et al., 2008; Smeeing et al., 2016), highlighting ASL as a robust biomarker to quantify CBF in different physiological states and disease. Acetazolamide has been commonly used to assess the vasodilatory capacity of circulation because ACZ is more easily administered through intravenous or oral means than carbon dioxide, which requires a gas delivery system. In patients with major cerebral arterial occlusive diseases, ACZ also identified reduced reactivity in the hemisphere with the occlusive lesion even in patients who appeared to have preserved CO2 reactivity (Kazumata et al., 1996). However, few studies have directly assessed OEF changes during vasoactive stimuli, largely because of a lack of non-invasive imaging approaches. [15O]-PET scans have measured CBF changes in response to ACZ vasodilation in patients with cerebrovascular stenoses and showed a non-linear association between this perfusion reactivity and baseline OEF PET for various ischemic disease stages (Imaizumi et al., 2004; Nemoto et al., 2004; Yamauchi et al., 2004; Hokari et al., 2008). Unfortunately, these OEF PET measures are not easily available in different physiological states due to the complexity of the experiments and the need to administer multiple short-lived radiotracers for each condition. MRI-based OEF measures have recently been tested with ACZ administration and showed expected global OEF reductions after vasodilation using multiple T2 relaxation-based measures (Baas et al., 2022). Venous blood oxygenation (Yv), which can be derived from venous blood T2 relaxation values in the sagittal sinus, combined with global cerebral metabolic rate of oxygen, has shown poorer oxygen utilization in patients with sickle cell disease compared to controls after vasodilation (Václavů et al., 2020), albeit with some bias between various T2-based MRI methods. Decreased OEF after ACZ vasodilation has also been demonstrated using 3-dimensional quantitative susceptibility mapping MRI (Buch et al., 2017). However, these values were averaged from larger, resolvable internal cerebral veins, thus limiting regional information on OEF response across the brain.
As an alternative to global OEF measurements using T2 relaxation-based approach, quantitative blood-oxygenation-level-dependent (qBOLD) is a non-invasive MRI approach that models the temporal signal due to reversible transverse relaxation rate (R2’) to non-invasively extract OEF and deoxygenated blood volume (DBV) (Yablonskiy and Haacke, 1994). This method allows for voxelwise estimation of tissue OEF from asymmetric spin echo (ASE) scans, which can be useful in identifying areas of the brain that may be at risk for ischemia in stroke (Stone et al., 2019) or sickle cell disease (Guilliams et al., 2018; Wang et al., 2021). These clinical studies used qBOLD to identify regional, individualized pathophysiology in different ischemic tissue types (core, infarct growth, and contralateral tissue) in acute stroke. On the other hand, in patients with sickle cell anemia, abnormal OEF elevations were observed specifically in the deep white matter, consistent with microstructural damage, that were reduced post-blood transfusion. Additionally, OEF activation has been reported to decrease in brain areas relating to motor task execution (Yin et al., 2018), especially under hypoxic conditions (Yin et al., 2021). In aging, studies have identified CVR reductions in brain regions that overlap with the default mode network (DMN), which is related to underlying vascular risk factors and suggests CVR in the DMN-CVR to be an important marker for brain health (Haight et al., 2015). Additional investigation of the reliability of qBOLD MRI in sensitive brain areas, including the DMN, across physiological states is thus critical to advance regional OEF as an informative biomarker in cerebrovascular disease and aging.
This study aimed to demonstrate a quantitative BOLD modeling MRI method for measuring OEF values in healthy participants during a physiological perturbation with ACZ. Previous studies have shown that OEF decreases in response to an increase in CBF from various vasodilating challenges, while CMRO2 remains unaffected using different techniques (Kety and Schmidt, 1948; Vorstrup et al., 1984; Václavů et al., 2020; Vestergaard et al., 2023). We aimed to demonstrate this method by showing that OEF measured with qBOLD MRI is directly related to regional alterations in CBF. A secondary aim was to compare regional OEF with R2’ values in detecting an alteration with vasodilation and their correlation with perfusion. Furthermore, we focused on assessing the OEF relationship to perfusion in the DMN due to its functional associations with vascular risk factors (Tchistiakova et al., 2015) and cerebrovascular reactivity in cognitive impairment (Richiardi et al., 2015) to identify which DMN regions show the most significant OEF effect with vasodilation.
Eight healthy subjects (47 ± 13 years, 6 female) were recruited and gave written informed consent to participate in the study. Participants must be at least 18 years old to participate in this study. Exclusion criteria included pregnancy, anemia, history of renal disease, hypertension, diabetes, stroke, or other known neurological diseases. Subjects with peripheral vasculopathy or Raynaud’s disease that precludes IV administration and a history of allergy to sulfa drugs were excluded. In addition, participants that could not receive MRI due to the inability to lie motionless in the scanner, pacemakers, aneurysm clips, neurostimulators, artificial heart valves, metal objects in eyes, ear implants, and claustrophobia were excluded. This study was performed with approval from the Institutional Review Board at the University of California, Davis.
After baseline MRI scanning, all participants were given a slow administration dosage of 15 mg/kg ACZ as a pharmacological vasodilator over 2 min. After at least 15 min of uptake time to capture the full effect of pharmacological vasodilation, the participant received repeated scans in the post-ACZ state.
Each participant underwent scanning on a 3-T MRI scanner (Siemens MAGNETOM Tim Trio, Erlangen, Germany) with a 32-channel phase array head coil. T1-weighted anatomic images were acquired using a multi-echo magnetization-prepared rapid gradient echo (MEMPRAGE) sequence before vasodilation. These sagittal scans were acquired with repetition time (TR) = 2530 ms; echo times (TE) = 1.64, 3.5, 5.36, and 7.22 ms; inversion time (TI) = 1,200 ms; spatial resolution = 1.0 mm3 × 1.0 mm3 × 1.0 mm3; in-plane matrix = 256 × 256; 176 slices with thickness = 1.0 mm; flip angle = 7.0°; and acquisition time of 6 min and 2 s.
For OEF measurements, the Gradient Echo Slice Excitation Profile Imaging (GESEPI) ASE images were acquired with an echo planar imaging (EPI) readout with specialized z-shim gradients mitigating through-slice inhomogeneities (Blockley and Stone, 2016). Scan parameters included TR = 3,000 ms; TE = 56 ms; slice thickness = 1.25 mm; resolution = 2.3 mm3 × 2.3 mm3 × 1.25 mm3; flip angle = 90°; bandwidth = 2,004 Hz/Pixel; matrix size = 96 × 96 with 80 slices; field of view (FOV) = 224 mm with 7 values of the spin echo displacement time (τ) from 16 to 40 ms in the step of 4 ms. A total of 20 slabs were acquired, and each slab was constructed by averaging four 1.25-mm slices to correct for macroscopic field gradients with 100% partition oversampling (total 8 k-space partitions). The total acquisition time of the main ASE sequence was 2 min and 54 s to cover the whole brain with 80 slices. A separate spin-echo ASE scan (τ = 0) was collected with the same scan parameters as described, with an acquisition time of 24 s.
To generate quantitative CBF maps, we performed multi post-labeling-delay (PLD) 3D pseudo-continuous ASL (pcASL) MRI. The parameters were five different PLDs (0.9 s, 1.2 s, 1.4 s, 1.8 s, and 2.1 s) and effective labeling durations = 2 s; TR/TE = 4,700 ms/14 ms; slice thickness = 4 mm; spatial resolution = 3.4 mm3 × 3.4 mm3 × 4.0 mm3; FOV = 220 mm (Li et al., 2015). Multi-band EPI readout was used with slice-acceleration factor of 6, FOV shift factor of 3, and EPI factor of 64. Including calibration scans with similar imaging parameters but no labeling to estimate longitudinal magnetization (M0), the total acquisition time was approximately 6 min. The ASE and pcASL scans were acquired twice—once at baseline and once after vasodilation.
Prior to qBOLD modeling, ASE data were preprocessed first with motion correction of all echoes to the spin echo volume using MCFLIRT (Jenkinson et al., 2002). Next, the spin echo image was brain extracted using BET (Smith, 2002) to create a binary mask of the brain tissue, which was applied to all ASE R2’-weighted images. ASE data were finally smoothed with a Gaussian kernel (σ = 4 mm) in FSL (Jenkinson et al., 2012) to reduce the effect of noisy voxels. The empirical tradeoff between spatial resolution and noise reduction is shown in Supplementary Figure S4.
For pcASL data, images from all five PLDs were merged and underwent the same preprocessing steps as the ASE data. First, motion correction was applied with reference to the first pcASL image, followed by smoothing with a Gaussian kernel of 1.5 mm. Then, the M0 image was brain extracted using BET to create the binary mask of the brain tissue, which was used for registration.
Quantitative measurements of the BOLD signal were used to non-invasively map hemodynamic parameters relating to brain metabolism and function. The quantitative BOLD (qBOLD) model (Yablonskiy and Haacke, 1994) measures oxygen extraction fraction from the measured reversible transverse relaxation rate, R2’ (where R2’ = R2*–R2). A complete qBOLD model with R2’-weighted measurements can be achieved using asymmetric spin echoes (An and Lin, 2003), such as the GESEPI-ASE pulse sequence described above. qBOLD modeling was performed with two compartments (tissue and blood), as this approach provides reliable estimates of OEF with a full range of echoes for fitting, including those before the spin echo (Cherukara et al., 2019).
The objective of qBOLD modeling is to separate OEF and DBV effects from the ASE signal and generate a brain map of OEF. The (1) tissue signal, (Yablonskiy and Haacke, 1994),
where
where C(
The total signal calculated from a voxel in this two-compartment tissue model is the sum of the signal from each compartment:
After fitting the two-compartment tissue qBOLD model, R2’ and DBV were estimated. Then, OEF was determined by the relationship between R2’ and DBV with known constants:
where Hct is the patient’s fractional hematocrit, Δχ0 is the magnetic susceptibility difference between oxygenated and deoxygenated red blood cells, B0 is the magnetic field, γ is proton gyromagnetic ratio.
R2’-weighting was acquired by shifting the spin echo refocusing pulse for 7 values of the spin echo displacement time, τ, in the step of 4 ms from 16 ms to 40 ms. The spin echo (τ = 0 ms) was collected in separate scan. Hct was assumed at 0.40 (Nicoll et al., 2012). Other physiological parameters were also set as constant values as follows:
Fitting the acquired ASE signals to the two-compartment tissue model allows us to separate OEF (our parameter of interest) and DBV per voxel. To fit our ASE signal data, we used a Bayesian framework that estimates R2’ and DBV, which have shown to be more separable parameters with a suitable posterior distribution for the estimation (Cherukara et al., 2019). Given the total signal
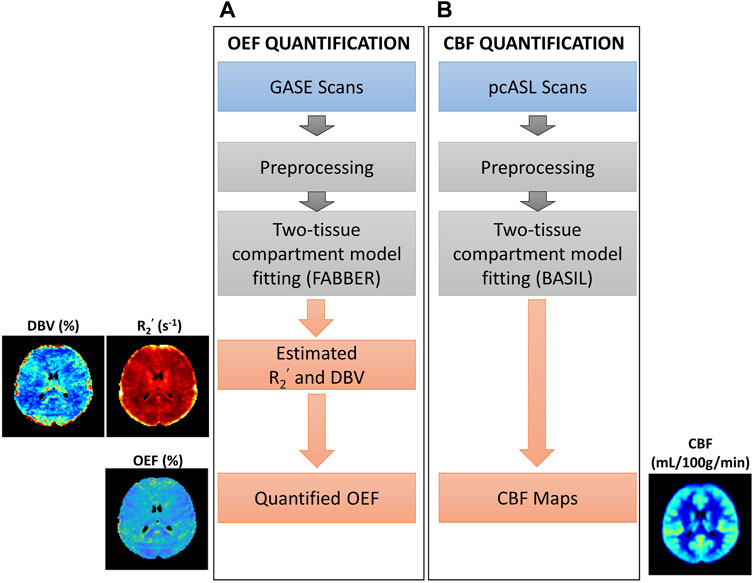
FIGURE 1. Overview of procedures for parameter quantification. (A) Oxygen extraction fraction (OEF) quantification using GASE scans was achieved through fitting with two-tissue compartment qBOLD model in FABBER (Woolrich et al., 2006; Chappell et al., 2009; Groves et al., 2009). (B) Cerebral blood flow (CBF) quantification using pseudo-continuous ASL (pcASL) scans fitted with two-tissue compartment model in BASIL (Chappell et al., 2009; Chappell et al., 2010). This pipeline was repeated before and after acetazolamide injection.
The relationship between CMRO2 (μmol/100 g/min) and OEF (%) (Kety and Schmidt, 1948) can be expressed as
Where CBF is the cerebral blood flow (mL/100 g/min), and
The complete procedure to measure cerebral blood flow is shown in Figure 1B. We used the Bayesian Inference for Arterial Spin Labeling MRI (BASIL) toolkit (Chappell et al., 2009) implemented in FSL (version 6.0.5, Oxford, United Kingdom) for analyzing ASL data and quantifying perfusion maps. This approach allows fitting a two-compartment model to separate macrovascular and tissue information in ASL signal to quantify CBF maps (Groves et al., 2009; Chappell et al., 2010).
The two-compartment model assumed that the walls of arterial vessels do not allow any substance to pass through them, and that blood in the arteries moves through the voxel immediately. The total signal from any voxel is the sum of both tissue and intravascular components. CBF maps underwent a voxelwise calibration method using the measured M0 maps (Pinto et al., 2020). Fix label duration was applied, and initial parameter values were assumed as following: initial arterial transit time (ATT) = 1.3 s; T1 values for tissue (T1t) = 1.3 s (based on 3 T field strength); T1 values for blood (T1b) = 1.65 s; brain/blood partition coefficient (λ) = 0.9 mL/g; and labeling efficiency (α) = 0.85 (Alsop et al., 2015). Analyses to compute CBF maps were done in native ASL space.
To assess the regional relationship between hemodynamic parameters, especially OEF and perfusion across subjects, all quantitative maps were registered to Montreal Neurological Institute (MNI) space (Collins et al., 1999; Fonov et al., 2009; Fonov et al., 2011). For hemodynamics parameter maps, including OEF, DBV, and R2’, the spin echo image from the ASE scans was linearly co-registered, with FMRIB’s Linear Image Registration Tool (FLIRT) (Jenkinson and Smith, 2001; Jenkinson et al., 2002; Greve and Fischl, 2009), to subject-specific T1-structural space and then non-linearly co-registered, with FMRIB’s Non-linear Image Registration Tool (FNIRT) (Andersson et al., 2010), to MNI space. All parameter maps were then warped to MNI space with combined transformation parameters from those two registrations. To register CBF maps to MNI space, we first performed linear registration (FLIRT) of proton density (M0) images to T1 images; then, all CBF maps were transformed into MNI space using non-linear co-registration as described above.
Before assessing parameters of interest (CBF, OEF, and R2’) across brain regions and calculating the average for each ROI, we excluded voxels with unphysiological extreme values. Voxels with OEF values greater than 100%, and with estimated R2’ greater than 20 s−1 were excluded from analysis. The thresholds were set consistently to prior relevant studies (Stone and Blockley, 2017; Cherukara et al., 2019). For group average parameter maps across all participants, we calculated the mean only for MNI voxels having at least 50% of the population (i.e., at least 4 subjects) within physiological values. Intermediate processing steps, including subject masks in MNI space, are shown in Supplementary Material, Supplementary Figure S1 (for OEF), Supplementary Figure S2 (for DBV), and Supplementary Figure S3 (for R2’).
In MNI space, the Harvard-Oxford cortical atlas (Frazier et al., 2005; Desikan et al., 2006; Makris et al., 2006; Goldstein et al., 2007) was used to delineate nine brain regions of interest (ROIs) within the DMN. Regions within the DMN included the posterior cingulate gyrus (pCG), precuneus (PCun), anterior cingulate gyrus (aCG), angular gyrus (AG), supramarginal gyrus (SG) (including in inferior parietal lobe), and medial frontal gyrus (MFG) (Broyd et al., 2009). As a reference for comparison for this study, we chose other cortical brain regions, including the occipital pole (OP), inferior temporal gyrus (ITG), and middle temporal gyrus (MTG), to represent non-DMN regions.
All statistical analyses were performed using MATLAB R2021a (MathWorks, Natick, MA, 2016). Differences between before and after vasodilation were assessed using a pairwise two-way t-test with Bonferroni correction for nine ROIs. A p-value of less than 0.006 (where
To evaluate the relationship of OEF and CBF across regions during vasodilation, a linear mixed-effects model was conducted using OEF as the dependent variable and CBF as the independent variable, with subject and region as random effects. We also investigated the correlation of R2’ and CBF across regions during vasodilation, using a separate linear mixed-effects model with R2’ as the dependent variable and CBF as the independent variable. For both models, subjects and regions were used as random effects to adjust for inherent physiological variations across individuals and regions. Each mixed model was fit separately using the MATLAB software package “fitlme” (Pinheiro and Bates, 1996). A p-value of less than 0.05 was considered statistically significant.
All eight healthy participants received MRI scans consisting of the GESEPI-ASE sequence for quantitative BOLD modeling to estimate hemodynamic parameters, including R2’, DBV, and OEF (our parameter of interest). After excluding unphysiological voxels, group average maps of each parameter before and after vasodilation are shown in Figure 2. Excluded voxels were primarily located in frontal brain areas prone to air-tissue bulk magnetic susceptibility effects. The percentage of voxels removed due to thresholding in the two conditions is shown in Supplementary Table S1 (Pre-ACZ: DBV = 0.21%, R2’ = 2.05%, OEF = 13.1%; Post-ACZ: DBV = 0.16%, R2’ = 1.84%, OEF = 10.93%. We focused on parameters that are sensitive to brain oxygenation (OEF and R2’) and perfusion; the corresponding DBV maps are shown in Figure 2.
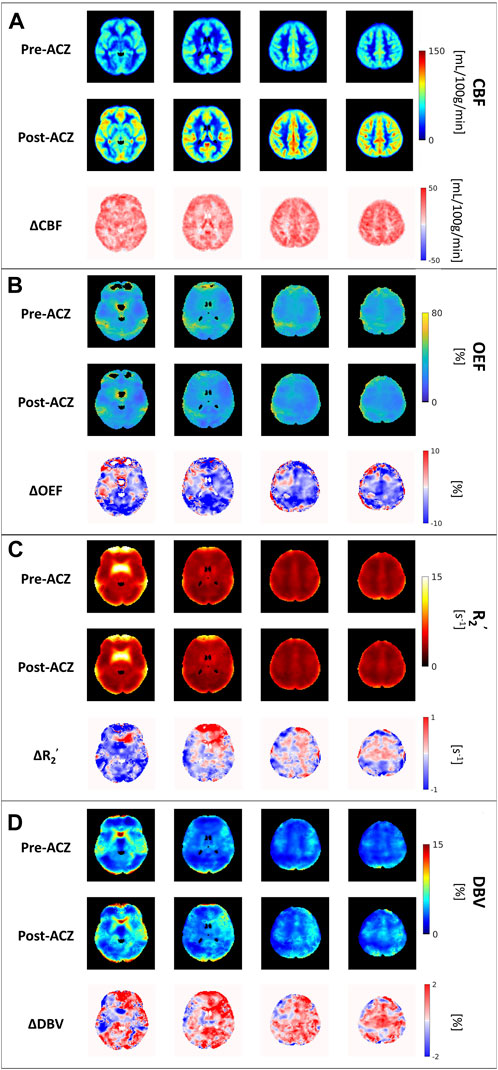
FIGURE 2. The group average of (A) cerebral blood flow (CBF) maps (in mL/100 g/min), (B) oxygen extraction fraction (OEF) maps (in %), (C) transverse relaxation rate (R2’) (in s−1) and (D) deoxygenated blood volume (DBV) across all eight healthy subjects before (Pre-ACZ) and after (Post-ACZ) vasodilation with the corresponding absolute difference maps between two conditions for each parameter (ΔCBF, ΔOEF, ΔR2’, and ΔDBV). All maps were registered to Montreal Neurological Institute (MNI) space.
Compared to the baseline condition, increased CBF and decreased OEF were observed across multiple areas in the brain at the group average level (Figures 2A, B). We also observed a decreasing trend in R2’ (Figure 2C) and an increasing trend in DBV (Figure 2D) during vasodilation. Mean parameter values, including CBF, OEF, R2’, DBV and CMRO2 for all subjects across selected regions for each condition are presented in Table 1. Additionally, the distribution of changes in OEF, R2’, DBV and CBF in response to ACZ for each selected region were plotted in Figure 3.
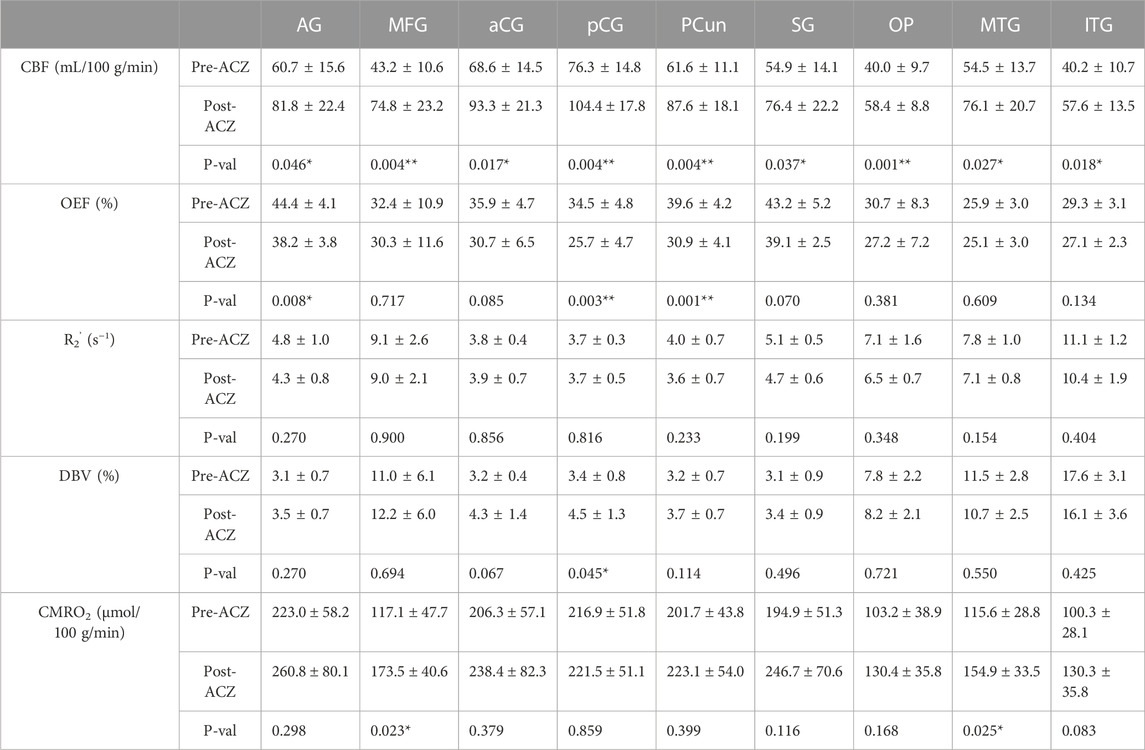
TABLE 1. Average cerebral blood flow (CBF) (in mL/100 g/min), oxygen extraction fraction (OEF) (in %), transverse relaxation rate (R2’) (in s−1), deoxygenated blood volume (DBV) (in %) and cerebral metabolic rate of oxygen (CMRO2) (in μmol/100 g/min) before (Pre) and after (Post) vasodilation across all healthy subjects (mean ± std) in different regions of interest (ROIs): angular gyrus (AG), medial frontal gyrus (MFG), anterior cingulate gyrus (aCG), posterior cingulate gyrus (pCG), precuneus (PCun), occipital pole (OP), supramarginal gyrus (SG), middle temporal gyrus (MTG), and inferior temporal gyrus (ITG). All tests were performed using a two-sided paired t-test with Bonferroni correction. (*p < 0.05, significant raw p-value; **p < 0.006, significant p-value after correction).
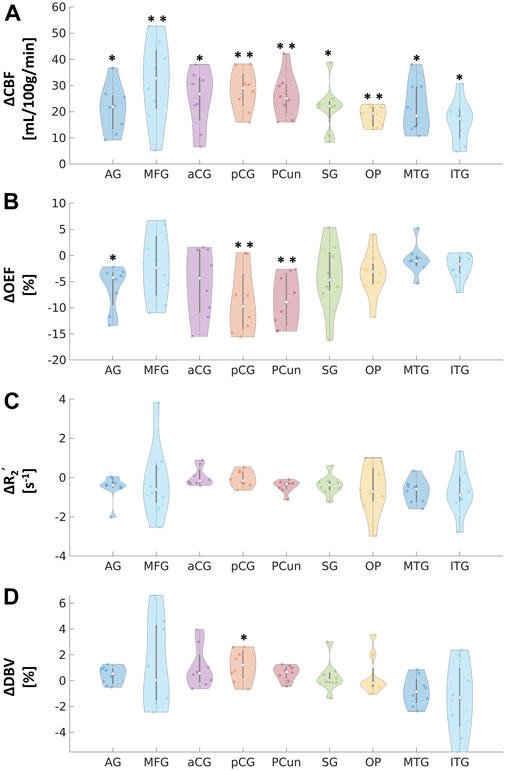
FIGURE 3. Absolute changes in (A) cerebral blood flow (CBF) in mL/100 g/min, (B) oxygen extraction fraction (OEF) in %, (C) transverse relaxation rate (R2’) in s−1, and (D) deoxygenated blood volume (DBV) in % in response to acetazolamide (ACZ) in different regions of interest (ROIs): angular gyrus (AG), medial frontal gyrus (MFG), anterior cingulate gyrus (aCG), posterior cingulate gyrus (pCG), precuneus (Pcun), occipital pole (OP), supramarginal gyrus (SG), middle temporal gyrus (MTG), and inferior temporal gyrus (ITG). All tests were performed using pairwise two-way t-tests between pre- and post-vasodilation with Bonferroni correction. (*p < 0.05, significant raw p-value; **p < 0.006, significant p-value after correction).
Paired two-way t-test with Bonferroni correction showed statistically significant differences in CBF and OEF estimates in selected regions during vasodilation (i.e., Pre-ACZ versus Post-ACZ), as presented in Table 1. With the injection of ACZ, CBF increased across all chosen regions before correction for multiple comparisons. After correction, elevated CBF remained significant in MFG (
The CBF response to ACZ showed a significant negative linear relationship to OEF value at baseline and after vasodilation using a mixed-linear effects model with subject clustering (
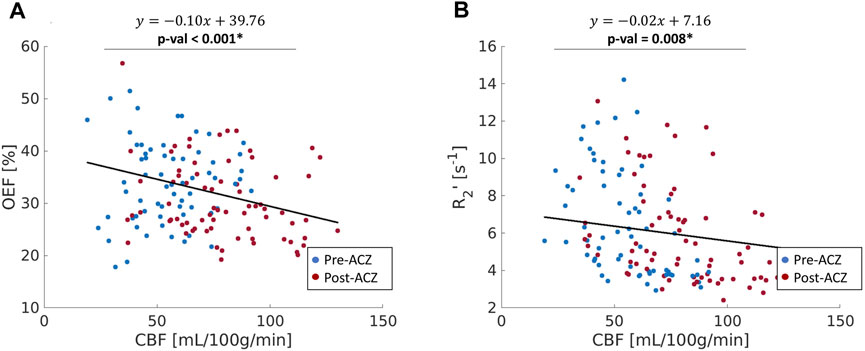
FIGURE 4. (A) The correlation between oxygen extraction fraction OEF (%) and cerebral blood flow (CBF); (B) the relationship between R2’ (s−1) and CBF across all healthy subjects in nine ROIs (red: before vasodilation (Pre-ACZ); blue: after vasodilation (Post-ACZ). The solid black line represents the fitted line from mixed-effect models. Linear mixed-effect models with adjustment for subject clustering and region were performed separately for OEF and R2’. p < 0.05* Mixed-effects model: OEF∼CBF + (1|Region) + (1|Subject).
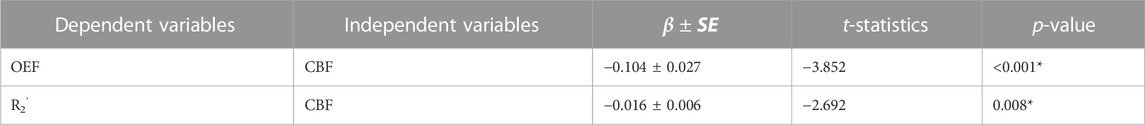
TABLE 2. Linear mixed-effects models between OEF, R2’, and CBF in the whole group (N = 8) across 9 ROIs. In both models, subjects and regions were used as random effects. *p < 0.05
The purpose of this study was to demonstrate qBOLD modeling of ASE scans in healthy volunteers to detect regional OEF decreases in key ROIs of the DMN during concomitant perfusion increase with ACZ vasodilation. The main findings were as follows: 1) Across baseline and vasodilation states, OEF was inversely related to quantitative perfusion as expected, indicating a compensation to maintain oxygen metabolism and reliability of the local OEF measures. 2) Similar changes with ACZ observed using R2’ relaxation estimates from the same ASE acquisitions, which highlights the utility of qBOLD compartment modeling to non-invasively measure specific OEF imaging markers. 3) OEF reduction was observed in critical DMN regions, including the precuneus and posterior cingulate gyrus.
The observed mean baseline OEF across selected brain regions of 35.1% is consistent with the physiological range of previous PET and MRI studies (Yamaguchi et al., 1986; Leenders et al., 1990; Cho et al., 2021; Jiang et al., 2023). We observed an OEF reduction of 6.2%–8.7% (absolute oxygenation) in significant DMN regions, which was smaller in magnitude than the 15.6% absolute OEF decrease in the sagittal sinus from past ACZ studies on healthy controls (Václavů et al., 2020). This discrepancy could be due to methodological differences, as previous studies focused on global OEF values and used a distinct contrast mechanism and calibration with T2-prepared inversion recovery sequences (Václavů et al., 2020; Baas et al., 2022). The qBOLD method adopted here may also have lower sensitivity to OEF changes due to noise contributions in the model fitting in vivo. Of note, the T2-based study also reported a larger magnitude of perfusion increase (69.3% increase) using pcASL with ACZ than our study (average 43.4% increase across regions). Therefore, direct comparison of the OEF imaging approaches in the same participants and improvement to sensitivity of our qBOLD approach is warranted in future work.
Although R2’ has been used as a surrogate marker for brain OEF in previous studies (Ni et al., 2015), including identification of putative oxygenation changes in cerebrovascular disease (Ni et al., 2017; Kaczmarz et al., 2021), this work suggests that qBOLD compartmental modeling outperforms R2’ measures in detecting physiological OEF changes in healthy volunteers. While significant OEF reductions were measured in the pCG and PCun with qBOLD, none of the ROIs showed a significant R2’ change with ACZ. Additionally, the expected inverse relationship between OEF and CBF across baseline and vasodilatory states was stronger using qBOLD than between R2’ and CBF. One rationale could be that R2’ is proportional to both OEF and DBV, such that OEF reductions concurrently with potential DBV elevations during vasodilation lead to overall smaller changes in R2’ values. Because qBOLD compartment modeling uses multiple asymmetric echoes to disentangle contributions from OEF and DBV, the resulting regional OEF measures are likely to be more sensitive than R2’, as observed in our results. In addition to the Bayesian fitting for R2’, a supplementary analysis of the monoexponential fits based on streamline qBOLD (Stone and Blockley, 2017) was also performed. Our more complex modeling approach may produce R2’ measures that are noisier compared to monoexponential fits for the relaxation parameter (Supplementary Figure S5), which may contribute to lack of sensitivity of R2’ to changes during vasodilation. Besides, in whole group level analysis with monoexponential fits, there was a slight decrease for R2’ in pCG
A good validation for our qBOLD method to measure OEF is to test the hypothesis that CMRO2 is unchanged during vasodilation, i.e., that OEF decreases are commensurate with the increase in CBF during acetazolamide. From this study, we found no significant CMRO2 change after Bonferroni correction in all selected regions, which is consistent with our hypothesis and reflects reliability of the qBOLD method. However, we observed a slight increasing trend in CMRO2, which may reflect residual underestimation bias in OEF values (i.e., underestimating the OEF decrease) and limited sensitivity of the qBOLD model to OEF. While CBF significantly increased in all selected regions, OEF only showed a significant decrease in pCG and PCun (Table 1). Therefore, there was an overall trend of increased CMRO2 in several regions, even though we observed the expected compensation of OEF and CBF during vasodilation. Future work will enhance the accuracy and sensitivity of qBOLD modeling with refined physiological prior information and improved fitting routines that are more robust to noise contributions.
This study imaged the regional effects of vasodilation on OEF across the entire cerebral cortex, focusing on DMN (Figures 2, 3). We found that most DMN regions showed increased CBF during vasodilation, and decreased OEF was observed in pCG and PCun. In contrast, the non-DMN regions did not show a significant response in any hemodynamic parameters. One potential implication of this finding is that DMN regions show a strong sensitivity to vasodilation in those regions, which is consistent with well-established mechanisms of vasodilation with ACZ (Kleinschmidt et al., 1995; Wang et al., 2015). In addition, BOLD fMRI studies during hypercapnia have identified co-fluctuations in brain hemodynamics that spatially resemble the DMN but are responsive to vasoactive (not neuronal) stimuli (Bright et al., 2020). Such “vascular networks” may have unique OEF properties at baseline and in vasodilated conditions, and methods such as the qBOLD approach can characterize such physiological mechanisms of brain functional network emergence. These capabilities will enable important future studies to assess the link between oxygen metabolism in other brain networks and their disorders. Outside of the DMN, the medial temporal lobe (MTL) has been known as a key early region that is affected by many brain diseases (Clifford R. Jack et al., 1997; Tam et al., 2005; Burton et al., 2009). OEF can serve as a functional biomarker due to its sensitivity in the early stages of brain diseases and aging, as neural activity is tightly linked to the brain’s oxygen consumption (Watts et al., 2018). At baseline, average OEF values in the medial temporal lobe were measured to be 25.9% ± 3.0% (Table 1), consistent with prior MRI studies’ measurement of OEF in vessels supplying the MTL of 23.9% using T2-relaxation-under-phase-contrast approach (Jiang et al., 2023). Even though there was a decreasing trend, we observed no significant change in MTL OEF during vasodilation (
To perform qBOLD modeling, we have used an ASE sequence to directly estimate R2’ with consistent R2-weighting across echoes (An and Lin, 2003). One main limitation of the qBOLD model is that the separation of DBV and OEF effects in the qBOLD model depends mainly on the subtle change in decay patterns. Therefore, it requires high signal-to-noise-ratio (SNR) to accurately estimate OEF from the ASE signals (An and Lin, 2000). Due to challenging low SNR from our sequence, OEF values estimated from qBOLD model still had unreasonable physiological values in particular voxels that we had to remove. To address this noise limitation, a benefit to fitting this multi-compartment with the Bayesian framework is the ability to include prior knowledge to improve parameter estimates. In this study, prior mean values and standard deviations were taken from previous studies (Stone and Blockley, 2017; Cherukara et al., 2019; Le et al., 2023). Moreover, it has been suggested that prior means do not significantly affect the parameter estimation (Cherukara et al., 2019). However, the prior standard deviations were optimized based on a broader range of R2’-weighted images (24 R2’-images in Cherukara et al., 2019, and 14 in Le et al., 2023) than acquired in this MRI protocol. For this data, we also investigated the effect of prior standard deviations to the parameter estimation by comparing between the chosen prior standard deviations (
Hct was assumed as 0.40 based on the literature value for general circulation (Nicoll et al., 2012), which is consistent with average hematocrit in healthy subjects from other studies (Brown et al., 1962; Jeong et al., 2021). On the other hand, prior relevant studies have used a lower Hct of 0.34 (He and Yablonskiy, 2007) because of lower Hct in small vessels. Because Hct influences quantification specifically of the intravascular compartment, for our two-compartment model, changing Hct has a non-linear effect on the parameter estimates. For instance, using a Hct of 0.34 (i.e., a 15% lower value of Hct) and without spatial regularization, Cherakura et al. observed the same mean DBV values but a 3% higher mean OEF values compared to analysis with Hct of 0.40. However, it is unclear how much the Hct varies throughout the brain, which may propagate to additional regional differences of OEF estimates from the qBOLD signal. Finally, this study adopted a Bayesian framework that aims for the maximal free energy of the approximate posterior to better estimate the data (Chappell et al., 2009). This approach was chosen to ensure that applying additional smoothing (Gaussian smoothing with kernel of 4 mm) did not affect the fitting. Because the qBOLD-OEF measurement requires more complex models, it is more sensitive to the presence of noise compared to CBF quantification from ASL. Therefore, we applied a larger kernel of smoothing (i.e., 4 mm) for OEF, which is consistent to previous studies (Cho et al., 2021; Uchida et al., 2022). This kernel was empirically chosen after comparing multiple kernel sizes on our data to reduce unstructured noise and heterogeneity in the OEF maps but has the drawback of decreasing the spatial resolution of regional OEF measures. The relatively small sample size of our study is also a limitation and should be expanded in future studies to include larger cohorts with various ages and cerebrovascular conditions.
We demonstrated that regional OEF measurements from qBOLD are reliable across multiple physiological conditions and evaluated OEF through correlation with ASL perfusion in response to ACZ vasodilation as reliable indicators of tissue health in healthy cohort. This study enhances our understanding of the relationship between OEF and CBF with regional alterations in brain vasculature and has implications for the future use of oxygenation MRI to study vascular alterations in cognitive impairment and cerebrovascular diseases.
The datasets presented in this study can be found in online repositories. The names of the repository/repositories and accession number(s) can be found below: https://github.com/fanlab-ucdavis/hemodynamics-data.
The studies involving humans were approved by the Institutional Review Board at University of California, Davis. The studies were conducted in accordance with the local legislation and institutional requirements. The participants provided their written informed consent to participate in this study.
Designed research, LL, NB, and AF. Collected the data, EH, CD, and AF. Analyzed the data, LL, GW, EH, and AF. Interpreted the data, LL, GW, EH, NB, AY, KN, and AF. Prepared figures, LL. Writing—Original Draft, LL, and AF. Writing—Review and Edit, LL, GW, EH, NB, AY, KN, and AF. All authors contributed to the article and approved the submitted version.
This study received funding from the National Institute of Health (grant number R00-NS102884).
The authors declare that the research was conducted in the absence of any commercial or financial relationships that could be construed as a potential conflict of interest.
All claims expressed in this article are solely those of the authors and do not necessarily represent those of their affiliated organizations, or those of the publisher, the editors and the reviewers. Any product that may be evaluated in this article, or claim that may be made by its manufacturer, is not guaranteed or endorsed by the publisher.
The Supplementary Material for this article can be found online at: https://www.frontiersin.org/articles/10.3389/fphys.2023.1231793/full#supplementary-material
Alsop D. C., Detre J. A., Golay X., Günther M., Hendrikse J., Hernandez-Garcia L., et al. (2015). Recommended implementation of arterial spin-labeled perfusion MRI for clinical applications: A consensus of the ismrm perfusion study group and the European consortium for ASL in dementia. Magn. Reson. Med. 73, 102–116. doi:10.1002/mrm.25197
An H., Lin W. (2003). Impact of intravascular signal on quantitative measures of cerebral oxygen extraction and blood volume under normo- and hypercapnic conditions using an asymmetric spin echo approach. Magn. Reson. Med. 50, 708–716. doi:10.1002/mrm.10576
An H., Lin W. (2000). Quantitative measurements of cerebral blood oxygen saturation using magnetic resonance imaging. J. Cereb. Blood Flow. Metab. 20, 1225–1236. doi:10.1097/00004647-200008000-00008
Andersson J. L. R., Jenkinson M., Smith S. (2010). Non-linear registration, aka spatial normalisation FMRIB technical report TR07JA2.
Baas K. P. A., Coolen B. F., Petersen E. T., Biemond B. J., Strijkers G. J., Nederveen A. J. (2022). Comparative analysis of blood T2 values measured by T2 -trir and TRUST. J. Magn. Reson Imaging 56, 516–526. doi:10.1002/jmri.28066
Blockley N. P., Stone A. J. (2016). Improving the specificity of R2’ to the deoxyhaemoglobin content of brain tissue: prospective correction of macroscopic magnetic field gradients. NeuroImage 135, 253–260. doi:10.1016/j.neuroimage.2016.04.013
Bouvier J., Detante O., Tahon F., Attye A., Perret T., Chechin D., et al. (2015). Reduced CMRO₂ and cerebrovascular reserve in patients with severe intracranial arterial stenosis: A combined multiparametric qBOLD oxygenation and BOLD fMRI study. Hum. Brain Mapp. 36, 695–706. doi:10.1002/hbm.22657
Bright M. G., Whittaker J. R., Driver I. D., Murphy K. (2020). Vascular physiology drives functional brain networks. NeuroImage 217, 116907. doi:10.1016/j.neuroimage.2020.116907
Brown E., Hopper J., Hodges J. L., Bradley B., Wennesland R., Yamauchi H. (1962). Red cell, plasma, and blood volume in the healthy women measured by radiochromium cell-labeling and hematocrit. J. Clin. Invest. 41, 2182–2190. doi:10.1172/JCI104677
Brown W. R., Thore C. R. (2011). Review: cerebral microvascular pathology in ageing and neurodegeneration. Neuropathol. Appl. Neurobiol. 37, 56–74. doi:10.1111/j.1365-2990.2010.01139.x
Broyd S. J., Demanuele C., Debener S., Helps S. K., James C. J., Sonuga-Barke E. J. S. (2009). Default-mode brain dysfunction in mental disorders: A systematic review. Neurosci. Biobehav. Rev. 33, 279–296. doi:10.1016/j.neubiorev.2008.09.002
Buch S., Ye Y., Haacke E. M. (2017). Quantifying the changes in oxygen extraction fraction and cerebral activity caused by caffeine and acetazolamide. J. Cereb. Blood Flow. Metab. 37, 825–836. doi:10.1177/0271678X16641129
Burton E. J., Barber R., Mukaetova-Ladinska E. B., Robson J., Perry R. H., Jaros E., et al. (2009). Medial temporal lobe atrophy on MRI differentiates alzheimer’s disease from dementia with lewy bodies and vascular cognitive impairment: A prospective study with pathological verification of diagnosis. Brain 132, 195–203. doi:10.1093/brain/awn298
Chappell M. A., Groves A. R., Whitcher B., Woolrich M. W. (2009). Variational bayesian inference for a nonlinear forward model. IEEE Trans. Signal Process. 57, 223–236. doi:10.1109/TSP.2008.2005752
Chappell M. A., MacIntosh B. J., Donahue M. J., Günther M., Jezzard P., Woolrich M. W. (2010). Separation of macrovascular signal in multi-inversion time arterial spin labelling MRI. Magn. Reson. Med. 63, 1357–1365. doi:10.1002/mrm.22320
Cherukara M. T., Stone A. J., Chappell M. A., Blockley N. P. (2019). Model-based Bayesian inference of brain oxygenation using quantitative BOLD. NeuroImage 202, 116106. doi:10.1016/j.neuroimage.2019.116106
Cho J., Lee J., An H., Goyal M. S., Su Y., Wang Y. (2021). Cerebral oxygen extraction fraction (OEF): comparison of challenge-free gradient echo qsm+qbold (qq) with 15o pet in healthy adults. J. Cereb. Blood Flow. Metab. 41, 1658–1668. doi:10.1177/0271678X20973951
Cleland N. R. W., Al-Juboori S. I., Dobrinskikh E., Bruce K. D. (2021). Altered substrate metabolism in neurodegenerative disease: new insights from metabolic imaging. J. Neuroinflammation 18, 248. doi:10.1186/s12974-021-02305-w
Clifford R., Jack J., Petersen R. C., Yue Cheng Xu , Waring S. C., O’Brien P. C., et al. (1997). Medial temporal atrophy on MRI in normal aging and very mild Alzheimer’s disease. Neurology 49, 786–794. doi:10.1212/WNL.49.3.786
Coalson T. S., Van Essen D. C., Glasser M. F. (2018). The impact of traditional neuroimaging methods on the spatial localization of cortical areas. Proc. Natl. Acad. Sci. 115, E6356–E6365. doi:10.1073/pnas.1801582115
Collins D. L., Zijdenbos A. P., Baaré W. F. C., Evans A. C. (1999). “ANIMAL+INSECT: improved cortical structure segmentation,” in Information processing in medical imaging lecture notes in computer science. A. Kuba, M. Šáamal, and A. Todd-Pokropek (Berlin, Heidelberg: Springer), 210–223. doi:10.1007/3-540-48714-X_16
Desikan R. S., Ségonne F., Fischl B., Quinn B. T., Dickerson B. C., Blacker D., et al. (2006). An automated labeling system for subdividing the human cerebral cortex on MRI scans into gyral based regions of interest. NeuroImage 31, 968–980. doi:10.1016/j.neuroimage.2006.01.021
Fan A. P., Khalil A. A., Fiebach J. B., Zaharchuk G., Villringer A., Villringer K., et al. (2020). Elevated brain oxygen extraction fraction measured by MRI susceptibility relates to perfusion status in acute ischemic stroke. J. Cereb. Blood Flow. Metab. 40, 539–551. doi:10.1177/0271678X19827944
Fan J.-L., Nogueira R. C., Brassard P., Rickards C. A., Page M., Nasr N., et al. (2022). Integrative physiological assessment of cerebral hemodynamics and metabolism in acute ischemic stroke. J. Cereb. Blood Flow. Metab. Off. J. Int. Soc. Cereb. Blood Flow. Metab. 42, 454–470. doi:10.1177/0271678X211033732
Fonov V., Evans A. C., Botteron K., Almli C. R., McKinstry R. C., Collins D. L., et al. (2011). Unbiased average age-appropriate atlases for pediatric studies. NeuroImage 54, 313–327. doi:10.1016/j.neuroimage.2010.07.033
Fonov V., Evans A., McKinstry R., Almli C., Collins D. (2009). Unbiased nonlinear average age-appropriate brain templates from birth to adulthood. NeuroImage 47, S102. doi:10.1016/S1053-8119(09)70884-5
Frazier J. A., Chiu S., Breeze J. L., Makris N., Lange N., Kennedy D. N., et al. (2005). Structural brain magnetic resonance imaging of limbic and thalamic volumes in pediatric bipolar disorder. Am. J. Psychiatry 162, 1256–1265. doi:10.1176/appi.ajp.162.7.1256
Groves A. R., Chappell M. A., Woolrich M. W. (2009). Combined spatial and non-spatial prior for inference on MRI time-series. NeuroImage 45, 795–809. doi:10.1016/j.neuroimage.2008.12.027
Gersing A. S., Ankenbrank M., Schwaiger B. J., Toth V., Janssen I., Kooijman H., et al. (2015). Mapping of cerebral metabolic rate of oxygen using dynamic susceptibility contrast and blood oxygen level dependent MR imaging in acute ischemic stroke. Neuroradiology 57, 1253–1261. doi:10.1007/s00234-015-1592-7
Goldstein J. M., Seidman L. J., Makris N., Ahern T., O’Brien L. M., Caviness V. S., et al. (2007). Hypothalamic abnormalities in schizophrenia: sex effects and genetic vulnerability. Biol. Psychiatry 61, 935–945. doi:10.1016/j.biopsych.2006.06.027
Greve D. N., Fischl B. (2009). Accurate and robust brain image alignment using boundary-based registration. NeuroImage 48, 63–72. doi:10.1016/j.neuroimage.2009.06.060
Guilliams K. P., Fields M. E., Ragan D. K., Eldeniz C., Binkley M. M., Chen Y., et al. (2018). Red cell exchange transfusions lower cerebral blood flow and oxygen extraction fraction in pediatric sickle cell anemia. Blood 131, 1012–1021. doi:10.1182/blood-2017-06-789842
Gupta A., Baradaran H., Schweitzer A. D., Kamel H., Pandya A., Delgado D., et al. (2014). Oxygen extraction fraction and stroke risk in patients with carotid stenosis or occlusion: A systematic review and meta-analysis. Am. J. Neuroradiol. 35, 250–255. doi:10.3174/ajnr.A3668
Haight T. J., Bryan R. N., Erus G., Davatzikos C., Jacobs D. R., D’Esposito M., et al. (2015). Vascular risk factors, cerebrovascular reactivity, and the default-mode brain network. NeuroImage 115, 7–16. doi:10.1016/j.neuroimage.2015.04.039
Handwerker D. A., Gazzaley A., Inglis B. A., D’Esposito M. (2007). Reducing vascular variability of fMRI data across aging populations using a breathholding task. Hum. Brain Mapp. 28, 846–859. doi:10.1002/hbm.20307
He X., Yablonskiy D. A. (2007). Quantitative BOLD: mapping of human cerebral deoxygenated blood volume and oxygen extraction fraction: default state. Magn. Reson. Med. 57, 115–126. doi:10.1002/mrm.21108
Hokari M., Kuroda S., Shiga T., Nakayama N., Tamaki N., Iwasaki Y. (2008). Combination of a mean transit time measurement with an acetazolamide test increases predictive power to identify elevated oxygen extraction fraction in occlusive carotid artery diseases. J. Nucl. Med. 49, 1922–1927. doi:10.2967/jnumed.108.054379
Imaizumi M., Kitagawa K., Oku N., Hashikawa K., Takasawa M., Yosmkawa T., et al. (2004). Clinical significance of cerebrovascular reserve in acetazolamide challenge —Comparison with acetazolamide challenge H2O-PET and gas-PET. Ann. Nucl. Med. 18, 369–374. doi:10.1007/BF02984479
Ishii K., Kitagaki H., Kono M., Mori E. (1996). Decreased medial temporal oxygen metabolism in alzheimer’s disease shown by PET. J. Nucl. Med. 37, 1159–1165.
Jenkinson M., Bannister P., Brady M., Smith S. (2002). Improved optimization for the robust and accurate linear registration and motion correction of brain images. NeuroImage 17, 825–841. doi:10.1016/s1053-8119(02)91132-8
Jenkinson M., Beckmann C. F., Behrens T. E. J., Woolrich M. W., Smith S. M. (2012). Fsl. NeuroImage 62, 782–790. doi:10.1016/j.neuroimage.2011.09.015
Jenkinson M., Smith S. (2001). A global optimisation method for robust affine registration of brain images. Med. Image Anal. 5, 143–156. doi:10.1016/S1361-8415(01)00036-6
Jeong H. R., Shim Y. S., Lee H. S., Hwang J. S. (2021). Hemoglobin and hematocrit levels are positively associated with blood pressure in children and adolescents 10 to 18 years old. Sci. Rep. 11, 19052. doi:10.1038/s41598-021-98472-0
Jiang D., Lin Z., Liu P., Sur S., Xu C., Hazel K., et al. (2020). Brain oxygen extraction is differentially altered by alzheimer’s and vascular diseases. J. Magnetic Reson. Imaging 52, 1829–1837. doi:10.1002/jmri.27264
Jiang D., Liu P., Lin Z., Hazel K., Pottanat G., Lucke E., et al. (2023). MRI assessment of cerebral oxygen extraction fraction in the medial temporal lobe. NeuroImage 266, 119829. doi:10.1016/j.neuroimage.2022.119829
Kaczmarz S., Göttler J., Petr J., Hansen M. B., Mouridsen K., Zimmer C., et al. (2021). Hemodynamic impairments within individual watershed areas in asymptomatic carotid artery stenosis by multimodal MRI. J. Cereb. Blood Flow. Metab. Off. J. Int. Soc. Cereb. Blood Flow. Metab. 41, 380–396. doi:10.1177/0271678X20912364
Kazumata K., Tanaka N., Ishikawa T., Kuroda S., Houkin K., Mitsumori K. (1996). Dissociation of vasoreactivity to acetazolamide and hypercapnia. Comparative study in patients with chronic occlusive major cerebral artery disease. Stroke 27, 2052–2058. doi:10.1161/01.STR.27.11.2052
Kety S. S., Schmidt C. F. (1948). The nitrous oxide method for the quantitative determination of cerebral blood flow in man: theory, procedure and normal values. J. Clin. Invest. 27, 476–483. doi:10.1172/JCI101994
Kim D., Hughes T. M., Lipford M. E., Craft S., Baker L. D., Lockhart S. N., et al. (2021). Relationship between cerebrovascular reactivity and cognition among people with risk of cognitive decline. Front. Physiol. 12, 645342. doi:10.3389/fphys.2021.645342
Kleinschmidt A., Steinmetz H., Sitzer M., Merboldt K.-D., Frahm J. (1995). Magnetic resonance imaging of regional cerebral blood oxygenation changes under acetazolamide in carotid occlusive disease. Stroke 26, 106–110. doi:10.1161/01.STR.26.1.106
Lattanzi S., Carbonari L., Pagliariccio G., Bartolini M., Cagnetti C., Viticchi G., et al. (2018). Neurocognitive functioning and cerebrovascular reactivity after carotid endarterectomy. Neurology 90, e307–e315. doi:10.1212/WNL.0000000000004862
Le L. N. N., Wheeler G. J., Blockley N. P., Fan A. P. (2023). “Quantitative BOLD with variational bayesian inference: model comparisons with monte carlo simulations and in an elderly cohort,” in ISMRM, Toronto, Canada, 03-08 June 2023.
Lee H., Englund E. K., Wehrli F. W. (2018). Interleaved quantitative BOLD: combining extravascular r2ʹ - and intravascular r2-measurements for estimation of deoxygenated blood volume and hemoglobin oxygen saturation. NeuroImage 174, 420–431. doi:10.1016/j.neuroimage.2018.03.043
Leenders K. L., Perani D., Lammertsma A. A., Heather J. D., Buckingham P., Jones T., et al. (1990). Cerebral blood flow, blood volume and oxygen utilization: normal values and effect of age. Brain 113, 27–47. doi:10.1093/brain/113.1.27
Li X., Wang D., Auerbach E. J., Moeller S., Ugurbil K., Metzger G. J. (2015). Theoretical and experimental evaluation of multi-band EPI for high-resolution whole brain pCASL Imaging. NeuroImage 106, 170–181. doi:10.1016/j.neuroimage.2014.10.029
Lin Z., Lim C., Jiang D., Soldan A., Pettigrew C., Oishi K., et al. (2023). Longitudinal changes in brain oxygen extraction fraction (OEF) in older adults: relationship to markers of vascular and alzheimer’s pathology. Alzheimer’s Dementia 19, 569–577. doi:10.1002/alz.12727
Liu Y., Li S., Tian X., Leung T. W., Liu L., Liebeskind D. S., et al. (2023). Cerebral haemodynamics in symptomatic intracranial atherosclerotic disease: A narrative review of the assessment methods and clinical implications. Stroke Vasc. Neurol.–2023-002333. svn-2023-002333. doi:10.1136/svn-2023-002333
Makris N., Goldstein J. M., Kennedy D., Hodge S. M., Caviness V. S., Faraone S. V., et al. (2006). Decreased volume of left and total anterior insular lobule in schizophrenia. Schizophr. Res. 83, 155–171. doi:10.1016/j.schres.2005.11.020
Mandell D. M., Han J. S., Poublanc J., Crawley A. P., Stainsby J. A., Fisher J. A., et al. (2008). Mapping cerebrovascular reactivity using blood oxygen level-dependent MRI in patients with arterial steno-occlusive disease: comparison with arterial spin labeling mri. Stroke 39, 2021–2028. doi:10.1161/STROKEAHA.107.506709
Mikl M., Mareček R., Hluštík P., Pavlicová M., Drastich A., Chlebus P., et al. (2008). Effects of spatial smoothing on fMRI group inferences. Magn. Reson. Imaging 26, 490–503. doi:10.1016/j.mri.2007.08.006
Nemoto E. M., Yonas H., Kuwabara H., Pindzola R. R., Sashin D., Meltzer C. C., et al. (2004). Identification of hemodynamic compromise by cerebrovascular reserve and oxygen extraction fraction in occlusive vascular disease. J. Cereb. Blood Flow. Metab. 24, 1081–1089. doi:10.1097/01.WCB.0000125887.48838.37
Ni W., Christen T., Zun Z., Zaharchuk G. (2015). Comparison of R2′ measurement methods in the normal brain at 3 tesla. Magn. Reson. Med. 73, 1228–1236. doi:10.1002/mrm.25232
Ni W. W., Christen T., Rosenberg J., Zun Z., Moseley M. E., Zaharchuk G. (2017). Imaging of cerebrovascular reserve and oxygenation in Moyamoya disease. J. Cereb. Blood Flow. Metab. 37, 1213–1222. doi:10.1177/0271678X16651088
Nicoll D., Lu C. M., Pignone M., McPhee S. J. (2012). Pocket guide to diagnostic tests. 6. McGraw Hill: Access Medicine. Available at: https://accessmedicine.mhmedical.com/content.aspx?bookid=503§ionid=43474712.
Olman C. A., Davachi L., Inati S. (2009). Distortion and signal loss in medial temporal lobe. PLOS ONE 4, e8160. doi:10.1371/journal.pone.0008160
Pinheiro J. C., Bates D. M. (1996). Unconstrained parametrizations for variance-covariance matrices. Stat. Comput. 6, 289–296. doi:10.1007/BF00140873
Pinto J., Chappell M. A., Okell T. W., Mezue M., Segerdahl A. R., Tracey I., et al. (2020). Calibration of arterial spin labeling data—Potential pitfalls in post-processing. Magn. Reson. Med. 83, 1222–1234. doi:10.1002/mrm.28000
Richiardi J., Monsch A. U., Haas T., Barkhof F., Van de Ville D., Radü E. W., et al. (2015). Altered cerebrovascular reactivity velocity in mild cognitive impairment and Alzheimer’s disease. Neurobiol. Aging 36, 33–41. doi:10.1016/j.neurobiolaging.2014.07.020
Robb W. H., Khan O. A., Ahmed H. A., Li J., Moore E. E., Cambronero F. E., et al. (2022). Lower cerebral oxygen utilization is associated with Alzheimer’s disease-related neurodegeneration and poorer cognitive performance among apolipoprotein E ε4 carriers. J. Cereb. Blood Flow. Metab. Off. J. Int. Soc. Cereb. Blood Flow. Metab. 42, 642–655. doi:10.1177/0271678X211056393
Rolfe D. F., Brown G. C. (1997). Cellular energy utilization and molecular origin of standard metabolic rate in mammals. Physiol. Rev. 77, 731–758. doi:10.1152/physrev.1997.77.3.731
Silvestrini M., Pasqualetti P., Baruffaldi R., Bartolini M., Handouk Y., Matteis M., et al. (2006). Cerebrovascular reactivity and cognitive decline in patients with Alzheimer disease. Stroke 37, 1010–1015. doi:10.1161/01.STR.0000206439.62025.97
Simon A. B., Dubowitz D. J., Blockley N. P., Buxton R. B. (2016). A novel Bayesian approach to accounting for uncertainty in fMRI-derived estimates of cerebral oxygen metabolism fluctuations. NeuroImage 129, 198–213. doi:10.1016/j.neuroimage.2016.01.001
Smeeing D. P. J., Hendrikse J., Petersen E. T., Donahue M. J., de Vis J. B. (2016). Arterial spin labeling and blood oxygen level-dependent MRI cerebrovascular reactivity in cerebrovascular disease: A systematic review and meta-analysis. Cerebrovasc. Dis. 42, 288–307. doi:10.1159/000446081
Smith S. M. (2002). Fast robust automated brain extraction. Hum. Brain Mapp. 17, 143–155. doi:10.1002/hbm.10062
Spees W. M., Yablonskiy D. A., Oswood M. C., Ackerman J. J. H. (2001). Water proton MR properties of human blood at 1.5 tesla: magnetic susceptibility, t1, t2, t2*, and non-lorentzian signal behavior. Magn. Reson. Med. 45, 533–542. doi:10.1002/mrm.1072
Stone A. J., Blockley N. P. (2017). A streamlined acquisition for mapping baseline brain oxygenation using quantitative BOLD. NeuroImage 147, 79–88. doi:10.1016/j.neuroimage.2016.11.057
Stone A. J., Harston G. W. J., Carone D., Okell T. W., Kennedy J., Blockley N. P. (2019). Prospects for investigating brain oxygenation in acute stroke: experience with a non-contrast quantitative bold based approach. Hum. Brain Mapp. 40, 2853–2866. doi:10.1002/hbm.24564
Sukstanskii A. L., Yablonskiy D. A. (2001). Theory of FID NMR signal dephasing induced by mesoscopic magnetic field inhomogeneities in biological systems. J. Magn. Reson. 151, 107–117. doi:10.1006/jmre.2001.2363
Tam C. W. C., Burton E. J., McKeith I. G., Burn D. J., O’Brien J. T. (2005). Temporal lobe atrophy on MRI in Parkinson disease with dementia: A comparison with alzheimer disease and dementia with lewy bodies. Neurology 64, 861–865. doi:10.1212/01.WNL.0000153070.82309.D4
Tchistiakova E., Crane D. E., Mikulis D. J., Anderson N. D., Greenwood C. E., Black S. E., et al. (2015). Vascular risk factor burden correlates with cerebrovascular reactivity but not resting state coactivation in the default mode network. J. Magn. Reson. Imaging JMRI 42, 1369–1376. doi:10.1002/jmri.24917
Uchida Y., Kan H., Inoue H., Oomura M., Shibata H., Kano Y., et al. (2022). Penumbra detection with oxygen extraction fraction using magnetic susceptibility in patients with acute ischemic stroke. Front. Neurology 13, 752450. doi:10.3389/fneur.2022.752450
Václavů L., Petr J., Petersen E. T., Mutsaerts H. J. M. M., Majoie C. B. L., Wood J. C., et al. (2020). Cerebral oxygen metabolism in adults with sickle cell disease. Am. J. Hematol. 95, 401–412. doi:10.1002/ajh.25727
Vestergaard M. B., Iversen H. K., Simonsen S. A., Lindberg U., Cramer S. P., Andersen U. B., et al. (2023). Capillary transit time heterogeneity inhibits cerebral oxygen metabolism in patients with reduced cerebrovascular reserve capacity from steno-occlusive disease. J. Cereb. Blood Flow. Metab. 43, 460–475. doi:10.1177/0271678X221139084
Vorstrup S., Henriksen L., Paulson O. B. (1984). Effect of acetazolamide on cerebral blood flow and cerebral metabolic rate for oxygen. J. Clin. Invest. 74, 1634–1639. doi:10.1172/JCI111579
Wang K., Smith Z. M., Buxton R. B., Swenson E. R., Dubowitz D. J. (2015). Acetazolamide during acute hypoxia improves tissue oxygenation in the human brain. J. Appl. Physiol. Bethesda Md 119, 1494–1500. doi:10.1152/japplphysiol.00117.2015
Wang Y., Fellah S., Fields M. E., Guilliams K. P., Binkley M. M., Eldeniz C., et al. (2021). Cerebral oxygen metabolic stress, microstructural injury, and infarction in adults with sickle cell disease. Neurology 97, e902–e912. doi:10.1212/WNL.0000000000012404
Watchmaker J. M., Juttukonda M. R., Davis L. T., Scott A. O., Faraco C. C., Gindville M. C., et al. (2018). Hemodynamic mechanisms underlying elevated oxygen extraction fraction (OEF) in moyamoya and sickle cell anemia patients. J. Cereb. Blood Flow. Metab. 38, 1618–1630. doi:10.1177/0271678X16682509
Watts M. E., Pocock R., Claudianos C. (2018). Brain energy and oxygen metabolism: emerging role in normal function and disease. Front. Mol. Neurosci. 11, 216. doi:10.3389/fnmol.2018.00216
Woolrich M. W., Chiarelli P., Gallichan D., Perthen J., Liu T. T. (2006). Bayesian inference of hemodynamic changes in functional arterial spin labeling data. Magn. Reson. Med. 56, 891–906. doi:10.1002/mrm.21039
Xu F., Liu P., Pekar J. J., Lu H. (2015). Does acute caffeine ingestion alter brain metabolism in young adults? NeuroImage 110, 39–47. doi:10.1016/j.neuroimage.2015.01.046
Yablonskiy D. A., Haacke E. M. (1994). Theory of NMR signal behavior in magnetically inhomogeneous tissues: the static dephasing regime. Magn. Reson. Med. 32, 749–763. doi:10.1002/mrm.1910320610
Yablonskiy D. A., Sukstanskii A. L., He X. (2013). Blood oxygenation level-dependent (BOLD)-based techniques for the quantification of brain hemodynamic and metabolic properties - theoretical models and experimental approaches. NMR Biomed. 26, 963–986. doi:10.1002/nbm.2839
Yamaguchi T., Kanno I., Uemura K., Shishido F., Inugami A., Ogawa T., et al. (1986). Reduction in regional cerebral metabolic rate of oxygen during human aging. Stroke 17, 1220–1228. doi:10.1161/01.STR.17.6.1220
Yamauchi H., Okazawa H., Kishibe Y., Sugimoto K., Takahashi M. (2004). Oxygen extraction fraction and acetazolamide reactivity in symptomatic carotid artery disease. J. Neurol. Neurosurg. Psychiatry 75, 33–37.
Yin Y., Shu S., Qin L., Shan Y., Gao J.-H., Lu J. (2021). Effects of mild hypoxia on oxygen extraction fraction responses to brain stimulation. J. Cereb. Blood Flow. Metab. 41, 2216–2228. doi:10.1177/0271678X21992896
Yin Y., Zhang Y., Gao J.-H. (2018). Dynamic measurement of oxygen extraction fraction using a multiecho asymmetric spin echo (MASE) pulse sequence. Magnetic Reson. Med. 80, 1118–1124. doi:10.1002/mrm.27078
Keywords: Oxygen extraction fraction (OEF), cerebral blood flow (CBF), vasodilation, arterial spin labeling (ASL) MRI, quantitative BOLD (qBOLD), magnetic resonance imaging (MRI)
Citation: Le LNN, Wheeler GJ, Holy EN, Donnay CA, Blockley NP, Yee AH, Ng KL and Fan AP (2023) Cortical oxygen extraction fraction using quantitative BOLD MRI and cerebral blood flow during vasodilation. Front. Physiol. 14:1231793. doi: 10.3389/fphys.2023.1231793
Received: 31 May 2023; Accepted: 25 September 2023;
Published: 06 October 2023.
Edited by:
Alex Bhogal, Utrecht University, NetherlandsReviewed by:
Dengrong Jiang, Johns Hopkins University, United StatesCopyright © 2023 Le, Wheeler, Holy, Donnay, Blockley, Yee, Ng and Fan. This is an open-access article distributed under the terms of the Creative Commons Attribution License (CC BY). The use, distribution or reproduction in other forums is permitted, provided the original author(s) and the copyright owner(s) are credited and that the original publication in this journal is cited, in accordance with accepted academic practice. No use, distribution or reproduction is permitted which does not comply with these terms.
*Correspondence: Linh N. N. Le, bG5ubGVAdWNkYXZpcy5lZHU=
Disclaimer: All claims expressed in this article are solely those of the authors and do not necessarily represent those of their affiliated organizations, or those of the publisher, the editors and the reviewers. Any product that may be evaluated in this article or claim that may be made by its manufacturer is not guaranteed or endorsed by the publisher.
Research integrity at Frontiers
Learn more about the work of our research integrity team to safeguard the quality of each article we publish.