
94% of researchers rate our articles as excellent or good
Learn more about the work of our research integrity team to safeguard the quality of each article we publish.
Find out more
ORIGINAL RESEARCH article
Front. Physiol., 06 September 2023
Sec. Computational Physiology and Medicine
Volume 14 - 2023 | https://doi.org/10.3389/fphys.2023.1231688
This article is part of the Research TopicNetwork Physiology, Insights into the Cardiovascular SystemView all 4 articles
Introduction: The left (LV) and right (RV) ventricles are linked biologically, hemodynamically, and mechanically, a phenomenon known as ventricular interdependence. While LV function has long been known to impact RV function, the reverse is increasingly being realized to have clinical importance. Investigating ventricular interdependence clinically is challenging given the invasive measurements required, including biventricular catheterization, and confounding factors such as comorbidities, volume status, and other aspects of subject variability.
Methods: Computational modeling allows investigation of mechanical and hemodynamic interactions in the absence of these confounding factors. Here, we use a threesegment biventricular heart model and simple circulatory system to investigate ventricular interdependence under conditions of systolic and diastolic dysfunction of the LV and RV in the presence of compensatory volume loading. We use the end-diastolic pressure-volume relationship, end-systolic pressure-volume relationship, Frank Starling curves, and cardiac power output as metrics.
Results: The results demonstrate that LV systolic and diastolic dysfunction lead to RV compensation as indicated by increases in RV power. Additionally, RV systolic and diastolic dysfunction lead to impaired LV filling, interpretable as LV stiffening especially with volume loading to maintain systemic pressure.
Discussion: These results suggest that a subset of patients with intact LV systolic function and diagnosed to have impaired LV diastolic function, categorized as heart failure with preserved ejection fraction (HFpEF), may in fact have primary RV failure. Application of this computational approach to clinical data sets, especially for HFpEF, may lead to improved diagnosis and treatment strategies and consequently improved outcomes.
While the left (LV) and right (RV) ventricles are distinct embryologically, structurally, and functionally (Golob, Moss, and Chesler, 2014), they are linked by a pericardium, shared myofibers, an interventricular septum with common conduction pathway, and a closed loop hemodynamic circuit. The shared myofibers transverse both ventricles, mechanically linking contractile function, termed systolic interdependence (Damiano et al., 1991; Schwarz et al., 2013; Naeije and Badagliacca, 2017; Berglund, Piña, and Herrera, 2020). Experimental studies demonstrate the ability of LV systolic dysfunction (SD) to cause RV SD (Santamore et al., 1976; Damiano et al., 1991). Diastolic interdependence becomes evident when volume overload of one ventricle alters septal dynamics and impedes filling of the other ventricle (Ventetuolo and Klinger, 2014; Naeije and Badagliacca, 2017; Berglund, Piña, and Herrera, 2020). The resultant upward and leftward shift in the end-diastolic pressure-volume relationship (EDPVR) can be misinterpreted as chamber or free wall stiffening. While systolic and diastolic interdependence have been investigated for over a century (Henderson and Prince, 1914), the individual contributions of the pericardium, shared myofibers, septum, and hemodynamic circuit to these phenomena, particular during heart failure (HF), remain incompletely understood.
Heart failure with reduced ejection fraction (HFrEF; LV ejection fraction <50%) represents nearly 50% of heart failure cases worldwide and is characterized by LV SD (Murphy, Ibrahim, and Januzzi, 2020). The impact of this LV SD on systemic hemodynamics is often so severe that any change in RV function is ignored clinically. However, secondary RV dysfunction is common, and metrics of RV function, such as cardiac power output (CPO) (Yildiz and Yenigun, 2021), can predict outcomes in HFrEF (Bosch et al., 2017). In heart failure with preserved ejection fraction (HFpEF), which represents the other nearly 50% of HF cases worldwide (Pfeffer, Shah, and Borlaug 2019) and is highly heterogenous (Gorter, Rienstra, and van Veldhuisen, 2017; Jones et al., 2021), there is debate regarding whether LV diastolic dysfunction (DD) (Lekavich et al., 2015), RV SD or DD (Berglund, Piña, and Herrera, 2020; Kadry et al., 2020), or biventricular dysfunction (Rommel et al., 2018) is the major contributor. In both HFrEF and HFpEF, RV function is important to exercise capacity (Sharma and Kass, 2014; Vonk et al., 2019; Santens et al., 2020; Comunale et al., 2021). Thus, interventricular interactions are critical to both quality of life and outcomes in LV failure. Similarly, in primary RV failure, due to, e.g., pulmonary arterial hypertension, LV mechanics are affected (Stojnic et al., 1992; Gan et al., 2006; Puwanant et al., 2010; Hardegree et al., 2013). Thus, knowledge gaps exist for ventricular-ventricular interactions (VVI) in all types of HF, including LV SD, LV DD, RV SD, and RV DD.
Preclinical studies have addressed some of these knowledge gaps. Early isolated heart studies in large animals showed that due to VVI, LV contraction contributes to 60%–70% of RV systolic function (Santamore et al., 1976; Damiano et al., 1991). Ischemic damage to the RV free wall has been shown to impair LV filling in mice (Sicard et al., 2019) and LV ejection in swine (Brookes et al., 1999). In the former rodent studies, LV DD was caused by septal hypertrophy and flattening; in the latter swine studies, LV SD appeared secondary to impaired filling due to pericardial constraints. In a high-fat diet rodent model of HFpEF, significant biventricular dysfunction was found, where RV dysfunction (mildly reduced ejection fraction) was attributed to RV hypertrophy and changes in myofilament sensitivity (Hegemann et al., 2021).
Computational modeling is aptly positioned for investigating VVI because the influence of specific contributors to these interactions can be interrogated individually. For example, the impact of the pericardium, shared myofibers, interventricular septum, and LV and RV preload and afterload as determined by the characteristics of the cardiovascular system (CVS) can be varied independently. In addition, the absence of subject variability and potential species differences simplifies interpretation. Numerous CVS models have been used to explore ventricular dysfunction; however, few account for VVI without computationally and time intensive finite element modeling. Additionally, volume loading as a surrogate for HF compensation is computationally expensive with high order models. Thus, we employ the Lumens et al. three-segment (TriSeg) biventricular model of the heart (2009) because it accounts for differences in RV and LV geometry and captures VVI through shared myofibers and the septum while remaining computationally simple. Previously this model has been used to investigate biventricular mechanics including septal dynamics in primary RV dysfunction due to pulmonary hypertension and pulmonary arterial hypertension (Lumens et al., 2009; Palau-Caballero et al., 2017).
To develop a predictive mechanistic understanding of interventricular interactions under conditions of HFrEF, HFpEF, and heart failure with moderately reduced ejection fraction (HFmrEF) with compensatory volume loading, we combine the TriSeg model with a closed-loop lumped-parameter circulation model. Our simulations reveal that: 1) RV SD and DD induce an apparent LV stiffening that is due to VVI and not to intrinsic changes in the properties of the LV or pericardial constraints; 2) LV dysfunction causes a compensatory increase in RV CPO to supply sufficient LV preload when volume loading is sufficient to maintain normal systemic pressures; and 3) RV dysfunction contributes to LV dysfunction via impaired Frank-Starling mechanism in the LV. The model codes, which are parameterized to simplify the use of potentially subject-specific data, are freely distributed to facilitate further independent exploration of the mechanisms investigated here.
We establish a hypothetical ideal subject that represents a healthy adult (weight −70 kg). Normative values for systemic, LV, and RV chamber pressures and volumes as well as total blood volume for this hypothetical subject were based on literature values (Table 1). End-systolic pressure (ESP) for the LV was assumed to be 5% greater than the mean arterial systolic blood pressure (
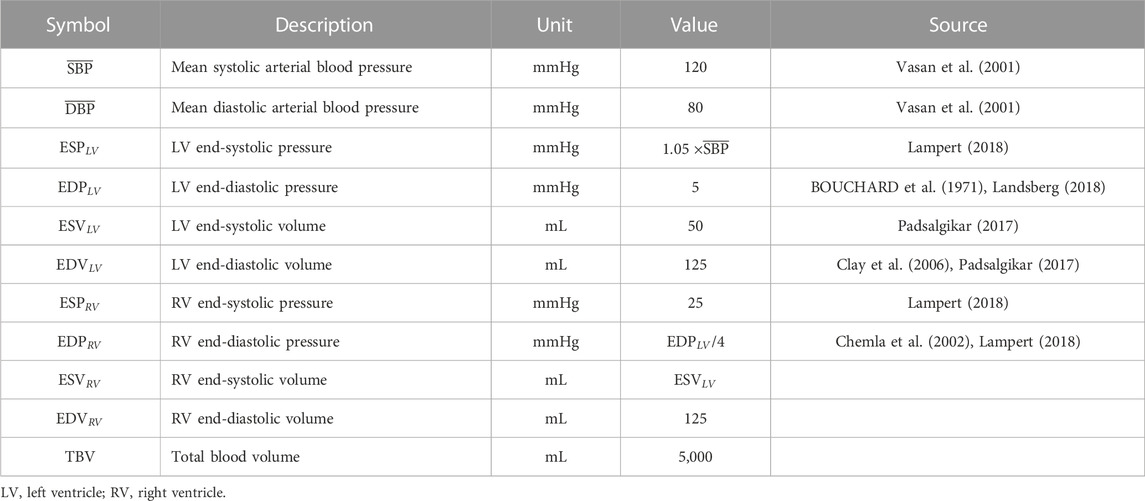
TABLE 1. Normative values for a healthy 70 kg adult based on literature values and established relationships.
The TriSeg model is adapted from Lumens et al. (2009) in which the ventricles are constructed from three thick-walled spherical, segments corresponding to the ventricular left wall (LW) and right wall (RW) with a septal wall (SW) in between. To simplify parameterization of the cardiac model for individual subjects, we developed a generalized method in which ESVs and EDVs are used to compute LW, RW, and SW thicknesses. We also used a sinusoidal driving function (Marquis et al., 2018) to modulate length-dependent myocyte contraction instead of the Lumens et al. heuristic force-velocity approach (Lumens et al., 2009). We also simplified the passive stiffness model and included a pericardial constraint as in Jezek et al. (2022). The novel aspects of our approach are detailed below, and a complete description is available in the Supplementary Appendix.
In the TriSeg model, the midwall is defined as a theoretical surface radially half-way between the inner and outer surfaces of the ventricular wall (Lumens et al., 2009) (the normal ventricular geometry is illustrated on Figure 4A, where the midwall is the dashed line creating intersection points where the tension is balanced). The midwall reference surface area for the LW, RW, or SW segments,
and given thickness,
and finally, the outer radii
Midwall surface areas and wall volumes can then be determined from midwall radii as
and
We assume the LW is 2/3 and the SW is 1/3 of the entire LW volume, that is,
and in terms of EDV,
Similarly, for the midwall reference areas,
which are then,
As indicated, both the SW volume and surface area adopt the TriSeg assumption that the septum shares the same properties as the LW, comprising a third of the LV geometry. With these reference areas and volumes, the process of computing ventricular geometries including curvature, axial position, and radial position follow the method developed by Lumens et al. (2009).
As described by Lumens et al. (2009), the total developed wall stress for each wall segment (
where
Here, we simplified the Lumens et al. (Lumens et al., 2009) formulation of passive stress based on the exponential formula from Klotz et al. (Klotz et al., 2006) as
where
For the active stress component, we have
where
where
Based on
where
Similarly, the active stress scaling factor relates the ESP (as in Table 1) to the TriSeg calculated chamber pressure in end-systole such that
where
The three walls of the TriSeg model are mechanically coupled through a tension balance at the shared junction point where all three walls meet. The ventricular volumes are then used to calculate the chamber pressures. Given a model of wall mechanics for each segment, the axial and radial tension components are calculated at the shared junction point. All Triseg cardiac model euqations are listed in the (Supplementary Eqs SA8–SA14).
We implement a pericardial constraint,
where the heart volume,
Figure 1 shows a schematic of the circulation model comprising six compartments. We determine vascular model parameters using two strategies: 1) scaling compartmental volumes as percentages of total blood volume and approximations of blood distribution, and 2) scaling compartmental pressures based on SBP and arterial diastolic blood pressures (DBP). Systemic and pulmonary compliances were approximated as the ratio between the maximal stressed volume and maximal pressure generated in each compartment; the unstressed volume for each compartment is defined based on Beneken (1979), and the ratio of stressed to unstressed volume is based on Beneken (1979). Systemic and pulmonary vascular resistances were set as the ratio between the change in pressure between compartments based on Boron and Boulpaep (2016) and the overall cardiac output. Further details are given in Supplementary Appendix. All cardiovascular parameters for the healthy case are listed in Table 2.
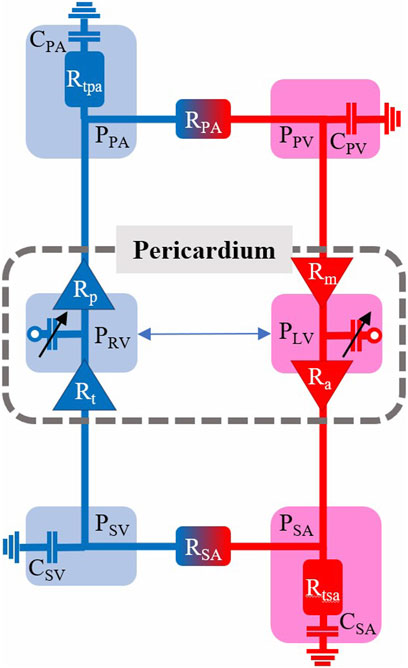
FIGURE 1. Cardiovascular model schematic with pressures (P), resistances (R), and compliances (C) indicated for the six model compartments with a pericardium encapsulating the left and right ventricles (LV, RV). SA—systemic arterial. PA—pulmonary arterial. SV—systemic venous. PV–pulmonary venous.
The healthy (H) case is defined based on normative hemodynamic data including LV and RV pressures and volumes (Table 1) and cardiac and circulation model parameter values (Table 2). To simulate acute SD, we reduce overall active myofiber stress by scaling
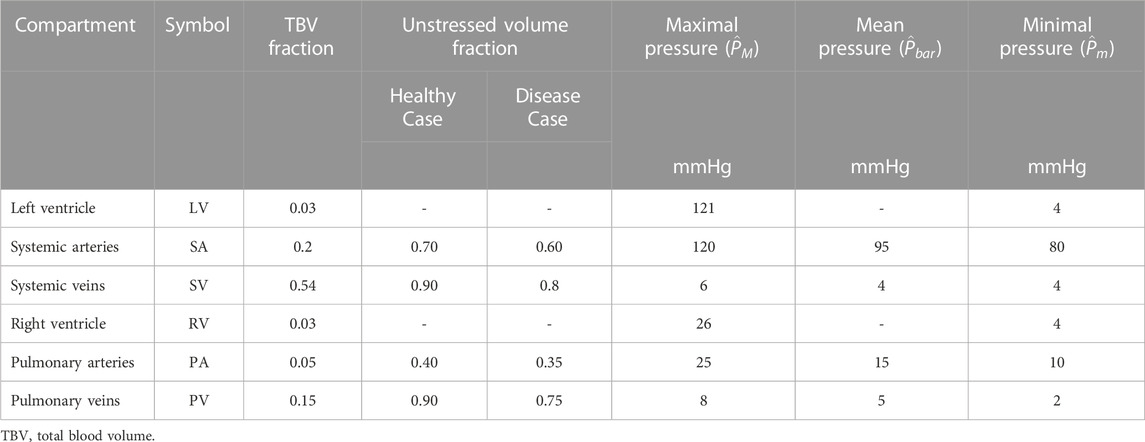
TABLE 3. Compartment volume fractions adapted from Beneken (1979) and pressures (Boron and Boulpaep, 2016) for the cardiovascular model.
As a VVI challenge, we increased circulating blood volume from 100% to 350%. In this study, we volume loaded to achieve a mean systemic arterial pressure (
To ensure the model produced the appropriate EDPVR while volume loaded, we used the Klotz approximated EDPVR curve as a reference and optimized
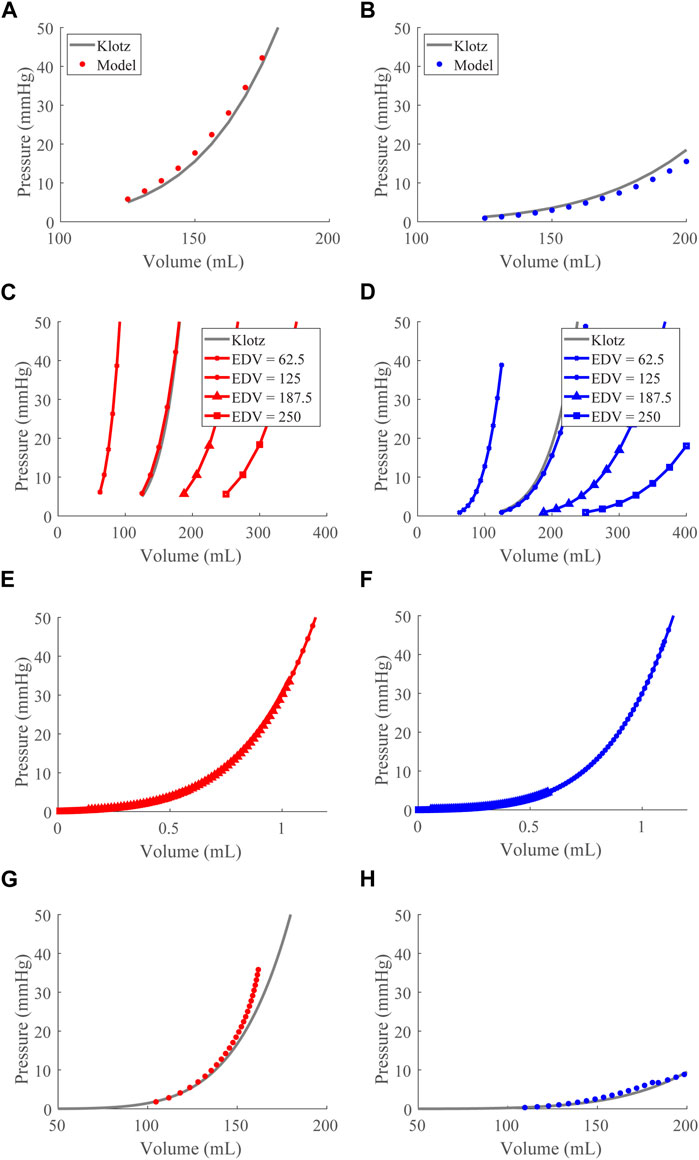
FIGURE 2. End-diastolic pressure-volume relationship (EDPVR) optimization and validation. (A) and (B). The left (red) and right (blue) ventricular model-predicted ex vivo EDPVRs (circles) plotted with the Klotz EDPVRs (solid black curve) for the optimized
After validating the passive properties of the cardiac model, we simulated the healthy case at a baseline TBV of 4.6 L, generating pressure-volume loops (Figure 3A), time courses for the LV and RV volumes (Figure 3B), and compartmental pressures (Figures 3C,D).
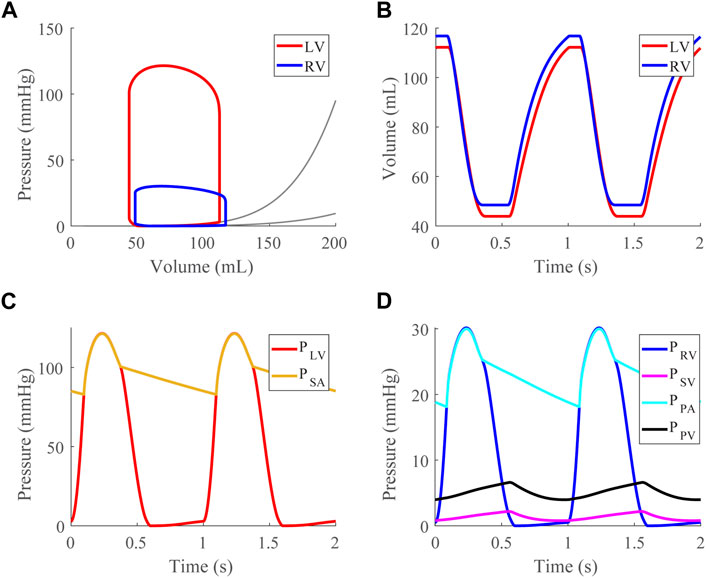
FIGURE 3. Healthy case at a mean systemic arterial, SA, pressure of 95 mmHg (baseline). (A). Left (LV) and right (RV) ventricular pressure-volume loops shown with approximated EDPVR curves (Klotz et al., 2006). (B). LV and RV volume time courses. (C). LV and SA pressure time courses. (D). RV, systemic venous (SV), pulmonary arterial (PA), and pulmonary venous (PV) pressure time courses.
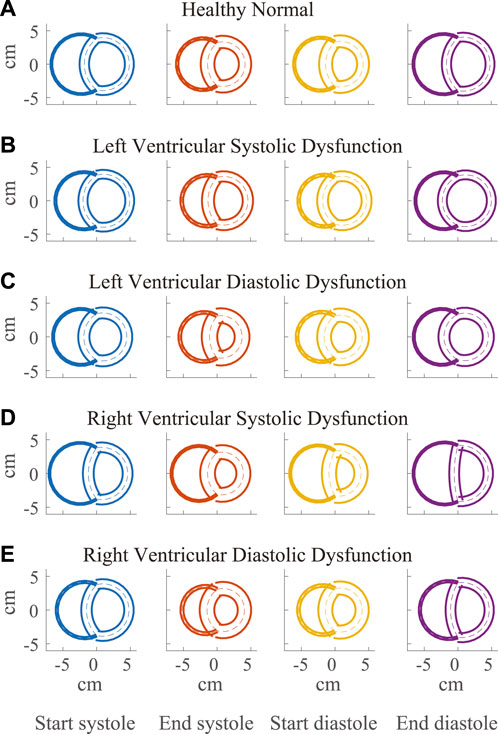
FIGURE 4. Visualization of simulated ventricular geometry during the cardiac cycle in the healthy (A) and severe dysfunction (B–E) cases. The geometry of the Triseg model, representative of a biventricular transverse plane view, is illustrated at several times in the cardiac cycle, including start and end of systole and diastole with left ventricle (LV) on the left and right ventricle (RV) on the right. The overlap of the ventricular walls and septum follows from the simplifying assumption of the TriSeg model geometry. Dashed lines represent the TriSeg midwall, creating intersection points with balanced tensions. At end-diastole, LV and RV lumens are maximally full. During contraction, the walls progressively thicken until end-systole. In RV dysfunction, the effect of elevated RV preload on septal curvature is apparent at end-diastole, where the septum has become much more flattened compared to the other cases.
Compensatory volume loading simulations were performed for the healthy (H) and dysfunction cases, including LVSD, LVDD, RVSD, and RVDD (Figures 4–8) with two degrees of severity, moderate (M) and severe (S). Figures 4B–E visualizes the ventricular geometry at several points in the cardiac cycle for the severe dysfunction cases only. For each dysfunction (and each Figure), we show the pressure-volume loops in panels A (LV) and B (RV) at a normal circulating blood volume. Panels C and D show end-systolic pressure volume (ESPVR) and EDPVR curves, respectively, during volume loading. The ESPVRs show physiological nonlinearity (Burkhoff, Mirsky, and Suga, 2005). The bold black marker in panels C and D indicates the baseline point with fully compensated circulating blood volume to maintain
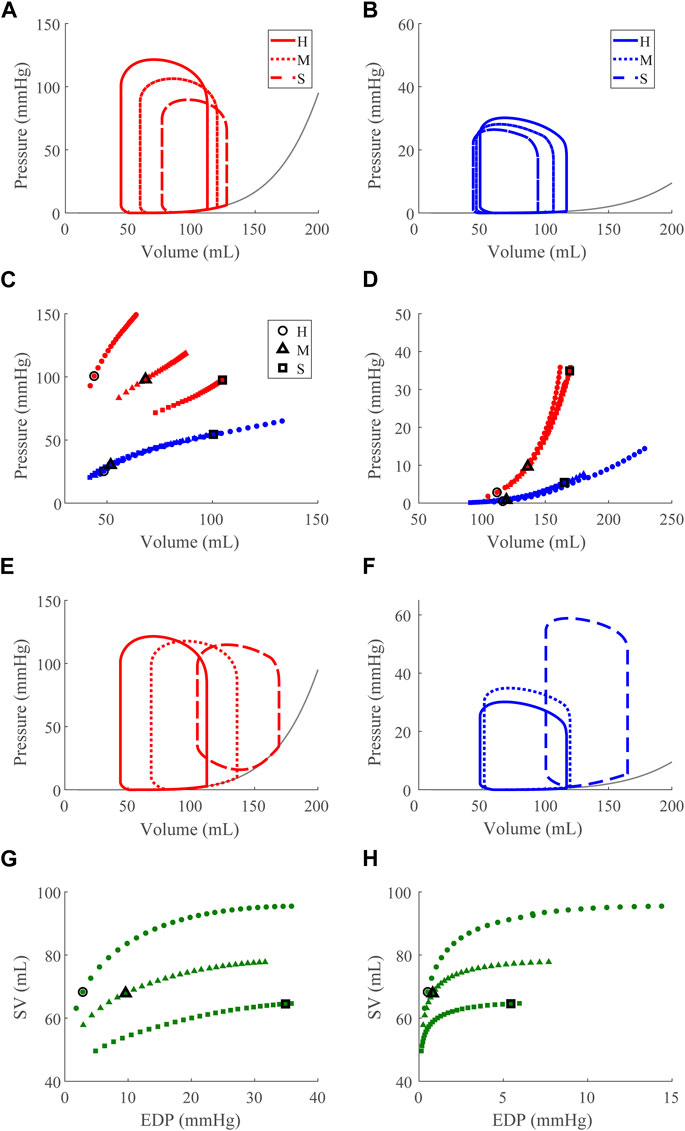
FIGURE 5. Left ventricular (LV) systolic dysfunction (SD) simulation. From the healthy (H) case, LV contractility is reduced (Section 2.5) for the moderate (M) and severe (S) cases. (A, B) The left (red) and right (RV, blue) ventricular pressure-volume loops at the healthy total blood volume for the H, M, and S cases shown with the healthy-case Klotz EDPVR curve (gray). (C, D). The end-systolic pressure-volume relationship and the end-diastolic pressure-volume relationship for the LV and RV. After volume loading, the baseline at full compensation is denoted by the black bolded marker. (E, F). The LV and RV pressure-volume at full compensation, corresponding to the markers in C and D. (G, H). The LV and RV Frank-Starling relationship curve for the H, M, and S case with baseline indicated by the black bolded marker.
Reducing
Increasing
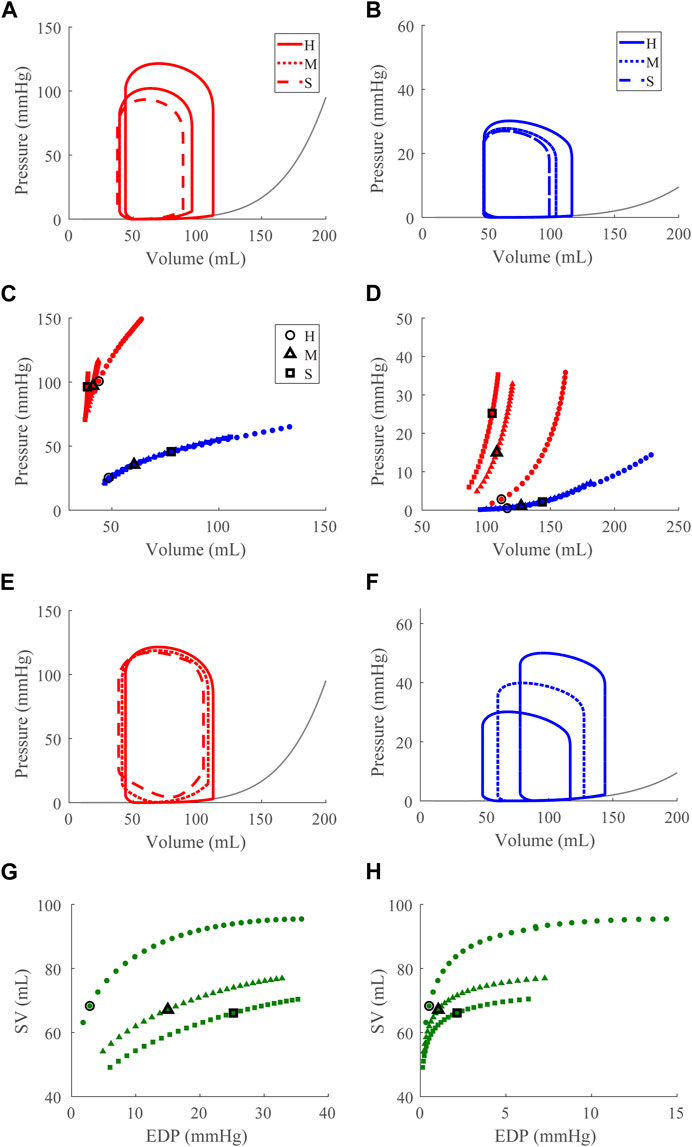
FIGURE 6. Left ventricular (LV) diastolic dysfunction (DD) simulation. From the healthy (H) case, the LV passive stiffness is increased (Section 2.5) for the moderate (M) and severe (S) cases. (A, B). The left (red) and right (RV, blue) ventricular pressure-volume loops at the healthy total blood volume for the H, M, and S cases shown with the healthy-case Klotz EDPVR curve (gray). (C, D). The end-systolic pressure-volume relationship and the end-diastolic pressure-volume relationship for the LV and RV. After volume loading, the baseline at full compensation is denoted by the black bolded marker. (E, F). The LV and RV pressure-volume loops at full compensation, corresponding to the markers in C and D. (G, H). The LV and RV Frank-Starling relationship curve for the H, M, and S case with baseline indicated by the black bolded marker.
Decreasing
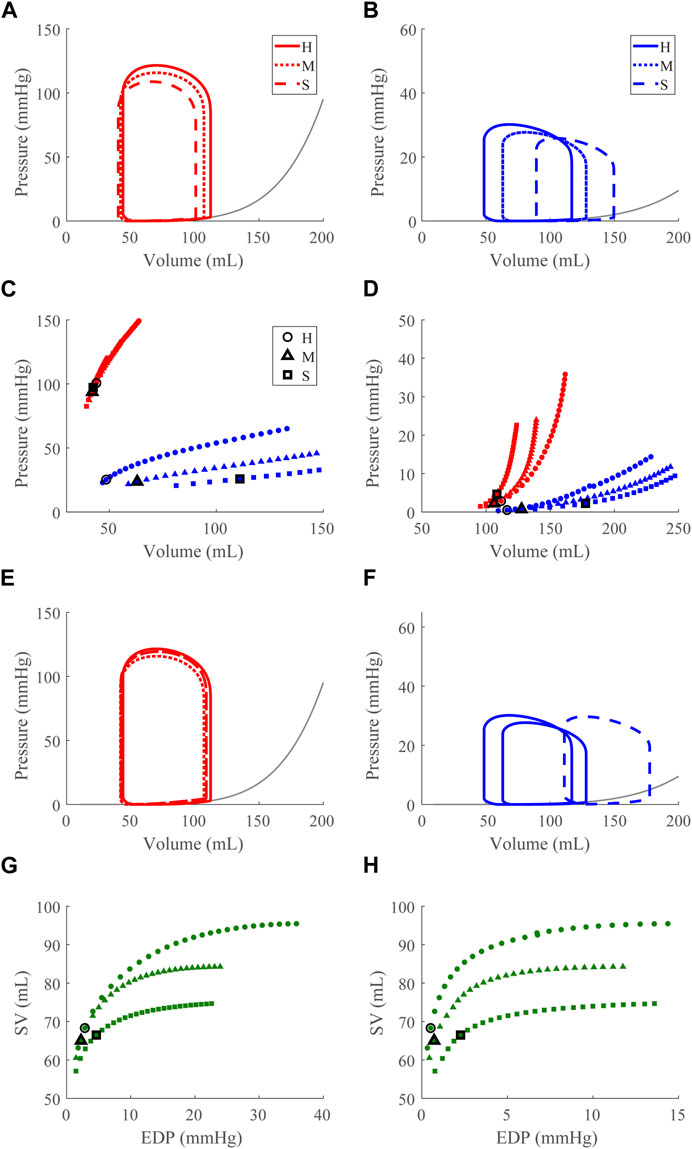
FIGURE 7. Right ventricular (RV) systolic dysfunction (SD) simulation. From the healthy (H) case, the RV contractility is reduced (Section 2.5) for the moderate (M) and severe (S) cases. (A, B). The left (red) and right (RV, blue) ventricular pressure-volume loops at the healthy total blood volume for the H, M, and S cases shown with the healthy-case Klotz EDPVR curve (gray). (C, D). The end-systolic pressure-volume relationship and the end-diastolic pressure-volume relationship for the LV and RV. After volume loading, the baseline at full compensation is denoted by the black bolded marker. (E, F). The LV and RV pressure-volume loops at full compensation, corresponding to the markers in C and D. (G, H). The LV and RV Frank-Starling relationship curve for the H, M, and S case with baseline indicated by the black bolded marker.
Increasing
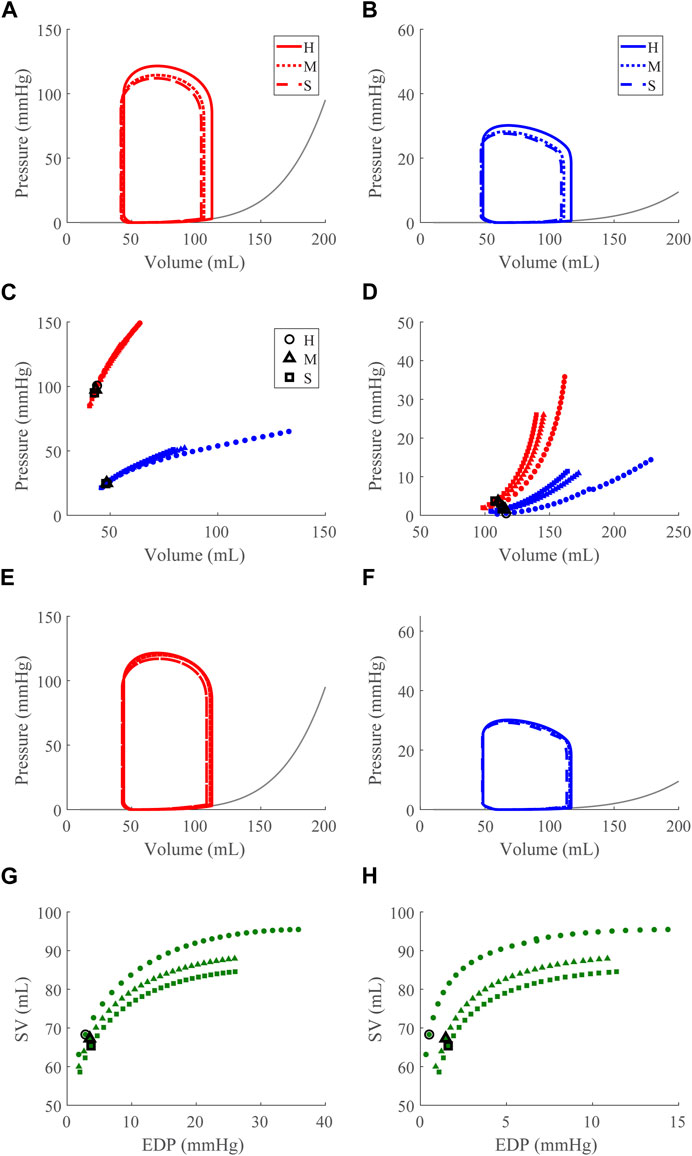
FIGURE 8. Right ventricular (RV) diastolic dysfunction (DD) simulation. From the healthy (H) case, the RV passive stiffness is increased (Section 2.5) for the moderate (H) and severe (S) cases. (A, B). The left (red) and right (RV, blue) ventricular pressure-volume loops at the healthy total blood volume for the H, M, and S cases shown with the Klotz EDPVR curve (gray). (C, D). The end-systolic pressure-volume relationship and the end-diastolic pressure-volume relationship for the LV and RV. After volume loading, the baseline at full compensation is denoted by the black bolded marker. (E, F). The LV and RV pressure-volume loops at full compensation, corresponding to the markers in C and D. (G, H). The LV and RV Frank-Starling relationship curve for the H, M, and S case with baseline indicated by the black bolded marker.
Comparing CPO across all conditions at the baseline point demonstrates an inverse relationship between the LV and RV CPO, such that when the LV CPO decreases, RV CPO increases (Figures 9A,B). This finding suggests RV compensation is required to maintain pressure and flow when LV function (systolic or diastolic) is impaired. The changes in LV CPO for RV dysfunction are negligible (Figures 9C,D). Interestingly, despite a 15-fold increase in
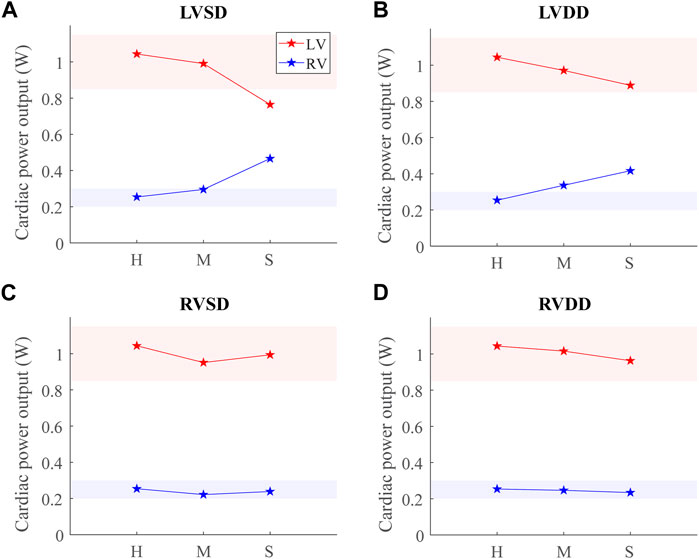
FIGURE 9. Cardiac power output (CPO) at baseline for healthy (H), moderate (M), and severe (S) cases for the four dysfunction simulations. Healthy-normal ranges for the left ventricular (LV, red) and right ventricular (RV, blue) CPO are indicated by the shaded regions. (A) LV systolic dysfunction (LVSD). (B) LV diastolic dysfunction (LVDD). (C) RV systolic dysfunction (RVSD). (D) RV diastolic dysfunction (RVDD).
Along with spatial representations of the LV and RV geometries (Figure 4), the TriSeg model allows analysis of SW curvature over time due to force balances at the SW insertion points and pressure balances along the wall (Figure 10). In all healthy and disease cases tested here, curvature is always positive, indicating bowing into the RV, but differences in curvature over time are evident with disease. In the healthy case, the SW deflects towards the RV throughout the cardiac cycle, and wall thickness increases from end-diastole to end-systole (Figure 4A). Septal curvature decreases somewhat, indicating mild flattening of the septum at the start of systole, and increases to a maximal curvature just before the aortic valve closes (Figure 10). During isovolumic relaxation, the curvature is relatively constant at about 0.30 cm−1, and during diastole curvature decreases, reaching a minimum of about 0.25 cm−1. For severe LVSD, septal flattening can be visualized during systole both spatially (Figure 4B) and temporally (Figure 10A) with near normal curvature during diastole. For severe LVDD, some flattening occurs during systole (Figure 4C), and greater-than-normal curvature occurs during diastole (Figure 10B). This increased bowing of the septum toward the RV during diastole helps compensate for the impaired LV by increasing the LV chamber volume. In contrast, for both the severe RVSD and RVDD cases, septal dynamics deviate the most from healthy during diastole (Figures 4D,E, 10C,D) with again more dramatic changes in SD compared to DD. For RVSD, dramatic RV dilation causes the SW flattening; for RVDD, limited RV dilation (due to stiffening) leads to SW flattening, which allows for maintained RV filling volumes.
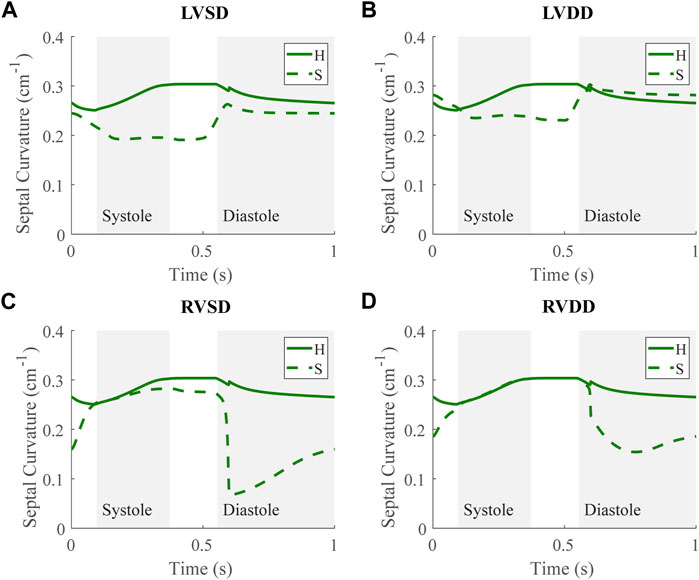
FIGURE 10. Septal curvature time courses at baseline for the severe (S) case for the four dysfunction simulations with curvature at baseline for the healthy (H) case. Systole and diastole for the H case are indicated by the shaded regions. Positive curvature indicates bowing of the septum toward the right ventricle (RV) and a negative curvature would indicate bowing toward the left ventricle (LV). (A) LV systolic dysfunction (LVSD). (B) LV diastolic dysfunction (LVDD) (C) RV systolic dysfunction (RVSD). (D) RV diastolic dysfunction (RVDD).
Using a modified TriSeg heart model developed here and the closed-loop, lumped-parameter circulation model, our results highlight the interdependence of the ventricles and demonstrate the effects of LV failure on RV function and vice versa. Specifically, our simulations reveal expected RV compensation for the failing LV and unexpected apparent LV DD in the presence of RV SD and RV DD, which may contribute to the HFpEF phenotype. Moreover, our simplified parameterization framework of the TriSeg model serves as a foundation for subject-specific investigations.
For the healthy case, the model-simulated LV and RV pressure-volume relationships, Frank-Starling curves, and septal curvature analyses demonstrate physiological cardiac mechanics for a typical 70 kg human (Figure 3). In particular, the EDPVR, ESPVR, and Frank-Starling curves generated have the expected shapes. Using the Klotz et al. (2006), we calibrated the EDPs as done previously (Krishnamurthy et al., 2013), and our model EDPVR behavior shows satisfactory congruence with experiment results, capturing EDPVR normalization (Klotz et al., 2006). Thus, we are confident the changes produced by the model EDPVR in response to model interventions appropriately reflect physiological behaviors.
Our model also exhibits the expected pathologies associated with LV SD and LV DD. The LVSD simulations (Figure 5) demonstrate reduced ejection fraction, increased LV systolic and diastolic volumes, increased EDP, reduced end-systolic elastance, and a flattened ESPVR with a maintained EDPVR as found clinically (Aurigemma, Zile, and Gaasch, 2006). RV systolic function is maintained with LVSD as indicated by the unchanged ESPVR curve (Figure 5C), but the RV ejection fraction decreases with increasing LV systolic impairment as the RV dilates (Table 3; Figure 5F). Our LVDD simulations (Figure 6) represent the most restrictive DD case and reproduce the expected behaviors: maintained ejection fraction, increased EDPs, decreased EDVs, a leftward, upward shift of the EDPVR curve, and a maintained or increased end-systolic elastance, consistent with the clinical literature (Aurigemma, Zile, and Gaasch, 2006). Interestingly, in LVDD the end-systolic elastance, as measured by the ESPVR, increased (Figure 6C). This response has been reported clinically to varying degrees (Rommel et al., 2018). Enhanced contractility may be a response to increasing preload from impaired LV filling. Hence, model agreement with previously reported behaviors gives confidence in our model predictions.
Our simulations reveal increased RV work in response to attenuated LV pump function in acute LVSD. In this case, LV myofiber contraction is intrinsically impaired, so greater LV preloads are necessary to generate a given pressure. As a result, the RV has a corresponding increase in CPO to generate the increased pressure required to supply sufficient preload for LV contraction via the Frank-Starling mechanism. Chronically elevated RV CPO in LVSD can eventually lead to deleterious remodeling of the RV. Indeed, elevated RV CPO has been independently correlated to poor outcomes in HFrEF (Yildiz and Yenigun, 2021). Interestingly, LVSD simulated at several HRs shows a frequency dependence where higher HRs result in progressively worse LV function (decreased CPO) and greater RV compensation (Supplementary Figure S1).
Apparent LV stiffening arises, as shown by the increased steepness of the LV EDPVR curve (Figures 7D, 8D) in our simulations of RVSD and to a lesser degree RVDD, despite no changes to intrinsic properties of the LV free wall or septum as in the LV case. At baseline the effects on the LV are minimal (Figures 7E, 8E), and increased HR does not result in substantial changes in LV or RV CPO (Supplementary Figure S1). However, as preload increases, deviations from the healthy case become more evident. Our modeling approach supports that this resulting LV DD is due to mechanical interactions between the LV and the failing RV. Note, if the LV and RV were independent bodies connected in series by the circulations, increases in circulating blood volume (to increase RV preload), would increase the LV end diastolic pressure and volume, but not the shape of the LV EDPVR. To assess the pericardium’s role, we repeated the severe RVSD and RVDD cases in its absence. Though we observed a slight contribution to the increased steepness of the LV EDPVR, particularly at full compensation (results not shown), the pericardium does not substantially impact LV EDPVR steepness. In contrast, septal dynamics appear to play a significant role. With RVSD and RVDD, we observed septal flattening temporally (Figures 10C,D) and spatially (Figures 4D,E), which effectively reduces LV volume and may impair contractile dynamics given the non-cylindrical shape. Hence, LV DD in the RV dysfunction cases is most likely a result of VVI mediated by septal dynamics.
Our simulation results reveal three dysfunction cases that correspond to HFpEF. Classically, HFpEF is characterized by preserved LV ejection fraction and impaired LV filling as the common phenotype (Lekavich et al., 2015), which are present in the LVDD, RVSD, and RVDD cases. In the LVDD case, we impose LV stiffening which directly impairs LV filling. The attenuated LV function and corresponding augmented RV function is reflected in the increased RV CPO. In LVDD, the stiffer LV myocardium requires greater pressures to generate the preload needed to maintain SV and systemic arterial pressure, provided by the increased pump function of the RV. In our RV dysfunction simulations, LV function is mostly maintained at volumes required to maintain a mean arterial blood pressure of ∼95 mmHg (Figures 7E, 8E). Here, LV DD occurs at greater circulating blood volume, resulting in higher preloads (Figures 7D, 8D) that correspond to exercise (Fudim, Sobotka, and Dunlap, 2021) or volume overload (Miller, 2016).
The LV DD present at high preloads for the RV dysfunction cases may contribute to the clinical observation of exercise intolerance in HFpEF patients. Stable HFpEF subjects can present as normal at rest during clinical evaluations with symptoms such as impaired LV filling only becoming apparent during exertion (Borlaug et al., 2010; Dunlay, Roger, and Redfield, 2017). Knight et al. reported a link between RV dilation and LV DD in patients with RV dysfunction due to PH (Knight et al., 2015); however it was unclear whether this linkage was due to abnormal septal dynamics, pericardial constraints, or intrinsic myocardial stiffening of the LV. As discussed in Section 4.3, our simulations suggest that LV DD in RV dysfunction results from VVI mediated by the septum. Along with reports of substantial numbers of HFpEF patients exhibiting RV SD or DD, our in silico findings suggest that a subset of HFpEF patients may not have primary LV failure, but in fact primary RV failure (Rommel et al., 2018). Moreover, Supplementary Figure S1 shows no substantial change in CPO as HR increases in these dysfunction cases. This interpretation offers an explanation for the heterogeneity of the HFpEF diagnosis well known clinically (Dunlay, Roger, and Redfield, 2017) and recently investigated using model-based analysis and physiology-informed machine learning (Jones et al., 2021).
In this study, we developed a systematic method to calculate parameters for the TriSeg model given input data (Table 1). Subject-specific modeling has gained momentum in recent years because of its potential to aid in the diagnosis and management of disease that is tailored to the patient, creating a “digital twin” (Corral-Acero et al., 2020) or a virtual representation of an individual’s overall health. Thus, various modeling frameworks have employed subject-specific methods (Krishnamurthy et al., 2013; Miller et al., 2021). Here, cardiac and vascular nominal parameter sets ensure subject-specific predictions given available routinely collected clinical data, such as blood pressure, HR, LV volumes from echocardiograms, and RV and pulmonary pressures from right heart catheterization. In the future, additional measurements, such as ventricular wall thickness determined from imaging data in subjects with HR, can be used to inform model parameters a priori. In this study, we have parameterized the model for a general subject with the data from Table 1. However, through our methodology, virtually any subject-specific CVS measurements can be substituted for the representative data presented and used here. Moreover, we have demonstrated the ability of the model to adapt to different heart sizes by scaling EDV to directly achieve different EDPVRs (Figure 2), computationally demonstrating the phenomenon described by Klotz. Thus, we believe this model with the parameterization developed here has many potential applications in the analysis of various CVS disease states. Though other studies have proposed frameworks for parameterizing systemic and pulmonary circulations (Marquis et al., 2018; Jones et al., 2021), to our knowledge this is the first comprehensive subject-specific parameterization of the TriSeg model. Future work includes using this model in conjunction with subject data, such as exercise data in subjects with HF, to create patient-specific models and investigate these mechanisms in different disease states.
We propagated several assumptions from the TriSeg model including spherical ventricular geometries and sarcomere length-tension relationships from isolated rat cardiac muscles. In this study, we used a simplified circulatory system that lacks compensatory and regulatory mechanisms, such as the baroreflex (Jezek et al., 2022). However, to overcome this, we employed compensatory volume overload as a surrogate, showing similar regulatory effects. For simplicity, we have not explicitly modeled the atria but instead incorporated the volumes occupied by the left and right atria into the venous and systemic venous compartments, respectively. Thus, the atrial volume does not contribute to the overall pericardial volume in this model which leads to a slightly different behavior in vivo. However, the pericardium still comes into effect at higher volumes. Future work can include the incorporation of atria as well as further investigation into modeling pericardial dynamics. By modeling only forward blood flow through the heart valves, we have ignored phenomena, such as valve regurgitation (Havlenova et al., 2021), to maintain focus on the interaction between the ventricles as high pressure develops during HF. The impact of valve regurgitation in disease is an active area of research (Korakianitis and Shi, 2006; Blanco and Feijóo, 2010; Pant et al., 2016; Chabiniok et al., 2017; Sacks et al., 2019). Future work includes modeling this phenomenon in this system and its impact on VVI. More biophysically based models may be able to explain the observed phenomena in a more detailed fashion. Here we present a simple, low-order model to conduct our initial investigations, but our modeling framework allows for the flexibility to integrate with more detailed models as in (Hunter et al., 1998; Lumens et al., 2009; Niederer, Campbell, and Campbell, 2019; Beard et al., 2022). Lastly while there are limitations to this idealized subject forward-modeling approach, we reference published data and results to corroborate the model outputs and results, and the updated parameterization of the model facilitates the use of clinical data and subject-specific modeling in the future.
Further model validation routes include identification of the model data from clinical and preclinical studies. Clinical data may include right heart catheterization and echocardiograms from HFpEF patients to which the model could be fit using the approach described in Jones et al. (2021). Additionally, future experiments in which simultaneous biventricular pressure-volume loops and septal curvature data are obtained under baseline conditions, with volume loading, and during various perturbations to LV and RV free wall mechanics would provide key evidence to test the hypotheses inherent in the model.
In this study, we developed and parameterized a subject-specific mathematical model of cardiovascular function and biventricular mechanics to investigate several modes of heart failure, including systolic and diastolic dysfunction of the left and right ventricles. In acute LV systolic and diastolic dysfunction, the simulations captured RV compensation with systemic volume loading to maintain stroke volume and mean arterial blood pressure. In RV systolic and diastolic dysfunction, RV dilation and volume overload impaired LV filling, resulting in an LV diastolic dysfunction caused by mechanical interventricular interactions rather than LV myocardial stiffening. We also observed that three of the dysfunction simulations (LV diastolic dysfunction, RV systolic and diastolic dysfunction) exhibited phenotypes seen in HFpEF, suggesting multiple modes of heart failure in HFpEF, which is consistent with and may help to explain the clinical heterogeneity of HFpEF. More defined diagnostic sub-categories of HFpEF will allow for the development of targeted treatments and improved outcomes of this disease.
The original contributions presented in the study are included in the article/Supplementary Materials, further inquiries can be directed to the corresponding authors.
SK: Conceptualization, methodology, software, validation, formal analysis, data curation and visualization, writing—original draft, writing—review and editing. ER: Conceptualization, methodology, software, validation, formal analysis, data curation and visualization, writing—original draft, writing—review and editing. FJ: Conceptualization, methodology, software, validation, data curation and visualization, writing—review and editing. DB: Development and planning of project, development of simulation codes, drafting and revising of the manuscript. NC: Conceptualization, development and planning of project, editing and revising of the manuscript. All authors contributed to the article and approved the submitted version.
NIH T32HL116270 (SK), and NIH T32HL00785322 (ER), NIH R01HL154624 (NC and DB), NIH R01HL147590 (NC).
The authors declare that the research was conducted in the absence of any commercial or financial relationships that could be construed as a potential conflict of interest.
All claims expressed in this article are solely those of the authors and do not necessarily represent those of their affiliated organizations, or those of the publisher, the editors and the reviewers. Any product that may be evaluated in this article, or claim that may be made by its manufacturer, is not guaranteed or endorsed by the publisher.
The Supplementary Material for this article can be found online at: https://www.frontiersin.org/articles/10.3389/fphys.2023.1231688/full#supplementary-material
The run-time environment of the model is MATLAB 2021b. A release of the model codes can be found at DOI: 10.5281/zenodo.8248116 and updates can be found at https://github.com/sallakim/ventricular-interdependence-simulations.
CPO, Cardiac power output; CVS, Cardiovascular system; DBP, Arterial diastolic blood pressure; DD, Diastolic dysfunction; EDP End-diastolic pressure; EDV, End-diastolic volume; EDPVR, End-diastolic pressure-volume relationship; ESP, End-systolic pressure; ESV, End-systolic volume; ESPVR, end-systolic pressure-volume relationship; HF, Heart failure; HFrEF, Heart failure with reduced ejection fraction; HFpEF, Heart failure with preserved ejection fraction; HFmrEF, Heart failure with mid-range ejection fraction; HR, Heart rate; LW, Left ventricular free wall; LV, Left ventricle; M, Moderate; RW, Right ventricular free wall; RV, Right ventricle; S, Severe; SBP, Arterial systolic blood pressure; SD, Systolic dysfunction; SW, Septal wall; TriSeg Three-segment biventricular model; VVI, Ventricular-ventricular interactions.
Aurigemma G. P., Zile M. R., Gaasch W. H. (2006). Contractile behavior of the left ventricle in diastolic heart failure: with emphasis on regional systolic function. Circulation 113, 296–304. doi:10.1161/CIRCULATIONAHA.104.481465
Beard D. A., Marzban B., Li O. Y., Campbell K. S., Janssen P. M. L., Chesler N. C., et al. (2022). Reduced cardiac muscle power with low ATP simulating heart failure. Biophys. J. 121, 3213–3223. doi:10.1016/j.bpj.2022.07.029
Beneken J. E. W. (1979). A physical approach to hemodynamic aspects of the human cardiovascular system. PA, USA: W. B. Saunders.
Berglund F., Piña P., CésarHerrera J. (2020). Right ventricle in heart failure with preserved ejection fraction. Heart 106, 1798–1804. doi:10.1136/heartjnl-2020-317342
Blanco P. J., Feijóo R. A. (2010). A 3D-1D-0D computational model for the entire cardiovascular system. Mecánica Comput. 29, 5887–5911.
Borlaug B. A., Nishimura R. A., Sorajja P., Lam C. S., Redfield M. M. (2010). 'Exercise hemodynamics enhance diagnosis of early heart failure with preserved ejection fraction. Circ. Heart Fail 3, 588–595. doi:10.1161/CIRCHEARTFAILURE.109.930701
Bosch L., Lam C. S. P., Gong L., Chan S. P., Sim D., Yeo D., et al. (2017). Right ventricular dysfunction in left-sided heart failure with preserved versus reduced ejection fraction. Eur. J. Heart Fail. 19, 1664–1671. doi:10.1002/ejhf.873
Bouchard R. J., Jamesgault H., John R. (1971). Evaluation of pulmonary arterial end-diastolic pressure as an estimate of left ventricular end-diastolic pressure in patients with normal and abnormal left ventricular performance. Circulation 44, 1072–1079. doi:10.1161/01.cir.44.6.1072
Brookes C., Ravn H., White P., Moeldrup U., Oldershaw P., Redington A. (1999). Acute right ventricular dilatation in response to ischemia significantly impairs left ventricular systolic performance. Circulation 100, 761–767. doi:10.1161/01.cir.100.7.761
Burkhoff D., Mirsky I., Suga H. (2005). Assessment of systolic and diastolic ventricular properties via pressure-volume analysis: a guide for clinical, translational, and basic researchers. Am. J. Physiol. Heart Circ. Physiol. 289, H501–H512. doi:10.1152/ajpheart.00138.2005
Chabiniok R., Moireau P., Kiesewetter C., Hussain T., Razavi R., Chapelle D. (2017). Assessment of atrioventricular valve regurgitation using biomechanical cardiac modeling. Cham: Springer International Publishing, 401–411.
Chemla D., Castelain V., Hervé P., Lecarpentier Y., Brimioulle S. (2002). Haemodynamic evaluation of pulmonary hypertension. Eur. Respir. J. 20, 1314–1331. doi:10.1183/09031936.02.00068002
Clay S., Alfakih K., Radjenovic A., Jones T., Ridgway J. P., Sinvananthan M. U. (2006). Normal range of human left ventricular volumes and mass using steady state free precession MRI in the radial long axis orientation. Magma 19, 41–45. doi:10.1007/s10334-005-0025-8
Comunale G., Peruzzo P., Castaldi B., Razzolini R., Di Salvo G., Padalino M. A., et al. (2021). Understanding and recognition of the right ventricular function and dysfunction via a numerical study. Sci. Rep. 11, 3709. doi:10.1038/s41598-021-82567-9
Corral-Acero J., Margara F., Marciniak M., Rodero C., Loncaric F., Feng Y., et al. (2020). The 'Digital Twin' to enable the vision of precision cardiology. Eur. Heart J. 41, 4556–4564. doi:10.1093/eurheartj/ehaa159
Damiano R. J., La Follette P., Cox J. L., Lowe J. E., Santamore W. P. (1991). Significant left ventricular contribution to right ventricular systolic function. Am. J. Physiol. 261, H1514–H1524. doi:10.1152/ajpheart.1991.261.5.H1514
de Tombe P. P., ter Keurs H. E. (2016). Cardiac muscle mechanics: sarcomere length matters. J. Mol. Cell. Cardiol. 91, 148–150. doi:10.1016/j.yjmcc.2015.12.006
Dunlay S. M., Roger V. L., Redfield M. M. (2017). Epidemiology of heart failure with preserved ejection fraction. Nat. Rev. Cardiol. 14, 591–602. doi:10.1038/nrcardio.2017.65
Fincke R., Hochman J. S., Lowe A. M., Menon V., Slater J. N., Webb J. G., et al. (2004). Cardiac power is the strongest hemodynamic correlate of mortality in cardiogenic shock: a report from the SHOCK trial registry. J. Am. Coll. Cardiol. 44, 340–348. doi:10.1016/j.jacc.2004.03.060
Fudim M., Sobotka P. A., Dunlap M. E. (2021). Extracardiac abnormalities of preload reserve: mechanisms underlying exercise limitation in heart failure with preserved ejection fraction, autonomic dysfunction, and liver disease. Circ. Heart Fail. 14, e007308. doi:10.1161/CIRCHEARTFAILURE.120.007308
GanTji-Joong C., Lankhaar J-W., Tim Marcus J., Westerhof N., Bronzwaer M. J., Boonstra A., et al. (2006). Impaired left ventricular filling due to right-to-left ventricular interaction in patients with pulmonary arterial hypertension. Am. J. Physiology-Heart Circulatory Physiology 290, H1528–H1533. doi:10.1152/ajpheart.01031.2005
Golob M., Moss R. L., Chesler N. C. (2014). Cardiac tissue structure, properties, and performance: a materials science perspective. Ann. Biomed. Eng. 42, 2003–2013. doi:10.1007/s10439-014-1071-z
Gorter T. M., Rienstra M., van Veldhuisen D. J. (2017). Right ventricular dysfunction in heart failure with reduced vs. preserved ejection fraction: non-identical twins? Eur. J. Heart Fail. 19, 880–882. doi:10.1002/ejhf.691
Hardegree E. L., Sachdev A., Fenstad E. R., Villarraga H. R., Frantz R. P., McGoon M. D., et al. (2013). Impaired left ventricular mechanics in pulmonary arterial hypertension: identification of a cohort at high risk. Circ. Heart Fail. 6, 748–755. doi:10.1161/CIRCHEARTFAILURE.112.000098
Havlenova T., Skaroupkova P., Miklovic M., Behounek M., Chmel M., Jarkovska D., et al. (2021). Right versus left ventricular remodeling in heart failure due to chronic volume overload. Sci. Rep. 11, 17136. doi:10.1038/s41598-021-96618-8
Hegemann N., Primessnig U., Bode D., Wakula P., Beindorff N., Klopfleisch R., et al. (2021). Right-ventricular dysfunction in HFpEF is linked to altered cardiomyocyte Ca(2+) homeostasis and myofilament sensitivity. Esc. Heart Fail 8, 3130–3144. doi:10.1002/ehf2.13419
Henderson Y., Prince A. L. (1914). The relative systolic discharges of the right and left ventricles and their bearing on pulmonary congestion and depletion. Heart 5, 1913–1914.
Hunter P. J., McCulloch A. D., ter Keurs H. E. D. J. (1998). Modelling the mechanical properties of cardiac muscle. Prog. Biophysics Mol. Biol. 69, 289–331. doi:10.1016/s0079-6107(98)00013-3
Janssen P. M. (2010). Kinetics of cardiac muscle contraction and relaxation are linked and determined by properties of the cardiac sarcomere. Am. J. Physiol. Heart Circ. Physiol. 299, H1092–H1099. doi:10.1152/ajpheart.00417.2010
Jezek F., Randall E. B., Carlson B. E., Beard D. A. (2022). Systems analysis of the mechanisms governing the cardiovascular response to changes in posture and in peripheral demand during exercise. J. Mol. Cell. Cardiol. 163, 33–55. doi:10.1016/j.yjmcc.2021.09.013
Jones E., Randall E. B., Hummel S. L., Cameron D. M., Beard D. A., Carlson B. E. (2021). Phenotyping heart failure using model-based analysis and physiology-informed machine learning. J. Physiol. 599, 4991–5013. doi:10.1113/JP281845
Kadry K., Pagoulatou S., Mercier Q., Rovas G., Bikia V., Müller H., et al. (2020). Biomechanics of diastolic dysfunction: a one-dimensional computational modeling approach. Am. J. Physiol. Heart Circ. Physiol. 319, H882-H892–h92. doi:10.1152/ajpheart.00172.2020
Klotz S., Hay I., Dickstein M. L., Yi G. H., Wang J., Maurer M. S., et al. (2006). Single-beat estimation of end-diastolic pressure-volume relationship: a novel method with potential for noninvasive application. Am. J. Physiol. Heart Circ. Physiol. 291, H403–H412. doi:10.1152/ajpheart.01240.2005
Knight D. S., Steeden J. A., Moledina S., Jones A., Coghlan J. G., Muthurangu V. (2015). Left ventricular diastolic dysfunction in pulmonary hypertension predicts functional capacity and clinical worsening: a tissue phase mapping study. J. Cardiovasc. Magnetic Reson. 17, 116. doi:10.1186/s12968-015-0220-3
Korakianitis T., Shi Y. (2006). Numerical simulation of cardiovascular dynamics with healthy and diseased heart valves. J. Biomech. 39, 1964–1982. doi:10.1016/j.jbiomech.2005.06.016
Krishnamurthy A., Villongco C. T., Chuang J., Frank L. R., Nigam V., Belezzuoli E., et al. (2013). Patient-Specific models of cardiac biomechanics. J. Comput. Phys. 244, 4–21. doi:10.1016/j.jcp.2012.09.015
Lampert B. C. (2018). “Right heart catheterization,” in Encyclopedia of cardiovascular research and medicine. Editors R. S. Vasan, and D. B. Sawyer (Oxford: Elsevier).
Landsberg J. W. (2018). “Chapter 6 - heart failure for the pulmonary critical care physician,” in Manual for pulmonary and critical care medicine. Editor J. W. Landsberg (Elsevier).
Lekavich C. L., Barksdale D. J., Neelon V., Wu J. R. (2015). Heart failure preserved ejection fraction (HFpEF): an integrated and strategic review. Heart Fail Rev. 20, 643–653. doi:10.1007/s10741-015-9506-7
Lumens J., Delhaas T., Kirn B., Arts T. (2009). Three-wall segment (TriSeg) model describing mechanics and hemodynamics of ventricular interaction. Ann. Biomed. Eng. 37, 2234–2255. doi:10.1007/s10439-009-9774-2
Marquis A. D., ArnoldCaron Dean-Bernhoft A., Olufsen M. S., Olufsen M. S. (2018). Practical identifiability and uncertainty quantification of a pulsatile cardiovascular model. Math. Biosci. 304, 9–24. doi:10.1016/j.mbs.2018.07.001
Miller R., Kerfoot E., Mauger C., Ismail T. F., Young A. A., Nordsletten D. A. (2021). An implementation of patient-specific biventricular mechanics simulations with a deep learning and computational pipeline. Front. Physiology 12, 716597. doi:10.3389/fphys.2021.716597
Miller W. L. (2016). Fluid volume overload and congestion in heart failure: time to reconsider pathophysiology and how volume is assessed. Circ. Heart Fail. 9, e002922. doi:10.1161/CIRCHEARTFAILURE.115.002922
Murphy S. P., Ibrahim N. E., Januzzi J. L. (2020). Heart failure with reduced ejection fraction: a review. JAMA 324, 488–504. doi:10.1001/jama.2020.10262
Naeije R., Badagliacca R. (2017). The overloaded right heart and ventricular interdependence. Cardiovasc. Res. 113, 1474–1485. doi:10.1093/cvr/cvx160
Niederer S. A., Campbell K. S., Campbell S. G. (2019). A short history of the development of mathematical models of cardiac mechanics. J. Mol. Cell. Cardiol. 127, 11–19. doi:10.1016/j.yjmcc.2018.11.015
Padsalgikar A. D. (2017). “Cardiovascular system: structure, assessment, and diseases,” in Plastics in medical devices for cardiovascular applications. Editor A. D. Padsalgikar (William Andrew Publishing).
Palau-Caballero G., Walmsley J., Van Empel V., Lumens J., Delhaas T. (2017). Why septal motion is a marker of right ventricular failure in pulmonary arterial hypertension: mechanistic analysis using a computer model. Am. J. Physiology-Heart Circulatory Physiology 312, H691-H700–H700. doi:10.1152/ajpheart.00596.2016
Pant S., Corsini C., Baker C., Hsia T-Y., Pennati G., IreneVignon-Clementel E., et al. (2016). Data assimilation and modelling of patient-specific single-ventricle physiology with and without valve regurgitation. J. Biomechanics 49, 2162–2173. doi:10.1016/j.jbiomech.2015.11.030
Pfeffer M. A., Shah A. M., Borlaug B. A. (2019). Heart failure with preserved ejection fraction in perspective. Circulation Res. 124, 1598–1617. doi:10.1161/CIRCRESAHA.119.313572
Puwanant S., Park M., Popović Z. B., Tang W. H. W., Farha S., George D., et al. (2010). Ventricular geometry, strain, and rotational mechanics in pulmonary hypertension. Circulation 121, 259–266. doi:10.1161/CIRCULATIONAHA.108.844340
Rodriguez E. K., Hunter W. C., Royce M. J., Leppo M. K., Douglas A. S., Weisman H. F. (1992). A method to reconstruct myocardial sarcomere lengths and orientations at transmural sites in beating canine hearts. Am. J. Physiol. 263, H293–H306. doi:10.1152/ajpheart.1992.263.1.H293
Rommel K-P., von Roeder M., Oberueck C., Latuscynski K., Besler C., Blazek S., et al. (2018). Load-independent systolic and diastolic right ventricular function in heart failure with preserved ejection fraction as assessed by resting and handgrip exercise pressure-volume loops. Circ. Heart Fail. 11, e004121. doi:10.1161/CIRCHEARTFAILURE.117.004121
Sacks M. S., Drach A., Lee C-H., Khalighi A. H., Rego B. V., Zhang W., et al. (2019). On the simulation of mitral valve function in health, disease, and treatment. J. Biomechanical Eng. 141, 0708041–07080422. doi:10.1115/1.4043552
Santamore W. P., Lynch P. R., Heckman J. L., Bove A. A., Meier G. D. (1976). Left ventricular effects on right ventricular developed pressure. J. Appl. Physiol. 41, 925–930. doi:10.1152/jappl.1976.41.6.925
Santens B., Van De Bruaene A., De Meester P., D'Alto M., Reddy S., Bernstein D., et al. (2020). Diagnosis and treatment of right ventricular dysfunction in congenital heart disease. Cardiovasc Diagn Ther. 10, 1625–1645. doi:10.21037/cdt-20-370
Schwarz K., Singh S., Dawson D., MichaelFrenneaux P. (2013). Right ventricular function in left ventricular disease: pathophysiology and implications. Heart, Lung Circulation 22, 507–511. doi:10.1016/j.hlc.2013.03.072
Sharma K., Kass D. A. (2014). Heart failure with preserved ejection fraction: mechanisms, clinical features, and therapies. Circulation Res. 115, 79–96. doi:10.1161/CIRCRESAHA.115.302922
Sicard P., Jouitteau T., Andrade-Martins T., Massad A., Rodrigues de Araujo G., David H., et al. (2019). Right coronary artery ligation in mice: a novel method to investigate right ventricular dysfunction and biventricular interaction. Am. J. Physiol. Heart Circ. Physiol. 316, H684-H692–h92. doi:10.1152/ajpheart.00573.2018
Stojnic B. B., Brecker S. J. D., Xiao H. B., Helmy S. M., Mbaissouroum M., Gibson D. G. (1992). Left ventricular filling characteristics in pulmonary hypertension: a new mode of ventricular interaction. Br. Heart J. 68, 16–20. doi:10.1136/hrt.68.7.16
Vasan R. S., Larson M. G., Leip E. P., Evans J. C., O'Donnell C. J., Kannel W. B., et al. (2001). Impact of high-ormal blood pressure on the risk of cardiovascular disease. N. Engl. J. Med. 345, 1291–1297. doi:10.1056/NEJMoa003417
Ventetuolo C. E., Klinger J. R. (2014). Management of acute right ventricular failure in the intensive care unit. Ann. Am. Thorac. Soc. 11, 811–822. doi:10.1513/AnnalsATS.201312-446FR
VonkKelly Marie Chin N. A., Haddad F., Hassoun P. M., Hemnes A. R., Roberta Hopkins S., Kawut S. M., et al. (2019). 'Pathophysiology of the right ventricle and of the pulmonary circulation in pulmonary hypertension: an update. Eur. Respir. J. 53, 1801900. doi:10.1183/13993003.01900-2018
Keywords: ventricular interdependence, right ventricular dysfunction, systolic dysfunction, diastolic dysfunction, heart failure with preserved ejection fraction, computational modeling
Citation: Kim SM, Randall EB, Jezek F, Beard DA and Chesler NC (2023) Computational modeling of ventricular-ventricular interactions suggest a role in clinical conditions involving heart failure. Front. Physiol. 14:1231688. doi: 10.3389/fphys.2023.1231688
Received: 30 May 2023; Accepted: 09 August 2023;
Published: 06 September 2023.
Edited by:
Lik Chuan Lee, Michigan State University, United StatesReviewed by:
Mike Moulton, University of Nebraska Medical Center, United StatesCopyright © 2023 Kim, Randall, Jezek, Beard and Chesler. This is an open-access article distributed under the terms of the Creative Commons Attribution License (CC BY). The use, distribution or reproduction in other forums is permitted, provided the original author(s) and the copyright owner(s) are credited and that the original publication in this journal is cited, in accordance with accepted academic practice. No use, distribution or reproduction is permitted which does not comply with these terms.
*Correspondence: Salla M. Kim, c2FsbGFrQHVjaS5lZHU= E. Benjamin Randall, ZWJlbmphbWlucmFuZGFsbEBnbWFpbC5jb20= Naomi C. Chesler, bmNoZXNsZXJAdWNpLmVkdQ==
†These authors have contributed equally to this work and share first authorship
Disclaimer: All claims expressed in this article are solely those of the authors and do not necessarily represent those of their affiliated organizations, or those of the publisher, the editors and the reviewers. Any product that may be evaluated in this article or claim that may be made by its manufacturer is not guaranteed or endorsed by the publisher.
Research integrity at Frontiers

Learn more about the work of our research integrity team to safeguard the quality of each article we publish.