 Lyvia R. Bowering
 Tristan J. McArley1
 Anthony J. R. Hickey
 Neill A. Herbert
95% of researchers rate our articles as excellent or good
Learn more about the work of our research integrity team to safeguard the quality of each article we publish.
Find out more
ORIGINAL RESEARCH article
Front. Physiol. , 17 July 2023
Sec. Environmental, Aviation and Space Physiology
Volume 14 - 2023 | https://doi.org/10.3389/fphys.2023.1215442
This article is part of the Research Topic Impact of Climate Change on Coastal Environmental Variability and Aquatic Physiology View all 5 articles
Marine organisms are under threat from a simultaneous combination of climate change stressors, including warming sea surface temperatures (SST), marine heatwave (MHW) episodes, and hypoxic events. This study sought to investigate the impacts of these stressors on the Australasian snapper (C. auratus) — a finfish species of high commercial and recreational importance, from the largest snapper fishery in Aotearoa New Zealand (SNA1). A MHW scenario was simulated from 21°C (current February SST average for north-eastern New Zealand) to a future predicted level of 25°C, with the whole-animal and mitochondrial metabolic performance of snapper in response to hypoxia and elevated temperature tested after 1-, 10-, and 30-days of thermal challenge. It was hypothesised that key indicators of snapper metabolic performance would decline after 1-day of MHW stress, but that partial recovery might arise as result of thermal plasticity after chronic (e.g., 30-day) exposures. In contrast to this hypothesis, snapper performance remained high throughout the MHW: 1) Aerobic metabolic scope increased after 1-day of 25°C exposure and remained high. 2) Hypoxia tolerance, measured as the critical O2 pressure and O2 pressure where loss of equilibrium occurred, declined after 1-day of warm-acclimation, but recovered quickly with no observable difference from the 21°C control following 30-days at 25°C. 3) The performance of snapper mitochondria was also maintained, with oxidative phosphorylation respiration and proton leak flux across the inner mitochondrial membrane of the heart remaining mostly unaffected. Collectively, the results suggest that heart mitochondria displayed resilience, or plasticity, in snapper chronically exposed to 25°C. Therefore, contrary to the notion of climate change having adverse metabolic effects, future temperatures approaching 25°C may be tolerated by C. auratus in Northern New Zealand. Even in conjunction with supplementary hypoxia, 25°C appears to represent a metabolically optimal temperature for this species.
Increased and more variable sea surface temperatures (SST) and intensification of hypoxia are amongst the list of marine stressors projected to worsen with climate change (Diaz & Breitburg, 2009; Pisano et al., 2020). Marine heatwaves (MHW), defined as an extended timeframe of excessively warm water temperatures, are increasing in frequency, intensity, and persistence (Hobday et al., 2018; Oliver et al., 2018). Recent MHWs have impacted marine ecosystems (Thomsen et al., 2019; Bell et al., 2023) and fisheries (Mills et al., 2013; Pershing et al., 2015) and are thought to be of a greater ecological concern than the forecasted gradual SST increase (Frölicher et al., 2018; Frölicher & Laufkötter, 2018; Smale et al., 2019). Climate change, along with continued urban and agricultural expansion, is also expected to intensify instances of hypoxia—particularly in coastal and estuarine ecosystems—as levels of dissolved O2 less than <55% air saturation become more frequent (Diaz, 2001; Vaquer-Sunyer & Duarte, 2008; Diaz & Breitburg, 2009). Low dissolved O2, whilst commonly caused by anthropogenic activity, can also occur as a result of natural processes, such as eutrophication from coastal upwelling and from diel-cycling in shallow estuarine systems, where respiration at night creates hypoxia in the absence of photosynthesis (McNatt & Rice, 2004; Baumann et al., 2015). However, climate change stressors are not expected to occur in isolation (Boyd et al., 2015). For example, the challenge of high temperature in aquatic environments frequently co-occurs with hypoxia, as increased water temperature decreases the solubility of O2 in water, reduces O2 mixing as a result of water column stratification, and elevates the respiratory O2 demands of aquatic organisms (Diaz & Breitburg, 2009; Altieri & Gedan, 2015).
Aerobic metabolic performance is thought to be a key driver of thermal tolerance (Pörtner, 2001) and is a major consideration in our understanding of climate change impact, because the metabolic mass specific oxygen consumption rate
Elevated temperatures that combine with hypoxia represent a realistic environmental condition under climate change, but there is a paucity of information on their combined effects. Increased temperature increases O2 demand; but the simultaneous occurrence of hypoxic conditions limits O2 supply, ultimately leading to a lowered rate of ATP production through oxidative phosphorylation (OXPHOS) (Devaux et al., 2019). In the absence of oxygen, some ATP can be generated via anaerobic metabolism, but this pathway is far less efficient than aerobic metabolism and can only generate ∼2 net ATP per unit of glucose compared to ∼32–36 via OXPHOS (Lehninger et al., 1993; Goldhaber, 1997; Chaudhry & Varacallo, 2018). Tissues demanding high levels of ATP, such as the heart, can only maintain anaerobic metabolism for short periods of time, while O2 debt and lactate will accumulate rapidly (Goolish, 1989; Gleeson, 1996). Constraints on whole animal metabolic components by temperature and hypoxia are also apparent. For example, MS is constrained at supra-maximal temperatures (outlined above) but is also suppressed by hypoxia, as MMR is directly limited by O2 availability (Fu et al., 2022). At extreme low O2 levels, the O2-dependent decline in MMR will eventually meet SMR (i.e., MS = 0) and the partial pressure of O2 (PO2) where this point of transect occurs is defined as the critical oxygen pressure (Pcrit) (Wu, 2002). Survival is extremely time-limited at a PO2 below Pcrit, as basal metabolic processes cannot be supported and the fish will rapidly reach PLOE—the PO2 at which an upright posture cannot be maintained and loss of equilibrium occurs (Mandic et al., 2013). For any study seeking to resolve the combined effects of MHW and hypoxia (e.g., hypoxia tolerance during MHW scenarios), Pcrit and PLOE will thus likely serve as useful functional indicators. Indeed, hypoxia-tolerant species are generally endowed with lower Pcrit and PLOE values (Wu, 2002; Rogers et al., 2016; McArley et al., 2019; Seibel et al., 2021) but Pcrit is almost always higher at elevated temperatures, suggesting that MHW scenarios would be expected to lower hypoxia tolerance (Rogers et al., 2016).
The Australasian snapper (Chrysophrys auratus, or tāmure in te reo Māori) is a finfish species of high cultural, economic, and recreational importance to New Zealand (Bradford, 1999; Leach, 2006; Mossman, 2008). Indeed, the largest snapper fishery in New Zealand, SNA1 (encompassing the Hauraki Gulf, Bay of Plenty, and east coast of Northland) has a total allowable catch of 8,050 t commercially and 3,050 t recreationally (MPI, 2021). With a wide habitat distribution throughout both New Zealand and Australia, snapper are found in nearly all inshore habitats down to 200 m (Leach, 2006; Parsons et al., 2014) and, like many other sparids, encounter a broad range of natural temperatures (Francis, 1994b; Sim-Smith et al., 2013a; Parsons et al., 2014; Wakefield et al., 2015; Flikac et al., 2020; Cook et al., 2021). For example, this species has a distribution extending north to Mackay, where maximal SSTs can reach 30°C (Ferrell & Sumpton, 1993; AIMS, 2023). Temperature has important implications for the fitness, spawning, and recruitment of this species (Crossland, 1977; Scott & Pankhurst, 1992; Francis, 1993; Scott et al., 1993; Francis, 1994a; Francis, 1997; Fielder et al., 2005; Sim-Smith et al., 2013b). Snapper have been shown to be physiologically resilient to a number of stressors, including turbidity (Cumming & Herbert, 2016), high carbon dioxide (McMahon et al., 2019; 2020), and angling stress (McArley & Herbert, 2014). Whilst past research has shown snapper to be only moderately hypoxia tolerant (in terms of Pcrit), this species does not proactively avoid low O2 and will voluntarily continue to enter hypoxic water until physiological alarms are apparent (Cook et al., 2011; Cook & Herbert, 2012). Snapper are one of the widest studied fish species in New Zealand (Parsons et al., 2014) but knowledge about how they will respond to future climate change scenarios is limited. One study sought to examine the physiological impacts of a MHW on SNA1 larval snapper (McMahon et al., 2019) but, to the best of our knowledge, the 1) physiological impacts of a MHW and 2) combined effects of simultaneous hypoxia and high temperature on juvenile snapper remains unknown. With limited knowledge of thermal tolerance for this species it was assumed that snapper would struggle to cope with elevated temperatures beyond current day conditions.
This study aimed to investigate the metabolic and hypoxic tolerance of juvenile snapper from the SNA1 population by employing whole-animal (in vivo) and mitochondrial (in situ) approaches. Fish were sampled after 1 day, 10 days, and 30 days of 25°C MHW exposure and all comparisons were made against a stable 21°C control level. The study aimed to answer the following set of questions: 1) How does the metabolism of snapper change and cope in response to the thermal stress of a MHW? 2) Are the physiological reactions of snapper to MHW stress different over acute and chronic heat exposure timescales? 3) How do snapper cope when a secondary stress of acute hypoxia is applied to MHW stress? 4) Do the responses of snapper to questions (1–3) align in terms of whole-animal and mitochondrial levels of respiration? Heart mitochondria were examined because the heart of fish is usually the first organ to fail at critically high temperatures (Iftikar & Hickey, 2013) and is therefore the rate limiting organ for thermal tolerance. The overarching hypothesis was that the metabolic performance of snapper would decline when faced with MHW and hypoxic stress. For example, a reduced MS (McArley et al., 2017), increased Pcrit (Schurmann & Steffensen, 1997; Collins et al., 2013), and increased mitochondrial membrane leak (Iftikar et al., 2014) were all expected after 1-day of MHW exposure, followed by partial recovery due to thermal plasticity and acclimation after 30-days chronic 25°C exposure. Understanding the response of juvenile snapper within the Hauraki Gulf of New Zealand to thermal and hypoxic stress is vital to the management of this species and the SNA1 fishery, as this area is susceptible to MHWs (Bell et al., 2023) and hypoxia (Zeldis et al., 2022).
Juvenile snapper (C. auratus, mean fork length (±SE) 16.9 ± 0.30 cm, body mass 114 ± 5.9 g) were caught on barbless hook and line in inshore waters (ca. 2-3 m) at Matheson’s Bay, north-eastern New Zealand, in February 2022. Following capture, fish were randomly divided between five 500 L PVC tanks with flow through filtered seawater (21°C, air saturated, 200 μm filtered, 35 ppt salinity) at the Leigh Marine Laboratory and left to acclimate (at 21°C) for just over 5 weeks. Housing was indoors with a 12 light: 12 dark artificial photoperiod. Fish were fed three times per week to satiation on crushed water-soaked commercial fish feed pellets (Ocean King 500 6.5 mm, Biomar, Tasmania, AUS). Tank water temperatures were controlled using outdoor 10–25 kW heat pumps. All experimental techniques were conducted under the approval of the University of Auckland Animal Ethics Committee (approval: 23357).
At the end of the 5-week acclimation period, five experimental groups were initiated and sampled as follows: an initial 21°C control, 25°C exposure for 1 day, 25°C for 10 days, 25°C for 30 days (chronic), and a second 21°C control maintained throughout the entire experiment to day 30 (with sampling at day 30 to control for the extra time of captivity). The background (control) summertime temperature of the current study was set to 21°C, as this is the reported the present-day (2005–2011) mean February SST for the Hauraki Gulf (Evans & Atkins, 2013). The Hauraki Gulf was in a chronic MHW state for 29 weeks from 2021 to 2022, whereby SST was +2°C for ∼200 days (Bell et al., 2023). Our MHW level was selected at 25°C because the greatest SST anomaly of this 2021–2022 Hauraki Gulf MHW was +3.77°C (Bell et al., 2023) from the average summertime SST of 21°C. This indicates that the chosen level of temperature change and durations of chronic exposures are ecologically relevant. The desired temperatures over different experimental time periods were maintained with 10–25 kW heat pumps. Fish were allocated to the groups at random (12 fish per group, n = 60 total).
To investigate the effect of (a) high temperature acclimation and (b) hypoxia (as a secondary stressor) on snapper across a range of physiological levels, a set protocol was applied to each individual fish in the 5 treatment groups, which progressed in the following manner over a 2.5-day assessment period: 1) Transfer of individual fish to a respirometer followed by an overnight measure of standard metabolic rate (SMR) using respirometry. 2) Hypoxia challenge. 3) Overnight recovery. 4) Exhaustive chase followed by respirometry to resolve maximum metabolic rate (MMR). 5) Fast removal of fish from the respirometer, followed by euthanasia and immediate blood, tissue, and organ sampling. 6) Heart tissue mitochondrial assays. The methods involved in 1–6 are outlined in detail below.
Two 21°C tanks (labelled tanks 1 and 2 for the purpose of description here) were held constant at 21°C with no thermal adjustment. There were three 25°C treatment tanks (labelled tanks 3, 4, and 5) that were thermally ramped in the same way from 21°C to 25°C with an increase of 1°C per hour. Only 4 fish could be run simultaneously through the respirometry and mitochondrial assays, over a 3-day period. Thus, the start of thermal ramping for each of the three 25°C tanks was staggered in time (i.e., the increase in temperature occurred 3 days apart per tank). One-third of the fish for each of the three 25°C treatments (4 fish) were therefore sampled from each of the three 25°C holding tanks. For example, in the case of the 25°C 1 day treatment, the first 4 fish were randomly sampled from tank 3. Three days later the second 4 fish were taken from tank 4. The final 4 fish from tank 5 were sampled 3 days later. The same protocol was followed for the 25°C 10 day and 25°C 30 day treatment but the ordering from tanks 3–5 was mixed. Staggering the thermal acclimation across the tanks in such a way ensured that the allocated timeline of fish sampling after 1-, 10-, and 30-days at 25°C was exact and that fish were sampled from the 3 tanks in a randomised manner. This design was also initiated to avoid tank effects because all 3 tanks provided fish to each of the three 25°C treatments and was thus considered more robust than having each treatment attributed to only 1 tank and inexact sampling at days 1, 10 and 30. This method of staggering was also applied to the two 21°C control tanks (tanks 1 and 2) meaning that each control treatment (n = 12) were sampled at the appropriate time from two tanks. Again, this ensured exact sampling time and avoided tank effects because sampling was randomised between multiple tanks.
Automated intermittent flow respirometry (Steffensen, 1989; Cumming & Herbert, 2016) was used to measure the mass-specific rate of O2 consumption
Fish were randomly selected from the given tank and their body mass (Mb) measured in kg (with their body blotted dry but head and gills untouched). The respiration chambers were variable in size (adjusted based on Mb), with volumes of 1.9–6.7 L (including tubing), which was on average 37.7 times the Mb of each individual. Fish were transferred into one of two acrylic respirometry chambers, which were contained in a larger 120 L reservoir (with 2 reservoirs and 4 chambers overall). The flow-through water into the reservoir was from the same source as that of the acclimation tanks, maintaining a constant temperature of either 21°C (mean ± SE: 20.97°C ± 0.001°C) or 25°C (25.23°C ± 0.002°C). Additional air stones within the reservoir ensured that seawater was fully air saturated. Respirometers were visually shielded from external disturbance using a shade cloth.
There was no significant difference in the mean Mb (ANOVA, df = 4, F = 0.35, p > 0.05), fork length (ANOVA, df = 4, F = 0.45, p > 0.05) or condition factor (ANOVA, df = 4, F = 0.60, p > 0.05) between the experimental groups. As per standard procedure, food was withheld for 48 h prior to the commencement of any respirometry, to ensure fish were starved and that
Chambers were thoroughly cleaned with ethanol between fish. Background bacterial respiration was measured in empty chambers across 3 measurement cycles (both before and after fish were added). Background respiration was assumed to increase linearly from the outset to the end of the experiment, and subtracted from each
Once fish were sealed in the chamber, respirometry measurements commenced, and fish were left alone overnight to recover from transfer stress. The SMR was resolved as the average of the lowest 10
Where Vr represents the respirometry chamber volume and Vf the volume of the fish (l, assuming that 1 g of fish is equivalent to 1 mL of water), Δ%Sat/t is the change in O2 (% air saturation) per unit time h), α is the solubility coefficient of O2 in water (mg O2% O2sat–1 1–1; salinity 35 ppt, either 21 or 25°C) and Mb is the fish mass (kg) (Schurmann & Steffensen, 1997; Devaux et al., 2019). The SMR Q10 (the rate that SMR changes with every 10 °C temperature change) was calculated as:
Whereby the difference between the SMR values at the two temperatures is raised to the power of 2.5 (as
During respirometry, O2 changes were measured in % air saturation. Such values were then converted into O2 pressure units (PO2 in kPa) based on the measured atmospheric pressure on the day.
The hypoxia challenge was given to the fish on the second day of respirometry, whereby the LeighResp software was manually overridden and held in a continuous closed ‘measurement’ phase (i.e., flush pump off), which allowed the fish to gradually draw down the chamber’s O2 through respiration for 38–57 min, with the fish under constant supervision. As O2 declined and hypoxia progressed, the fish eventually shifted from a state of oxyregulation (where SMR could be maintained steady) to a state of oxyconformation (where SMR was forced to reduce with the severely low levels of O2 in the surrounding seawater) (Farrell & Richards, 2009). The point of inflection where stable resting
Once fish had recovered from the hypoxia challenge their MMR was determined using an exhaustive exercise protocol (Khan et al., 2014; McArley et al., 2018). Each fish was chased to exhaustion with light tail touches for either 5 minutes or until it no longer performed burst swimming to escape the touch. After resealing the chamber, measurement phases were cycled manually over a timeframe of ∼10 min to ensure that the saturation of O2 in the chamber did not drop below 80% in any of the measurement cycles. Once MMR was ascertained, each fish was left to recover for 2-3 h before the whole respirometry protocol was terminated. MMR was taken as the highest
Following completion of the respirometry protocol, fish were removed from the respirometers and euthanized via “ike jimi” (Wells & Weber, 1990). Fish were placed immediately on ice.
Blood was sampled immediately following death via caudal venepuncture with a 2.5 mL heparinised syringe fitted with a 21 gauge hypodermic needle (as per McArley and Herbert (2014)). Blood was then transferred to a 2 mL Eppendorf tube, sealed, and immediately placed on ice for subsequent analysis and processing. The heart ventricle (atrium removed), spleen, and liver were removed and weighed (wet weight).
Haematocrit (Hct) was measured by spinning a 75 mm capillary tube full of whole blood in a haemofuge (Haemocentaur, MSE, UK) for 3 min (12000 g) and measuring the compacted percentage of red blood cells within the tube with a measurement rule. Blood haemoglobin concentration ([Hb]) was measured spectrophotometrically using modified Drabkins reagent, whereby a 10 μL whole blood subsample was mixed with 1 mL of Drabkins and absorbance was measured at 540 nm after 10 min (Wells & Dunphy, 2009).
The relative organ mass (%) of the spleen, liver and ventricle, and the fish condition factor, were calculated as:
Where Morgan is the wet mass of either the liver (kg), spleen or heart ventricle, Mb is the fish body mass (kg), and FL is the fork length m).
Mean corpuscular haemoglobin (MCH, g L−1) was calculated as:
Where Hb is the haemoglobin (g L−1) and HCT is the haematocrit (%).
Following dissection, the heart was placed immediately in ice-cold, modified (to account for the higher osmolarity of marine teleosts compared to mammals) respiratory medium MiR05, with a final composition of 0.5 mM EGTA, 60 mM lactobionic acid, 20 mM taurine, 10 mM KH2PO4, 20 mM HEPES, 160 mM sucrose, 1 g/L BSA, pH 7.24 at 20°C (Gnaiger et al., 2000; Iftikar et al., 2010). The heart tissue was quickly blotted dry and weighed prior to being homogenized in cold MiR05 using a motorised homogeniser. Mitochondrial respiration assays were then run with a tissue concentration of 5 mg/L heart homogenate, within the 2 mL Oroboros Oxygraph-2k (O2k) thermostated respirometer chamber. Assay temperature was maintained throughout the experiment at the fish’s acclimation temperature (either 21°C or 25°C). Oxygen calibration was performed at 100% air saturation (101.1 kPa) according to the chamber temperature at the outset of each assay. Data was recorded using Datlab 7.1 software (Oroboros instruments, Innsbruck, Austria). Mass-specific mitochondrial respiration flux (JO2, pmol/(s.mg)) was calculated in real time by DatLab, as the negative time derivative of the O2 concentration.
The assay protocol is visually outlined in Figure 1, whereby the mitochondrial JO2 and chamber oxygen concentration (Figure 1A) and the change in cationic fluorophore safranine-o (safr, Amp uM, Figure 1B) at each step of the assay (detailed below) were displayed in real-time by the DatLab software.
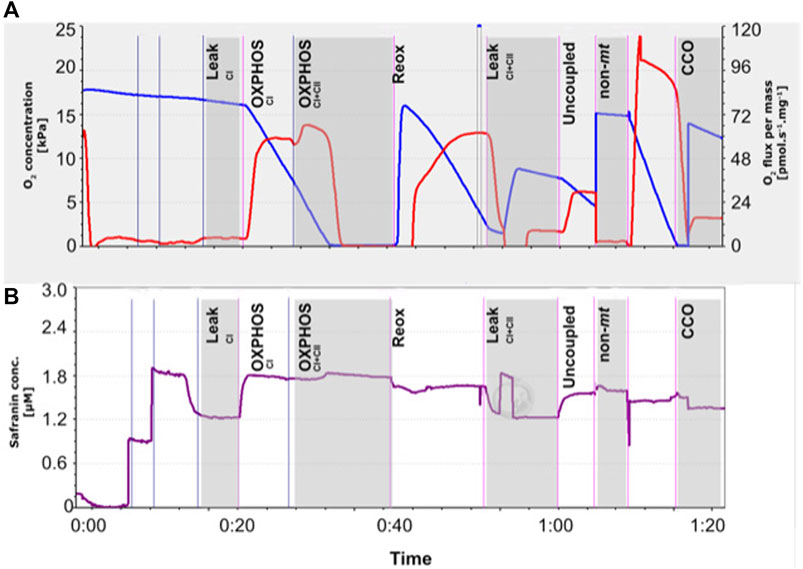
FIGURE 1. Representative trace of the mitochondrial respirometry assay performed on permeabilized snapper heart tissue (5 mg), conducted using Oroboros™ O2k respirometers, as shown in real-time by the Datlab 7.1 software. (A) Chamber oxygen concentration (blue line) and its derivative, i.e., oxygen consumption (JO2, red line) corrected for mass of the sample. (B) Mitochondrial membrane potential (ΔΨm) was monitored in alongside JO2 using calibrated-safranin concentration (up to 2 μM) fluorescence. Safranin accumulates within mitochondria as ΔΨm increases, which mediates a decrease in fluorescence. Sequential titration of substrates, inhibitors and uncoupler were used to induce mitochondria at various states specified in vertical black labels. The LeakCI (complex I) state was induced by the addition of saturating concentrations of pyruvate and malate, before ADP activated CI OXPHOS, and succinate allowed OXPHOS from both CI and CII. The chambers were allowed to run into anoxia (for a short period) to calculate the P50mito, before reoxygenation with H2O2 and catalyse. To test for mitochondrial coupling, oligomycin was used to induce the LeakCI+CII state, followed by carbonyl cyanide m-chloro phenyl hydrazone (CCCP) to determine the maximum capacity of the electron transport system. Background oxygen consumption was then measured following antimycin A addition. Ascorbate (Asc) and N,N,N′,N′-tetramethyl-p-phenylenediamine (TMPD) were then added to measure maximum cytochrome c oxidase (CCO) rates, with sodium azide (AZ) thereafter to inhibit CCO and account for background TMPD auto-oxidation rates.
Following sample addition and safranin (up to 2 μM) fluorescence calibration, assay protocol steps (Figure 1) were performed as follow: 1) Pyruvate and malate were added (respectively 5 and 2 mM) to measure complex I (CI) leak state. 2) The addition of adenosine diphosphate (ADP, 2.5 mM) engaged ATP synthase, thus allowing CI OXPHOS measurement. 3) Succinate (10 mM) began complex II (CII). With CI already running in the background, this step therefore measured CI + CII OXPHOS together. Mitochondria were then allowed to draw the chamber O2 down through respiration until anoxia, so that the mitochondrial P50 (P50mito, the PO2 where mitochondrial O2 consumption is at 50% of maximal rates (Chung et al., 2017)) could be calculated. To avoid any potential mitochondrial damage due to anoxia, the anoxic period did not exceed 10 min, as per previous research by Lau et al. (2017). 4) To reoxygenate without interference to the fluorescent signal, H2O2 (5 μL, 0.75%) and catalase (5 U/ml) were added. Throughout the rest of the assay, oxygenation was kept above ∼80% air saturation (i.e., >160 mM and >190 mM for 21ºC and 25°C respectively). 5) Oligomycin (10 nM) then inhibited ATP synthase to allow the measurement of proton leak with CI and CII substrates (LeakCI+CII). 6) Carbonyl cyanide m-chloro phenyl hydrazone (CCCP, 0.1 µM) was added to measure the ‘uncoupled’ respiration state. CCCP is a lipophilic weak acid and acts to exchange protons across the inner mitochondrial membrane. It therefore dissipates proton gradients, bypassing proton flow through the ATP synthase and decreasing the membrane potential. 7) Antimycin A (2.5 µM) was then added to block the electron pathway at complex III and allow for the measurement of background oxygen consumption. 8) Ascorbate (Asc) and N,N,N′,N′-tetramethyl-p-phenylenediamine (TMPD) were then added (2 and 0.5 mM, respectively) measure maximal cytochrome c oxidase (CCO) rates. 9) Sodium azide (AZ, 100 mM) thereafter inhibited CCO to measure background TMPD auto-oxidation rates. CCO net rates were determined as (TMPD + Asc) – (AZ).
A 2-min average for JO2 and ΔΨm were sampled at each step of the assay and extracted from DatLab, for further analysis in Excel. Non-mitochondrial respiration determined at 7) was subtracted from the flux at each state, but did not differ between treatment groups (ANOVA, df = 4, F = 0.73, p > 0.05). The respiratory control ratio (RCR), as a proxy for mitochondrial efficiency, was calculated according to Gnaiger (2012):
To determine the P50mito, a section of the PO2 and respiration flux data was extracted following attainment of maximal flux after succinate addition, and then few minutes of complete anoxia to determine the respiration profiles as PO2 declined. Hill-curve fitting was performed in Python environment with the fitted respiration curves used to find the P50mito (code availability: https://github.com/julio0029/Snapper_Study_2022_TM, using pandas, scipy and pingouin packages). The hill curve equation fitted well to these data (93.3% of values had an R2 >70%) and only hill curves with an R2 greater than 70% were used (mean R2 = 97%).
The mitochondrial membrane potential (ΔΨm, mV) was estimated simultaneously with JO2 throughout the assay using safr fluorescence, as per Devaux et al. (2019). As a cationic dye which is permeable to mitochondrial membranes, safr has a fluorescent quench during its movement through the inner-mitochondrial membrane, from the intermembrane space to the mitochondrial matrix (Åkerman & Wikström, 1976; Zanotti & Azzone, 1980). Estimates of ΔΨm can be derived from a near-linear correlation between spectral shift of safr and the energized state of the mitochondria, whereby an increase in safr concentration within the mitochondria due to increase in ΔΨm mediates a decrease in fluorescence (Devaux et al., 2019). Calculations of ΔΨm were conducted using the Nernst equation by the methods previously described by Devaux et al. (2019) and Pham et al. (2014), whereby:
Where R is the gas constant (8.314 J.mol−1.K−1), T is the temperature (in Kelvin), z is the valence state of the ion (+1) and F is the Faraday constant (96,485.340 C.mol−1). “Safr out” (μM) is the safranin concentration outside of the mitochondria. The concentration of safranin inside the mitochondrial matrix, “safr in” (µM) is dependent on the volume of the mitochondria. Mitochondria are known to constitute 19.8% ± 0.8% of snapper heart tissue (Cook et al., 2013); thus, ca. 20% of mitochondrial tissue volume was used in the heart calculations. The work undertaken to maintain mitochondrial respiration was calculated as JO2/-ΔΨm (pmol O2/(s*mg*mV), as per Devaux et al. (2019).
T-tests were initally run on each variable between the 21°C control from the outset and end of the experiment, to account for any effect of time in captivity. Only the relative liver mass returned a signficiant difference between the two controls, thus the two controls were analysed separately for this parameter. All other parameters returned no significant difference between the two controls (p > 0.05) and were thus combined (pooled) for further statistical analyses. Outliers (<2 standard deviations away from mean) were removed (Norin et al., 2014; Oellermann et al., 2020). Data was normality checked with a Shapiro-Wilk and homogeneity of variances with a Bartlett’s test. Unless otherwise stated, one-way ANOVAs were then used to test the effect of increased temperature on every parameter and a Tukey’s multiple comparisons test was run to detect individual post hoc differences. Where normality was confirmed but the variances were significantly different (violating the assumptions of ANOVA), Welch (1951) ANOVA tests were instead run, with a post hoc Games-Howell’s multiple comparison test where necessary. In the rare instance where normality was not met (including when data was log transformed) then a non-parametric Kruskal-Wallis test was performed, with a Dunn’s post hoc multiple comparisons test. All statistics were run through GraphPad Prism v8.0.2 and statistical significance was accepted at p < 0.05.
After raising temperature from 21°C to 25°C, SMR, MMR, and MS were all increased significantly (each p > 0.01; Table 1)—with an average increase of 30% for SMR, 20% for MMR, and 16% for MS—with no additional significant differences between any of the 25°C groups (p < 0.05). All SMR Q10 values were within the range of 1.74–2.11 (Table 1).
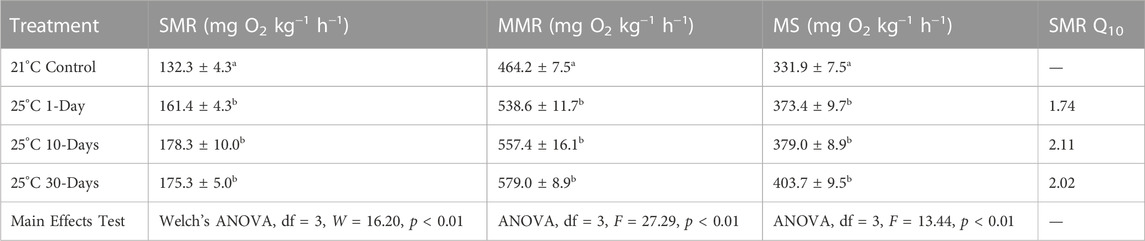
TABLE 1. Standard metabolic rate (SMR), maximum metabolic rate (MMR), aerobic metabolic scope (MS), and SMR Q10 of snapper, from the 21°C control to 25°C exposure for 1-, 10-, and 30-days. Data presented as mean ± SE of 11-12 individuals per experimental group and 24 individuals per control (beginning and end control groups combined). Significant differences (p < 0.05, main effects test details in bottom row) are indicated by different superscript letters.
Pcrit varied significantly between the temperature treatments (ANOVA, df = 3, F = 6.48, p < 0.01; Figure 2), whereby it was 14% higher (i.e., showed signs of decreased hypoxia tolerance) when temperature was increased from 21°C to 25°C for only 1 day (p < 0.01). However, Pcrit recovered to control levels with 10 and 30 days at 25°C (p > 0.05). PLOE also diffed between the temperature treatments (ANOVA, df = 3, F = 17.57, p < 0.01; Figure 2), with higher values (showing less hypoxia tolerance) following 1- and 10-days of exposure to warmer 25°C temperatures (each p < 0.01; 33% and 16% higher than the control following 1- and 10-days respectively). However, after 30-days of 25°C exposure, PLOE also recovered with no significant difference from the control (p > 0.05).
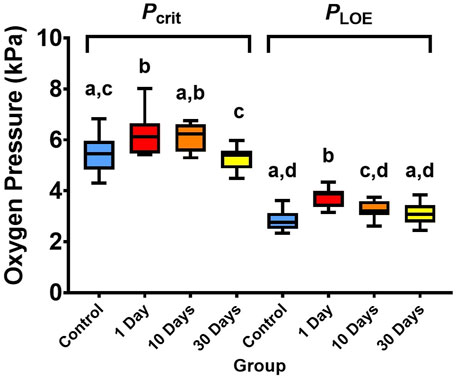
FIGURE 2. Critical oxygen tension (Pcrit) and partial pressure of environmental oxygen where fish loses equilibrium (PLOE) of snapper at 21°C and 25°C after 1-, 10, and 30-days of acclimation exposure. Data presented as 75th, 50th (median), and 25th percentiles ± minimum and maximum of 11-12 individuals per treatment group and 23-24 individuals per control (beginning and end control groups combined). Significant differences (p < 0.05, tested with one-way ANOVA) are indicated by different superscript letters.
In terms of PLOE recovery (Figure 3), significant differences occurred between treatments, whereby the 30-day 25°C treatment was greater than the other groups, in terms of the post PLOE ṀO2 peak (29.5% greater than the control; ANOVA, df = 3, F = 9.96, p < 0.01; Figure 3A), total oxygen debt (105% greater than the control; Welch’s ANOVA, df = 3, W = 6.42, p < 0.01; Figure 3B), and the time taken to recover
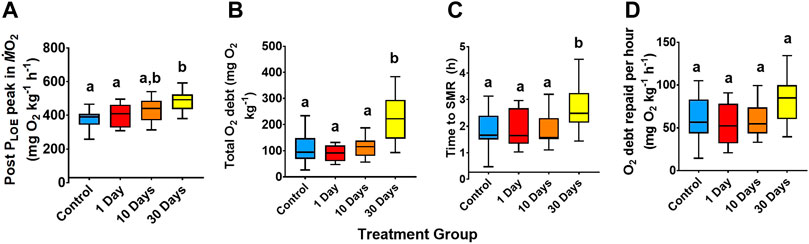
FIGURE 3. Recovery variables following PLOE for snapper at 21°C and 25°C for 1-, 10, and 30-days acclimation exposure. (A) Post PLOE peak in
The main effects test for Hct revealed a significant difference between the groups, but the only specific difference was a 13% increase in the percentage of Hct after 1-day of warming to 25°C compared to the control (p = 0.03; Table 2). [Hb], Hct, and relative spleen mass did not vary (Table 2). Relative ventricular mass was significantly different between the temperature treatments (Table 2), with the control fish at 21°C having a 14% smaller heart on average than the 10- (p = 0.02) and 30-days (p < 0.01) 25°C exposure treatments. In terms of relative liver mass, the second 21°C control group was far smaller than that of the first control (t = 2.46, df = 22, p = 0.02; Table 2), thus the two controls were presented separately. The main effects test on the acclimation groups detected a significant difference across all groups in liver mass, whereby the initial 21°C control had a significantly larger relative liver mass than both the 30-days 25°C treatment (81% larger; p < 0.01; Table 2) and the second 21°C control (62% larger; p = 0.01; Table 2).

TABLE 2. Blood and organ indices for snapper acclimated at 21°C and 25°C for 1-, 10, and 30-days. The Hct (haematocrit), [Hb] (haemoglobin), MCH (mean corpuscular haemoglobin), relative ventricular mass, relative liver mass, and relative spleen mass. Data presented as mean ± SE of 10–12 individuals per experimental group and 19–24 per control (beginning and end controls combined), except for the liver, whereby the two controls (11-12 individuals each) remained separate due to statistical difference. Significant differences (p < 0.05, main effects test details in bottom row) are indicated by different superscript letters.
The O2 flux (JO2) of heart mitochondria did not statistically differ between treatments for either CI or CI + CII OXPHOS (Table 3). The temperature increase from 21°C to 25°C did not incur additional significant CI and CII + CII OXPHOS ΔΨm variation; thus, there was no change to the energetic work required by the mitochondria to maintain the membrane potential (Table 3). The second control could not be included in the analyses for ΔΨm or work, due to systematic error, thus only the first control was analysed for these data.

TABLE 3. Heart mitochondrial oxygen consumption rates (JO2), mitochondrial membrane potential (ΔΨm) and translated work (JO2/ΔΨm) of snapper acclimated to marine heat wave scenario treatments. Oxidative phosphorylation (OXPHOS) was achieved with either electron inputs at complex I (CI OXPHOS; with saturated pyruvate, malate and ADP) and with additional complex II input (CI + CII OXPHOS; added succinate). Data presented as mean of 8 individuals per group ±SE. Significant differences (p < 0.05, main effects test details in bottom row) are indicated by different superscript letters.
LeakCI+CII differed significantly between treatments (Welch’s ANOVA, df = 3, W = 8.90, p = 0.01; Figure 4A). Indeed, LeakCI+CII declined (became more efficient) by 44% from the control following 1-day of 25°C (p = 0.03), but the control level was restored by 10-days at 25°C (p > 0.05). The CCO flux also differed between the treatments (ANOVA, df = 3, F = 6.04, p < 0.01; Figure 4B), with the control 24% lower than the 10-day 25°C group (p < 0.01), indicating a greater OXPHOS output from complex IV in this group.

FIGURE 4. Snapper heart mitochondrial performance of snapper acclimated to 21°C and at 25°C for 1-, 10, and 30-days. (A) O2 flux mediated by mitochondrial complex I and complex II inputs and not directed to oxidative phosphorylation (LeakCI+CII). (B) Absolute cytochrome c oxidase (CCO) rates. (C) The respiratory control ratio (RCR, measured as CI + CII OXPHOS/LeakCI+CII). (D) Mitochondrial P50 (P50mito), as the partial pressure of O2 where mitochondrial O2 consumption is at 50% of maximal rates. Data presented as 75th, 50th (median), and 25th percentiles ± minimum and maximum of 8–11 individuals per experimental group and 11–18 individuals per control (beginning and end controls combined). Significant differences (p > 0.05, tested by ANOVA (CCO), Welch’s ANOVA (LeakCI+CII and RCR), and Kruskal-Wallis test (P50mito)) are indicated by different superscript letters.
The respiratory control ratio (RCR) for snapper heart mitochondria was high throughout the experiment, ranging from 10.6 to 21.6 (indicating tight and efficient coupling of respiration to ATP synthesis), with no significant difference between groups (Welch’s ANOVA, df = 3, W = 3.13, p > 0.05; Figure 4C). Moreover, P50mito (Kruskal-Wallis ANOVA, df = 3, H = 3, p > 0.05; Figure 4D) did not return any significant difference between treatments.
Marine heat waves (MHWs) are expected to increase in frequency and severity as climate change advances, with anticipated impact on marine ecosystems (Oliver et al., 2018). This study sought to investigate the metabolic response of SNA1 stock snapper to heat shock at the organism and mitochondrial levels. Additionally, we tested whether progressive acclimation would allow a greater degree of thermo- and hypoxia-tolerance for this species. The findings of this study were unexpected as exposure to 25°C, a realistic MHW SST scenario for the Hauraki Gulf of New Zealand, did not constrain the metabolic O2 uptake rate of snapper, nor change their condition factor. Indeed, 25°C may actually be more within the optimal temperature range of this species—which has a global range that extends from warmer sub-tropical to cold temperate waters—than the present-day (February) average of 21°C. Our findings in part contrast with the initial hypothesis that snapper performance would rapidly decline at the beginning of a 25°C MHW and then undergo partial recovery following 30-days of high temperature exposure. In keeping with reports from previous workers, we made the assumption that an expanded aerobic metabolic scope (MS) benefits fish fitness performance. Here we report a 16% increase in MS, on average, as temperature increased from 21°C to 25°C. Moreover, MS increased 1-day into the MHW and remained high over the 30 days of the challenge. Regardless of acclimation period, fish in the 25°C treatment showed elevated SMR and MMR relative to 21°C controls. Moreover, the fold increase in MMR capacity exceeded the relative increase in SMR and this resulted in expansion of MS at 25°C. The average SMR Q10 of 1.96 from 21°C to 25°C was within the range of passive, direct effects of temperature (Clarke & Johnston, 1999; Schulte, 2015; Reeve et al., 2022), supporting assumptions that snapper are capable to acclimate. Using whole animal O2 uptake rates as a performance predictor, north-eastern New Zealand snapper stocks may even metabolically benefit from climate change (Watson, 2018).
The strong metabolic resilience of snapper is also reinforced by the maintenance of heart mitochondrial performance throughout all stages of the MHW exposure. Regardless of substrate input, OXPHOS was unchanged during the warm acclimation. However, mitochondrial respiration not attributed to OXPHOS (i.e., LeakCI+CII) decreased at 1-day 25°C acclimation, suggesting a greater utilisation of O2 flux toward ATP production (Gnaiger, 2012). CCO rates were greater in the 10-day 25°C treatment than in the control, suggesting a potential upregulation of cytochrome c oxidase output, which did not translate to an increase in oxidative phosphorylation. CCO rates however returned similar to that of 21°C acclimated fish after 30-days acclimation at 25°C. Regardless of acclimation, CCO rates were ∼2-3 fold greater than OXPHOS rates. This CCO-excess capacity in the heart means that the transitional increase in CCO rates had insignificant effect on mitochondrial respiration (Gnaiger et al., 1998). Regardless, all states recovered to be no different from the 21°C control after 10- and 30-days at 25°C. Heart mitochondria also showed no change between groups in P50mito, RCR, or workload in terms of JO2 per ΔΨm (Table 3), suggesting that mitochondria retained a certain efficiency towards ATP production.
A common limitation of using
As the frequency of aquatic hypoxia events are projected to increase into the future (Keeling et al., 2009), a species’ physiological plasticity for hypoxia tolerance will be a key determinant of performance (Rogers et al., 2016), and we hypothesised that thermal challenge would impact physiological responses (e.g., Schurmann & Steffensen, 1997). While there were elevations in Pcrit and PLOE following acute hypoxic challenge, these increases were relatively small (+0.78 and +0.94 kPa from the control for Pcrit and PLOE respectively). Overall, snapper appeared to recover and maintain hypoxia tolerance at 25°C exposures. The 30-day 25°C temperature treatment group appeared to build up a greater total oxygen debt and a greater peak
An enlargement of relative ventricular mass in response to the MHW scenario, by 19% following 30-days exposure, may have assisted snapper in enhancing both their MMR and MS. Indeed, the ability of fish to maintain MMR across a range of temperatures is dependent on factors of oxygen delivery and uptake, including cardiac output and blood oxygen carrying capacity (Albers et al., 1983; Gamperl & Farrell, 2004; Claësson et al., 2016). Whilst a larger heart suggests the possibility of an increased cardiac output for these groups, direct measures of cardiac function were not taken and should be explored in future research to confirm this. The relative liver mass also differed between treatment groups, but this included a significant decline between the first and second 21°C controls, which highlighted an effect of time in captivity, possibly from the diet change from that in the wild to the commercial fish feed pellets. This may also be due to the seasonal growth differences and storage pattern adopted over time by snapper, where changes to body composition, energy storage, and relative organ mass have been shown to vary between seasons (Francis, 1994b; Sim-Smith et al., 2013a; Wellenreuther et al., 2019; Flikac et al., 2020; Cook et al., 2021). No further conclusions were therefore drawn from liver mass samples as it was impossible to disentangle the effects of temperature from time in captivity for this one measurement variable.
This study aligns with many others that demonstrate the resilience of snapper from many physiological stressors, including exposure to turbidity (Cumming & Herbert, 2016), high carbon dioxide (McMahon et al., 2019; 2020), hypoxia (Cook et al., 2011; Cook & Herbert, 2012; Cook et al., 2013), angling stress (McArley & Herbert, 2014), low temperatures (Wolfe et al., 2020), and seasonal temperature variability (Cook et al., 2021). This research therefore provides additional evidence in support of the notion proposed of Parsons et al. (2014) that regional temperature increases in New Zealand may lead to more productive and abundant snapper in the SNA1 stock area. This may even occur over a greater geographical range, considering the strong positive association between temperature and juvenile snapper growth (Francis, 1993; Francis, 1994b). The impact of climate change will almost certainly vary according to life stage but early life stages of fish are notoriously sensitive to environmental change and represent a large knowledge gap for snapper (Parsons et al., 2014).
This study sought to address the potential synergistic effect of viable thermal stress and hypoxia tolerance on snapper. A particularly impressive finding of this study, building on the picture of snapper resilience, was the lack of change in hypoxia tolerance between fish acclimated to 21°C and 25°C (30-days). Indeed, whilst metabolism increased as expected under warmer 25°C conditions, it did not coincide with an expected decline in hypoxia tolerance. Additionally, the current Pcrit values of 5.4 and 5.3 kPa (ca. 25%–26% air saturation), following acclimation to 21°C and 25°C respectively, are essentially equivalent to the 5.3–5.8 kPa Pcrit level of snapper at 18°C in other studies (Cook et al., 2011; Cook & Herbert, 2012). Thus, snapper Pcrit appears to remain surprisingly steady from 18°C to 25°C (Cook et al., 2011), suggesting a very large window of optimum temperature for hypoxia tolerance in this species. This was unexpected, as past research commonly shows an increase in fish Pcrit with temperature (Fernandes & Rantin, 1989; Schurmann & Steffensen, 1997; Rogers et al., 2016). For example, the Pcrit of the Atlantic cod (Gadus morhua) increased dramatically from 3.4 kPa at 5°C to 6.4 kPa at 15°C (Schurmann & Steffensen, 1997). Some studies argue that PLOE is a better indicator of hypoxia tolerance than Pcrit (Wood, 2018) but the PLOE of snapper also recovered and was not significantly different between the 21°C and 30-day 25°C group (i.e., 2.8 kPa and 3.1 kPa respectively). Whilst snapper appear robust to the synergistic effects of thermal challenge and hypoxia, it should be noted that their PLOE is close to the PO2 at which they behaviourally avoid hypoxia at 18°C (3.1 kPa). The PLOE for snapper at 18°C is currently unknown but the lack of change in both Pcrit from 18°C to 25°C (Cook et al., 2011) and PLOE from 21°C to 25°C (current study data) suggests that PLOE at 18°C may be similar to the values obtained in the current study. Thus, the point where snapper behaviourally act to avoid hypoxia is potentially only just above their PLOE, leaving little margin of safety for survival if severe hypoxia is ever experienced. As snapper are only considered to be moderately hypoxia tolerant (Cook & Herbert, 2012) and employ a ‘dangerous’ hypoxia avoidance strategy (Cook et al., 2011), this species may have to rely on anaerobic metabolism and always be in a state of stress at the point of avoiding extreme low O2 (Cook & Herbert, 2012).
This study demonstrates that the whole body and subcellular metabolic systems of snapper from the SNA1 stock are resilient to thermal MHW conditions, and this resilience is retained by snapper during simultaneous low O2 (hypoxia) exposures. Various measures of metabolic performance were employed in this study across multiple levels of biological organisation, including a variety of whole body O2 uptake and heart mitochondrial OXPHOS measures, which either remained the same or improved following exposure to an extreme MHW scenario (25°C) for north-eastern New Zealand. When hypoxia was added as a secondary stressor to the MHW challenge, measures of acute hypoxia tolerance (e.g., Pcrit, PLOE thresholds, etc.) also recovered over a period of 10- or 30-days to levels exhibited by fish at 21°C. The current research therefore aligns strongly with other studies describing the physiological resilience of snapper to a wide variety of stressors, including high temperatures, hypoxia, CO2, and turbidity (Cook et al., 2011; Cook & Herbert, 2012; Cook et al., 2013; McArley & Herbert, 2014; Cumming & Herbert, 2016; McMahon et al., 2019; 2020; Cook et al., 2021). The notion proposed by Parsons et al. (2014) is thus supported by the current study: “Regional temperature increases in New Zealand could feasibly lead to more productive and abundant snapper over a greater geographical range”. In contrast to the usual doomsday depiction, SNA1 New Zealand snapper may be one of the front running species in the emerging era of climate change, at least in terms of metabolic physiology (Watson, 2018). Whether the same is true for other keystone species warrants further investigation and remains to be seen. It is important to note that high temperatures and hypoxia are not the only stressors faced by fish in New Zealand. Applying high temperature with other anthropogenic pressures, such as turbidity, nutrient loading, and reduced prey availability, could potentially reduce the resilience of snapper and other fish species when layered simultaneously. Future research is required to resolve these unknowns and to consider the wider aspects of climate change across a broader range of species.
The raw data supporting the conclusion of this article will be made available by the authors, without undue reservation.
The animal study was reviewed and approved by the University of Auckland Animal Ethics Committee.
TM, NH, and JD designed the research. LB and TM performed the research. LB, TM, and JD analyzed the data. LB wrote the paper. NH, JD, AH, and TM edited the paper. All authors contributed to the article and approved the submitted version.
TM was funded as a Rutherford post-doctoral fellow during this research.
The authors declare that the research was conducted in the absence of any commercial or financial relationships that could be construed as a potential conflict of interest.
All claims expressed in this article are solely those of the authors and do not necessarily represent those of their affiliated organizations, or those of the publisher, the editors and the reviewers. Any product that may be evaluated in this article, or claim that may be made by its manufacturer, is not guaranteed or endorsed by the publisher.
Aims, A. I. o. M. S. (2023). Sea water temperature logger data at Mackay reef. From 25 Feb 2015 To 04 Nov 2022. Australian Government. Retrieved 13 June from https://apps.aims.gov.au/metadata/view/3d198c26-c198-42b7-8a2c-db006e8d60c2.
Åkerman, K. E., and Wikström, M. K. (1976). Safranine as a probe of the mitochondrial membrane potential. FEBS Lett. 68 (2), 191–197. doi:10.1016/0014-5793(76)80434-6
Albers, C., Manz, R., Muster, D., and Hughes, G. (1983). Effect of acclimation temperature on oxygen transport in the blood of the carp, Cyprinus carpio. Respir. Physiol. 52 (2), 165–179. doi:10.1016/0034-5687(83)90003-8
Altieri, A. H., and Gedan, K. B. (2015). Climate change and dead zones. Glob. Change Biol. 21 (4), 1395–1406. doi:10.1111/gcb.12754
Baumann, H., Wallace, R. B., Tagliaferri, T., and Gobler, C. J. (2015). Large natural pH, CO2 and O2 fluctuations in a temperate tidal salt marsh on diel, seasonal, and interannual time scales. Estuaries Coasts 38 (1), 220–231. doi:10.1007/s12237-014-9800-y
Bell, J. J., Smith, R. O., Micaroni, V., Strano, F., Balemi, C. A., Caiger, P. E., et al. (2023). Marine heat waves drive bleaching and necrosis of temperate sponges. Curr. Biol. 33 (1), 158–163.e2. doi:10.1016/j.cub.2022.11.013
Boyd, P. W., Lennartz, S. T., Glover, D. M., and Doney, S. C. (2015). Biological ramifications of climate-change-mediated oceanic multi-stressors. Nat. Clim. change 5 (1), 71–79. doi:10.1038/nclimate2441
Bradford, E. (1999). Harvest of major recreational species: Comparison of results from the regional and national diary surveys. New Zealand: NIWA.
Brand, M. D., Chien, L. F., Ainscow, E. K., Rolfe, D. F., and Porter, R. K. (1994). The causes and functions of mitochondrial proton leak. Biochimica Biophysica Acta (BBA)-Bioenergetics 1187 (2), 132–139. doi:10.1016/0005-2728(94)90099-x
Chabot, D., Steffensen, J., and Farrell, A. (2016). The determination of standard metabolic rate in fishes. J. fish Biol. 88 (1), 81–121. doi:10.1111/jfb.12845
Chaudhry, R., and Varacallo, M. (2018). Biochemistry, glycolysis. United States: StatsPearls Publishing LLC.
Chung, D., Morrison, P., Bryant, H., Jung, E., Brauner, C., and Schulte, P. (2017). Intraspecific variation and plasticity in mitochondrial oxygen binding affinity as a response to environmental temperature. Sci. Rep. 7, 16238. doi:10.1038/s41598-017-16598-6
Claësson, D., Wang, T., and Malte, H. (2016). Maximal oxygen consumption increases with temperature in the European eel (Anguilla anguilla) through increased heart rate and arteriovenous extraction. Conserv. Physiol. 4 (1), cow027. doi:10.1093/conphys/cow027
Clarke, A., and Johnston, N. M. (1999). Scaling of metabolic rate with body mass and temperature in teleost fish. J. animal Ecol. 68 (5), 893–905. doi:10.1046/j.1365-2656.1999.00337.x
Collins, G. M., Clark, T. D., Rummer, J. L., and Carton, A. G. (2013). Hypoxia tolerance is conserved across genetically distinct sub-populations of an iconic, tropical Australian teleost (Lates calcarifer). Conserv. Physiol. 1 (1), cot029. doi:10.1093/conphys/cot029
Cook, D. G., and Herbert, N. A. (2012). Low O2 avoidance is associated with physiological perturbation but not exhaustion in the snapper (Pagrus auratus: Sparidae). Comp. Biochem. Physiology Part A Mol. Integr. Physiology 162 (4), 310–316. doi:10.1016/j.cbpa.2012.03.024
Cook, D. G., Iftikar, F. I., Baker, D. W., Hickey, A. J., and Herbert, N. A. (2013). Low-O₂ acclimation shifts the hypoxia avoidance behaviour of snapper (Pagrus auratus) with only subtle changes in aerobic and anaerobic function. J. Exp. Biol. 216 (3), 369–378. doi:10.1242/jeb.073023
Cook, D. G., Wells, R. M., and Herbert, N. A. (2011). Anaemia adjusts the aerobic physiology of snapper (Pagrus auratus) and modulates hypoxia avoidance behaviour during oxygen choice presentations. J. Exp. Biol. 214 (17), 2927–2934. doi:10.1242/jeb.057091
Cook, D., Herbert, N., and Jerrett, A. (2021). Growth and energy storage responses vary seasonally in the Australasian snapper Chrysophrys auratus with only modest changes in aerobic scope. Mar. Ecol. Prog. Ser. (Halstenbek) 659, 199–217. doi:10.3354/meps13583
Crockett, E., and Londraville, R. (2006) “Temperature,” in The physiology of fishes Editors D. H. Evans, and J. B. Claiborne 3 ed. (England: Routledge)
Crossland, J. (1977). Fecundity of the snapper chrysophrys auratus (pisces: Sparidae) from the Hauraki Gulf. N. Z. J. Mar. Freshw. Res. 11 (4), 767–775. doi:10.1080/00288330.1977.9515712
Cumming, H., and Herbert, N. (2016). Gill structural change in response to turbidity has no effect on the oxygen uptake of a juvenile sparid fish. Conserv. Physiol. 4 (1), cow033. doi:10.1093/conphys/cow033
Devaux, J. B. L., Hedges, C. P., Birch, N., Herbert, N., Renshaw, G. M. C., and Hickey, A. J. R. (2019). Acidosis maintains the function of brain mitochondria in hypoxia-tolerant triplefin fish: A strategy to survive acute hypoxic exposure? Front. Physiology 9, 1941. doi:10.3389/fphys.2018.01941
Diaz, R. J., and Breitburg, D. L. (2009). “The hypoxic environment,” in Fish physiology (Netherlands: Elsevier), 1–23.
Diaz, R. J. (2001). Overview of hypoxia around the world. J. Environ. Qual. 30 (2), 275–281. doi:10.2134/jeq2001.302275x
Evans, J., and Atkins, J. (2013). Seawater temperature dataset at goat island, Leigh New Zealand from 1967 to 2011. http://hdl.handle.net/2292/21850.
Farrell, A. (2016). Pragmatic perspective on aerobic scope: Peaking, plummeting, pejus and apportioning. J. fish Biol. 88 (1), 322–343. doi:10.1111/jfb.12789
Farrell, A. P., and Richards, J. G. (2009). “Chapter 11 defining hypoxia: An integrative synthesis of the responses of fish to hypoxia,” in Fish physiology. Editors J. G. Richards, A. P. Farrell, and C. J. Brauner (Cambridge: Academic Press), 487–503. doi:10.1016/S1546-5098(08)00011-3
Fedyaeva, A. V., Stepanov, A. V., Lyubushkina, I. V., Pobezhimova, T. P., and Rikhvanov, E. G. (2014). Heat shock induces production of reactive oxygen species and increases inner mitochondrial membrane potential in winter wheat cells. Biochem. (Mosc) 79 (11), 1202–1210. doi:10.1134/s0006297914110078
Fernandes, M., and Rantin, F. (1989). Respiratory responses of Oreochromis niloticus (Pisces, Cichlidae) to environmental hypoxia under different thermal conditions. J. fish Biol. 35 (4), 509–519. doi:10.1111/j.1095-8649.1989.tb03002.x
Ferrell, D., and Sumpton, W. (1993). Assessment of the fishery for snapper (pagrys auratus) in queensland and new south wales. Final Rep. FRDC Proj. 93/074, 143.
Fielder, D. S., Bardsley, W. J., Allan, G. L., and Pankhurst, P. M. (2005). The effects of salinity and temperature on growth and survival of Australian snapper, Pagrus auratus larvae. Aquaculture 250 (1-2), 201–214. doi:10.1016/j.aquaculture.2005.04.045
Flikac, T., Cook, D. G., Davison, W., and Jerrett, A. (2020). Seasonal growth dynamics and maximum potential growth rates of Australasian snapper (Chrysophrys auratus) and yellow-eyed mullet (Aldrichetta forsteri). Aquac. Rep. 17, 100306. doi:10.1016/j.aqrep.2020.100306
Francis, M. (1997). Condition cycles in juvenile Pagrus auratus. J. fish Biol. 51 (3), 583–600. doi:10.1111/j.1095-8649.1997.tb01514.x
Francis, M. P. (1993). Does water temperature determine year class strength in New Zealand snapper (Pagrus auratus, Sparidae)? Fish. Oceanogr. 2 (2), 65–72. doi:10.1111/j.1365-2419.1993.tb00121.x
Francis, M. P. (1994a). Duration of larval and spawning periods inPagrus auratus (Sparidae) determined from otolith daily increments. Environ. Biol. fishes 39 (2), 137–152. doi:10.1007/bf00004931
Francis, M. P. (1994b). Growth of juvenile snapper, Pagrus auratus. N. Z. J. Mar. Freshw. Res. 28 (2), 201–218. doi:10.1080/00288330.1994.9516608
Frölicher, T. L., Fischer, E. M., and Gruber, N. (2018). Marine heatwaves under global warming. Nature 560 (7718), 360–364. doi:10.1038/s41586-018-0383-9
Frölicher, T. L., and Laufkötter, C. (2018). Emerging risks from marine heat waves. Nat. Commun. 9 (1), 650. doi:10.1038/s41467-018-03163-6
Fu, S. J., Dong, Y.-W., and Killen, S. S. (2022). Aerobic scope in fishes with different lifestyles and across habitats: Trade-offs among hypoxia tolerance, swimming performance and digestion. Comp. Biochem. Physiology Part A Mol. Integr. Physiology 272, 111277. doi:10.1016/j.cbpa.2022.111277
Gamperl, A. K., and Farrell, A. (2004). Cardiac plasticity in fishes: Environmental influences and intraspecific differences. J. Exp. Biol. 207 (15), 2539–2550. doi:10.1242/jeb.01057
Gillooly, J. F., Brown, J. H., West, G. B., Savage, V. M., and Charnov, E. L. (2001). Effects of size and temperature on metabolic rate. Science 293 (5538), 2248–2251. doi:10.1126/science.1061967
Gleeson, T. T. (1996). Post-exercise lactate metabolism: A comparative review of sites, pathways, and regulation. Annu. Rev. Physiology 58 (1), 565–581. doi:10.1146/annurev.ph.58.030196.003025
Gnaiger, E., Kuznetsov, A. V., Schneeberger, S., Seiler, R., Brandacher, G., Steurer, W., et al. (2000). “Mitochondria in the cold,” in Life in the cold (Germany: Springer), 431–442.
Gnaiger, E., Lassnig, B., Kuznetsov, A., Rieger, G., and Margreiter, R. (1998). Mitochondrial oxygen affinity, respiratory flux control and excess capacity of cytochrome c oxidase. J. Exp. Biol. 201 (8), 1129–1139. doi:10.1242/jeb.201.8.1129
Gnaiger, E. (2012) Mitochondrial pathways and respiratory control. An introduction to OXPHOS analysis. Mitochondr Physiol Network 19.12. Innsbruck: OROBOROS MiPNet Publications.
Goldhaber, J. I. (1997) Metabolism in normal and ischemic myocardium. In The myocardium. G. A. Langer (Cambridge: Academic Press)
Goolish, E. M. (1989). A comparison of oxygen debt in small and large rainbow trout. London: Salmo gairdneri Richardson.
Hardewig, I., Pörtner, H., and Peck, L. (1999). Thermal sensitivity of mitochondrial function in the Antarctic Notothenioid Lepidonotothen nudifrons. J. Comp. Physiology B 169 (8), 597–604. doi:10.1007/s003600050260
Hobday, A. J., Oliver, E. C., Gupta, A. S., Benthuysen, J. A., Burrows, M. T., Donat, M. G., et al. (2018). Categorizing and naming marine heatwaves. Oceanography 31 (2), 162–173. doi:10.5670/oceanog.2018.205
Iftikar, F. I., and Hickey, A. J. R. (2013). Do mitochondria limit hot fish hearts? Understanding the role of mitochondrial function with heat stress in notolabrus celidotus. PLOS ONE 8 (5), e64120. doi:10.1371/journal.pone.0064120
Iftikar, F. I., MacDonald, J., and Hickey, A. J. (2010). Thermal limits of portunid crab heart mitochondria: Could more thermo-stable mitochondria advantage invasive species? J. Exp. Mar. Biol. Ecol. 395 (1-2), 232–239. doi:10.1016/j.jembe.2010.09.005
Iftikar, F. I., MacDonald, J. R., Baker, D. W., Renshaw, G. M. C., and Hickey, A. J. R. (2014). Could thermal sensitivity of mitochondria determine species distribution in a changing climate? J. Exp. Biol. 217 (13), 2348–2357. doi:10.1242/jeb.098798
Iftikar, F., Morash, A., Cook, D., Herbert, N., and Hickey, A. (2015). Temperature acclimation of mitochondria function from the hearts of a temperate wrasse (Notolabrus celidotus). Comp. Biochem. Physiology Part A Mol. Integr. Physiology 184, 46–55. doi:10.1016/j.cbpa.2015.01.017
Keeling, R. F., Körtzinger, A., and Gruber, N. (2009). Ocean deoxygenation in a warming world. Annu. Rev. Mar. Sci. 2, 199–229. doi:10.1146/annurev.marine.010908.163855
Khan, J. R., Iftikar, F. I., Herbert, N. A., Gnaiger, E., and Hickey, A. J. R. (2014). Thermal plasticity of skeletal muscle mitochondrial activity and whole animal respiration in a common intertidal triplefin fish, Forsterygion lapillum (Family: Tripterygiidae). J. Comp. Physiology B 184 (8), 991–1001. doi:10.1007/s00360-014-0861-9
Laspoumaderes, C., Meunier, C. L., Magnin, A., Berlinghof, J., Elser, J. J., Balseiro, E., et al. (2022). A common temperature dependence of nutritional demands in ectotherms. Ecol. Lett. 25 (10), 2189–2202. doi:10.1111/ele.14093
Lau, G. Y., Mandic, M., and Richards, J. G. (2017). Evolution of cytochrome c oxidase in hypoxia tolerant sculpins (Cottidae, Actinopterygii). Mol. Biol. Evol. 34 (9), 2153–2162. doi:10.1093/molbev/msx179
Leach, F. (2006). Fishing in pre-European New Zealand. Wellington, N.Z: New Zealand Journal of Archaeology and Archaeofauna.
Lehninger, A., Nelson, D., and Cox, M. (1993). Principles of biochemistry. New York: Worth Publishers.
Mandic, M., Speers-Roesch, B., and Richards, J. G. (2013). Hypoxia tolerance in sculpins is associated with high anaerobic enzyme activity in brain but not in liver or muscle. Physiological Biochem. Zoology 86 (1), 92–105. doi:10.1086/667938
McArley, T., and Herbert, N. (2014). Mortality, physiological stress and reflex impairment in sub-legal Pagrus auratus exposed to simulated angling. J. Exp. Mar. Biol. Ecol. 461, 61–72. doi:10.1016/j.jembe.2014.07.016
McArley, T., Hickey, A. J., Wallace, L., Kunzmann, A., and Herbert, N. (2019). Intertidal triplefin fishes have a lower critical oxygen tension (Pcrit), higher maximal aerobic capacity, and higher tissue glycogen stores than their subtidal counterparts. J. Comp. Physiology B 189 (3), 399–411. doi:10.1007/s00360-019-01216-w
McArley, T. J., Hickey, A. J., and Herbert, N. A. (2017). Chronic warm exposure impairs growth performance and reduces thermal safety margins in the common triplefin fish (Forsterygion lapillum). J. Exp. Biol. 220 (19), 3527–3535. doi:10.1242/jeb.162099
McArley, T. J., Hickey, A. J., and Herbert, N. A. (2018). Hyperoxia increases maximum oxygen consumption and aerobic scope of intertidal fish facing acutely high temperatures. J. Exp. Biol. 221 (22), jeb189993. doi:10.1242/jeb.189993
McArley, T. J., Morgenroth, D., Zena, L. A., Ekström, A. T., and Sandblom, E. (2021). Normoxic limitation of maximal oxygen consumption rate, aerobic scope and cardiac performance in exhaustively exercised rainbow trout (Oncorhynchus mykiss). J. Exp. Biol. 224 (15), jeb242614. doi:10.1242/jeb.242614
McMahon, S. J., Parsons, D. M., Donelson, J. M., Pether, S. M. J., and Munday, P. L. (2019). Elevated CO2 and heatwave conditions affect the aerobic and swimming performance of juvenile Australasian snapper. Mar. Biol. 167 (1), 6. doi:10.1007/s00227-019-3614-1
McMahon, S. J., Parsons, D. M., Donelson, J. M., Pether, S. M. J., and Munday, P. L. (2020). Elevated temperature and CO2 have positive effects on the growth and survival of larval Australasian snapper. Mar. Environ. Res. 161, 105054. doi:10.1016/j.marenvres.2020.105054
McNatt, R. A., and Rice, J. A. (2004). Hypoxia-induced growth rate reduction in two juvenile estuary-dependent fishes. J. Exp. Mar. Biol. Ecol. 311 (1), 147–156. doi:10.1016/j.jembe.2004.05.006
Mills, K. E., Pershing, A. J., Brown, C. J., Chen, Y., Chiang, F.-S., Holland, D. S., et al. (2013). Fisheries management in a changing climate: Lessons from the 2012 ocean heat wave in the northwest atlantic. Oceanography 26 (2), 191–195. doi:10.5670/oceanog.2013.27
Mossman, S. (2008). Snapper: New Zealand's greatest fish = Te ika rangatira o Aotearoa. Auckland N.Z.: AUT Media.
MPI. (2021). Snapper status and information: NZ government. Retrieved from https://www.mpi.govt.nz/fishing-aquaculture/recreational-fishing/information-on-popular-fish-in-nz/snapper-status-and-information/(Accessed January 22, 2023).
Norin, T., and Clark, T. (2016). Measurement and relevance of maximum metabolic rate in fishes. J. fish Biol. 88 (1), 122–151. doi:10.1111/jfb.12796
Norin, T., Malte, H., and Clark, T. D. (2014). Aerobic scope does not predict the performance of a tropical eurythermal fish at elevated temperatures. J. Exp. Biol. 217 (2), 244–251. doi:10.1242/jeb.089755
Oellermann, M., Hickey, A. J. R., Fitzgibbon, Q. P., and Smith, G. (2020). Thermal sensitivity links to cellular cardiac decline in three spiny lobsters. Sci. Rep. 10 (1), 202. doi:10.1038/s41598-019-56794-0
Oliver, E. C., Donat, M. G., Burrows, M. T., Moore, P. J., Smale, D. A., Alexander, L. V., et al. (2018). Longer and more frequent marine heatwaves over the past century. Nat. Commun. 9 (1), 1324. doi:10.1038/s41467-018-03732-9
Parsons, D. M., Sim-Smith, C., Cryer, M., Francis, M., Hartill, B., Jones, E. G., et al. (2014). Snapper (chrysophrys auratus): A review of life history and key vulnerabilities in New Zealand. N. Z. J. Mar. Freshw. Res. 48 (2), 256–283. doi:10.1080/00288330.2014.892013
Pershing, A. J., Alexander, M. A., Hernandez, C. M., Kerr, L. A., Le Bris, A., Mills, K. E., et al. (2015). Slow adaptation in the face of rapid warming leads to collapse of the Gulf of Maine cod fishery. Science 350 (6262), 809–812. doi:10.1126/science.aac9819
Pham, T., Loiselle, D., Power, A., and Hickey, A. J. (2014). Mitochondrial inefficiencies and anoxic ATP hydrolysis capacities in diabetic rat heart. Am. J. Physiology-Cell Physiology 307 (6), C499–C507. doi:10.1152/ajpcell.00006.2014
Pisano, A., Marullo, S., Artale, V., Falcini, F., Yang, C., Leonelli, F. E., et al. (2020). New evidence of mediterranean climate change and variability from sea surface temperature observations. Remote Sens. 12 (1), 132. doi:10.3390/rs12010132
Pörtner, H. O. (2001). Climate change and temperature-dependent biogeography: Oxygen limitation of thermal tolerance in animals. Naturwissenschaften 88 (4), 137–146. doi:10.1007/s001140100216
Pörtner, H. O., Hardewig, I., and Peck, L. S. (1999). Mitochondrial function and critical temperature in the Antarctic bivalve, Laternula elliptica. Comp. Biochem. Physiology Part A Mol. Integr. Physiology 124 (2), 179–189. doi:10.1016/s1095-6433(99)00105-1
Pörtner, H. O., and Lannig, G. (2009). “Chapter 4 oxygen and capacity limited thermal tolerance,” in Fish physiology. Editors J. G. Richards, A. P. Farrell, and C. J. Brauner (Cambridge: Academic Press), 143–191. doi:10.1016/S1546-5098(08)00004-6
Reeve, C., Rowsey, L. E., and Speers-Roesch, B. (2022). Inactivity and the passive slowing effect of cold on resting metabolism as the primary drivers of energy savings in overwintering fishes. J. Exp. Biol. 225 (8), jeb243407. doi:10.1242/jeb.243407
Rogers, N. J., Urbina, M. A., Reardon, E. E., McKenzie, D. J., and Wilson, R. W. (2016). A new analysis of hypoxia tolerance in fishes using a database of critical oxygen level (Pcrit). Conserv. Physiol. 4 (1), cow012. doi:10.1093/conphys/cow012
Salin, K., Auer, S. K., Rey, B., Selman, C., and Metcalfe, N. B. (2015). Variation in the link between oxygen consumption and ATP production, and its relevance for animal performance. Proc. R. Soc. B Biol. Sci. 282 (1812), 20151028. doi:10.1098/rspb.2015.1028
Sandblom, E., Gräns, A., Axelsson, M., and Seth, H. (2014). Temperature acclimation rate of aerobic scope and feeding metabolism in fishes: Implications in a thermally extreme future. Proc. R. Soc. B Biol. Sci. 281, 20141490. doi:10.1098/rspb.2014.1490
Schmidt-Nielsen, K. (1997). Animal physiology: Adaptation and environment. Cambridge: Cambridge University Press.
Schulte, P. M. (2015). The effects of temperature on aerobic metabolism: Towards a mechanistic understanding of the responses of ectotherms to a changing environment. J. Exp. Biol. 218 (12), 1856–1866. doi:10.1242/jeb.118851
Schurmann, H., and Steffensen, J. (1997). Effects of temperature, hypoxia and activity on the metabolism of juvenile Atlantic cod. J. fish Biol. 50 (6), 1166–1180. doi:10.1006/jfbi.1997.0387
Scott, S. G., and Pankhurst, N. W. (1992). Interannual variation in the reproductive cycle of the New Zealand snapper Pagrus auratus (Bloch and Schneider) (Sparidae). J. fish Biol. 41 (5), 685–696. doi:10.1111/j.1095-8649.1992.tb02698.x
Scott, S. G., Zeldis, J. R., and Pankhurst, N. W. (1993). Evidence of daily spawning in natural populations of the New Zealand snapper Pagrus auratus (Sparidae). Environ. Biol. fishes 36 (2), 149–156. doi:10.1007/bf00002794
Seebacher, F., Brand, M. D., Else, P. L., Guderley, H., Hulbert, A. J., and Moyes, C. D. (2010). Plasticity of oxidative metabolism in variable climates: Molecular mechanisms. Physiological Biochem. Zoology 83 (5), 721–732. doi:10.1086/649964
Seibel, B. A., Andres, A., Birk, M. A., Burns, A. L., Shaw, C. T., Timpe, A. W., et al. (2021). Oxygen supply capacity breathes new life into critical oxygen partial pressure (Pcrit). J. Exp. Biol. 224 (8), jeb242210. doi:10.1242/jeb.242210
Sim-Smith, C. J., Jeffs, A. G., and Radford, C. A. (2013a). Balancing the odds: The relationship between growth and energy storage in juvenile snapper (chrysophrys auratus:sparidae). Mar. Freshw. Res. 64 (11), 1003–1010. doi:10.1071/MF12345
Sim-Smith, C. J., Jeffs, A. G., and Radford, C. A. (2013b). Environmental influences on the larval recruitment dynamics of snapper, Chrysophrys auratus (Sparidae). Mar. Freshw. Res. 64 (8), 726–740. doi:10.1071/MF12255
Smale, D. A., Wernberg, T., Oliver, E. C., Thomsen, M., Harvey, B. P., Straub, S. C., et al. (2019). Marine heatwaves threaten global biodiversity and the provision of ecosystem services. Nat. Clim. change 9 (4), 306–312. doi:10.1038/s41558-019-0412-1
Steffensen, J. F. (1989). Some errors in respirometry of aquatic breathers: How to avoid and correct for them. Fish Physiology Biochem. 6 (1), 49–59. doi:10.1007/BF02995809
Thomsen, M. S., Mondardini, L., Alestra, T., Gerrity, S., Tait, L., South, P. M., et al. (2019). Local extinction of bull kelp (Durvillaea spp) due to a marine heatwave. Front. Mar. Sci. 6, 84. doi:10.3389/fmars.2019.00084
Vaquer-Sunyer, R., and Duarte, C. M. (2008). Thresholds of hypoxia for marine biodiversity. Proc. Natl. Acad. Sci. 105 (40), 15452–15457. doi:10.1073/pnas.0803833105
Wakefield, C. B., Potter, I. C., Hall, N. G., Lenanton, R. C., and Hesp, S. A. (2015). Marked variations in reproductive characteristics of snapper (Chrysophrys auratus, Sparidae) and their relationship with temperature over a wide latitudinal range. ICES J. Mar. Sci. 72 (8), 2341–2349. doi:10.1093/icesjms/fsv108
Watson, G. J. (2018). Winners’ and ‘losers’ in the anthropocene: Understanding adaptation through phenotypic plasticity. Funct. Ecol. 32, 1906–1907. doi:10.1111/1365-2435.13108
Welch, B. L. (1951). On the comparison of several mean values: An alternative approach. Biometrika 38 (3/4), 330–336. doi:10.2307/2332579
Wellenreuther, M., Le Luyer, J., Cook, D., Ritchie, P. A., and Bernatchez, L. (2019). Domestication and temperature modulate gene expression signatures and growth in the Australasian snapper Chrysophrys auratus. G3 Genes, Genomes, Genet. 9 (1), 105–116. doi:10.1534/g3.118.200647
Wells, R., and Dunphy, B. (2009). Potential impact of metabolic acidosis on the fixed-acid Bohr effect in snapper (Pagrus auratus) following angling stress. Comp. Biochem. Physiology Part A Mol. Integr. Physiology 154 (1), 56–60. doi:10.1016/j.cbpa.2009.04.625
Wells, R., and Weber, R. (1990). The spleen in hypoxic and exercised rainbow trout. J. Exp. Biol. 150, 461–466. doi:10.1242/jeb.150.1.461
Wolfe, B. W., Fitzgibbon, Q. P., Semmens, J. M., Tracey, S. R., and Pecl, G. T. (2020). Physiological mechanisms linking cold acclimation and the poleward distribution limit of a range-extending marine fish. Conserv. Physiol. 8 (1), coaa045. doi:10.1093/conphys/coaa045
Wood, C. M. (2018). The fallacy of the Pcrit – are there more useful alternatives? J. Exp. Biol. 221 (22), jeb163717. doi:10.1242/jeb.163717
Wu, R. (2002). Hypoxia: From molecular responses to ecosystem responses. Mar. Pollut. Bull. 45(1), 35–45. doi:10.1016/S0025-326X(02)00061-9
Zanotti, A., and Azzone, G. F. (1980). Safranine as membrane potential probe in rat liver mitochondria. Archives Biochem. Biophysics 201 (1), 255–265. doi:10.1016/0003-9861(80)90510-x
Zeldis, J. R., Currie, K. I., Graham, S. L., and Gall, M. P. (2022). Attributing controlling factors of acidification and hypoxia in a deep, nutrient-enriched estuarine embayment. Front. Mar. Sci. 8, 2107. doi:10.3389/fmars.2021.803439
Zukiene, R., Nauciene, Z., Ciapaite, J., and Mildaz˘ ienė, V. (2010). Acute temperature resistance threshold in heart mitochondria: Febrile temperature activates function but exceeding it collapses the membrane barrier. Int. J. Hyperth. 26 (1), 56–66. doi:10.3109/02656730903262140
Keywords: hypoxia-tolerance, thermal-tolerance, mitochondria, respirometry, heart, fish, metabolism
Citation: Bowering LR, McArley TJ, Devaux JBL, Hickey AJR and Herbert NA (2023) Metabolic resilience of the Australasian snapper (Chrysophrys auratus) to marine heatwaves and hypoxia. Front. Physiol. 14:1215442. doi: 10.3389/fphys.2023.1215442
Received: 02 May 2023; Accepted: 05 July 2023;
Published: 17 July 2023.
Edited by:
Folco Giomi, Independent Researcher, Padova, ItalyReviewed by:
Markus Frederich, University of New England, United StatesCopyright © 2023 Bowering, McArley, Devaux, Hickey and Herbert. This is an open-access article distributed under the terms of the Creative Commons Attribution License (CC BY). The use, distribution or reproduction in other forums is permitted, provided the original author(s) and the copyright owner(s) are credited and that the original publication in this journal is cited, in accordance with accepted academic practice. No use, distribution or reproduction is permitted which does not comply with these terms.
*Correspondence: Neill A. Herbert, bi5oZXJiZXJ0QGF1Y2tsYW5kLmFjLm56
Disclaimer: All claims expressed in this article are solely those of the authors and do not necessarily represent those of their affiliated organizations, or those of the publisher, the editors and the reviewers. Any product that may be evaluated in this article or claim that may be made by its manufacturer is not guaranteed or endorsed by the publisher.
Research integrity at Frontiers
Learn more about the work of our research integrity team to safeguard the quality of each article we publish.