
94% of researchers rate our articles as excellent or good
Learn more about the work of our research integrity team to safeguard the quality of each article we publish.
Find out more
ORIGINAL RESEARCH article
Front. Physiol., 03 January 2024
Sec. Computational Physiology and Medicine
Volume 14 - 2023 | https://doi.org/10.3389/fphys.2023.1189464
 Chiara Celotto1,2*
 Carlos Sánchez1,2
 Mostafa Abdollahpur3
 Frida Sandberg3
 Jose F. Rodriguez Mstas4
 Pablo Laguna1,2
 Esther Pueyo1,2
In atrial fibrillation (AF), the ECG P-wave, which represents atrial depolarization, is replaced with chaotic and irregular fibrillation waves (f waves). The f-wave frequency, Ff, shows significant variations over time. Cardiorespiratory interactions regulated by the autonomic nervous system have been suggested to play a role in such variations. We conducted a simulation study to test whether the spatiotemporal release pattern of the parasympathetic neurotransmitter acetylcholine (ACh) modulates the frequency of atrial reentrant circuits. Understanding parasympathetic involvement in AF may guide more effective treatment approaches and could help to design autonomic markers alternative to heart rate variability (HRV), which is not available in AF patients. 2D tissue and 3D whole-atria models of human atrial electrophysiology in persistent AF were built. Different ACh release percentages (8% and 30%) and spatial ACh release patterns, including spatially random release and release from ganglionated plexi (GPs) and associated nerves, were considered. The temporal pattern of ACh release, ACh(t), was simulated following a sinusoidal waveform of frequency 0.125 Hz to represent the respiratory frequency. Different mean concentrations
The heart rhythm is controlled by a multilevel neural network with involvement of the central nervous system and peripheral autonomic nervous system (ANS), the latter exerting its activity through the sympathetic and parasympathetic branches (Shivkumar et al., 2016). The intrinsic cardiac nervous system is organized in clusters of autonomic ganglia called ganglionated plexi (GPs) and in an epicardial neural network of local circuit neurons that work as inter- and intra-ganglionic connections. The role of the GPs is to modulate cardiac electrophysiology, acting as a local hub to integrate the inputs from the epicardial neural network and from the extrinsic innervation. The activation of efferent neurons acts to modulate the heart rate, the atrioventricular node conduction and the inotropism of atria and ventricles (Fedele and Brand, 2020).
It has been shown that ANS activity is closely related to the genesis and maintenance of atrial arrhythmias, including atrial fibrillation (AF) (Chang et al., 2016). While sympathetic activation mainly acts as a trigger by facilitating the generation of ectopic beats, vagal hyperactivity facilitates the formation of reentries by shortening the wavelength of reentry (WL), defined as the distance traveled by the depolarization wave during the effective refractory period (ERP) (Rohr et al., 1998) and estimated as the product of the CV and ERP. In fact, acetylcholine (ACh), the neurotransmitter released by pre- and postganglionic parasympathetic nerve terminals, shortens action potential (AP) duration (APD) and hyperpolarizes the resting membrane potential (RMP) in a dose-dependent manner. Hyperpolarization of the RMP leads to a reduction in the maximum upstroke velocity of the AP (Rohr et al., 1998), which can also slow CV.
During AF, the P-waves of the electrocardiogram (ECG), representative of atrial activation, are replaced with a series of waves known as fibrillatory waves (f waves) (Sörnmo et al., 2018). Some f-wave features have been proposed to characterize atrial electrical activity during AF, including the amplitude, morphology, regularity, complexity and frequency (Petrutiu et al., 2006; Meo et al., 2013; Lankveld et al., 2014; Sörnmo et al., 2018. Among those features, the f-wave frequency (Ff), often referred to as the atrial fibrillatory rate, has received considerable clinical attention (Lankveld et al., 2014; Platonov et al., 2014; Östenson et al., 2017). The mean f-wave frequency, also referred to as the atrial fibrillatory rate (AFR), has been associated with the complexity of arrhythmias. Lower AFR values have been linked to a higher likelihood of spontaneous cardioversion in patients with paroxysmal atrial fibrillation (pxAF) (Bollmann et al., 1999; Choudhary et al., 2013). Moreover, shorter AF episodes tend to exhibit lower AFR values compared to longer-lasting episodes, with AFR decreasing before termination (Bollmann et al., 1999). We believe that monitoring changes in the parameter Ff over time can provide valuable insights. Upon confirmation that the temporal variations in Ff offer indications of parasympathetic activity, they could potentially guide therapies aimed at modulating autonomic nervous system activity, which has long been recognized as an important contributing factor to proarrhythmia, and possibly replace HRV markers not quantifiable in AF. Different methods have been employed to compute Ff. In some studies, Ff has been derived through spectral (frequency domain) analysis by identifying the frequency presenting the highest peak in the power spectral density (Park et al., 2019). In other works, Ff has been extracted from the analysis of the ECG in the time domain using a model-based approach (Henriksson et al., 2018; Abdollahpur et al., 2021).
Previous studies have shown that Ff can be influenced by changes in the autonomic tone. For instance, Ff has been shown to increase in response to head-up tilt (Ingemansson et al., 1998) and decrease in response to head-down tilt (Ingemansson et al., 1998; Östenson et al., 2017). These tilt maneuvers are known to modulate the activity of the parasympathetic and sympathetic nervous systems. In sinus rhythm, cardiorespiratory interactions through the ANS have been widely studied (Yasuma and Hayano, 2004), with respiratory sinus arrhythmia (RSA) defined as the autonomically-mediated modulation of the sinus node pacemaker frequency in synchrony with inspiration and expiration (Hirsch and Bishop, 1981; Eckberg, 1983; Piepoli et al., 1997; Eckberg, 2000; Eckberg, 2003; Yasuma and Hayano, 2004). The contribution of RSA to heart rate variability (HRV) can be measured from the high-frequency components of HRV and can be used for noninvasive assessment of parasympathetic activity (Kunze, 1972; Katona and Jih, 1975; Eckberg, 1983; Piepoli et al., 1997; Eckberg, 2003). Associated with enhanced vagal activity (Masé et al., 2008). There is currently a need for non-invasive methods to assess ANS activity during AF other than HRV, which cannot be used to measure ANS activity during AF since heartbeats do not originate in the sinoatrial node (SAN). It is worth exploring the impact of differences in ANS activity among AF patients on their responses to treatment. The hyperactivity of the parasympathetic nervous system has been established as a mechanism that promotes the initiation of AF. However, this observation may apply to some patients but not to others. Abdollahpur et al. found that the respiratory modulation of f-waves was reduced in some patients after full vagal blockade, while in others, it remained unchanged (Abdollahpur et al., 2021). Being able to non-invasively assess vagal activity could guide clinicians towards one treatment approach over another, whether it be pharmacological therapy, cardioneuroablation, or neural modulation treatments. However, there is limited research on how respiration affects atrial rate during atrial tachyarrhytmias, particularly AF, primarily due to technical difficulties (Holmqvist et al., 2005). These difficulties include distinguishing noise from f-waves, the presence of modulation that is unrelated to the respiratory signal, the very small magnitude of the respiratory-induced f-wave frequency modulation that may be concealed by other variations and the unknown and variable respiration rate over time. The study by Abdollahpur et al. (2022), Respiratory induced f-wave frequency variations were observed at baseline and during deep breathing. The study by Holmqvist et al. and the follow-up by Abdollahpur et al. (2021) were, however, able to show that low frequency-controlled respiration can induce cyclic fluctuations in Ff, which may be linked to parasympathetic regulation of the atrial WL, given that the modulation was reduced in response to vagal blockade.
We used computational modeling and simulation to evaluate the role of the spatiotemporal release pattern of ACh, considered to temporally vary in phase with inspiration and expiration, in the modulation of the f-wave frequency. Both two-dimensional (2D) tissues and three-dimensional (3D) whole-atria models representative of persistent AF (psAF) were built and distinct spatial distributions of ACh release sites were defined in the models. Also, different stimulation protocols were simulated to evaluate the role of the spatiotemporal ACh release pattern combined with the reentry characteristics on the fibrillatory rate. To provide a more extensive characterization, Ff was analyzed in terms of mean
Human atrial electrical activity was simulated in 2D square sheets of tissue and in 3D biatrial anatomical models. The 2D models represented square pieces of tissue of 7 × 7 cm, discretized in square elements of 200 μm side. A uniform bottom-to-top fiber direction was assigned to the tissues. For the 3D biatrial models, the anatomy was in all cases defined as in Ferrer et al. (2015). The 3D anatomical model was discretized using linear hexahedral elements with an average edge length of 300 μm. The wall thickness varied between 600 and 900 μm, resulting in 2 or 3 hexahedral elements arranged transversely. This resulted in a total of 754,893 nodes and 515,010 elements. The model included detailed regional descriptions of fiber direction and functional heterogeneity, considering eight regions with different electrophysiological properties.
To simulate the electrophysiological activity of the cardiomyocytes, the Courtemanche human atrial AP model was used (Courtemanche et al., 1998). In the 2D models, all the myocardial nodes were assigned with the same electrophysiological characteristics representative of left atrial tissue. In the 3D models, the Courtemanche model was adapted to represent different atrial regions by varying the ionic current conductances as in Ferrer et al. (2015). These adjustments were made based on experimental observations regarding AP morphology and duration reported in several studies (Wang et al., 1990; Wang et al., 1993; Feng et al., 1998; Li et al., 2001; Cha et al., 2005; Seemann et al., 2006). The eight regions with different electrophysiological characteristics were: left atrium (LA), right atrium (RA), left atrial appendage (LAA), right atrial appendage (RAA), pulmonary veins (PV), tricuspid valve ring (TVR), mitral valve ring (MVR), crista terminalis and Bachmann bundle (CTBB). In Supplementary Figure S1, the APs corresponding to these regions are shown.
To model cholinergic stimulation, an ACh-activated potassium current (IKACh) was introduced in the AP model following the formulation developed by Kneller et al. (2002) and updated by Bayer et al. (2019), as in previous studies (Celotto et al., 2021; Celotto et al., 2023). The equation is reported below:
where ACh(t) is the ACh concentration at time “t” expressed in μM, Vm(t) is the membrane potential and Ek(t) is the Nernst potential for potassium.
Electrical remodeling associated with psAF was represented by altering the conductances of four ionic currents. The conductances of the transient outward potassium current (Ito), the L-type calcium current (ICaL) and the ultrarapid delayed rectifier potassium current (IKur) were reduced by 50%, 70% and 50%, respectively, as in Courtemanche (1999), and the conductance of the inward rectifier potassium current (IK1) was increased by 100% (Dobrev et al., 2001).
PsAF-induced structural remodeling was modeled by including 20% diffuse fibrosis on the basis of histological studies reporting diffuse fibrosis percentages up to 40%, with a mean of approximately 20%, in psAF patients (Platonov et al., 2011; Ma et al., 2021). Both in the 2D and 3D models, 20% of the nodes were uniformly randomly selected. These nodes were assigned with fibroblast properties and their electrical activity was defined by the MacCannell active fibroblast computational AP model (MacCannell et al., 2007). This model comprises a time- and voltage-dependent potassium current (IKv), an inward rectifying potassium current (IK1), a sodium-potassium pump current (INaK) and a background sodium current (IbNa) (MacCannell et al., 2007). The fibroblast-fibroblast gap-junctional conductance was reduced 4-fold with respect to the myocyte-myocyte conductance described in the following paragraph. Our approach aligns with previous computational studies, which simulated gap junction remodeling in AF-remodeled tissues by reducing the conductance to similar levels (Li et al., 1999; Burstein et al., 2009; McDowell et al., 2013; Krueger et al., 2014). When myocytes were coupled to fibroblasts, the junctional conductance was linearly adjusted depending on the number of fibroblasts coupled to a myocyte.
The myocyte-myocyte conductance was adapted to match experimental evidence in terms of CV and total activation time (TAT). In the 3D models, we used values of longitudinal conductivity (LCV) and transverse-to-longitudinal conductivity ratio (T/LCR) that were adapted from Ferrer et al. (2015) for different atrial regions. In their study, Ferrer et al. (2015) initially identified 21 anatomical atrial regions characterized by the same CV, on the base of anatomical and histological information. However, they found that only ten regions significantly influenced the body surface potential maps and the main features of the P-wave. Building upon their work, our study focused on these ten anatomical regions. Particularly, for definition of the conductivity values, we considered ten atrial regions: LA, RA, PV, SAN, coronary sinus (CS), isthmus (IST), the fossa ovalis (FO) and its limb (LFO), the crista terminalis (CT), the Bachmann bundle and the pectinate muscles (BBPM). The defined conductivity values, reported in Supplementary Table S1, led to a TAT of 180 ms, in line with data reported in the literature for psAF patients (Wesselink et al., 2022).
It is worth noting that the heterogeneities in electrophysiological characteristics and in conductivities were defined by using eight and ten atrial regions, respectively, so as to match experimental evidence. The characteristics defining tissue conductivity are in fact independent of the electrophysiological characteristics of the myocytes.
In the 2D models, we used the same values of longitudinal conductivity and transverse-to-longitudinal conductivity ratio as in the LA region of the 3D model, which rendered a longitudinal CV of 50 cm/s for a planar wave, in agreement with values reported for AF patients in previous studies (Bayer et al., 2019).
We defined four different 3D models corresponding to distinct spatial ACh release configurations throughout the atria. These models were based on different experimental and computational studies, resulting in two different volumetric percentages of ACh release sites (i.e., 8% and 30%). The ACh release was transmural, with ACh release nodes being found all throughout the transmural wall (except for the
The base of our atrial models of ACh release is the experimental anatomical study by Armour et al. (1997), which mapped the major atrial and ventricular GPs. This study provided us with information on the location and size of GP cores, as represented in Figure 1. The following five major GPs were considered: the superior right atrial GP (SRA-GP), located on the posterior superior surface of the RA close to the junction of the SVC and RA; the superior left atrial GP (SLA-GP), located on the posterior surface of the LA between the PVs; the posterior right atrial GP (PRA-GP), located on the posterior surface of the RA adjacent to the inter-atrial groove; the posteromedial left atrial GP (PMLA-GP), located on the posterior medial surface of the LA; and the posterolateral left atrial GP (PLLA-GP), located on the posterior lateral surface of the LA base on the atrial side of the atrioventricular groove. To account for the communication of GPs with the atrial tissue, we integrated the octopus hypothesis based on prior experimental and computational studies (Zhou et al., 2007; Hwang et al., 2016). This hypothesis suggests that the GPs send out eight branches, each about 2 cm long (Hwang et al., 2016), representing the main nerves that branch off from them. Finally, we accounted for the transmural distribution of nerve plexuses. Considering that the neural cell distribution is mainly epicardial (Tan et al., 2006), we concentrated the ACh release mostly in the two more external layers, as represented in Supplementary Figure S2. The resulting model, denoted as
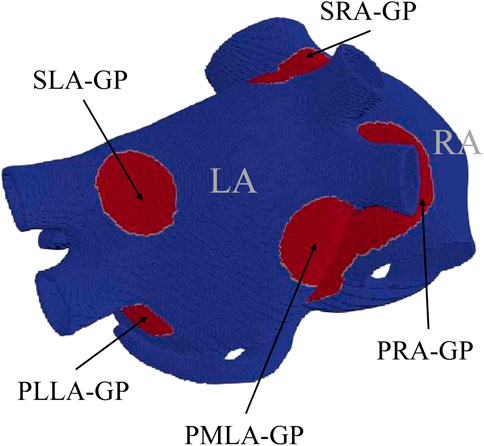
FIGURE 1. Computational model used in this study, with GPs represented in red, following the anatomical description by Armour et al. (1997).
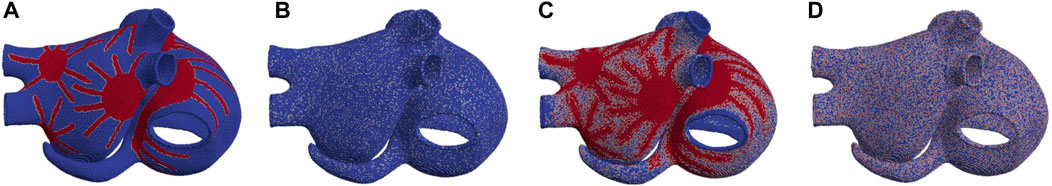
FIGURE 2. 3D biatrial anatomies, with ACh release nodes depicted in red. Representation of (A)
To build two additional models, we introduced a new hypothesis: the existence of minor branches that extend from the GPs and main nerves (Pauza et al., 2000; Fedele and Brand, 2020). We simplified this assumption by selecting nodes randomly, with percentages decreasing gradually as one moves radially away from the GPs and main nerves. Starting from the
In 2D, we defined two models of ACh release. In these models, denoted as
Table 1 reports a summary of the different ACh release configurations.
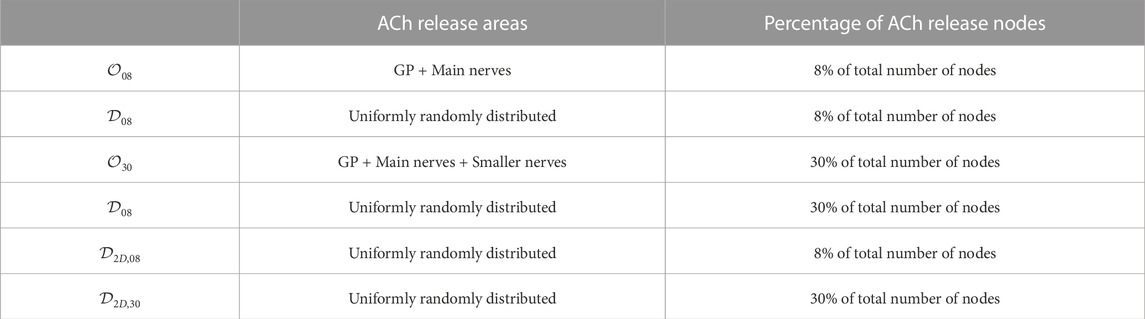
TABLE 1. Summary of the different ACh release configurations.
For both 2D and 3D models and for each of the identified release nodes, ACh was simulated to cyclically vary in time following a sinusoidal waveform of frequency equal to 0.125 Hz, which corresponds to the controlled respiratory frequency of the clinical recordings. We tested different mean concentrations of ACh
Furthermore, to investigate potential frequency-dependent behaviors and differences in modulation patterns, additional simulations were conducted. Additional frequencies of 0.20 and 0.33 Hz were specifically tested in 2D tissues and in 3D biatrial models stimulated with a train of ectopic beats. The
Electrical propagation in the atria was described by the monodomain model and solved by means of the finite element method in combination with the operator splitting numerical scheme using the software ELVIRA (Heidenreich et al., 2010).
Single cells were paced at a fixed cycle length (CL) of 800 ms for 16 min to reach steady state. For 2D and 3D simulations, the state variables of the AP models were initialized to the steady-state values determined from single cell simulations.
Both the 2D and 3D models were pre-paced by delivering 14 stimuli at a CL of 800 ms. In the 2D tissues, the stimuli were applied onto the bottom edge of the tissue. In the 3D models, the stimuli were applied onto the region of the sinus node.
In the 2D tissue models, an S1-S2 cross-stimulation protocol was applied to initiate a rotor: the first stimulus (S1) was applied at the bottom edge of the tissue and the second stimulus (S2) was applied onto a 3.5 × 3.5 cm square at the bottom right corner.
In the 3D whole-atria models, two protocols were applied to initiate arrhythmias. The first one was an S1-S2 protocol similar to the one applied onto the 2D tissue, with the S1 stimulus delivered at a line joining the region between the superior and inferior left PVs and the region between the right PVs, and the S2 stimulus being subsequently applied parallel to the first one starting from the inferior left PV and covering only half of the S1 line length. The second protocol aimed to recreate a physiological setting and consisted in the application of an S1 stimulus followed by a train of premature stimuli delivered at a region surrounding the PVs, where ectopic beats are usually generated. In total, 10 stimuli were applied, with the first interval between stimuli being 200 ms and these intervals decreasing in 10-ms steps. Supplementary Figure S3 displays the delivery locations for S1 and S2 stimuli (panel (A)) and the delivery location of the ectopic beats (panel (B)).
From the simulations, voltage time series were extracted from 169 evenly sampled points in the 2D tissue models and 223 points manually selected to be approximately uniformly distributed in the 3D whole-atria models (white dots in Figures 3A, B).
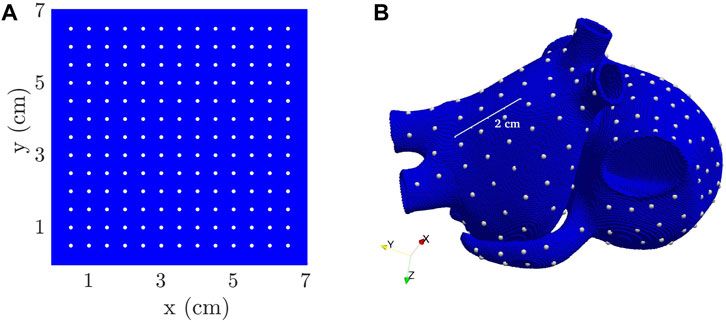
FIGURE 3. 2D tissue (A) and 3D biatrial (B) models, with white dots representing the points used for the computation of Ff.
The AP trace for a point j0 in a 2D tissue is illustrated in Figure 4A. For each point j in each 2D tissue or 3D anatomy, the time instant tm (j, i) corresponding to the maximum AP upstroke velocity of the ith beat was determined (Figure 4B). The instantaneous frequency was computed as Ff,j (tm (j, i)) = 1/(tm (j, i) − tm (j, i − 1)) and linearly interpolated at 20 Hz to obtain Ff,j(t), which is depicted in Figure 4C for point j = j0. Next, averaging (in space) was performed to compute the tissue dominant frequency Ff(t) along time, as follows. First, each Ff,j(t) was subjected to power spectral analysis to obtain Sj(f). Spectral “peak-conditioned” selection was performed following the method described in Bailón et al. (2006) and the time series whose spectra were not sufficiently peaked were discarded (Figures 4D, E). Ff(t) was eventually computed as the spatial mean of the remaining time series (Figure 4F). Finally,
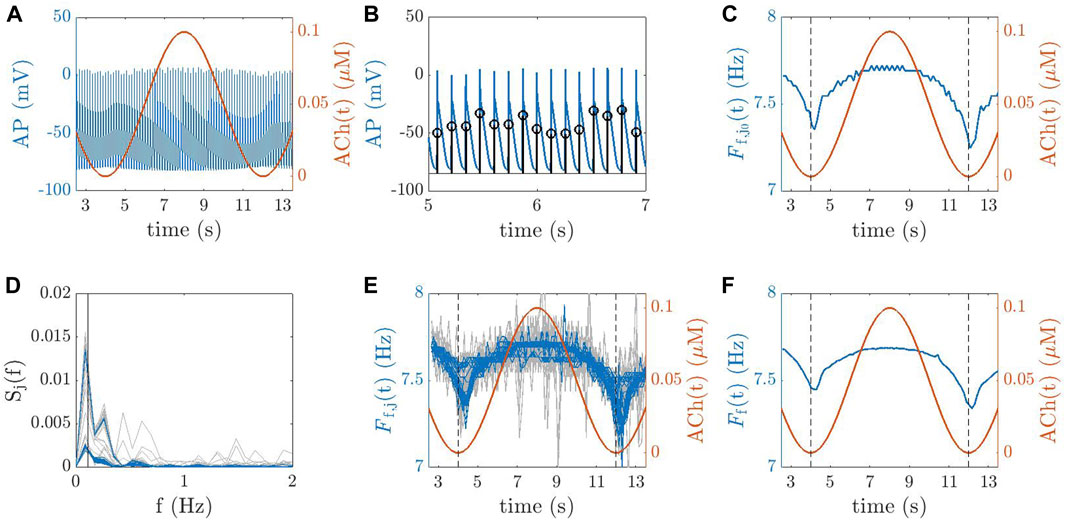
FIGURE 4. (A) AP trace for a point j0 in a 2D tissue (blue line) and ACh temporal variation, ACh(t) (red line). (B) Identification of the time instants for each beat i, denoted as tm (j0, i), corresponding to the maximum AP upstroke velocity for the point j0. (C) Instantaneous frequency
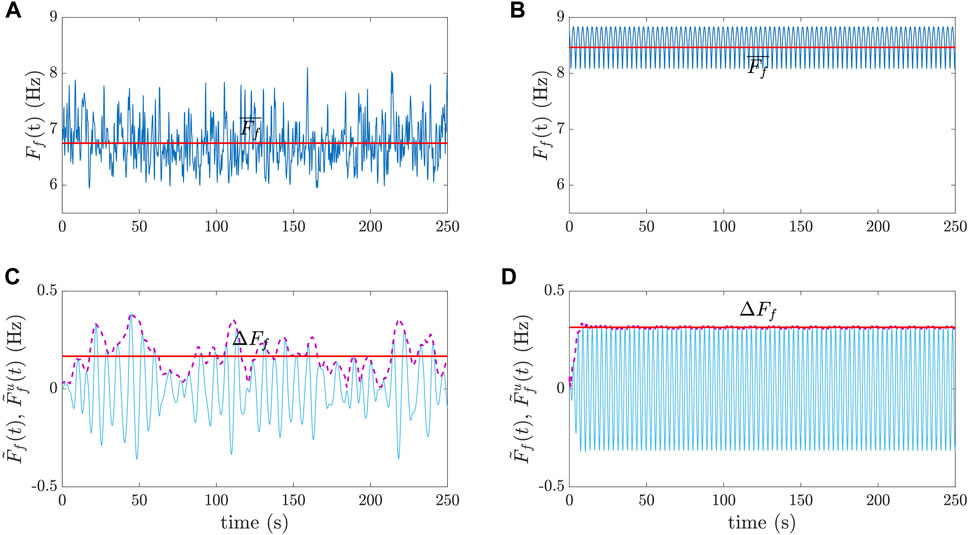
FIGURE 5. Examples of
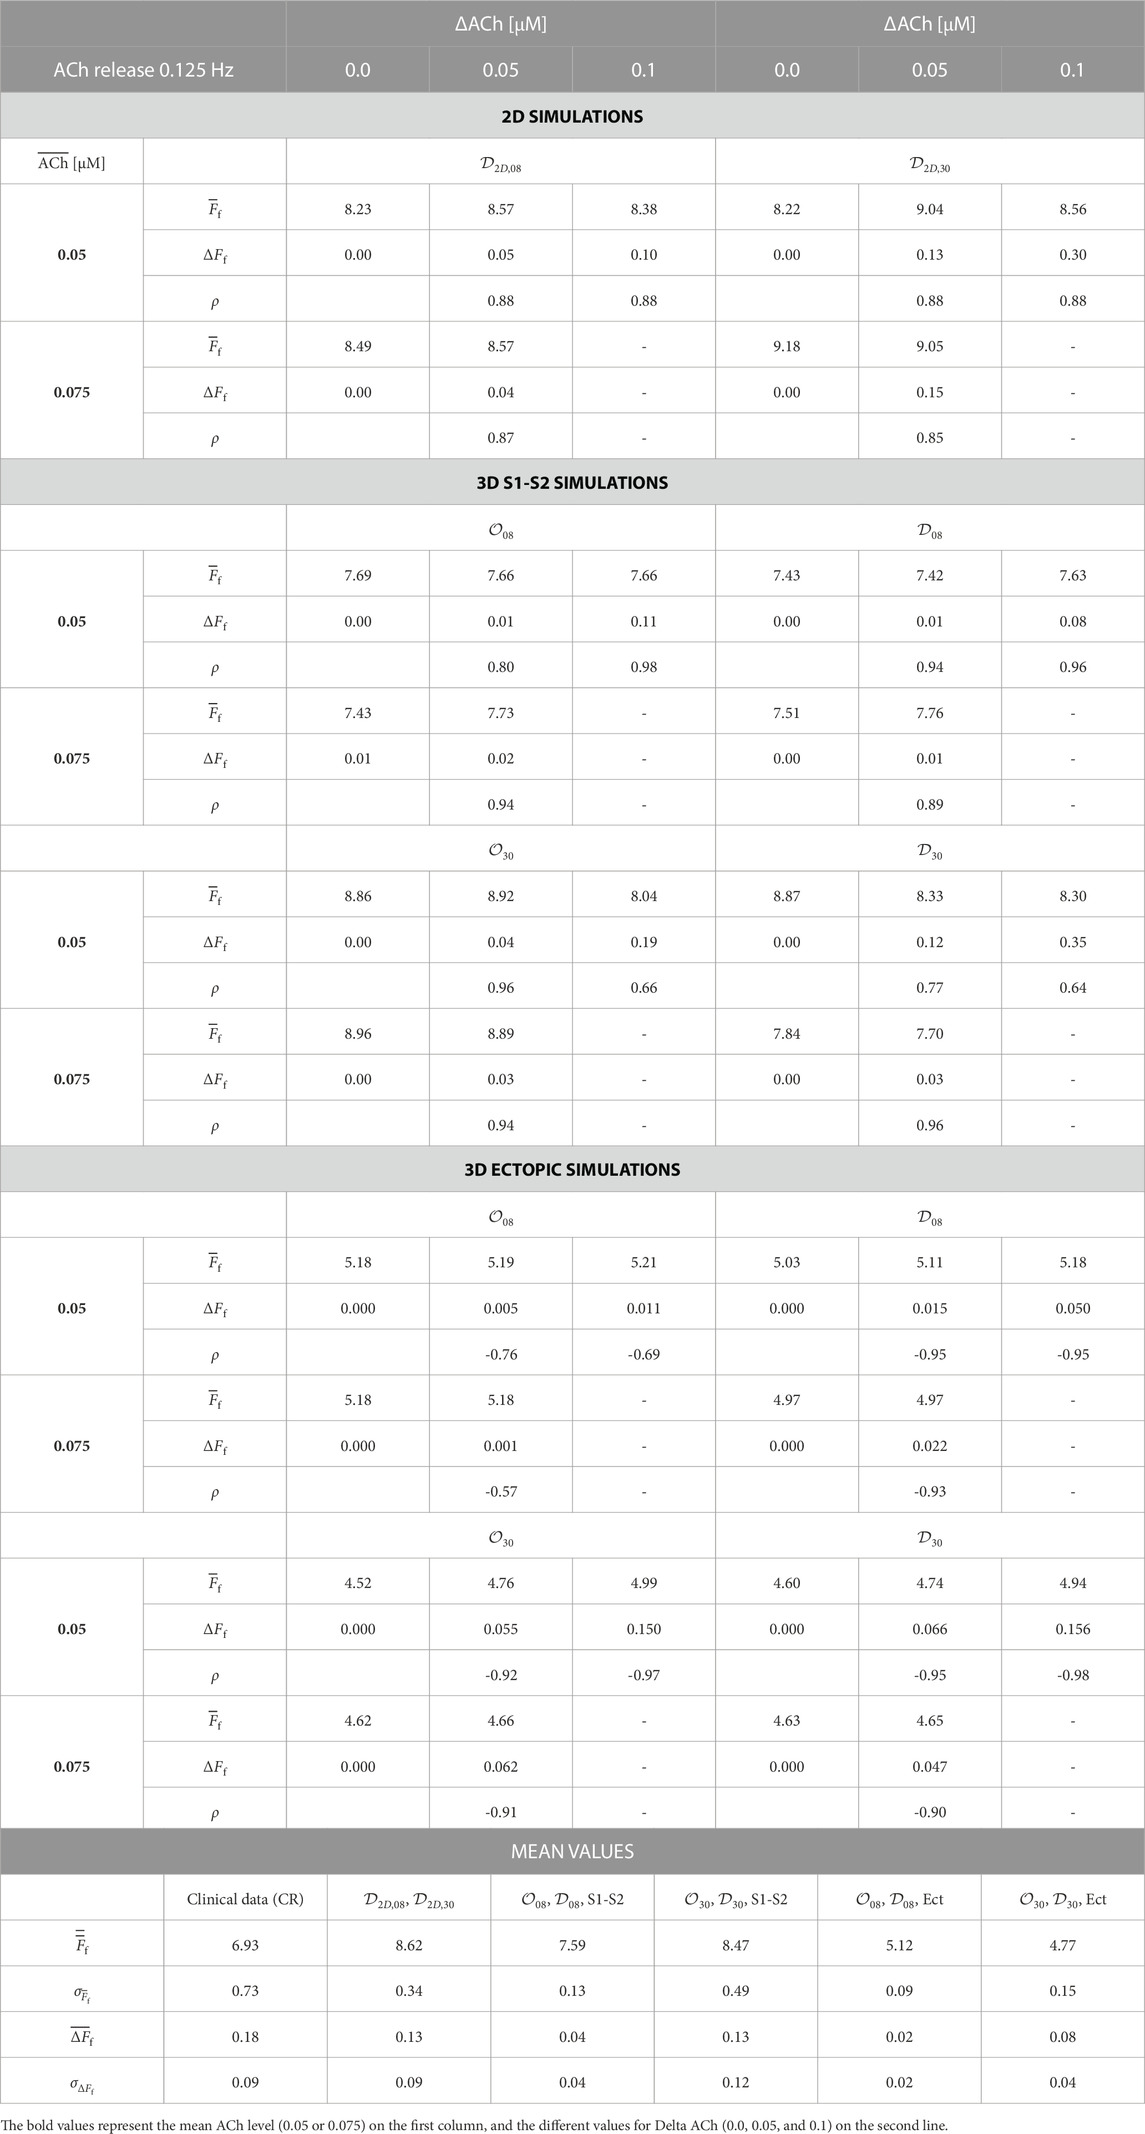
TABLE 2.
By modeling and simulation of human atrial electrophysiology, we aimed at reproducing variations in Ff like those described in previous clinical studies (Holmqvist et al., 2005; Abdollahpur et al., 2021). A group of eight patients with psAF, atrioventricular block III and a permanent pacemaker was studied to investigate the modulation of Ff by respiration and its parasympathetic regulation. The study was conducted in accordance with the Declaration of Helsinki, and the protocol was approved by the local Ethics Committee. All subjects gave their informed consent for inclusion before they participated in the study. ECGs were recorded at rest during baseline (spontaneous respiration)
From the simulations, results will be presented in terms of
From the patients,
To evaluate the correlation between the variation in ACh concentration over time (ACh(t)) and the corresponding fibrillatory frequency signal Ff(t) in the simulations, we used Spearman correlation coefficient (ρ).
In the clinical setting, the significance of the variations in the magnitude of the frequency modulation ΔFf and in
In all patients, the ECGs showed an f-wave frequency modulation in the
Results in terms of mean dominant frequency
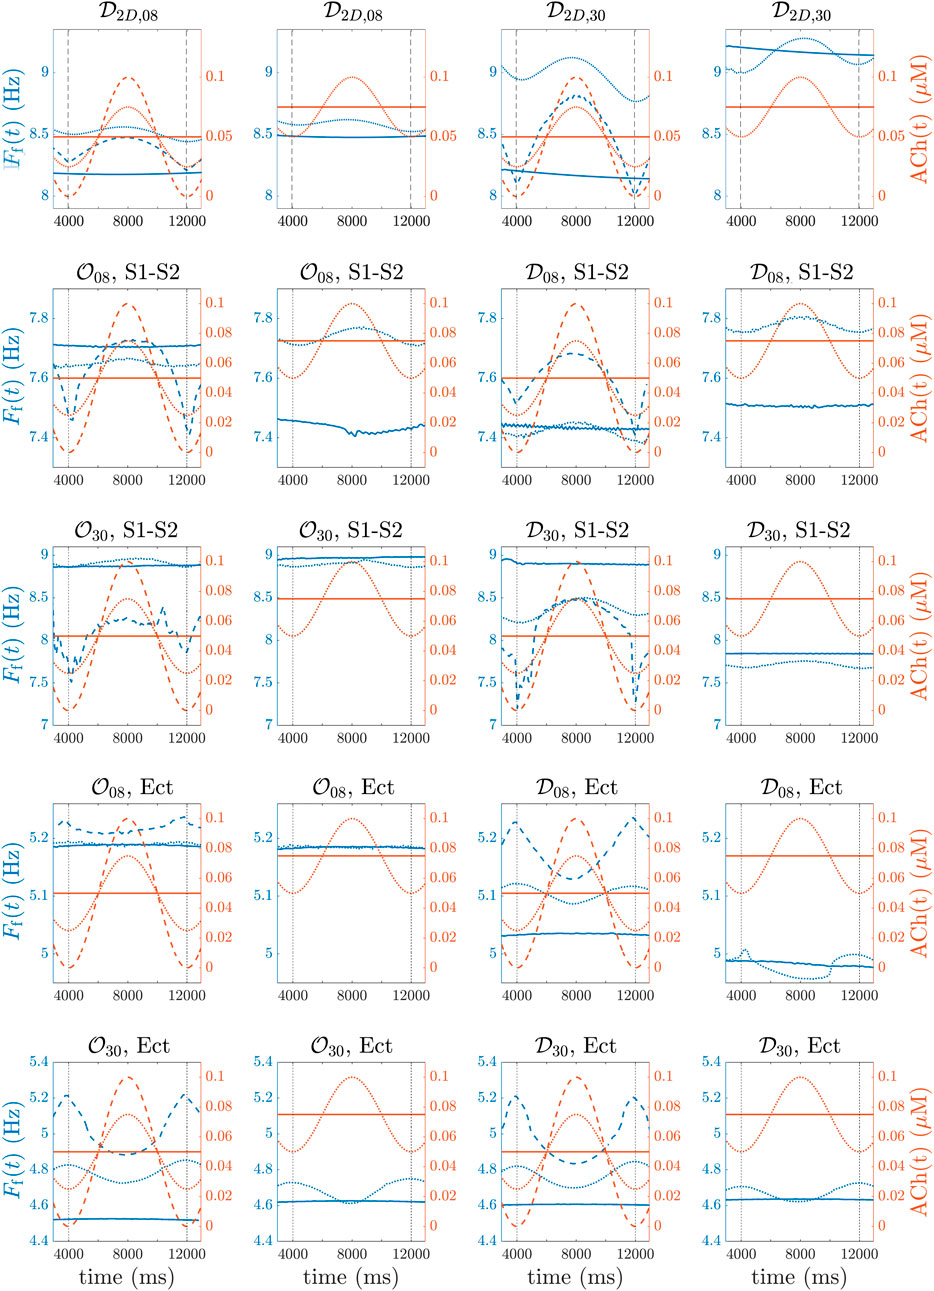
FIGURE 6. (first row, (A–D)), 3D biatrial simulations with
In the 3D biatrial models, S1-S2 stimulation was able to generate multiple stable rotors. The induced fibrillatory patterns were different for the distinct spatial configurations of ACh release, with the generation of 2–5 stable rotors, as represented in Figure 7. We observed a general increase in the number of stable rotors with the highest percentage of ACh release nodes (
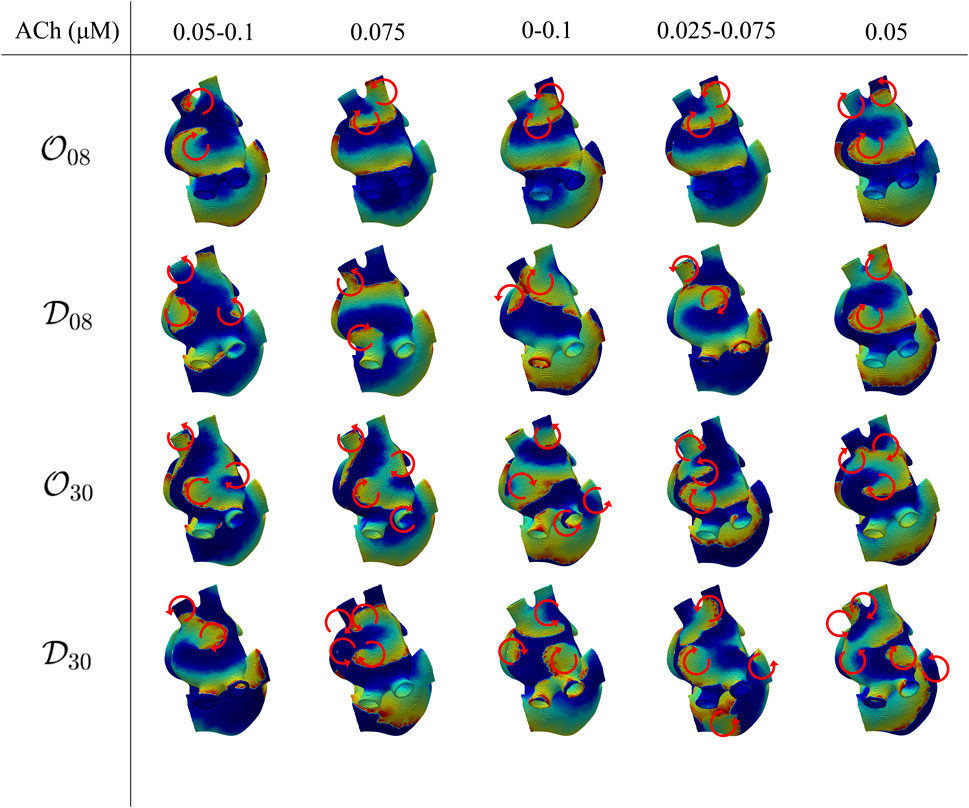
FIGURE 7. Voltage maps representative of the induced fibrillatory pattern after application of S1-S2 stimulation. Each circular arrow represents the location of a rotor with its direction of rotation. The ACh values indicate a constant ACh release when only a number is reported, corresponding to
Similarly to the observations in the 2D tissues, for the four spatial ACh release models, i.e.,
Table 2 shows
When the 3D biatrial models were stimulated with a train of ectopic beats, a macro-reentry through the coronary sinus was generated in all cases. Figure 8, top row, illustrates voltage maps at different time instants in the case of a single macro-reentry (top-row) and in the case of multiple reentries generated by S1-S2 stimulation (bottom row) in the
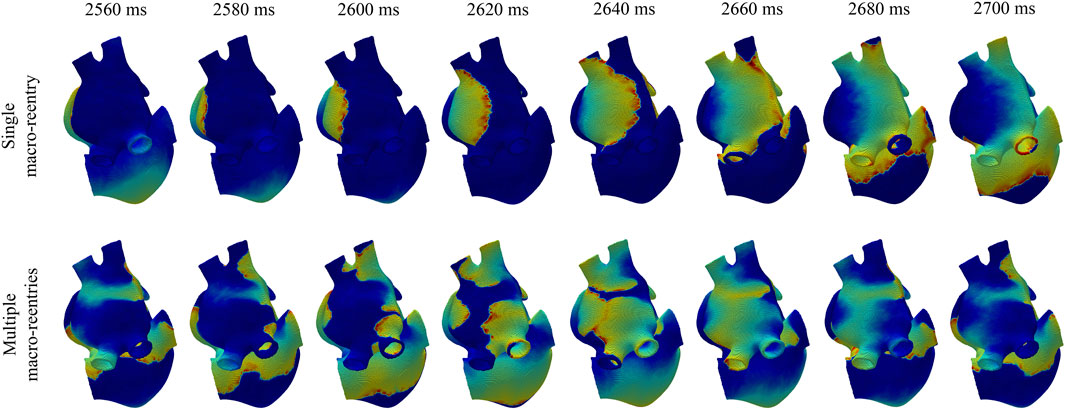
FIGURE 8. Voltage maps in a simulation where, after ectopic beat stimulation, a single macro-reentry was initiated (top panel) and in a simulation where, after S1-S2 stimulation, multiple macro-reentries were initiated (bottom panel).
For both 8% and 30% ACh release nodes, ΔFf was higher in the diffuse than in the octopus configurations. Again, the different spatial distributions of ACh release, i.e.,
When testing different ACh modulation frequencies (0.125/0.20/0.33 Hz), we found that, in the 2D cases, the rotor’s frequency consistently mirrored the induced ACh(t) frequency pattern. In the 3D cases, all tested ACh release frequencies led to reentry with the same frequency but opposite phase compared to the induced ACh(t) pattern. For both the single rotor case and the macro-reentry case, no substantial differences were observed in
It can be noted that, when comparing simulated and clinical results, the mean f-wave frequency,
We used computational modeling and simulation to assess the role of the ANS in the modulation of f-wave frequency. We built 2D tissue and 3D biatrial models in which we included different spatial distributions of ACh release. By additional modeling of the temporal evolution of cholinergic stimulation, we computed its impact on the atrial fibrillatory rate. We compared our simulation results with those from the analysis of patients’ ECGs, which showed that, in as much as 50% of the patients, the f-wave frequency modulation was strongly reduced after injection of the anticholinergic agent atropine. After confirmation of the agreement between simulation and clinical outcomes, we used our in silico approach to dissect the influence of spatiotemporal ACh release characteristics on f-wave frequency modulation independently of other factors.
For a comprehensive characterization of cholinergic effects on f-wave frequency modulation, we conducted simulations with different spatial configurations of ACh release, using a sinusoidal waveform with varying mean concentrations and peak-to-peak variation ranges of ACh. We also used two stimulation protocols: the S1-S2 protocol and a train of ectopic beats near the pulmonary veins in the 3D models.
The f-wave frequency Ff(t) was determined by calculating the average of the instantaneous frequencies derived from several points evenly distributed across the tissue. These instantaneous frequencies were calculated as the reciprocals of the corresponding CLs. We also explored an alternate approach, wherein we initially calculated the mean CLs across the various points and subsequently computed Ff(t) using the inverse of the mean CL along time. Nonetheless, since the discrepancies in CL values among the different points were negligible, the differences between the two approaches turned out to be negligible.
We found that the f-wave frequency responded to changes in ACh levels in both 2D tissue and 3D biatrial models. The average f-wave frequency was mainly influenced by the fibrillatory pattern, which was determined by the number and location of stable reentrant circuits. The percentage of ACh release nodes and the mean ACh concentration additionally contributed to the mean f-wave frequency. The peak-to-peak variation in the f-wave frequency was primarily influenced by the percentage of ACh release nodes and the temporal changes in ACh concentration. The distribution of ACh release sites, whether dispersed or in an octopus-like arrangement, had a minor impact.
Application of an S1-S2 protocol generated a single stable rotor in all 2D simulations while, in the 3D simulations, multiple stable reentries (2–5) were generated. In almost all the simulated cases, the generated rotors stabilized in the LA. Only in three cases, we observed stable rotors also in the RA. Rotor stabilization in the LA was expected, considering that we delivered the S1 and S2 stimuli in the region between the 4 pulmonary veins in the LA. The delivery of the stimuli in other atrial regions would be expected to lead to different fibrillatory patterns, with rotors stabilizing in other regions. Since we were interested in analyzing the ACh effects on the modulation of the atrial dominant frequency, our goal was to induce similar atrial activations in the different simulated cases to establish a comparison while reducing the influence of other factors. Nevertheless, we would not expect qualitatively different results when stimulating other atrial regions. When a train of ectopic beats was used to stimulate the atria, we observed a single macro-reentry in all cases. During both S1-S2 and ectopic stimulation, we did not include stimuli coming from the SAN to avoid more complex electrical activation patterns due to wavefront collision. The more stable patterns of atrial activation in our study allowed improved characterization of ACh effects over a period of 8 s.
The f-wave frequency trend Ff(t) was computed and characterized with two variables: its temporal mean
In this paper, we conducted frequency analysis using temporal traces of transmembrane potential instead of external electrical fields. To demonstrate that the same conclusions could be derived from ECGs, we carried out an additional analysis for selected cases in which we computed extracellular potentials and we conducted a frequency analysis on the resulting signals. Specifically, we considered four cases:
Finally, in this study, we assumed that the activation of the ACh-activated potassium current occurred instantaneously following the release of ACh. However, it is important to note that there is a time delay, which is inversely proportional to both ACh concentration and temperature. In the literature (Inomata et al., 1989), latency times have been reported, ranging from 692 ± 50 ms for 0.01 μM ACh to 98 ± 11 ms for 1 μM ACh at 26°C. Additionally, variations in latency times from 267 ± 20 ms at 18°C to 44 ± 6 ms at 37°C for 1 μM ACh have been observed as the temperature changes. In future studies, we may consider incorporating this dose-dependent time delay directly into the model to assess its impact on the results as ACh concentration varies. For the present analysis, we recalculated the Spearman coefficients between ACh(t) and Ff(t) while introducing a fixed time delay of 420 ms for cases with a mean ACh concentration of 0.05 μM and 350 ms for cases with a mean ACh concentration of 0.075 μM. We did not observe any significant differences in the Spearman correlation coefficient when considering or omitting the time delay, as the delay was relatively small compared to the respiratory period. The maximum variation in the correlation coefficient was within ±0.10.
The percentage of ACh release nodes in the atria emphasized the dependence of
A third factor influencing
The spatial distribution of ACh release nodes (diffuse or octopus) did not seem to be directly correlated to
Comparing simulation and clinical results in terms of
ΔFf was found to be directly dependent on the percentage of ACh release nodes and on ΔACh. The spatial configuration of ACh release sites showed mild impact only for the highest (30%) percentage of ACh release nodes.
Comparing simulated and clinical values of ΔFf, better agreement was overall observed when considering 30% of ACh release nodes, either in a diffuse or octopus configuration. Higher values of ΔACh and larger percentages of ACh release sites along the atria could lead to simulated ΔFf being closer to the values measured from clinical data.
In the simulations, a respiratory frequency of 0.125 Hz was assumed to match clinical results during controlled breathing. Nevertheless, additional simulations were conducted to investigate potential frequency-dependent behaviors and differences in modulation patterns. Additional frequencies of 0.20 and 0.33 Hz were specifically tested in 2D tissues to assess the impact of ACh release frequency on a single rotor in a scenario where variations in APD have a dominant impact on the WL, and in 3D biatrial models stimulated with a train of ectopic beats to evaluate the effects of ACh release frequency on a macro-reentry in a scenario where variations in CV have a dominant impact on the WL. The S1-S2 protocol was deliberately excluded due to complications arising from diverse fibrillatory patterns observed in such scenarios. From the results, it can be concluded that no qualitative or quantitative differences in Ff and ΔFf were observed in the simulated time span when altering the frequency of ACh release frequency.
The inclusion of clinical data in our study was useful in determining a comprehensive range for the mean f-wave frequency and the magnitude of respiratory modulation. While not all our findings lie within this established range, there is some degree of overlap. The observed discrepancies could be attributed to various factors and can arise from limitations in either the clinical data or the simulations.
First, it is important to highlight the limited number of patients in the clinical dataset, with a large degree of variability over patients in terms of the mean and peak-to-peak variation of f-wave frequency. Furthermore, while in the simulations the modulation of the fibrillatory rate is determined only by ACh, in clinical signals variations in the respiratory frequency band can be influenced by factors other than the ANS. Mechanical stretch, mechano-electrical feedback or the endocrine system have been reported as possible modulators of the fibrillatory frequency (Gordan et al., 2015). These other mechanisms may interfere in a possibly nonlinear manner with the effects of ACh. Additionally, in the simulation setting, the use of a single anatomical model and a single model describing cellular electrophysiology may not have fully captured the inter-patient variability observed in the clinical scenario.
Considering that the clinical data we analyzed in our study was obtained from AF patients, we also compared our macro-reentry results with atrial flutter data from existing literature. A study conducted by Waxman et al. Waxman et al. (1991) reported atrial flutter CLs ranging from 185 to 350 ms (corresponding to frequencies of 5.40 to 2.86 Hz), with an average of 247.5 ms (corresponding to 4.04 Hz). It was also observed that the flutter CLs were consistently prolonged during inspiration and shortened during expiration, with an average respiratory excursion of 6.9 ms (corresponding to 0.11 Hz). In another study by Ravelli et al. (2008), the atrial flutter CL was reported to exhibit spontaneous beat-to-beat variability at the frequency of respiration. Consistent with the results described in Waxman et al. (1991), the respiratory modulation of atrial flutter CL displayed longer values during inspiration (223.2 ± 28.6 ms = 4.47 ± 0.49 Hz) and shorter values during expiration (221.1 ± 28.2 ms = 4.52 Hz ± 0.66 Hz). The frequency values reported in the atrial flutter studies align more closely with the values we observed in our macro-reentry simulations than with the AF values reported in Abdollahpur et al. (2021).
It is important to note that in the study by Ravelli et al., the observed oscillations in atrial flutter CL persisted even after pharmacologic autonomic blockade. As anticipated at the beginning of this section, this suggests the existence of factors independent of ANS that may contribute to respiratory-related atrial frequency oscillations. This could potentially explain the inter-patient variability observed in the clinical cases reported by Abdollahpur et al. Abdollahpur et al. (2021), where atropine reduced atrial frequency variability in just half of the patients. One of those additional factors could be the influence of mechanical stretch and mechano-electrical feedback. Different studies have shown that atrial tissue stretch affects atrial conduction and refractoriness in humans (Ravelli et al., 2008; Coronel et al., 2010), involving the activation of stretch-activated ion channels Sachs (1991); Hu and Sachs (1997). The mechanical regulation of heart rate has been proposed as a factor influencing RSA in heart transplant recipients (Bernardi et al., 1989; Bernardi et al., 1990), individuals with conditions associated with reduced vagal tone (El-Omar et al., 2001) and healthy individuals during exercise (Bernardi et al., 1990; Casadei et al., 1996). However, in normal physiological conditions, mechanical mechanisms are secondary to the effects of the ANS in modulating SAN pacemaker activity and, consequently, determining RSA (Kohl et al., 1999; Cooper and Kohl, 2005; Masè et al., 2009).
Extensive analysis has been conducted to understand the mechanical modulation, including cardiorespiratory modulation, of atrial activity, specifically in the case of atrial flutter (Waxman et al., 1991; Masé et al., 2008; Ravelli et al., 2008; Masè et al., 2009). Interventions like passive upright tilting, the strain phase of the Valsalva maneuver and expiration, all of which reduce cardiac size, have been observed to independently increased the rate of atrial flutter regardless of autonomic tone (Waxman et al., 1991). Finally, modeling studies have provided insights into the mechanoelectrical currents at the ionic level and their impact on AF (Kuijpers et al., 2007; Kuijpers et al., 2011). The magnitude of the stretch-activated current Isac has been associated with the local stretch ratio and the heterogeneity in its activation has been shown to contribute to refractoriness dispersion and variation in conduction properties that increase the susceptibility to AF.
Some limitations of this study should be acknowledged to provide direction for further work:
The clinical results are based on the method proposed in Abdollahpur et al. (2021), where all variations in the respiratory frequency interval are considered in the estimation of the respiratory modulation. Hence, variations in such frequency band that are unrelated to respiration may influence the result. In a more recent study, a subspace projection approach that only considers variations linearly related to respiration was proposed to quantify respiratory f-wave frequency modulation (Abdollahpur et al., 2022). However, the subspace projection approach could not be applied to the present dataset, since it requires a respiratory signal. In Abdollahpur et al. (2022), a respiratory signal was derived from the ECG, but the presence of pacemaker spikes in the present dataset makes that approach unfeasible.
Due to a lack of comprehensive understanding of the spatial distribution of parasympathetic innervation in the atria, we followed two approaches to represent ACh release nodes. One of such approaches is based on the octopus configuration reported in previous anatomical studies (Armour et al., 1997), which includes the spatial location of GPs and nerves departing from them. In the GPs, despite the predominance of parasympathetic fibers, sympathetic fibers can be found too (Tan et al., 2006). Here, we only considered cholinergic stimulation but future work could include additional modeling of the adrenergic stimulation.
We used the Courtemanche model to describe human atrial electrophysiology. Further investigations using other computational AP models with longer steady-state APD values could be conducted to assess the impact on f-wave frequency characterizations. Also, additional values of the longitudinal conductivity and the transverse-to-longitudinal conductivity ratio in the atrial tissue could be tested to identify the values leading to closer agreement between simulated and clinical f-wave frequency variables.
The computational models presented here were representative of psAF patients. Structural changes in the atria due to AF may present as various alterations such as an enlarged atrial chamber, hypertrophy of cardiomyocytes, increased mismatch between epicardial and endocardial myofibers’ orientations, changes in atrial wall thickness and, notably, an increased amount of fibrotic or connective tissue. Wyse et al. (2014); Schotten et al. (2011); Heijman et al. (2016). Fibrosis remodeling is a multiscale process associated with gap junction remodeling (Kostin et al., 2002; Brett et al., 2009), fibroblast proliferation (Rohr, 2009; Yue et al., 2011) and excess collagen deposition (Burstein and Nattel, 2008; Yue et al., 2011). We represented psAF-related structural remodeling by a combination of gap junction remodeling, modeled through tissue conductance reduction in fibrotic regions, and fibroblast proliferation. The latter was modeled by assigning some of the mesh nodes with fibroblast rather than myocyte properties and by using a fibroblast ionic model (MacCannell et al., 2007), as in previous studies (McDowell et al., 2013). Importantly, fibroblasts can exert electrophysiological influences on adjacent myocytes (Pedrotty et al., 2009) which can result in a reduction in APD, slower conduction and decreased excitability (Trayanova, 2014). Future studies including different degrees of fibrosis and other human atrial cell models, as well as different sites for external stimulation, could further investigate the impact of all these factors on
We assessed the impact of the spatiotemporal release pattern of ACh on f-wave frequency modulation. In agreement with clinical data, we found that the f-wave frequency varied in response to the temporal variation of ACh in both 2D tissue and 3D biatrial models. The mean f-wave frequency was found to be primarily dependent on the fibrillatory pattern, being largely determined by the number and spatial location of stable reentrant circuits. Other factors contributing to the mean f-wave frequency were the percentage of ACh release nodes throughout the atria and the mean ACh concentration. The peak-to-peak variation in the f-wave frequency was found to be dependent on the percentage of ACh release nodes and the variation over time in the ACh concentration. The spatial distribution of ACh release sites, either diffuse or following an octopus configuration, showed only mild impact.
The raw data supporting the conclusion of this article will be made available by the authors, without undue reservation.
The studies involving human participants were reviewed and approved by the Regional Ethics Committee in Lund, Sweden. Written informed consent to participate in this study was provided by the participants.
CC, CS, MA, FS, PL, and EP designed the study, CC, CS, PL, and EP analyzed the results, CC drafted the manuscript. CC performed the electrophysiological simulations, JR contributed with technical details. EP, PL, CS, FS, and JR supervised and formalized the project and were responsible for overseeing the research and providing critical insight and recommendations regarding the focus, structure and content of the paper. CC developed the post-processing software and performed the required computations. All authors contributed to the article and approved the submitted version.
This work was supported by projects PID2019-105674RB-I00, PID2019-104881RB-I00, TED2021-130459B-I00, PID2022-140556OB-I00, and PID2022-139143OA-I00 (MCIN/AEI/10.13039/501100011033/FEDER, UE), ERC G.A. 638284 (ERC), Swedish Research Council (grant VR2019-04272), Crafoord Foundation (grant 20200605), Marie Skłodowska-Curie ITN grant 766082 MY-ATRIA (European Commission) and by European Social Fund (EU) and Aragón Government through projects LMP94_21, LMP141_21, and BSICoS group T39_23R. Computations were performed at the computing facilities of DCMC at Politecnico di Milano.
The authors declare that the research was conducted in the absence of any commercial or financial relationships that could be construed as a potential conflict of interest.
All claims expressed in this article are solely those of the authors and do not necessarily represent those of their affiliated organizations, or those of the publisher, the editors and the reviewers. Any product that may be evaluated in this article, or claim that may be made by its manufacturer, is not guaranteed or endorsed by the publisher.
The Supplementary Material for this article can be found online at: https://www.frontiersin.org/articles/10.3389/fphys.2023.1189464/full#supplementary-material
Abdollahpur M., Engström G., Platonov P. G., Sandberg F. (2022). A subspace projection approach to quantify respiratory variations in the f-wave frequency trend. Front. Physiology 13, 976925. doi:10.3389/fphys.2022.976925
Abdollahpur M., Holmqvist F., Platonov P. G., Sandberg F. (2021). Respiratory induced modulation in f-wave characteristics during atrial fibrillation. Front. Physiology 12, 653492. doi:10.3389/fphys.2021.653492
Armour J. A., Murphy D. A., Yuan B. X., Macdonald S., Hopkins D. A. (1997). Gross and microscopic anatomy of the human intrinsic cardiac nervous system. Anatomical Rec. 247, 289–298. doi:10.1002/(SICI)1097-0185(199702)247:2⟨289::AID-AR15⟩3.0.CO;2-L
Bailón R., Sörnmo L., Laguna P. (2006). A robust method for ECG-based estimation of the respiratory frequency during stress testing. IEEE Trans. bio-medical Eng. 53, 1273–1285. doi:10.1109/TBME.2006.871888
Bayer J. D., Boukens B. J., Krul S. P. J., Roney C. H., Driessen A. H. G., Berger W. R., et al. (2019). Acetylcholine delays atrial activation to facilitate atrial fibrillation. Front. Physiology 10, 1105. doi:10.3389/fphys.2019.01105
Bernardi L., Keller F., Sanders M., Reddy P. S., Griffith B., Meno F., et al. (1989). Respiratory sinus arrhythmia in the denervated human heart. J. Appl. Physiology (1985) 67, 1447–1455. doi:10.1152/jappl.1989.67.4.1447
Bernardi L., Salvucci F., Suardi R., Soldá P. L., Calciati A., Perlini S., et al. (1990). Evidence for an intrinsic mechanism regulating heart rate variability in the transplanted and the intact heart during submaximal dynamic exercise? Cardiovasc. Res. 24, 969–981. doi:10.1093/cvr/24.12.969
Bollmann A., Sonne K., Esperer H. D., Toepffer I., Langberg J. J., Klein H. U. (1999). Non-invasive assessment of fibrillatory activity in patients with paroxysmal and persistent atrial fibrillation using the Holter ECG. Cardiovasc. Res. 44, 60–66. doi:10.1016/s0008-6363(99)00156-x
Brett B., Philippe C., Georghia M., Nishida K., Louis V., Yeh Y. H., et al. (2009). Changes in connexin expression and the atrial fibrillation substrate in congestive heart failure. Circulation Res. 105, 1213–1222. doi:10.1161/CIRCRESAHA.108.183400
Burstein B., Comtois P., Michael G., Nishida K., Villeneuve L., Yeh Y.-H., et al. (2009). Changes in connexin expression and the atrial fibrillation substrate in congestive heart failure. Circulation Res. 105, 1213–1222. doi:10.1161/CIRCRESAHA.108.183400
Burstein B., Nattel S. (2008). Atrial fibrosis: mechanisms and clinical relevance in atrial fibrillation. J. Am. Coll. Cardiol. 51, 802–809. doi:10.1016/j.jacc.2007.09.064
Casadei B., Moon J., Johnston J., Caiazza A., Sleight P. (1996). Is respiratory sinus arrhythmia a good index of cardiac vagal tone in exercise? J. Appl. Physiology (1985) 81, 556–564. doi:10.1152/jappl.1996.81.2.556
Celotto C., Sánchez C., Laguna P., Pueyo E. (2021). Location of parasympathetic innervation regions from electrograms to guide atrial fibrillation ablation therapy: an in silico modeling study. Front. Physiology 12, 1020. doi:10.3389/fphys.2021.674197
Celotto C., Sánchez C., Mountris K. A., Laguna P., Pueyo E. (2023). Steady-state and transient effects of SK channel block and adrenergic stimulation to counteract acetylcholine-induced arrhythmogenic effects in the human atria: a computational study. Comput. Biol. Med. 157, 106719. doi:10.1016/j.compbiomed.2023.106719
Cha T.-J., Ehrlich J. R., Zhang L., Chartier D., Leung T. K., Nattel S. (2005). Atrial tachycardia remodeling of pulmonary vein cardiomyocytes: comparison with left atrium and potential relation to arrhythmogenesis. Circulation 111, 728–735. doi:10.1161/01.CIR.0000155240.05251.D0
Chang H.-Y., Lo L.-W., Chou Y.-H., Lin W.-L., Lin Y.-J., Yamada S., et al. (2016). Effect of vagotomy on the activity of cardiac autonomic ganglia: insight from left atrial high density frequency mapping. Int. J. Cardiol. 220, 435–439. doi:10.1016/j.ijcard.2016.06.183
Choudhary M. B., Holmqvist F., Carlson J., Nilsson H.-J., Roijer A., Platonov P. G. (2013). Low atrial fibrillatory rate is associated with spontaneous conversion of recent-onset atrial fibrillation. Europace 15, 1445–1452. doi:10.1093/europace/eut057
Cooper P. J., Kohl P. (2005). Species- and preparation-dependence of stretch effects on sino-atrial node pacemaking. Ann. N. Y. Acad. Sci. 1047, 324–335. doi:10.1196/annals.1341.029
Coronel R., Langerveld J., Boersma L. V., Wever E. F., Bon L., Van Dessel P. F., et al. (2010). Left atrial pressure reduction for mitral stenosis reverses left atrial direction-dependent conduction abnormalities. Cardiovasc. Res. 85, 711–718. doi:10.1093/cvr/cvp374
Courtemanche M., Ramirez R. J., Nattel S. (1998). Ionic mechanisms underlying human atrial action potential properties: insights from a mathematical model. Am. J. Physiology-Heart Circulatory Physiology 275, H301–H321. doi:10.1152/ajpheart.1998.275.1.H301
Courtemanche M., Ramirez R. J., Nattel S. (1999). Ionic targets for drug therapy and atrial fibrillation-induced electrical remodeling: insights from a mathematical model. Cardiovasc. Res. 42, 477–489. doi:10.1016/S0008-6363(99)00034-6
Dobrev D., Graf E., Wettwer E., Himmel H. M., Hála O., Doerfel C., et al. (2001). Molecular basis of downregulation of G-protein-coupled inward rectifying K(+) current (I(K,ACh) in chronic human atrial fibrillation: decrease in GIRK4 mRNA correlates with reduced I(K,ACh) and muscarinic receptor-mediated shortening of action potentials. Circulation 104, 2551–2557. doi:10.1161/hc4601.099466
Eckberg D. L. (1983). Human sinus arrhythmia as an index of vagal cardiac outflow. J. Appl. Physiology Respir. Environ. Exerc. Physiology 54, 961–966. doi:10.1152/jappl.1983.54.4.961
Eckberg D. L. (2000). Physiological basis for human autonomic rhythms. Ann. Med. 32, 341–349. doi:10.3109/07853890008995937
Eckberg D. L. (2003). The human respiratory gate. J. Physiology 548, 339–352. doi:10.1113/jphysiol.2002.037192
El-Omar M., Kardos A., Casadei B. (2001). Mechanisms of respiratory sinus arrhythmia in patients with mild heart failure. Am. J. Physiology. Heart Circulatory Physiology 280, H125–H131. doi:10.1152/ajpheart.2001.280.1.H125
Fedele L., Brand T. (2020). The intrinsic cardiac nervous system and its role in cardiac pacemaking and conduction. J. Cardiovasc. Dev. Dis. 7, 54. doi:10.3390/jcdd7040054
Feng J., Yue L., Wang Z., Nattel S. (1998). Ionic mechanisms of regional action potential heterogeneity in the canine right atrium. Circulation Res. 83, 541–551. doi:10.1161/01.res.83.5.541
Ferrer A., Sebastián R., Sánchez-Quintana D., Rodríguez J. F., Godoy E. J., Martínez L., et al. (2015). Detailed anatomical and electrophysiological models of human atria and torso for the simulation of atrial activation. PloS One 10, e0141573. doi:10.1371/journal.pone.0141573
Gordan R., Gwathmey J. K., Xie L.-H. (2015). Autonomic and endocrine control of cardiovascular function. World J. Cardiol. 7, 204–214. doi:10.4330/wjc.v7.i4.204
Heidenreich E. A., Ferrero J. M., Doblaré M., Rodríguez J. F. (2010). Adaptive macro finite elements for the numerical solution of monodomain equations in cardiac electrophysiology. Ann. Biomed. Eng. 38, 2331–2345. doi:10.1007/s10439-010-9997-2
Heijman J., Algalarrondo V., Voigt N., Melka J., Wehrens X. H., Dobrev D., et al. (2016). The value of basic research insights into atrial fibrillation mechanisms as a guide to therapeutic innovation: a critical analysis. Cardiovasc. Res. 109, 467–479. doi:10.1093/cvr/cvv275
Henriksson M., Petrenas A., Marozas V., Sandberg F., Sornmo L. (2018). Model-based assessment of f-wave signal quality in patients with atrial fibrillation. IEEE Trans. Biomed. Eng. 65, 2600–2611. doi:10.1109/TBME.2018.2810508
Hirsch J. A., Bishop B. (1981). Respiratory sinus arrhythmia in humans: how breathing pattern modulates heart rate. Am. J. Physiology 241, H620–H629. doi:10.1152/ajpheart.1981.241.4.H620
Holmqvist F., Stridh M., Waktare J. E. P., Brandt J., Sörnmo L., Roijer A., et al. (2005). Rapid fluctuations in atrial fibrillatory electrophysiology detected during controlled respiration. Am. J. Physiology-Heart Circulatory Physiology 289, H754–H760. doi:10.1152/ajpheart.00075.2005
Hu H., Sachs F. (1997). Stretch-activated ion channels in the heart. J. Mol. Cell. Cardiol. 29, 1511–1523. doi:10.1006/jmcc.1997.0392
Hwang M., Lee H.-S., Pak H.-N., Shim E. B. (2016). Inducibility of human atrial fibrillation in an in silico model reflecting local acetylcholine distribution and concentration. Korean J. Physiology Pharmacol. 20, 111–117. doi:10.4196/kjpp.2016.20.1.111
Ingemansson M. P., Holm M., Olsson S. B. (1998). Autonomic modulation of the atrial cycle length by the head up tilt test: non-invasive evaluation in patients with chronic atrial fibrillation. Heart (British Card. Soc. 80, 71–76. doi:10.1136/hrt.80.1.71
Inomata N., Ishihara T., Akaike N. (1989). Activation kinetics of the acetylcholine-gated potassium current in isolated atrial cells. Am. J. Physiology 257, C646–C650. doi:10.1152/ajpcell.1989.257.4.C646
Katona P. G., Jih F. (1975). Respiratory sinus arrhythmia: noninvasive measure of parasympathetic cardiac control. J. Appl. Physiology 39, 801–805. doi:10.1152/jappl.1975.39.5.801
Kneller J., Zou R., Vigmond E. J., Wang Z., Leon L. J., Nattel S. (2002). Cholinergic atrial fibrillation in a computer model of a two-dimensional sheet of canine atrial cells with realistic ionic properties. Circulation Res. 90, E73–E87. doi:10.1161/01.RES.0000019783.88094.ba
Kohl P., Hunter P., Noble D. (1999). Stretch-induced changes in heart rate and rhythm: clinical observations, experiments and mathematical models. Prog. Biophysics Mol. Biol. 71, 91–138. doi:10.1016/s0079-6107(98)00038-8
Kostin S., Klein G., Szalay Z., Hein S., Bauer E. P., Schaper J. (2002). Structural correlate of atrial fibrillation in human patients. Cardiovasc. Res. 54, 361–379. doi:10.1016/S0008-6363(02)00273-0
Krueger M. W., Rhode K. S., O’Neill M. D., Rinaldi C. A., Gill J., Razavi R., et al. (2014). Patient-specific modeling of atrial fibrosis increases the accuracy of sinus rhythm simulations and may explain maintenance of atrial fibrillation. J. Electrocardiol. 47, 324–328. doi:10.1016/j.jelectrocard.2013.11.003
Kuijpers N. H. L., Ten Eikelder H. M. M., Bovendeerd P. H. M., Verheule S., Arts T., Hilbers P. A. J. (2007). Mechanoelectric feedback leads to conduction slowing and block in acutely dilated atria: a modeling study of cardiac electromechanics. Am. J. Physiology-Heart Circulatory Physiology 292, H2832–H2853. doi:10.1152/ajpheart.00923.2006
Kuijpers N. H., Potse M., Van Dam P. M., Ten Eikelder H. M., Verheule S., Prinzen F. W., et al. (2011). Mechanoelectrical coupling enhances initiation and affects perpetuation of atrial fibrillation during acute atrial dilation. Heart Rhythm. 8, 429–436. doi:10.1016/j.hrthm.2010.11.020
Kunze D. L. (1972). Reflex discharge patterns of cardiac vagal efferent fibres. J. Physiology 222, 1–15. doi:10.1113/jphysiol.1972.sp009784
Lankveld T. A. R., Zeemering S., Crijns H. J. G. M., Schotten U. (2014). The ECG as a tool to determine atrial fibrillation complexity. Heart (British Card. Soc. 100, 1077–1084. doi:10.1136/heartjnl-2013-305149
Li D., Fareh S., Leung T. K., Nattel S. (1999). Promotion of atrial fibrillation by heart failure in dogs: atrial remodeling of a different sort. Circulation 100, 87–95. doi:10.1161/01.cir.100.1.87
Li D., Zhang L., Kneller J., Nattel S. (2001). Potential ionic mechanism for repolarization differences between canine right and left atrium. Circulation Res. 88, 1168–1175. doi:10.1161/hh1101.091266
Ma J., Chen Q., Ma S. (2021). Left atrial fibrosis in atrial fibrillation: mechanisms, clinical evaluation and management. J. Cell. Mol. Med. 25, 2764–2775. doi:10.1111/jcmm.16350
MacCannell A. K., Bazzazi H., Chilton L., Shibukawa Y., Clark R. B., Giles W. R. (2007). A mathematical model of electrotonic interactions between ventricular myocytes and fibroblasts. Biophysical J. 92, 4121–4132. doi:10.1529/biophysj.106.101410
Masè M., Disertori M., Ravelli F. (2009). Cardiorespiratory interactions in patients with atrial flutter. J. Appl. Physiology 1985 106, 29–39. doi:10.1152/japplphysiol.91191.2008
Masé M., Glass L., Ravelli F. (2008). A model for mechano-electrical feedback effects on atrial flutter interval variability. Bull. Math. Biol. 70, 1326–1347. doi:10.1007/s11538-008-9301-x
McDowell K. S., Vadakkumpadan F., Blake R., Blauer J., Plank G., Macleod R. S., et al. (2013). Mechanistic inquiry into the role of tissue remodeling in fibrotic lesions in human atrial fibrillation. Biophysical J. 104, 2764–2773. doi:10.1016/j.bpj.2013.05.025
Meo M., Zarzoso V., Meste O., Latcu D. G., Saoudi N. (2013). Spatial variability of the 12-lead surface ECG as a tool for noninvasive prediction of catheter ablation outcome in persistent atrial fibrillation. IEEE Trans. bio-medical Eng. 60, 20–27. doi:10.1109/TBME.2012.2220639
Östenson S., Corino V. D. A., Carlsson J., Platonov P. G. (2017). Autonomic influence on atrial fibrillatory process: head-up and head-down tilting. Ann. Noninvasive Electrocardiol. 22, e12405. doi:10.1111/anec.12405
Park J., Lee C., Leshem E., Blau I., Kim S., Lee J. M., et al. (2019). Early differentiation of long-standing persistent atrial fibrillation using the characteristics of fibrillatory waves in surface ECG multi-leads. Sci. Rep. 9, 2746. doi:10.1038/s41598-019-38928-6
Pauza D. H., Skripka V., Pauziene N., Stropus R. (2000). Morphology, distribution, and variability of the epicardiac neural ganglionated subplexuses in the human heart. Anatomical Rec. 259, 353–382. doi:10.1002/1097-0185(20000801)259:4⟨353::AID-AR10⟩3.0.CO;2-R
Pedrotty D. M., Klinger R. Y., Kirkton R. D., Bursac N. (2009). Cardiac fibroblast paracrine factors alter impulse conduction and ion channel expression of neonatal rat cardiomyocytes. Cardiovasc. Res. 83, 688–697. doi:10.1093/cvr/cvp164
Petrutiu S., Ng J., Nijm G. M., Al-Angari H., Swiryn S., Sahakian A. V. (2006). Atrial fibrillation and waveform characterization. A time domain perspective in the surface ECG. IEEE Eng. Med. Biol. Mag. 25, 24–30. doi:10.1109/emb-m.2006.250505
Piepoli M., Sleight P., Leuzzi S., Valle F., Spadacini G., Passino C., et al. (1997). Origin of respiratory sinus arrhythmia in conscious humans. An important role for arterial carotid baroreceptors. Circulation 95, 1813–1821. doi:10.1161/01.cir.95.7.1813
Platonov P. G., Corino V. D. A., Seifert M., Holmqvist F., Sörnmo L. (2014). Atrial fibrillatory rate in the clinical context: natural course and prediction of intervention outcome. Europace 16, iv110–iv119. doi:10.1093/europace/euu249
Platonov P. G., Mitrofanova L. B., Orshanskaya V., Ho S. Y. (2011). Structural abnormalities in atrial walls are associated with presence and persistency of atrial fibrillation but not with age. J. Am. Coll. Cardiol. 58, 2225–2232. doi:10.1016/j.jacc.2011.05.061
Ravelli F., Masè M., Disertori M. (2008). Mechanical modulation of atrial flutter cycle length. Prog. Biophysics Mol. Biol. 97, 417–434. doi:10.1016/j.pbiomolbio.2008.02.018
Rohr S., Kucera J. P., Kleber A. G. (1998). Slow conduction in cardiac tissue, I: effects of a reduction of excitability versus a reduction of electrical coupling on microconduction. Circulation Res. 83, 781–794. doi:10.1161/01.RES.83.8.781
Rohr S. (2009). Myofibroblasts in diseased hearts: new players in cardiac arrhythmias? Heart Rhythm. 6, 848–856. doi:10.1016/j.hrthm.2009.02.038
Sachs F. (1991). Mechanical transduction by membrane ion channels: a mini review. Mol. Cell. Biochem. 104, 57–60. doi:10.1007/BF00229804
Schotten U., Verheule S., Kirchhof P., Goette A. (2011). Pathophysiological mechanisms of atrial fibrillation: a translational appraisal. Physiol. Rev. 91, 265–325. doi:10.1152/physrev.00031.2009
Seemann G., Höper C., Sachse F. B., Dössel O., Holden A. V., Zhang H. (2006). Heterogeneous three-dimensional anatomical and electrophysiological model of human atria. Philosophical Trans. Ser. A, Math. Phys. Eng. Sci. 364, 1465–1481. doi:10.1098/rsta.2006.1781
Shivkumar K., Ajijola O. A., Anand I., Armour J. A., Chen P.-S., Esler M., et al. (2016). Clinical neurocardiology defining the value of neuroscience-based cardiovascular therapeutics. J. Physiology 594, 3911–3954. doi:10.1113/JP271870
Sörnmo L., Laguna P., Alcaraz R., Rieta J. (2018). “Characterization of f waves,” in Atrial fibrillation from an engineering perspective. Editor L. Sörnmo (Springer), 221–280. chap. 6. doi:10.1007/978-3-319-68515-1_6
Stridh M., Sörnmo L. (2001). Spatiotemporal QRST cancellation techniques for analysis of atrial fibrillation. IEEE Trans. bio-medical Eng. 48, 105–111. doi:10.1109/10.900266
Tan A. Y., Li H., Wachsmann-Hogiu S., Chen L. S., Chen P.-S., Fishbein M. C. (2006). Autonomic innervation and segmental muscular disconnections at the human pulmonary vein-atrial junction: implications for catheter ablation of atrial-pulmonary vein junction. J. Am. Coll. Cardiol. 48, 132–143. doi:10.1016/j.jacc.2006.02.054
Trayanova N. A. (2014). Mathematical approaches to understanding and imaging atrial fibrillation: significance for mechanisms and management. Circulation Res. 114, 1516–1531. doi:10.1161/CIRCRESAHA.114.302240
Wang Z., Fermini B., Nattel S. (1993). Sustained depolarization-induced outward current in human atrial myocytes. Evidence for a novel delayed rectifier K+ current similar to Kv1.5 cloned channel currents. Circulation Res. 73, 1061–1076. doi:10.1161/01.res.73.6.1061
Wang Z. G., Pelletier L. C., Talajic M., Nattel S. (1990). Effects of flecainide and quinidine on human atrial action potentials. Role of rate-dependence and comparison with Guinea pig, rabbit, and dog tissues. Circulation 82, 274–283. doi:10.1161/01.cir.82.1.274
Waxman M. B., Yao L., Cameron D. A., Kirsh J. A. (1991). Effects of posture, Valsalva maneuver and respiration on atrial flutter rate: an effect mediated through cardiac volume. J. Am. Coll. Cardiol. 17, 1545–1552. doi:10.1016/0735-1097(91)90645-P
Wesselink R., Neefs J., van den Berg N. W. E., Meulendijks E. R., Terpstra M. M., Kawasaki M., et al. (2022). Does left atrial epicardial conduction time reflect atrial fibrosis and the risk of atrial fibrillation recurrence after thoracoscopic ablation? post hoc analysis of the AFACT trial. BMJ open 12, e056829. doi:10.1136/bmjopen-2021-056829
Wyse D. G., Van Gelder I. C., Ellinor P. T., Go A. S., Kalman J. M., Narayan S. M., et al. (2014). Lone atrial fibrillation. J. Am. Coll. Cardiol. 63, 1715–1723. doi:10.1016/j.jacc.2014.01.023
Yasuma F., Hayano J.-I. (2004). Respiratory sinus arrhythmia: why does the heartbeat synchronize with respiratory rhythm? Chest 125, 683–690. doi:10.1378/chest.125.2.683
Yue L., Xie J., Nattel S. (2011). Molecular determinants of cardiac fibroblast electrical function and therapeutic implications for atrial fibrillation. Cardiovasc. Res. 89, 744–753. doi:10.1093/cvr/cvq329
Keywords: atrial fibrillation, f-waves, acetylcholine, computational simulation, cardiorespiratory modulation, autonomic nervous system
Citation: Celotto C, Sánchez C, Abdollahpur M, Sandberg F, Rodriguez Mstas JF, Laguna P and Pueyo E (2024) The frequency of atrial fibrillatory waves is modulated by the spatiotemporal pattern of acetylcholine release: a 3D computational study. Front. Physiol. 14:1189464. doi: 10.3389/fphys.2023.1189464
Received: 19 March 2023; Accepted: 10 October 2023;
Published: 03 January 2024.
Edited by:
Caroline Helen Roney, Queen Mary University of London, United KingdomReviewed by:
Michela Masè, University of Trento, ItalyCopyright © 2024 Celotto, Sánchez, Abdollahpur, Sandberg, Rodriguez Matas, Laguna and Pueyo. This is an open-access article distributed under the terms of the Creative Commons Attribution License (CC BY). The use, distribution or reproduction in other forums is permitted, provided the original author(s) and the copyright owner(s) are credited and that the original publication in this journal is cited, in accordance with accepted academic practice. No use, distribution or reproduction is permitted which does not comply with these terms.
*Correspondence: Chiara Celotto, Y2hpYXJhY2Vsb3R0b0B1bml6YXIuZXM=
Disclaimer: All claims expressed in this article are solely those of the authors and do not necessarily represent those of their affiliated organizations, or those of the publisher, the editors and the reviewers. Any product that may be evaluated in this article or claim that may be made by its manufacturer is not guaranteed or endorsed by the publisher.
Research integrity at Frontiers
Learn more about the work of our research integrity team to safeguard the quality of each article we publish.