 Xiaoying Zhuo1,2†
 Ji Lv3,4†Binjie Chen3†Jia Liu5Yujie Luo1Jie Liu1Xiaowei Xie1Jiao Lu1*Ningjun Zhao3,6*
- 1Ultrasound Medicine Department of the Affiliated Hospital of Xuzhou Medical University, Xuzhou, China
- 2Medical Imaging College of Xuzhou Medical University, Xuzhou, China
- 3Emergency Medicine Department of the Affiliated Hospital of Xuzhou Medical University, Xuzhou, China
- 4College of Computer Science and Technology, Jilin University, Changchun, China
- 5Pathology Department of the Affiliated Hospital of Xuzhou Medical University, Xuzhou, China
- 6Laboratory of Emergency Medicine, Second Clinical Medical College of Xuzhou Medical University, Xuzhou, China
Introduction: Identifying the HER2 status of breast cancer patients is important for treatment options. Previous studies have shown that ultrasound features are closely related to the subtype of breast cancer.
Methods: In this study, we used features of conventional ultrasound and ultrasound elastography to predict HER2 status.
Results and Discussion: The performance of model (AUROC) with features of conventional ultrasound and ultrasound elastography is higher than that of the model with features of conventional ultrasound (0.82 vs. 0.53). The SHAP method was used to explore the interpretability of the models. Compared with HER2– tumors, HER2+ tumors usually have greater elastic modulus parameters and microcalcifications. Therefore, we concluded that the features of conventional ultrasound combined with ultrasound elastography could improve the accuracy for predicting HER2 status.
1 Introduction
Breast cancer is one of the most common malignancies in women (Harbeck and Gnant, 2017). It is estimated that there were 2.26 million new cases of breast cancer worldwide in 2020 (Sung et al., 2021). Breast cancer is a highly heterogeneous tumor. Common molecular subtypes of breast cancer include luminal A (LA), luminal B (LB), human epidermal growth factor receptor 2 over-expression (HER2+) and triple negative breast cancer (TNBC), and different molecular subtypes show significant differences in biological behavior, clinical outcome and patient prognosis (Lüönd et al., 2021). Among these molecular subtypes, HER2+ patients make up about 15%–20% of all breast cancer cases and shows high malignancy, high rate of recurrence and metastasis, and poor prognosis (Guarneri et al., 2013). In recent years, trastuzumab (an antibody that targets HER2) (Hudis, 2007) has been used in clinical practice, and the prognosis of HER2+ patients has improved significantly (Kümler et al., 2014). It shows that accurate identification of the molecular subtype of breast cancer is essential for treatment. The 2018 American Society of Clinical Oncology/American Association of Pathologists Detection Guide and 2019 Chinese breast cancer HER-2 Detection Guide regulate the IHC staining requirements and the interpretation of IHC and ISH result (Wolff et al., 2018). In this consensus, HER-2 IHC 3+or HER-2 IHC 2+/ISH+ is defined as HER-2 positive, IHC 1+or IHC 2+/ISH–is defined as HER-2 low expression, and IHC 0 is defined as HER-2 negative.
So far, identification of HER2+ mainly relies on fluorescence in situ hybridization (FISH) and immunohistochemistry (IHC) (Baez-Navarro et al., 2023). However, the two methods are invasive procedures and may lead to seroma (Ebner et al., 2018) and infection (Bruening et al., 2010). Therefore, we need non-invasive, economical and accurate methods to predict HER2 status in breast cancer.
Ultrasound imaging technologies are non-invasive, convenient and affordable and have been widely used for breast cancer screening and diagnosis (Berg et al., 2015). It has been shown that ultrasonographic features are related to molecular subtypes of breast cancer (Wu et al., 2019; Gumowska et al., 2021). Many machine learning models for predicting molecular subtypes of breast cancer have been developed (Zhou et al., 2021; Ma et al., 2022). However, these models mainly relied on the characteristics of conventional ultrasound. In recent years, the development of ultrasound elastography (Barr, 2018) has provided new opportunities for breast cancer screening and diagnosis (Carlsen et al., 2015; Yao et al., 2023). As a new imaging technology, ultrasonic elastic imaging can evaluate the hardness of the lesions and thus identify the nature of the lesions, which is an important supplement to traditional ultrasonic imaging. At present, the ultrasonic elastography technology used for breast diagnosis mainly includes strain elastography and acoustic palpation elastography. Sound touch elastography (STE) is a kind of ultrasonic imaging technology developed recently in China, which can display the tissue hardness information in the region of interest (ROI) in real time, and provide the elastic value related to the mass and its periphery through Shell quantitative analysis tool kit. The hardness change of the lesion tissue was measured accurately. However, to the best of our knowledge, there are no studies exploring the relations between characteristics of ultrasound elastography and HER2+. In this study, we build a machine learning model for HER2 status prediction based on the characteristics of conventional ultrasound combined with ultrasound elastography. In addition, Shapley additive explanations (SHAP) method (Lundberg et al., 2020; Lv et al., 2023) was used to explore the interpretability of the model. We hope that the model can provide more valuable information for personalized healthcare of breast cancer.
2 Materials and methods
2.1 Cohorts
Patients with breast cancer at the Affiliated Hospital of Xuzhou Medical University between January 2021 and December 2022 were used in this study. All patients were confirmed by gross needle aspiration biopsy or surgical pathology.
Exclusion criteria were as follows: 1) pregnant or lactating women; 2) tumor diameter more than 50 mm; 3) patients who have undergone interventional treatment (e.g., chemotherapy, radiotherapy) before ultrasound examination; 4) patients with severe organ insufficiency; 5) poor patient compliance. Finally, 51 patients with HER2+ breast cancer were enrolled in this study. As controls, we also recruited 52 patients with HER2-breast cancer and 50 patients with benign breast disease. The study follows the “Transparent Reporting of a Multivariable Prediction Model for Individual Prognosis or Diagnosis” (Collins et al., 2015). All patients were de-identified.
2.2 Ultrasound
Ultrasound scans were obtained using Mindray Resona 7S Doppler Color Ultrasound and a liner transducer L14-5WU with strain elastography and acoustic palpation elastography system. The operations and assessments were performed by three physicians skilled in ultrasound elastography and conventional ultrasound.
Specifically, all patients first underwent a conventional ultrasound examination. The location, size (maximum diameter), morphology, margins, orientation, echo pattern, microcalcification, and hyperechoic halo of the lesion were recorded. Next, the section with the most abundant blood flow was used to assess the blood flow classification (Adler classification (Adler et al., 1990)) and measured the resistance index (RI). Finally, all patients underwent an ultrasound elastography examination, strain ratio, strain elasticity score, lesion mean elastic modulus (Amean), lesion maximum elastic modulus (Amax), lesion peripheral (shell 2 mm) mean elastic modulus (Smean), lesion peripheral maximum elastic modulus (Smax) were recorded. In Figure 1, we show examples of ultrasound elastography for (a) HER2+ breast cancer, (b) HER-breast cancer and (c) benign breast disease.
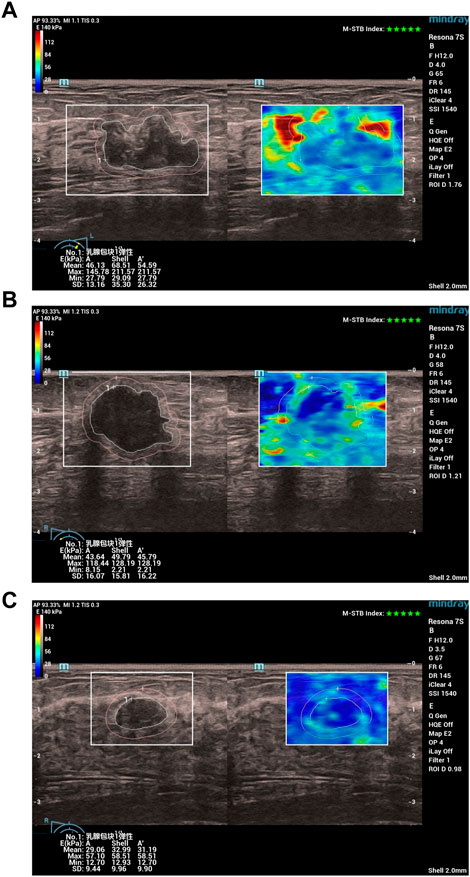
FIGURE 1. Examples of ultrasound elastography for (A) HER2+ breast cancer, (B) HER-breast cancer and (C) benign breast disease. Chinese characters 乳腺包块1弹性: in (A–C) stand for “Breast mass 1 elasticity“.
2.3 Statistical analysis
Python (Version 3.7) was used for statistical analysis and visualization. One demographic feature, nine conventional ultrasound features, and six ultrasound elastography features were used in this study (Table 1; Table 2). Among these features, age, size, resistance index, strain elasticity score, strain ratio, Amean, Amax, Smean, and Smax are continuous variables, while orientation, shape, margin, echo pattern, microcalcification hyperechoic halo and Adler classification are discrete variables. For continuous variables, they are presented as median
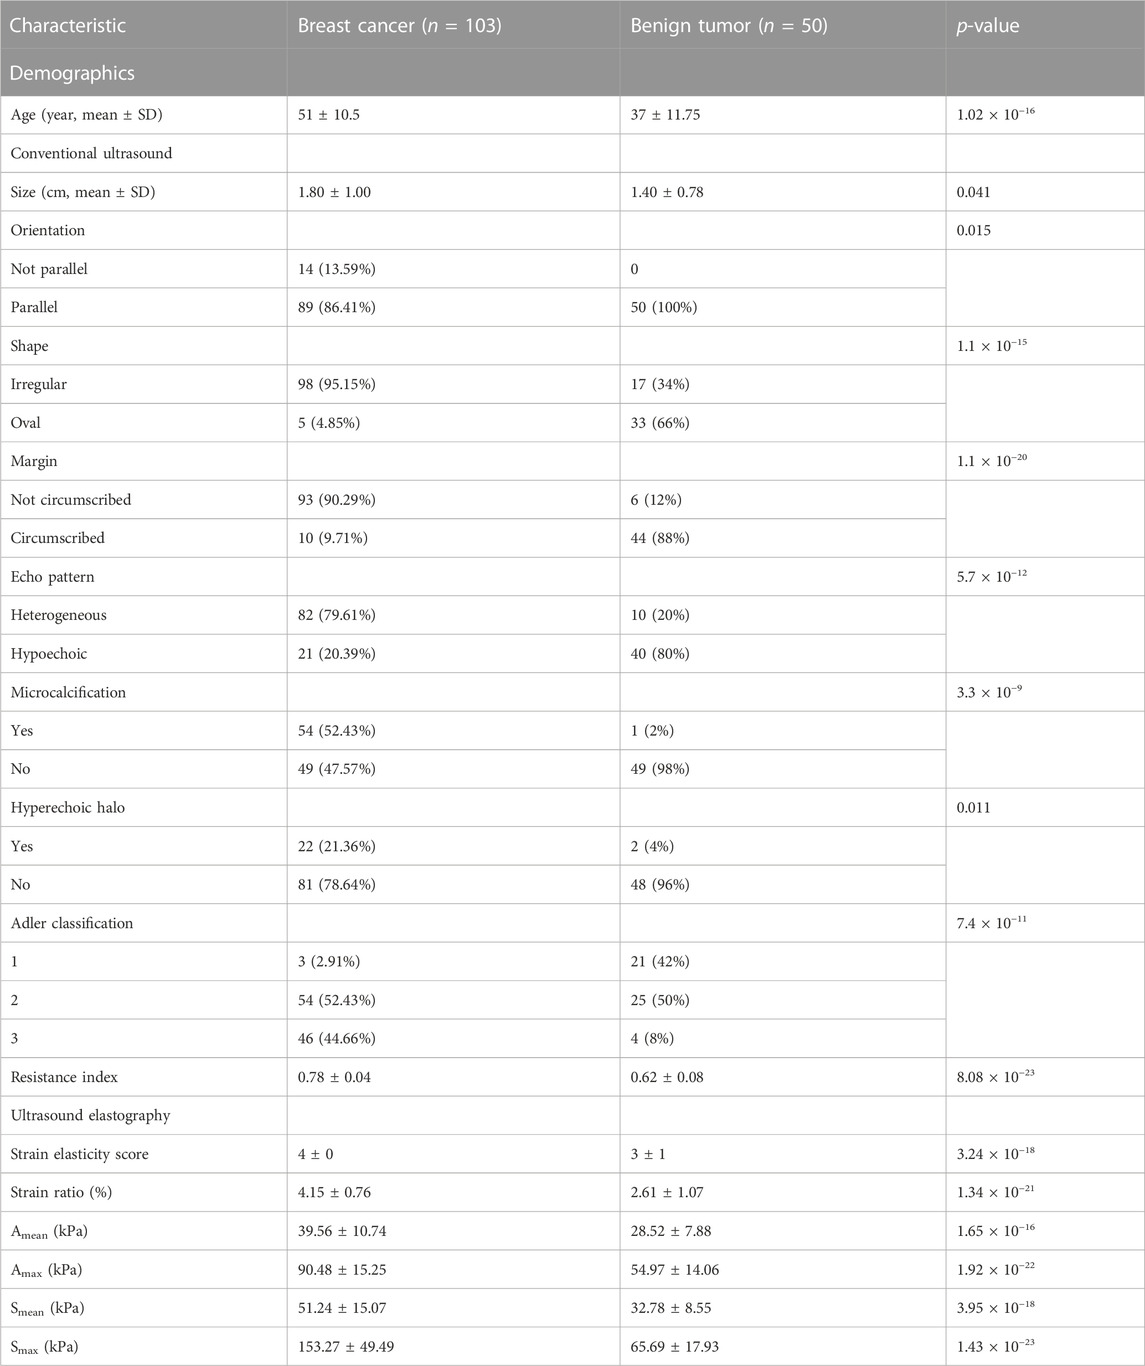
TABLE 1. The characteristic stratified by tumor status.
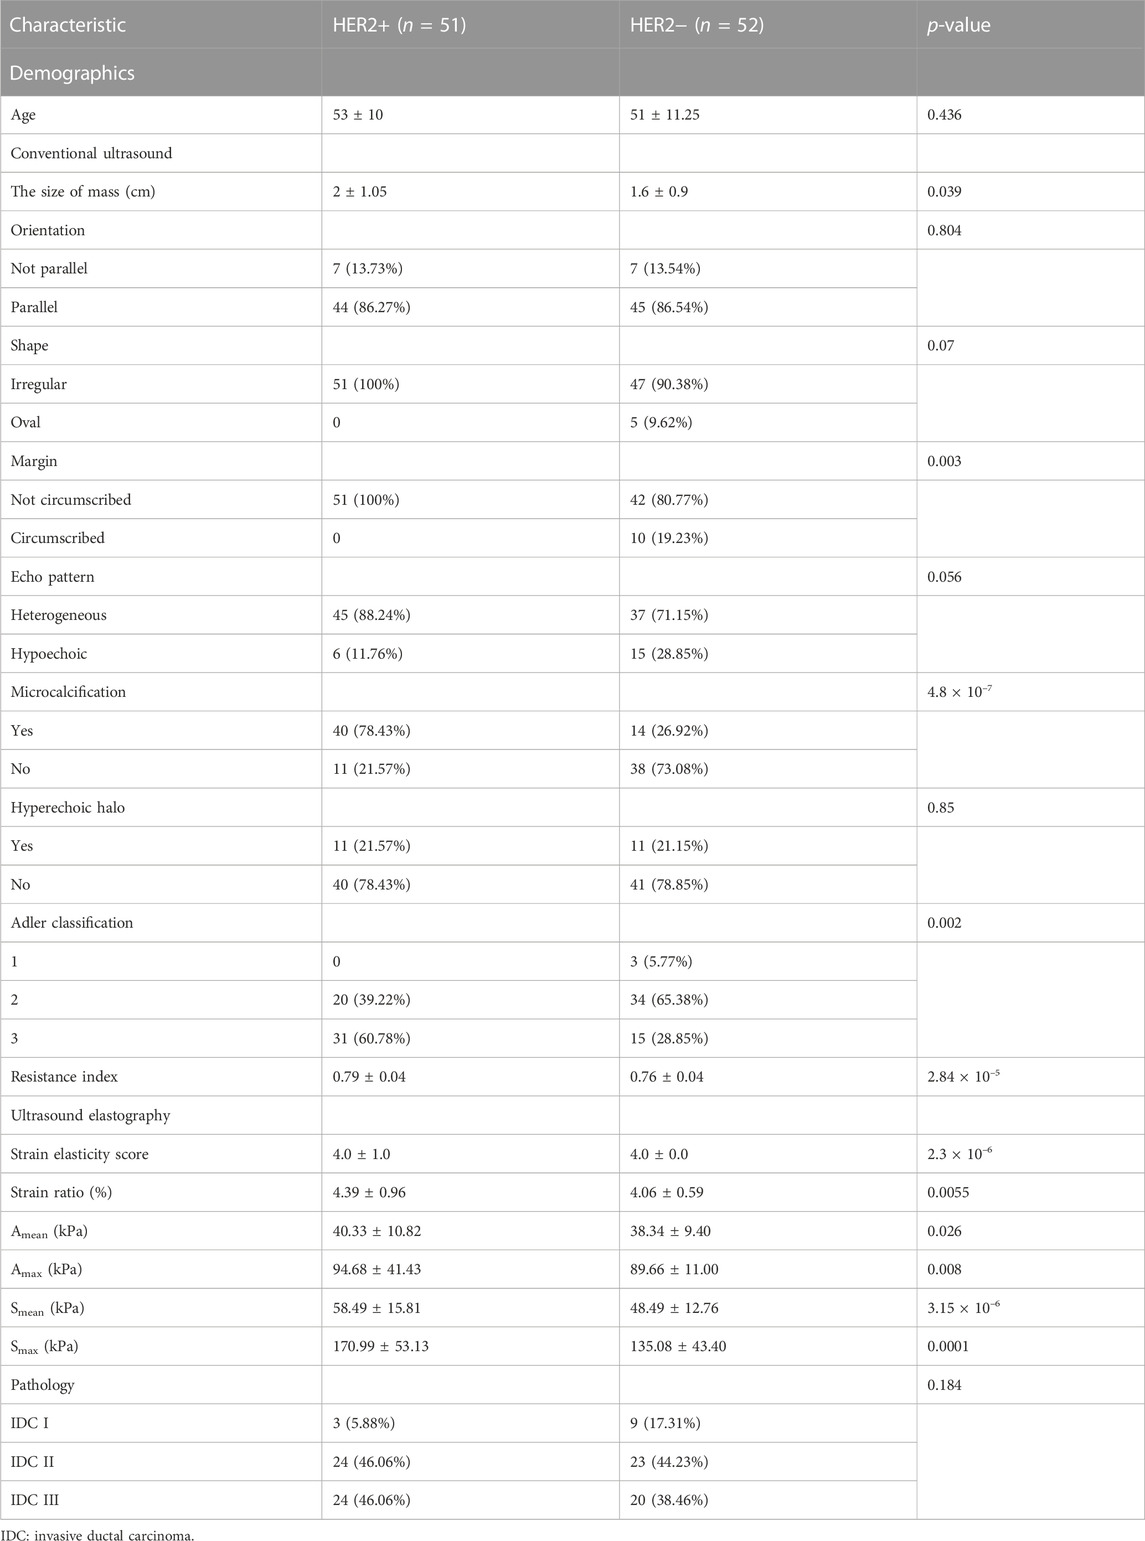
TABLE 2. The characteristic stratified by HER2 status.
2.4 Machine learning models
A tree-based machine learning approach was used for feature selection (Ke et al., 2017). In the tree-based model, zero-importance features are not used to split any nodes, so the features have no impact on the performance of tree-based models. Previous study has shown that we can obtain the best results if 70%–80% of the data is used for training, and 20%–30% of the data is used for testing (Gholamy et al., 2018). Therefore, all patients were randomly divided into a training set (80%) and a test set (20%). The extreme gradient boosting (XGBoost) model (Chen and Guestrin, 2016) was used to predict the status of tumor (benign tumor or breast cancer) and the status of HER2 (HER2+ or HER2−). Hyperparameters of models (e.g., n_estimators, max depth, learning rate) were selected by k-fold cross-validation on the training set. Usually, k is set to 5 or 10. However, the size of dataset used in this study is small, and a larger k leads to larger fluctuations in the performance of the model (Supplementary Figure S1). Therefore, k is set to 5. The model with the optimal hyperparameters was validated by the holdout test set, and area under the receiver operating characteristic curve (AUROC) was used to evaluate the performance of models. The 95% confidence interval of AUORC on test set was calculated by 1000 bootstrap replicates. The SHAP method was used to explore interpretability of models (Lundberg et al., 2020).
In addition, we also developed a logistic regression (LR) model to predict the status of HER2. We then compared performance of the LR model with that of the XGBoost model.
3 Results
3.1 Cohort characteristics
The cohort included 51 patients with HER2+ breast cancer, 52 patients with HER2-breast cancer and 50 patients with benign breast disease. For patients with breast cancer and benign breast disease, all characteristics showed significant differences (Table 1). Therefore, all features were used to predict the status of tumor (breast cancer or benign tumor). However, for patients with HER2+ breast cancer and HER2-breast cancer, age, orientation, shape, echo pattern, hyperechoic halo and pathology did not show significant differences (Table 2). In addition, we used a tree-based machine learning model (i.e., LightGBM) to calculate the importance of the features. As shown in Supplementary Table S1, orientation, shape, margin, echo pattern, hyperechoic halo and Adler classification are zero importance features. In tree-based machine learning models, the features do not have any effect on the performance of models. Therefore, microcalcification, Amean, resistance index, Smean, Amax, Smax, size and strain ratio were used to predict the status of HER2 (HER2+ or HER2−). Subsequently, we explored whether the features of conventional ultrasound combined with ultrasound elastography could improve the predicted accuracy of tumor status and HER2 status.
3.2 Prediction of tumor status
There were 82 patients with breast cancer and 40 patients with benign breast disease in the training set, and there were 21 patients with breast cancer and 10 patients with benign breast disease in the test set. All features (Table 1) were used to predict the status of tumor (breast cancer or benign tumor). For the model with features of conventional ultrasound, the cross-validation AUROCs ranged from 0.98 to 1 (
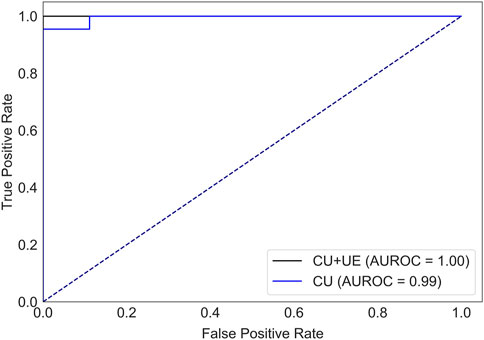
FIGURE 2. AUROCs of tumor status prediction models with ultrasound elastography features and/or conventional ultrasound features for the test set. CU: conventional ultrasound. UE: ultrasound elastography.
3.3 Prediction of HER2 status
There were 40 patients with breast cancer and 41 patients with benign breast disease in the training set, and there were 11 patients with breast cancer and 11 patients with benign breast disease in the test set. As shown in Table 2, age, orientation, shape, echo pattern, hyperechoic halo and pathology did not show significant differences. Therefore, these features were not used to build machine learning models. For the model with features of conventional ultrasound, the cross-validation AUROC ranged from 0.53 to 0.93 (
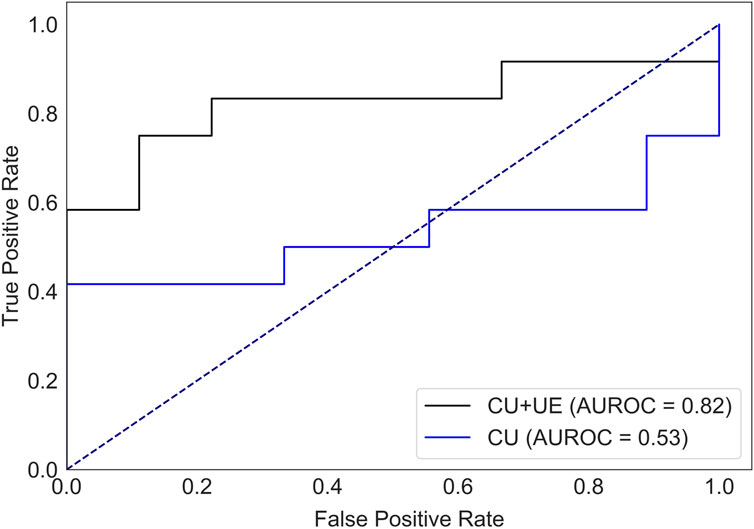
FIGURE 3. AUROC of HER2 status prediction models with ultrasound elastography features and/or conventional ultrasound features for the test set. CU: conventional ultrasound. UE: ultrasound elastography.
Supplementary Table S1 provides valuable insights into the stepwise variable selection method. Next, we compared the performance of models with different features (i.e., top 8 features, top 10 features and top 16 features). As shown in Supplementary Figure S4, the model with the top 8 features showed the best performance. Introducing irrelevant features into the model can degrade the performance of the model.
To evaluate the performance of the XGBoost model, we also developed a LR model using the same training set and test set. Compared with the XGBoost model (Supplementary Table S2), LR model had a lower test AUROC (XGBoost mode, 0.82 vs. LR model, 0.72), lower precision (XGBoost mode, 0.88 vs. LR model, 0.80), higher recall (XGBoost mode, 0.58 vs. LR model, 0.67) and higher F1-value (XGBoost mode, 0.70 vs. LR model, 0.73). For HER2+ prediction, we prefer to screen out more suspected HER2+ patients than to miss a possible HER2+ patient, so the F1-value should be preferred as an evaluation metric. Therefore, LR model is a better choice for our prediction purposes (higher recall). However, for clinical prediction models, while the performance of the model is very important, the interpretability of the model should not be neglected. In recent years, the XGBoost model combined with the SHAP method have been widely used in cohort studies (Deng et al., 2022; Lv et al., 2023). These interpretable machine learning models can give not only the prediction results, but also the reasonable reasons for the judgments. Therefore, we prefer to use the XGBoost model. Next, we use SHAP model to explore the interpretability of the model.
3.4 Interpretability of the model
The SHAP method can help us identify key factors for HER2+ at the patient level and at the cohort level. First, we identified key factors for HER2+ at the patient level. As shown in Figure 4, We show a patient with the highest SHAP value (Figure 4A) and a patient with the lowest SHAP value (Figure 4B). The baseline is the mean SHAP value of −0.1369. The predicted risk for the patient with the highest SHAP value is 2.43. Microcalcification, larger Smean (67.31) and so on are potential key factors for HER2+. For the patient with the lowest SHAP value (−3.64), no microcalcifications, lower resistance index and Amax and so on contribute to HER2−.
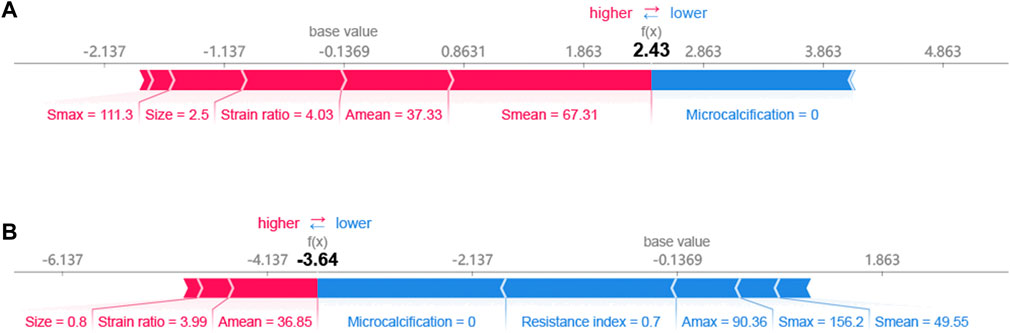
FIGURE 4. Breast cancer patients with (A) the highest and (B) the lowest SHAP values.
Next, we identified key factors for HER2+ at the cohort level. As shown in Figure 5, microcalcification, Amean, Smean, size and resistance index are the top 5 key factors to identify HER2 status. Compared with Smax and Amax, Amean, and Smean are better key factors to identify HER2 status.
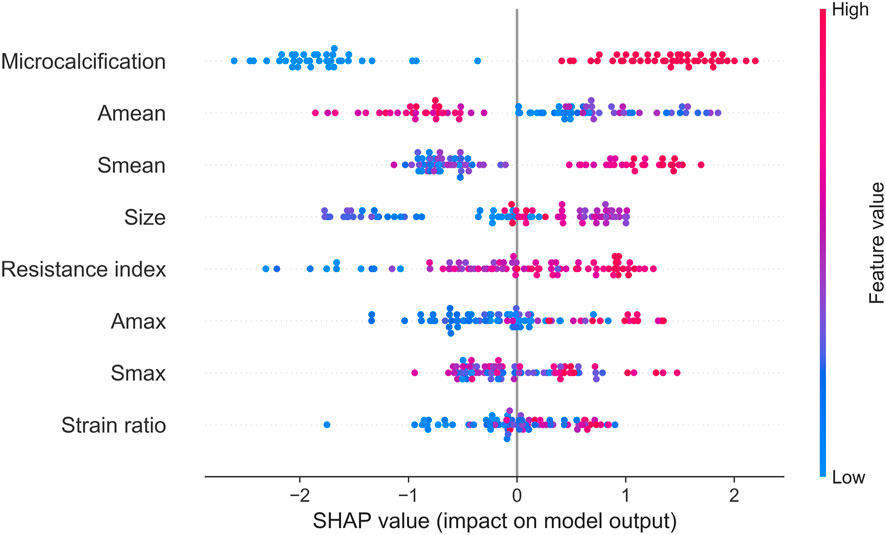
FIGURE 5. SHAP summary plot of the 8 key factors.
Finally, we used clustering algorithm to explore relations between these features. As shown in Figure 6, patients with similar features and similar subtypes were grouped together. Overall, microcalcifications have a strong correlation with HER2+ (cluster 2). However, smaller tumor and Amean have a negative effect on the result of model (cluster 1). For patients without microcalcification, larger Smean or Smax (cluster 3) increase the likelihood of HER2+. In addition, we also performed partial regression analysis. As shown in Supplementary Figures S5–S12, the effects of microcalcification, resistance index and Smean on HER2+ were more significant. It shows that conventional ultrasound combined with ultrasound elastography can predict HER2 status better.
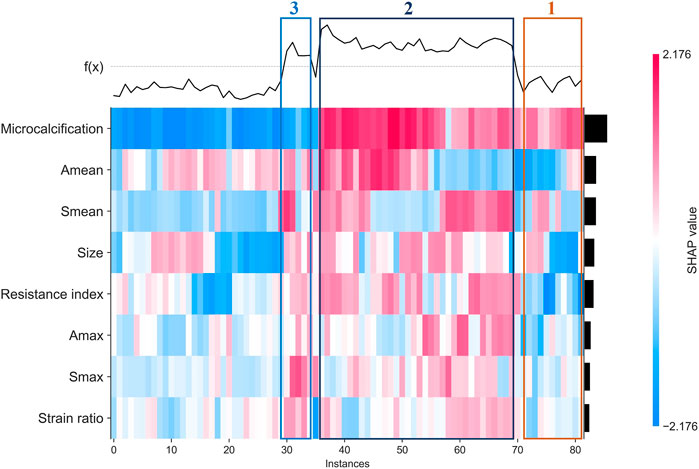
FIGURE 6. Heatmap that identify clusters of breast cancer patients who have similar characteristics and outcomes.
4 Discussion
Compared with other subtypes of breast cancer, HER2+ breast cancer is more malignant, more aggressive, and more likely to recur and metastasize (Guarneri et al., 2013). In recent years, the development of HER2-targeted drugs have led to significant benefits for patients with HER2+ breast cancer (Kümler et al., 2014). Therefore, it is critical to identify the HER2 status of breast cancer patients accurately and quickly.
Ultrasound is widely used for breast cancer screening and diagnosis (Berg et al., 2015), and previous studies have shown that there are some correlations between ultrasound characteristics and breast cancer subtypes (Wu et al., 2019; Gumowska et al., 2021). Conventional ultrasound can evaluate the shape, size, margin, and echo pattern of tumors. In summary, the shape of breast cancer lesions is irregular, the margin of the lesions is not circumscribed, the interior of the lesion is rich in blood flow, and the echo pattern is not homogeneous (Table 1). Both the machine learning model with conventional ultrasound and the machine learning model with conventional ultrasound and ultrasound elastography have shown excellent performance in predicting tumor status (Figure 2). However, machine learning models with conventional ultrasound haven shown moderate performance in predicting HER2 state (Figure 3). Ultrasound elastography can evaluate the hardness of tumors, providing a new opportunity for the prediction of HER2 status (Carlsen et al., 2015; Yao et al., 2023). The introduction of tumor elasticity information significantly improves the performance of the machine learning model (Figure 3). The SHAP method can help us identify key factors for predicting HER2 status (Figures 4–6).
For conventional ultrasound, size, margin, microcalcification, Adler classification and resistance index were considered as key factors for predicting HER2 status (Table 2; Figure 5). HER2+ stimulates the wild growth of cancer cells, leading to inadequate local blood supply, resulting in cell death and microcalcification (Zhou and Hung, 2003; Loibl and Gianni, 2017). Therefore, HER2+ tumors are usually larger and have microcalcifications (Table 2). In addition, HER2+ increases cancer cell aggressiveness (Pupa et al., 2021). Therefore, the margin of HER2+ are usually not circumscribed (Table 2). However, the prerequisite for rapid tumor growth and infiltration is the formation of a large number of microvessels (Furuya et al., 2005). Microvessels provide the nutrients and oxygen needed for tumor growth (Pluda and Parkinson, 1996). In this study, we found that HER2+ patients have a higher Adler classification (Table 2). This finding is consistent with previous studies (Pluda and Parkinson, 1996; Furuya et al., 2005).
For ultrasound elastography, we found that elastic modulus parameters (i.e., Amean, Amax, Smean, and Smax) were significantly higher in HER2+ tumors than in HER2-tumors (Table 2). It may be related to higher microvascular density and interstitial water in HER2+ tumors (Zhang et al., 2022; Kurt et al., 2023). Yoo et al. found that the hardness of the tumor is associated with tissue hypoxia (Yoo et al., 2020), and HER2 contributes to increased hypoxic response in breast cancer by regulating HIF-2α (Jarman et al., 2019). Therefore, we speculated that elastic modulus parameters of tumors can reflect the status of HER2 to some extent. In Figure 5, we found that microcalcification is the most important factor for predicting HER2 status, and it is consistent with the study of Elias et al. (Elias et al., 2014). However, there are some HER2+ patients without microcalcification. For the patients, elastic modulus parameters (i.e., Smean and Smax) can help us identify the HER2 status (Figure 6) and thus improve the performance of machine learning models (Figure 3).
Although this study is meaningful, our study still has some limitations: 1) This study is a retrospective single-center study with a small number of cases, and bias was inevitable; 2) The features used in this study were human-defined. With the development of deep learning, it is expected to automatically extract features from images (Lin et al., 2017; Banan et al., 2020).
5 Conclusion
In conclusion, ultrasound features are closely related to HER2 status. We developed interpretable machine learning models combined with conventional ultrasound and ultrasound elastography features to predict the state of HER2. The model combined with ultrasound elastography features showed better performance. Conventional ultrasound combined with ultrasound elastography can predict HER2 status better. Microcalcification, Amean, Smean, size and resistance index are the top 5 key factors to identify HER2 status. It is meaningful for breast cancer screening and diagnosis and personalized medicine.
Data availability statement
The raw data supporting the conclusion of this article will be made available by the authors, without undue reservation.
Author contributions
JiL: conceptualization, methodology, investigation, methodology, visualization, writing-original draft; XZ, BC, JaL, YL, and JeL: data curation, writing-original draft; XZ, JoL, and NZ: writing-review and editing, funding acquisition, project administration, supervision, writing—review and editing. All authors contributed to the article and approved the submitted version.
Funding
This research was funded by Xuzhou key research and development plan (social development) project—general medical and health project (KC22232; KC22236), Xuzhou National Clinical Key Specialty Cultivation Project (2018ZK004), The excellent young and middle-age talents project of the affiliated hospital of Xuzhou medical university (2019128009).
Conflict of interest
The authors declare that the research was conducted in the absence of any commercial or financial relationships that could be construed as a potential conflict of interest.
Publisher’s note
All claims expressed in this article are solely those of the authors and do not necessarily represent those of their affiliated organizations, or those of the publisher, the editors and the reviewers. Any product that may be evaluated in this article, or claim that may be made by its manufacturer, is not guaranteed or endorsed by the publisher.
Supplementary material
The Supplementary Material for this article can be found online at: https://www.frontiersin.org/articles/10.3389/fphys.2023.1188502/full#supplementary-material
References
Adler, D. D., Carson, P. L., Rubin, J. M., and Quinn-Reid, D. (1990). Doppler ultrasound color flow imaging in the study of breast cancer: Preliminary findings. Ultrasound Med. Biol. 16, 553–559. doi:10.1016/0301-5629(90)90020-d
Baez-Navarro, X., van Bockstal, M. R., Nawawi, D., Broeckx, G., Colpaert, C., Doebar, S. C., et al. (2023). Interobserver variation in the assessment of immunohistochemistry expression levels in HER2-negative breast cancer: Can we improve the identification of low levels of HER2 expression by adjusting the criteria? An international interobserver study. Mod. Pathol. 36, 100009. doi:10.1016/j.modpat.2022.100009
Banan, A., Nasiri, A., and Taheri-Garavand, A. (2020). Deep learning-based appearance features extraction for automated carp species identification. Aquac. Eng. 89, 102053. doi:10.1016/j.aquaeng.2020.102053
Barr, R. G. (2018). The role of sonoelastography in breast lesions. Seminars Ultrasound, CT MRI 39, 98–105. doi:10.1053/j.sult.2017.05.010
Berg, W. A., Bandos, A. I., Mendelson, E. B., Lehrer, D., Jong, R. A., and Pisano, E. D. (2015). Ultrasound as the primary screening test for breast cancer: Analysis from ACRIN 6666. J. Natl. Cancer Inst. 108, djv367. doi:10.1093/jnci/djv367
Bruening, W., Fontanarosa, J., Tipton, K., Treadwell, J. R., Launders, J., and Schoelles, K. (2010). Systematic review: Comparative effectiveness of core-needle and open surgical biopsy to diagnose breast lesions. Ann. Intern Med. 152, 238–246. doi:10.7326/0003-4819-152-1-201001050-00190
Carlsen, J., Ewertsen, C., Sletting, S., Vejborg, I., Schäfer, F. K. W., Cosgrove, D., et al. (2015). Ultrasound elastography in breast cancer diagnosis. Ultraschall Med. 36, 550–565. doi:10.1055/s-0035-1553293
Chen, T., and Guestrin, C. (2016). “XGBoost: A scalable tree boosting system,” in Proceedings of the 22nd ACM SIGKDD international conference on knowledge discovery and data mining (San Francisco, California, USA: Association for Computing Machinery), 785–794.
Collins, G. S., Reitsma, J. B., Altman, D. G., and Moons, K. G. M. (2015). Transparent reporting of a multivariable prediction model for individual prognosis or diagnosis (TRIPOD): The TRIPOD statement. Ann. Intern. Med. 162, 1142–1151. doi:10.1016/j.eururo.2014.11.025
Deng, H., Eftekhari, Z., Carlin, C., Veerapong, J., Fournier, K. F., Johnston, F. M., et al. (2022). Development and validation of an explainable machine learning model for major complications after cytoreductive surgery. JAMA Netw. Open 5, e2212930. doi:10.1001/jamanetworkopen.2022.12930
Ebner, F., Friedl, T. W. P., de Gregorio, A., Lato, K., Bekes, I., Janni, W., et al. (2018). Seroma in breast surgery: All the surgeons fault? Archives Gynecol. Obstetrics 298, 951–959. doi:10.1007/s00404-018-4880-8
Elias, S. G., Adams, A., Wisner, D. J., Esserman, L. J., van't Veer, L. J., Mali, W. P. T. M., et al. (2014). Imaging features of HER2 overexpression in breast cancer: A systematic review and meta-analysis. Cancer Epidemiol. Biomarkers Prev. 23, 1464–1483. doi:10.1158/1055-9965.EPI-13-1170
Furuya, M., Nishiyama, M., Kasuya, Y., Kimura, S., and Ishikura, H. (2005). Pathophysiology of tumor neovascularization. Vasc. health risk Manag. 1, 277–290. doi:10.2147/vhrm.2005.1.4.277
Gholamy, A., Kreinovich, V., and Kosheleva, O. (2018). Why 70/30 or 80/20 relation between training and testing sets: A pedagogical explanation. Technical Report UTEP-CS-18-09 (2018).
Guarneri, V., Dieci, M. V., Barbieri, E., Piacentini, F., Omarini, C., Ficarra, G., et al. (2013). Loss of HER2 positivity and prognosis after neoadjuvant therapy in HER2-positive breast cancer patients. Ann. Oncol. 24, 2990–2994. doi:10.1093/annonc/mdt364
Gumowska, M., Mączewska, J., Prostko, P., Roszkowska-Purska, K., and Dobruch-Sobczak, K. (2021). Is there a correlation between multiparametric assessment in ultrasound and intrinsic subtype of breast cancer? J. Clin. Med. 10, 5394. doi:10.3390/jcm10225394
Harbeck, N., and Gnant, M. (2017). Breast cancer. Lancet 389, 1134–1150. doi:10.1016/s0140-6736(16)31891-8
Hudis, C. A. (2007). Trastuzumab — mechanism of action and use in clinical practice. N. Engl. J. Med. 357, 39–51. doi:10.1056/nejmra043186
Jarman, E. J., Ward, C., Turnbull, A. K., Martinez-Perez, C., Meehan, J., Xintaropoulou, C., et al. (2019). HER2 regulates HIF-2α and drives an increased hypoxic response in breast cancer. Breast Cancer Res. 21, 10. doi:10.1186/s13058-019-1097-0
Ke, G. L., Meng, Q., Finley, T., Wang, T. F., Chen, W., Ma, W. D., et al. (2017). “LightGBM: A highly efficient gradient boosting decision tree,” in 31st annual conference on neural information processing systems (NIPS) (Long Beach, CA: Spinger).
Kümler, I., Tuxen, M. K., and Nielsen, D. L. (2014). A systematic review of dual targeting in HER2-positive breast cancer. Cancer Treat. Rev. 40, 259–270. doi:10.1016/j.ctrv.2013.09.002
Kurt, S. A., Kayadibi, Y., Saracoglu, M. S., Ozturk, T., Korkmazer, B., Cerit, M., et al. (2023). Prediction of molecular subtypes using superb microvascular imaging and shear wave elastography in invasive breast carcinomas. Acad. Radiol. 30, 14–21. doi:10.1016/j.acra.2022.04.017
Lin, Y. Z., Nie, Z. H., and Ma, H. W. (2017). Structural damage detection with automatic feature-extraction through deep learning. Computer-Aided Civ. Infrastructure Eng. 32, 1025–1046. doi:10.1111/mice.12313
Loibl, S., and Gianni, L. (2017). HER2-positive breast cancer. Lancet 389, 2415–2429. doi:10.1016/s0140-6736(16)32417-5
Lundberg, S. M., Erion, G., Chen, H., DeGrave, A., Prutkin, J. M., Nair, B., et al. (2020). From local explanations to global understanding with explainable AI for trees. Nat. Mach. Intell. 2, 56–67. doi:10.1038/s42256-019-0138-9
Lüönd, F., Tiede, S., and Christofori, G. (2021). Breast cancer as an example of tumour heterogeneity and tumour cell plasticity during malignant progression. Br. J. Cancer 125, 164–175. doi:10.1038/s41416-021-01328-7
Lv, J., Zhang, M., Fu, Y., Chen, M., Chen, B., Xu, Z., et al. (2023). An interpretable machine learning approach for predicting 30-day readmission after stroke. Int. J. Med. Inf. 174, 105050. doi:10.1016/j.ijmedinf.2023.105050
Ma, M., Liu, R., Wen, C., Xu, W., Xu, Z., Wang, S., et al. (2022). Predicting the molecular subtype of breast cancer and identifying interpretable imaging features using machine learning algorithms. Eur. Radiol. 32, 1652–1662. doi:10.1007/s00330-021-08271-4
Pluda, J. M., and Parkinson, D. R. (1996). Clinical implications of tumor-associated neovascularization and current antiangiogenic strategies for the treatment of malignancies of pancreas. Cancer 78, 680–687. doi:10.1002/(SICI)1097-0142(19960801)78:3<680:AID-CNCR49>3.0.CO;2-S
Pupa, S. M., Ligorio, F., Cancila, V., Franceschini, A., Tripodo, C., Vernieri, C., et al. (2021). HER2 signaling and breast cancer stem cells: The bridge behind HER2-positive breast cancer aggressiveness and therapy refractoriness. Cancers 13, 4778. doi:10.3390/cancers13194778
Sung, H., Ferlay, J., Siegel, R. L., Laversanne, M., Soerjomataram, I., Jemal, A., et al. (2021). Global cancer statistics 2020: GLOBOCAN estimates of incidence and mortality worldwide for 36 cancers in 185 countries. CA a cancer J. Clin. 71, 209–249. doi:10.3322/caac.21660
Wolff, A. C., Hammond, M. E. H., Allison, K. H., Harvey, B. E., Mangu, P. B., Bartlett, J. M. S., et al. (2018). Human epidermal growth factor receptor 2 testing in breast cancer: American society of clinical oncology/college of American Pathologists clinical practice guideline focused update. J. Clin. Oncol. 36, 1364–1382. doi:10.5858/arpa.2018-0902-sa
Wu, T., Li, J., Wang, D., Leng, X., Zhang, L., Li, Z., et al. (2019). Identification of a correlation between the sonographic appearance and molecular subtype of invasive breast cancer: A review of 311 cases. Clin. Imaging 53, 179–185. doi:10.1016/j.clinimag.2018.10.020
Yao, Z., Luo, T., Dong, Y., Jia, X., Deng, Y., Wu, G., et al. (2023). Virtual elastography ultrasound via generative adversarial network for breast cancer diagnosis. Nat. Commun. 14, 788. doi:10.1038/s41467-023-36102-1
Yoo, J., Seo, B. K., Park, E. K., Kwon, M., Jeong, H., Cho, K. R., et al. (2020). Tumor stiffness measured by shear wave elastography correlates with tumor hypoxia as well as histologic biomarkers in breast cancer. Cancer Imaging 20, 85. doi:10.1186/s40644-020-00362-7
Zhang, X. Y., Cai, S. M., Zhang, L., Zhu, Q. L., Sun, Q., Jiang, Y. X., et al. (2022). Association between vascular index measured via superb microvascular imaging and molecular subtype of breast cancer. Front. Oncol. 12, 861151. doi:10.3389/fonc.2022.861151
Zhou, B. Y., Wang, L. F., Yin, H. H., Wu, T. F., Ren, T. T., Peng, C., et al. (2021). Decoding the molecular subtypes of breast cancer seen on multimodal ultrasound images using an assembled convolutional neural network model: A prospective and multicentre study. eBioMedicine 74, 103684. doi:10.1016/j.ebiom.2021.103684
Keywords: HER2, breast cancer, machine learning, shap, ultrasound
Citation: Zhuo X, Lv J, Chen B, Liu J, Luo Y, Liu J, Xie X, Lu J and Zhao N (2023) Combining conventional ultrasound and ultrasound elastography to predict HER2 status in patients with breast cancer. Front. Physiol. 14:1188502. doi: 10.3389/fphys.2023.1188502
Received: 17 March 2023; Accepted: 30 June 2023;
Published: 12 July 2023.
Edited by:
Prashant Dogra, Houston Methodist Research Institute, United StatesReviewed by:
Akash Roy, Duke University, United StatesDipnil Chakraborty, Bristol Myers Squibb, United States
Copyright © 2023 Zhuo, Lv, Chen, Liu, Luo, Liu, Xie, Lu and Zhao. This is an open-access article distributed under the terms of the Creative Commons Attribution License (CC BY). The use, distribution or reproduction in other forums is permitted, provided the original author(s) and the copyright owner(s) are credited and that the original publication in this journal is cited, in accordance with accepted academic practice. No use, distribution or reproduction is permitted which does not comply with these terms.
*Correspondence: Jiao Lu, MTM4MTMyODIxMjlAMTYzLmNvbQ==; Ningjun Zhao, emhhb25qZG9jQDEyNi5jb20=
†These authors have contributed equally to this work