 Zhike Xu
 Chenghan Chen
 Pengfei Hao1,2
 Xiwen Zhang
94% of researchers rate our articles as excellent or good
Learn more about the work of our research integrity team to safeguard the quality of each article we publish.
Find out more
ORIGINAL RESEARCH article
Front. Physiol., 05 July 2023
Sec. Computational Physiology and Medicine
Volume 14 - 2023 | https://doi.org/10.3389/fphys.2023.1181423
This article is part of the Research TopicRecent Advances in the Design and Preclinical Evaluation of Ventricular Assist DevicesView all 9 articles
Most of the existing hemolysis mechanism studies are carried out on the macro flow scale. They assume that the erythrocyte membranes with different loads will suffer the same damage, which obviously has limitations. Thus, exploring the hemolysis mechanism through the macroscopic flow field information is a tough challenge. In order to further understand the non-physiological shear hemolysis phenomenon at the cell scale, this study used the coarse-grained erythrocytes damage model at the mesoscopic scale based on the transport dissipative particle dynamics (tDPD) method. Combined with computational fluid dynamics the hemolysis of scalarized shear stress (
Heart failure (HF) is a complex clinical syndrome caused by structural and functional damage to the filling or ejection of blood from the ventricles. According to statistics, the prevalence of HF with clinical symptoms is 1.3%–1.8%, the prevalence of asymptomatic HF is 1.5%–2%, and the prevalence of HF in people over 65 years old is as high as 10% (Basil et al., 2017). Cardiogenic shock (CS), which occurs in the late stages of HF, is very lethal, and patients must receive timely cardiac perfusion therapy to save their lives. Thoracotomy implantation of an artificial heart can be very dangerous for patients with end-stage HF. The “Impella” series transvalvular axial blood pump can be implanted from the patient’s femoral artery (similar to the implantation of a vascular stent) to provide additional flow to the heart ejection, thereby extending the patient’s life. Currently, transvalvular micro-axial blood pumps can provide cardiac perfusion at various flow rates in a minimally invasive manner. The “Impella” pump series (Abiomed, Danvers Massachusetts, US), which represents this category, is exclusive to “Abiomed” company in the United States and is the world’s largest supplier of such left ventricular assist devices (LVADs). Available clinical data showed that the “Impella” series could achieve complete left ventricular support in a short period, providing up to 5.5 L/min of flow with a good prognosis (Mehra et al., 2019). In FDA testing, the mean time to implantation of Impella 5.0 was 16.3 ± 4.7 days, 9/22 patients had a ventricular recovery, 6/22 patients were free from the risk of acute heart failure, and the 30-day survival rate was 62% (Pahuja et al., 2021). However, various blood-contacting medical devices (BCMDs), including “Impella 5.0,” produce non-physiological shear stress that can damage red blood cells (RBCs) and the freeing of large amounts of hemoglobin (Hb) into the plasma. It can cause damage to the liver and kidneys, leading to organ failure (Olsen, 2000). Several studies have shown that most of the dangerous effects caused by BCMDs are associated with blood damage (Ellis et al., 1998; Maraj et al., 1998). During the design phase of VADs, the hydraulic properties must be carefully weighed against the blood compatibility. The empirical power-law index of hemolysis (IH) formulation is the most common method when using computational simulation techniques to assess hemolysis in VADs. The researchers first use computational fluid dynamics (CFD) to evaluate various flow field information in the vicinity of VADs and then process the flow field results to predict the IH. Eq. 1 is an empirical IH formula obtained through in vitro experiments summarized by Giersiepen et al. (Giersiepen et al., 1990)
where Hb is the total amount hemoglobin, ∆Hb is the amount of variation of hemoglobin in plasma.
Dissipative particle dynamics (DPD) has shown great potential for development in various simulations at the cellular scale. Fedosov et al. have developed a spring network erythrocyte model and “erythrocyte-erythrocyte” and “erythrocyte-platelet” aggregation force models based on DPD. Their study explains the Rouleaux stacking of erythrocytes and the Fahraeus-Lindquist effect of blood (Fedosov et al., 2010; Fedosov et al., 2011). Ye et al. have developed a cellular-scale model of thrombogenesis. They explored the adsorption properties of platelets (PLTs) and the process of thrombus formation in stenotic vessels using smooth dissipative particle dynamics (SDPD) (Ye et al., 2020). We have established an erythrocyte damage model and a transport dissipative particle dynamics (tDPD) based hemoglobin spillover model based on a coarse-grained erythrocyte model (Xu et al., 2022; Xu et al., 2023).
This study combined CFD and tDPD to explore the sensitive factors that lead to blood damage in non-physiological shear stress flow around “Impella 5.0". It is expected that, the cell-scale hemolysis analysis of “Impella 5.0” may hopefully guide the optimization design of VADs in the future.
The “Method” section introduces the transport dissipative particle dynamics (tDPD) and the RBC damage model in DPD systems. This section also provides the aggregation model of the RBCs population and the mapping relationship between DPD units.
In the “Result” section, the scalarized shear stress in Impella 5.0 trace lines was obtained from CFD as the boundary condition for DPD simulation to evaluate the sensitive factors of RBC damage at the cellular scale.
We propose a new hemolysis index based on cell-scale, which can calculate the damage rate of RBC membrane in a trace line and reflect the hemolysis situation. Then, this study collected a large amount of trace data and reflected it in the flow field of “Impella,” in order to observe the high hemolytic regions in the flow field. Finally, we used the traditional hemolysis index to observe the hemolysis details in the “Impella” clearance region.
Dissipative particle dynamics (DPD) was developed on the basis of molecular dynamics (MD) and combined with statistical mechanics theory (Hoogerbrugge and Koelman, 1992; Groot and Rabone, 2001). In the DPD method, the flow field is described as a series of interacting particles. The DPD uses a number of discrete particles to represent the state of the flow, representing the evolution of the system by recording the position and velocity of the particles at each time step. Eq. 2 is the basic equation of DPD.
where the interaction force
Li et al. (2015) added the discrete diffusion equation to the basic DPD equation. They proposed the transport dissipative particle dynamics model (tDPD), which can accomplish the advection-diffusion-reaction process (ADR) in flow The DPD-based discrete diffusion equation is derived from the continuous medium diffusion equation, and the equation framework is essentially the same as the DPD basic equation, as shown in Eq. 5.
In the diffusion equation for a continuous medium,
where
where
Prior to the twenty-first century, researchers exploring hemodynamics would typically treat blood as a Newtonian fluid. With the advancement of microfluidic techniques and rheological theories, blood-related research is set to enter a new stage. Incorporating erythrocyte modeling into blood flow has become a topic of great interest in recent years. Many optical tweezers experiments have been conducted to test the deformation of erythrocyte membranes under various states of stress and to derive the material parameters of erythrocyte membranes (Zhu et al., 2020). Dao et al. developed a viscoelastic erythrocyte membrane constitutive model. They completed the erythrocyte’s center stretching simulation using the three-dimensional finite element method, and their simulation results were also in full agreement with the optical tweezer stretching experiments (Dao et al., 2003). There are hundreds of millions of RBCs in the blood, and the RBCs have large deformation and viscoelastic characteristics. Therefore, it is very difficult to construct the fluid-structure coupling problem of RBCs-blood flow based on the traditional mesh method. Therefore, in recent years, researchers have proposed various erythrocyte models to accomplish blood flow simulation at the cellular scale with fewer computational resources. A low-dimensional model of erythrocytes consisting of ten colloidal particles was proposed by Pan et al. (Pan et al., 2010). However, the erythrocyte shape differs too much from the actual one to reproduce the deformed state of erythrocytes in flow. It is exciting that the spring network-based model of coarse-grained erythrocytes proposed by Fedosov et al. is able to achieve various deformation features of erythrocytes with a fewer number of particles (Fedosov et al., 2010). In their research tests, the error between the 500-particle constructed erythrocyte model and the real optical tweezer stretching experiment is less than 1%. The energy of the spring network-based erythrocyte model can be expressed as:
where
where
where
where
The DPD parameters of RBCs and PLTs used in this study were referenced from Yazdani et al. (2021), as shown in Table 1.
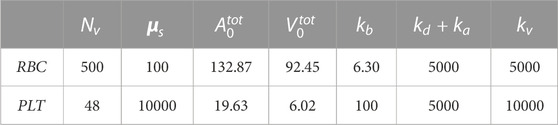
TABLE 1. Model parameters of RBCs and PLTs.
Erythrocyte destruction is based on the ultimate force between the cytoskeleton and the cell membrane tetramer. When the force between the cell membrane tetramer is greater than 24.9 pN, the erythrocyte membrane at this location is considered to have reached a state of local maximum strain (Koshiyama and Wada, 2011). In addition, when the local maximum strain region of the erythrocyte membrane exceeds 6%, the erythrocyte membrane will produce irreversible damage and generate large-scale pores (Leverett et al., 1972). Then cytoplasm such as Hb will diffuse from the pores into the plasma. After erythrocyte damage, cytoplasmic begins to spill out of the cell membrane, and the volume of erythrocytes is no longer conserved (
1. If the spring force in the RBC system is higher than
2. When the local maximum strain region of the erythrocyte membrane exceeds 6%, the corresponding area will produce large-scale holes, the cytoplasm will overflow the cell membrane, and the erythrocyte volume will no longer be conserved
3. When the erythrocyte membrane is destabilized and damaged, the spectrin skeleton with immense stress begins to disconnect, manifested as connecting bonds relaxation in the coarse-grained model. Once the spring force is greater than 24.9pN, the maximum length of the spring will increase with the increase of the spring force.
The surface elastic energy provided by the spring will be changed
The parameters are set to
In the coarse-grained erythrocyte damage simulation, if a certain erythrocyte membrane particle and other adjacent particles reach the local maximum strain, this particle will be labeled as the “Hemoglobin Diffusion Pore Particle”, implying that the cytoskeleton within this region will undergo relaxation. Meanwhile, the pore particle will generate a source term
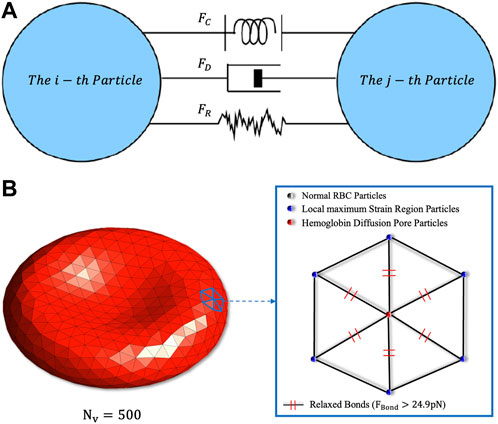
FIGURE 1. (A) Schematic diagram of the particles’ fundamental forces in DPD. The conservative force
There is a significant aggregation effect of RBCs in healthy blood. The RBC population exhibits a rouleaux coin-like stack during low-speed movement. Therefore, modelling the aggregation force of red blood cells is necessary. Besides, in a non-physiological shear stress flow, the collision among erythrocytes is frequent, the aggregation force model can provide a great repulsive force over short distances (similar to LJ potential), preventing the overlap of RBC membranes. Fedosov et al. used Lennard-Jones (LJ) potential to represent the short-range repulsive force and Morse potential to represent the long-range attraction between RBCs (Fedosov et al., 2011). However, the time step of the DPD simulation is larger than MD, and the LJ potential may generate an extremely large force between two close particles during the simulation, causing the computing system to crash. Therefore, Yazdani et al. used only the Morse potential in DPD to build cell aggregation model (Yazdani and Karniadakis, 2016). Our study also uses the Morse potential to model the aggregation force between RBCs. The basic form of the Morse potential is shown in Eq. 8.
The equilibrium distance is set

TABLE 2. Model parameters for aggregation forces between RBCs and PLTs.
The units used in the DPD method are not based on real scale units, and the results obtained from DPD simulation need to be mapped to real units through dimensional analysis. The study by Groot et al. shows that, when using the Verlet-Velocity integration algorithm, the DPD time steps less than 0.04 can stabilize the Boltzmann temperature (Groot and Warren, 1997). This study takes a time step size of 0.001, with each step corresponding to
The focus of this study is on the motion and deformation state of RBCs, so the length
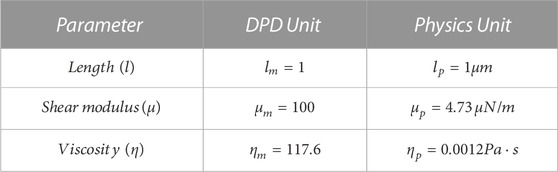
TABLE 3. Correspondence between DPD basic units and real physical units.
The scaling relationship between the basic physical quantities and other physical quantities can be obtained according to the dimensional principle, as shown in Eq. 16.
where
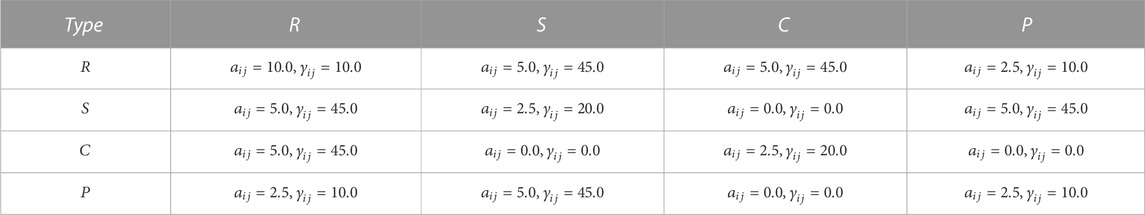
TABLE 4. DPD coefficients between different types of particles, where
The two most commonly used computational methods for CFD evaluation of the hydraulic performance of VADs are the multiple reference coordinate method (MRF) and the slip mesh method (SMM). The MRF method “freezes” the rotor in a phase. At the same time, the boundary is given a rotational speed. The VAD’s rotation is reflected by the relative rotational speed of the boundary and the rotor, thus calculating the quasi-constant flow field of the rotor at a certain phase. In the SMM method, the fluid mesh in the rotor region will rotate with time, more closely resembling the true rotation state. Wu et al. found that the time step significantly impacts the SMM method’s computational accuracy, the calculation time step must be less than
As shown in Figure 2, the “Impella 5.0” can be divided into four components. The “Shroud” is able to hold the heart valve opened and provide space for the rotor to work. The “Impeller” is the device’s rotor, which at 30,000 rpm is able to provide an additional
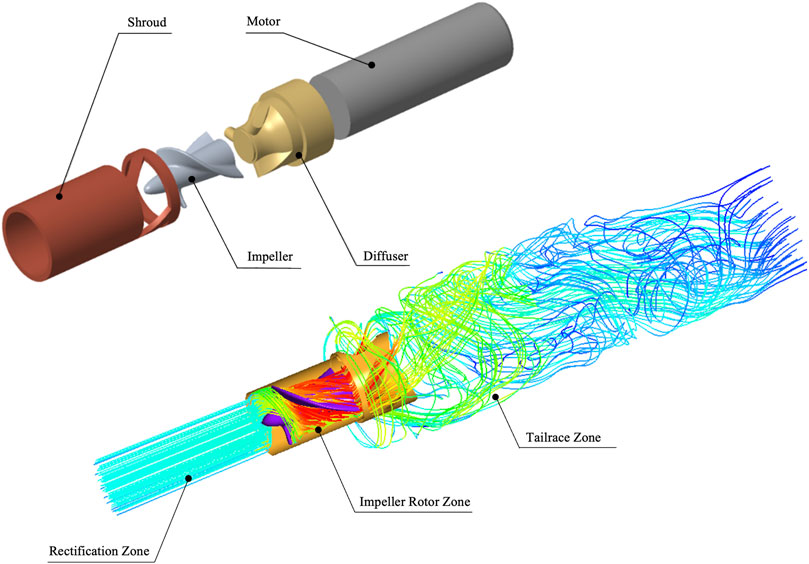
FIGURE 2. Structure and flow area of “Impella 5.0”. The “Shroud” can protect the device from working properly, the high-speed rotor “Impeller” that provides additional energy for the heart ejection. The “Diffuser” has the function of buffering and rectifying and the micro “Motor” provide energy for device. In addition, the computational area is divided into rectification zone, rotor zone and tailrace zone.
The domain segmentation is shown as Figure 3A. The whole domain has a total length of 15.5D, which is 93 mm. The Mesh independence was carried out by rescaling the basic mesh in Figure 3. It can be observed that when the number of grids exceeds 5 million. The pressure change is very small, and the calculation results are independent of the number of meshes. This study used 8.29 million meshes for CFD calculations. In addition, the quality of the final meshing is shown in Figure 3D, which was judged by mesh skewness:
where
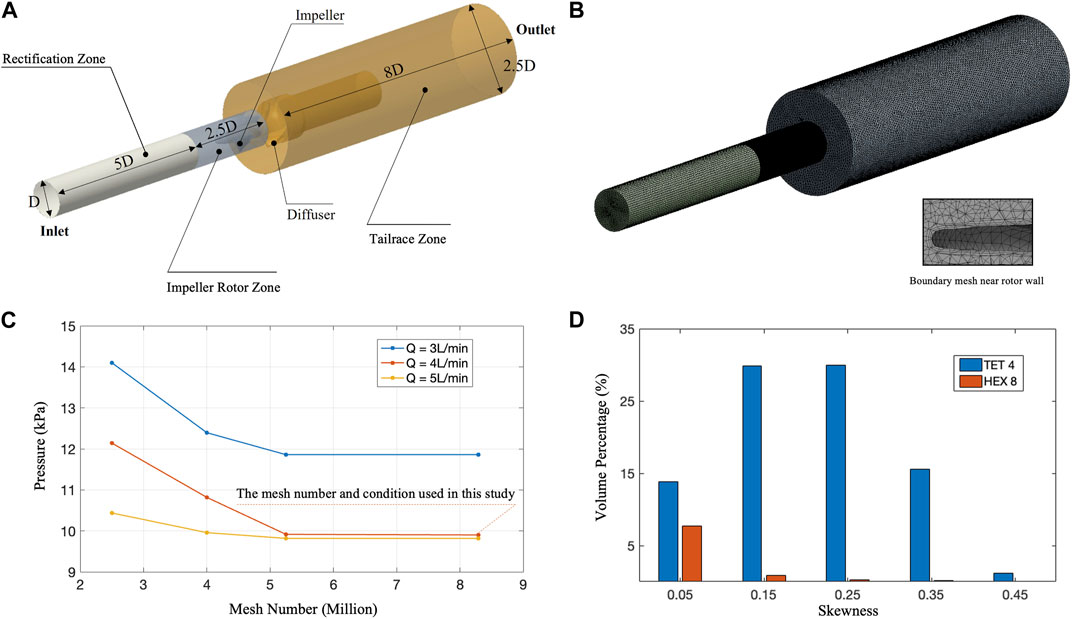
FIGURE 3. CFD mesh quality and mesh independence assessment. (A) Schematic diagram of CFD calculation area size
Scalarized the shear stress tensor not only makes it easier to quantify hemolysis, but also greatly simplifies the analysis process. Thus, tensor scalarization is usually required for the VADs hemolysis evaluation, and the most popular method of scalarization method was proposed by Bludszuweit et al. (Bludszuweit, 1995):
where
Figure 4A extracts the velocity contour and two-dimensional streamlines of the
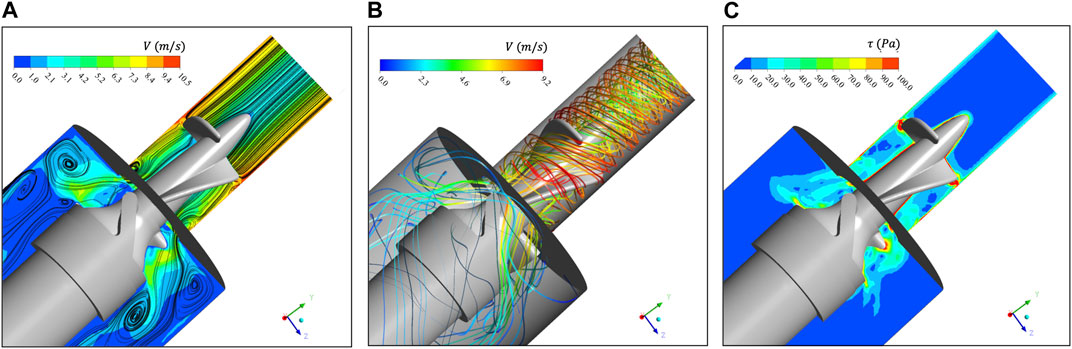
FIGURE 4. (A) Velocity contour and two-dimensional streamline of
The
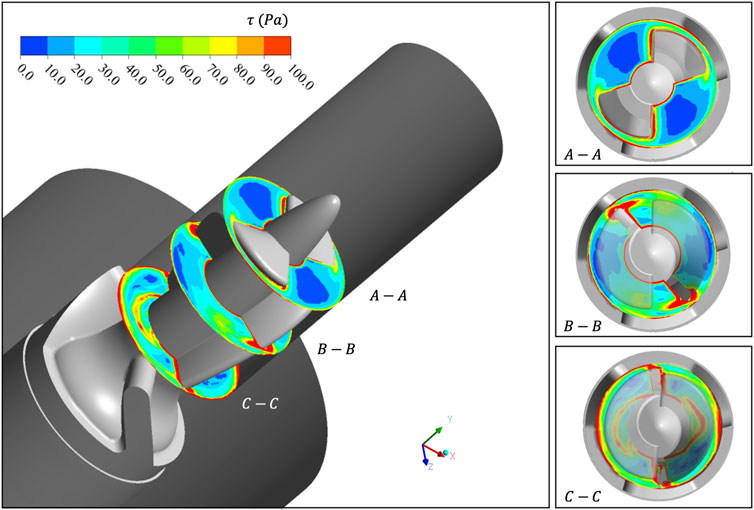
FIGURE 5.
Section 3.1 carried out a CFD-based simulation on the rotor region of “Imeplla 5.0.” We analyzed the distribution of
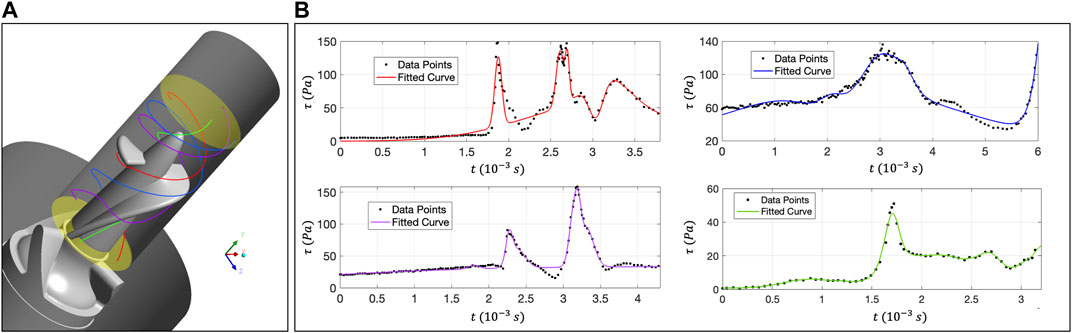
FIGURE 6. (A) Distribution of four trace lines in the rotor zone; (B) The relationship curve between
The relationship curve between
This study uses the “Large-Scale Atomic/Molecular Massively Parallel Simulator” (LAMMPS) as the DPD particle simulation platform and uses code C++ to write specific RBC damage model functions. In DPD simulation, a 500-particle RBC model is used for simulation, and the number density of liquid particles is 3 (Feng et al., 2012). Figure 7A shows the schematic diagram of the shear test calculational settings, and the RBC’s deformation state under stable shear stress. In reality, RBCs will be subjected to multi-directional stress, and the flow characteristics are more complex. Scalarization is the most commonly used method in hemolysis analysis, so we adopted scalarized shear stress (
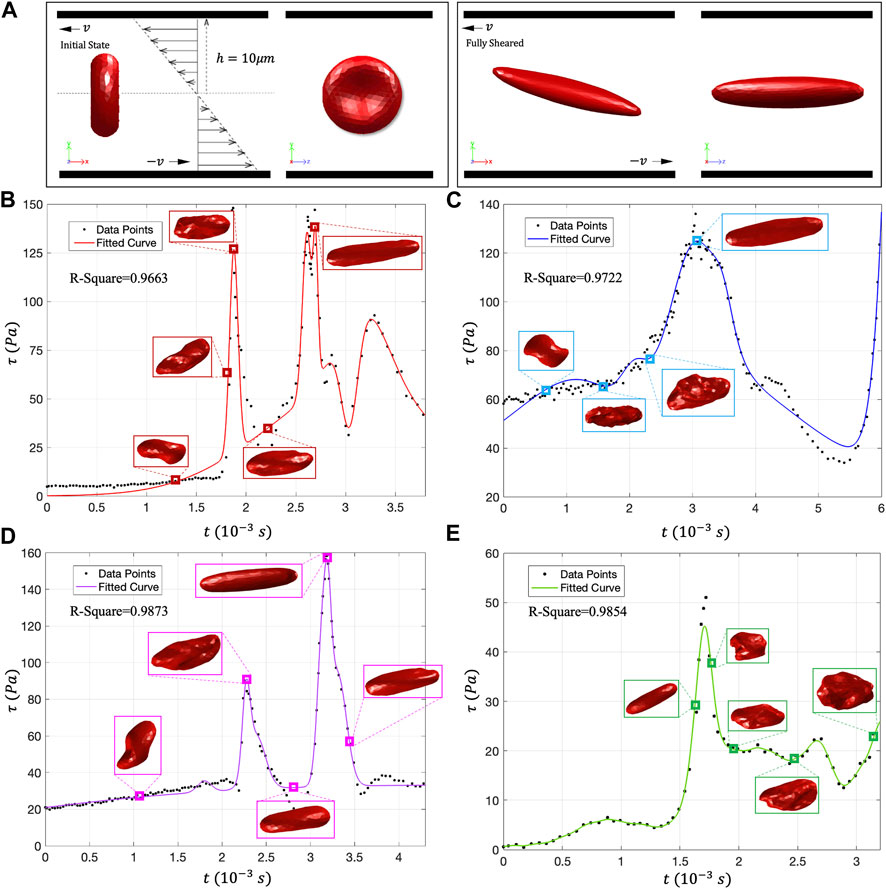
FIGURE 7. (A) DPD calculation setting and RBC shear flow test; (B–E) The movement morphology of RBCs on the four traces. Under low shear stress, the RBCs showed rolling and folding shapes. In high shear stress, almost all RBCs will evolve into tank-treading motion form and present an ellipsoidal shape.
Figures 7B–E shows the deformation state of RBCs under different
To further verify the effect of shear stress change rate (
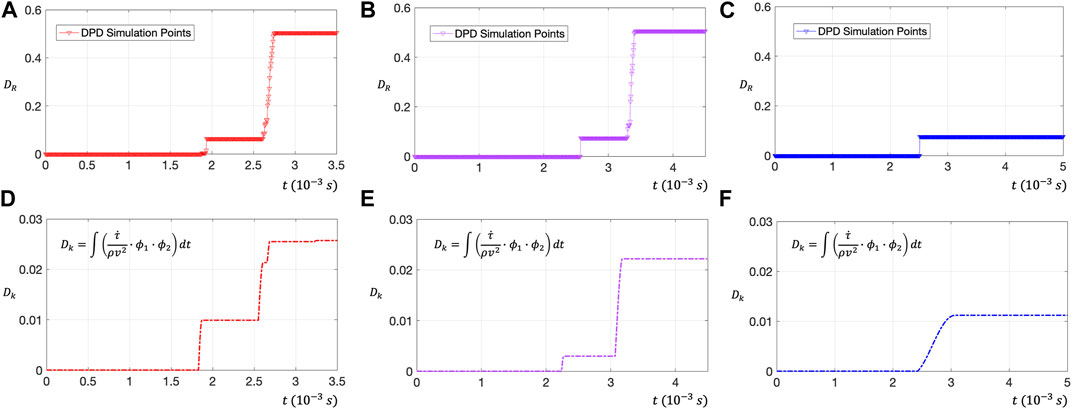
FIGURE 8. (A–C) Use DPD to evaluate the RBC membrane surface damage rate
The dimensionless number of RBC damage
Figures 8D–F shows the relationship between the dimensionless number
To analyze erythrocyte damage from Euler perspective, this section will monitor the
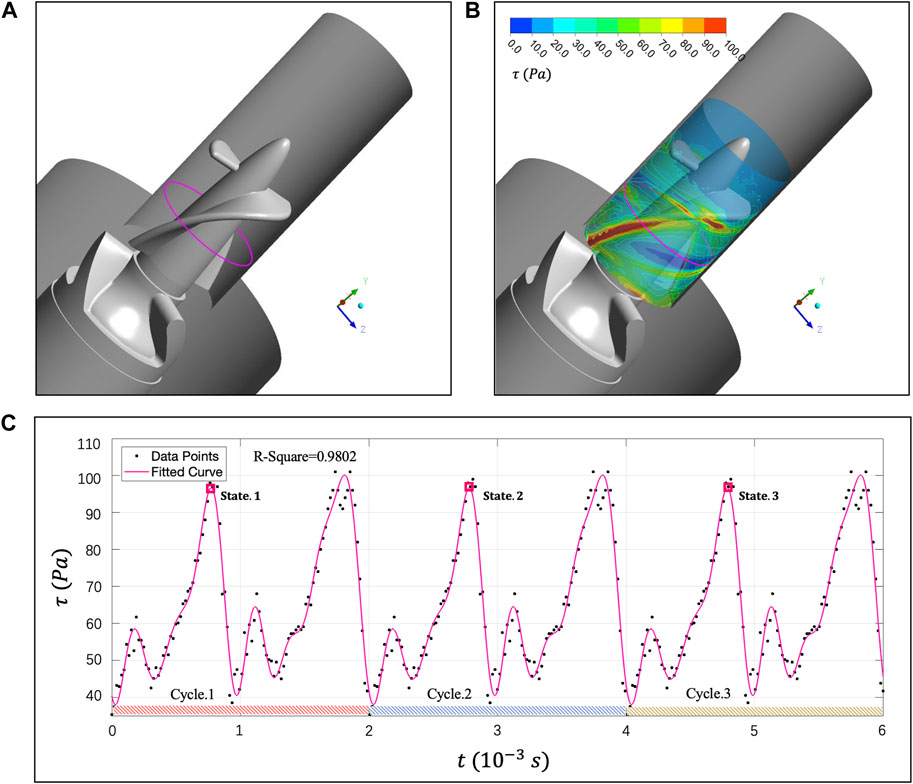
FIGURE 9. (A) Magenta curve represents the
Next, we will use tDPD to analyze the RBCs’ population morphology and 30% hematocrit whole blood hemolysis in the
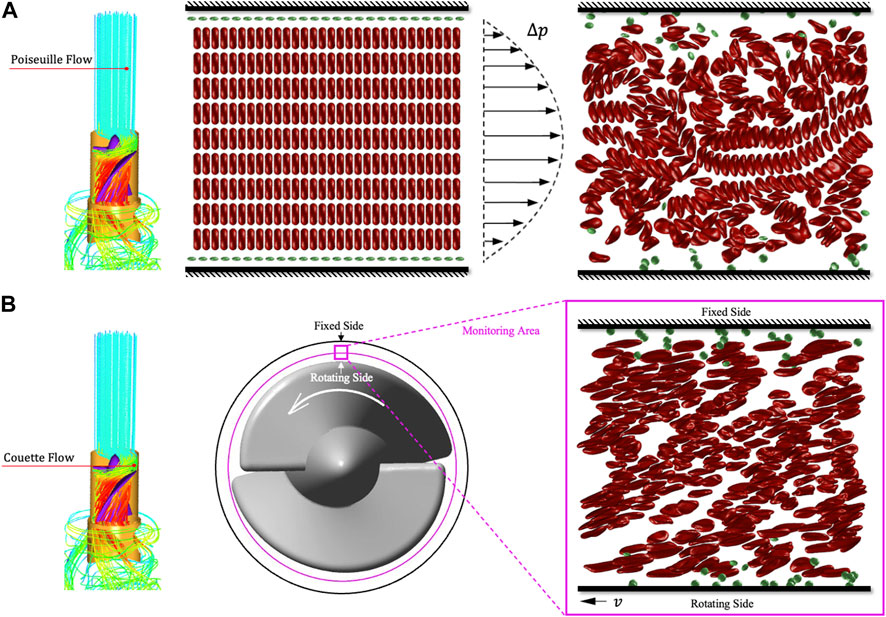
FIGURE 10. Schematic diagram of tDPD whole blood hemolysis simulation. (A) The whole blood flow in the rectification area is regarded as the Poiseuille flow driven by blood pressure. (B) The flow in the rotor area is regarded as Couette flow. Then the velocity gradient generated by the movable wall can simulate the shear stress generated by the impeller in the clearance.
We show the tDPD simulation results of the first, third and fifth peaks at the monitoring region, and the corresponding time points are marked in Figure 9C. IH calculation formula is as follows (Sohrabi and Liu, 2017):
where
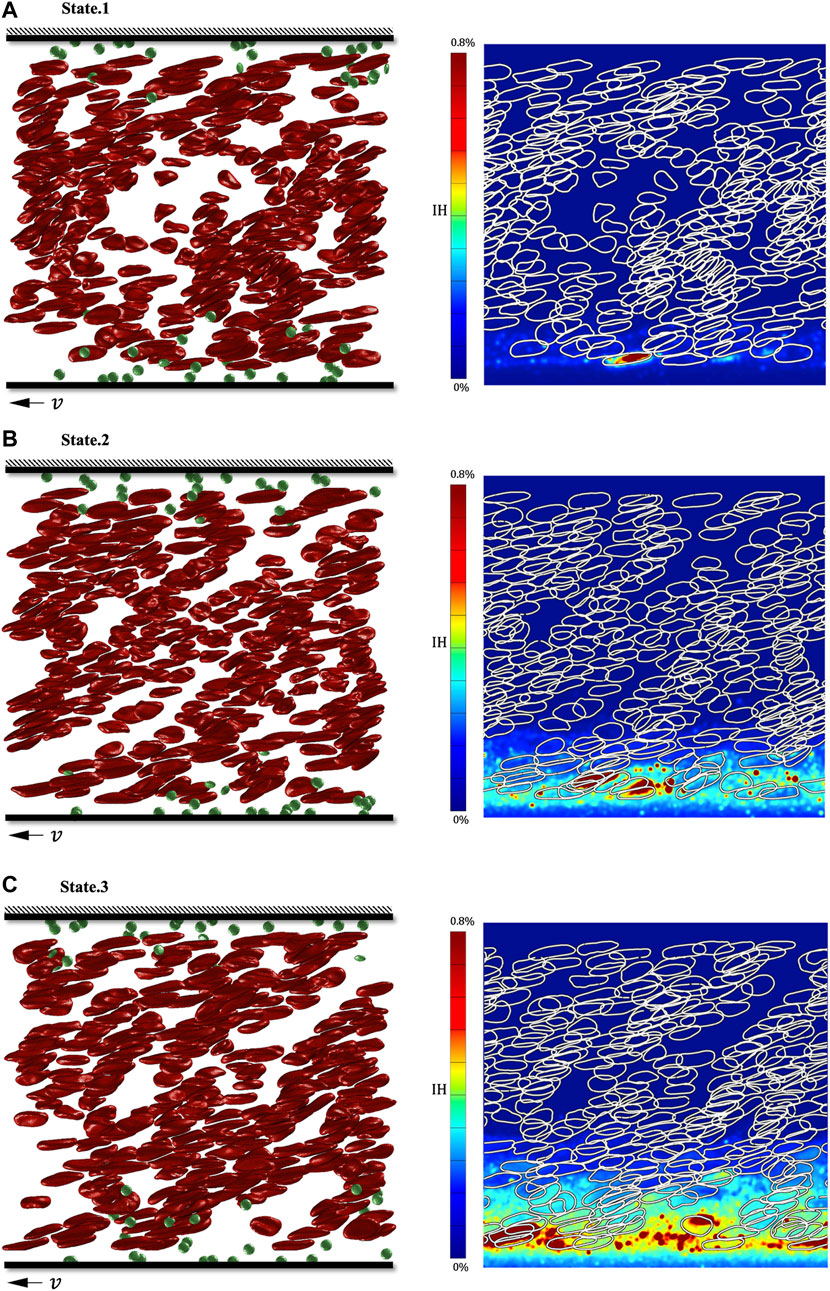
FIGURE 11. Simulation results of three shear stress peaks in the shroud clearance flow domain. (A) RBC’s deformation and hemoglobin distribution at 0.00082s; (B) RBC’s deformation and hemoglobin distribution at 0.00282s; (C) RBC’s deformation and hemoglobin distribution at 0.00482s.
Combining computational fluid dynamics (CFD) and transport dissipative particle dynamics (tDPD), this paper evaluates the hemolysis in the rotor zone of “Impella 5.0” at the macro-scale and cell-scale. Then, we analyze the damage of RBCs and whole blood from the “Lagrange perspective” and the “Euler perspective” and summarize a dimensionless number
We first used CFD to focus on the velocity and scalarized shear stress (
Then, we extracted four trace lines of the rotor region and analyzed the movement and deformation of RBCs on the four traces using the DPD method. Under low shear stress, RBCs can show various deformation states, such as rolling, folding, and multilobe. However, RBCs exposed to high shear stress for a long time will present ellipsoid-shaped, and the cell membrane will also be irreversibly damaged.
Notably, in the rotor zone of “Impella 5.0,” the change rate of scalarized shear stress
Finally, we continuously observed the
Nevertheless, there are still many unsolvable limitations in this study. 1. Considering that the viscous shear stress dominates the non-physiological shear stress in the clearance, this study simplifies the model and does not consider the role of turbulent Reynolds stress. 2. DPD method is a mesoscopic scale calculation method which cannot produce complex flow. Thus, we simplify the blood flow in the clearance and use the plane Couette flow to characterize and quantify the damage of shear stress to RBCs. 3. The hemolysis index proposed in this study is an integral formula of Lagrange’s perspective. In addition,
In addition, it is necessary to use tensors to characterize the damage of red blood cells. Currently, many scholars have obtained the relationship between red blood cell deformation and flow tensor (Faghih and Sharp, 2020), but no researchers have considered the mapping relationship between flow tensor and red blood cell damage. In future work, we need to construct a flow stress tensor based on complex flow in DPD method, then further improve mesoscale hemolysis research by combining flow tensor with blood damage models.
Multi-scale blood injury research is a huge challenge, as it is difficult to couple macroscopic hemolysis phenomena with microscopic damage to red blood cells. The RANS model used in this study is obviously not enough to characterize the Kolmogorov scale vortex that causes damage to red blood cells (Antiga and Steinman, 2009). Therefore, in future, we plan on combining the DNS method and the DPD method which may make the blood damage research more accurate.
The raw data supporting the conclusion of this article will be made available by the authors, without undue reservation.
All authors listed have made a substantial, direct, and intellectual contribution to the work and approved it for publication.
We gratefully acknowledge the Funds of the National Key R&D Program of China (Grant No. 2022YFC2402600) and National Natural Science Foundation of China (Grant No. 11972215, 12072174).
The authors declare that the research was conducted in the absence of any commercial or financial relationships that could be construed as a potential conflict of interest.
All claims expressed in this article are solely those of the authors and do not necessarily represent those of their affiliated organizations, or those of the publisher, the editors and the reviewers. Any product that may be evaluated in this article, or claim that may be made by its manufacturer, is not guaranteed or endorsed by the publisher.
Antiga, L., and Steinman, D. A. (2009). Rethinking turbulence in blood. Biorheology 46 (2), 77–81. doi:10.3233/bir-2009-0538
Arvand, A., Hormes, M., and Reul, H. (2005). A validated computational fluid dynamics model to estimate hemolysis in a rotary blood pump. Artif. Organs 29 (7), 531–540. doi:10.1111/j.1525-1594.2005.29089.x
Basil, S., Bryan, S., and Clyde, W. (2017). Heart failure and sudden cardiac death. Card. Electrophysiol. Clin. 9, 709–723. doi:10.1016/j.ccep.2017.07.010
Bludszuweit, C. (1995). Three-dimensional numerical prediction of stress loading of blood particles in a centrifugal pump. Artif. Organs 19 (7), 590–596. doi:10.1111/j.1525-1594.1995.tb02386.x
Dao, M., Lim, C. T., and Suresh, S. (2003). Mechanics of the human red blood cell deformed by optical tweezers. J. Mech. Phys. Solids 51 (11-12), 2259–2280. doi:10.1016/j.jmps.2003.09.019
De Tullio, M. D., Cristallo, A., Balaras, E., and Verzicco, R. (2009). Direct numerical simulation of the pulsatile flow through an aortic bileaflet mechanical heart valve. J. Fluid Mech. 622, 259–290. doi:10.1017/s0022112008005156
Ellis, J. T., Wick, T. M., and Yoganathan, A. P. (1998). Prosthesis-induced hemolysis: Mechanisms and quantification of shear stress. J. Heart Valve Dis. 7 (4), 376–386.
Espanol, P., and Warren, P. (1995). Statistical mechanics of dissipative particle dynamics. Europhys. Lett. 30, 191–196. doi:10.1209/0295-5075/30/4/001
Faghih, M. M., and Sharp, M. K. (2020). Deformation of human red blood cells in extensional flow through a hyperbolic contraction. Biomechanics Model. Mechanobiol. 19 (1), 251–261. doi:10.1007/s10237-019-01208-3
Fan, X., Phan-Thien, N., Chen, S., Wu, X., and Yong Ng, T. (2006). Simulating flow of DNA suspension using dissipative particle dynamics. Phys. Fluids 18 (6), 063102. doi:10.1063/1.2206595
Fedosov, D. A., Caswell, B., and Karniadakis, G. E. (2010). Systematic coarse-graining of spectrin-level red blood cell models. Comput. Methods Appl. Mech. Eng. 199 (29-32), 1937–1948. doi:10.1016/j.cma.2010.02.001
Fedosov, D. A., Dao, M., Karniadakis, G. E., and Suresh, S. (2014). Computational biorheology of human blood flow in health and disease. Ann. Biomed. Eng. 42 (2), 368–387. doi:10.1007/s10439-013-0922-3
Fedosov, D. A., Pan, W., Caswell, B., Gompper, G., and Karniadakis, G. E. (2011). Predicting human blood viscosity in silico. Proc. Natl. Acad. Sci. 108 (29), 11772–11777. doi:10.1073/pnas.1101210108
Feng, R., Xenos, M., Girdhar, G., Kang, W., Davenport, J. W., Deng, Y., et al. (2012). Viscous flow simulation in a stenosis model using discrete particle dynamics: A comparison between dpd and cfd. Biomechanics Model. Mechanobiol. 11 (1-2), 119–129. doi:10.1007/s10237-011-0297-z
Ge, L., Dasi, L. P., Sotiropoulos, F., and Yoganathan, A. P. (2008). Characterization of hemodynamic forces induced by mechanical heart valves: Reynolds vs. Viscous stresses. Ann. Biomed. Eng. 36 (2), 276–297. doi:10.1007/s10439-007-9411-x
Giersiepen, M., Wurzinger, L. J., Opitz, R., and Reul, H. (1990). Estimation of shear stress-related blood damage in heart-valve prostheses - invitro comparison of 25 aortic valves. Int. J. Artif. Organs 13 (5), 300–306. doi:10.1177/039139889001300507
Gijsen, F. J. H., van de Vosse, F. N., and Janssen, J. D. (1999). The influence of the non-Newtonian properties of blood on the flow in large arteries: Steady flow in a carotid bifurcation model. J. Biomechanics 32 (6), 601–608. doi:10.1016/s0021-9290(99)00015-9
Grigioni, M., Daniele, C., Morbiducci, U., D'Avenio, G., Di Benedetto, G., and Barbaro, V. (2004). The power-law mathematical model for blood damage prediction: Analytical developments and physical inconsistencies. Artif. Organs 28 (5), 467–475. doi:10.1111/j.1525-1594.2004.00015.x
Grigioni, M., Morbiducci, U., D’Avenio, G., Benedetto, G. D., and Gaudio, C. D. (2005). A novel formulation for blood trauma prediction by a modified power-law mathematical model. Biomechanics Model. Mechanobiol. 4 (4), 249–260. doi:10.1007/s10237-005-0005-y
Groot, R. D., and Rabone, K. L. (2001). Mesoscopic simulation of cell membrane damage, morphology change and rupture by nonionic surfactants. Biophysical J. 81 (2), 725–736. doi:10.1016/s0006-3495(01)75737-2
Groot, R. D., and Warren, P. B. (1997). Dissipative particle dynamics: Bridging the gap between atomistic and mesoscopic simulation. J. Chem. Phys. 107 (11), 4423–4435. doi:10.1063/1.474784
Hoogerbrugge, P. J., and Koelman, J. (1992). Simulating microscopic hydrodynamic phenomena with dissipative particle dynamics. Europhys. Lett. 19, 155–160. doi:10.1209/0295-5075/19/3/001
Koshiyama, K., and Wada, S. (2011). Molecular dynamics simulations of pore formation dynamics during the rupture process of a phospholipid bilayer caused by high-speed equibiaxial stretching. J. Biomechanics 44 (11), 2053–2058. doi:10.1016/j.jbiomech.2011.05.014
Lanotte, L., Mauer, J., Mendez, S., Fedosov, D. A., Fromental, J-M., Claveria, V., et al. (2016). Red cells’ dynamic morphologies govern blood shear thinning under microcirculatory flow conditions. Proc. Natl. Acad. Sci. 113 (47), 13289–13294. doi:10.1073/pnas.1608074113
Leverett, L. B., Hellums, J. D., Alfrey, C. P., and Lynch, E. C. (1972). Red blood cell damage by shear stress. Biophysical J. 12 (3), 257–273. doi:10.1016/s0006-3495(72)86085-5
Li, J., Lykotrafitis, G., Dao, M., and Suresh, S. (2007). Cytoskeletal dynamics of human erythrocyte. Proc. Natl. Acad. Sci. 104 (12), 4937–4942. doi:10.1073/pnas.0700257104
Li, Z., Yazdani, A., Tartakovsky, A., and Karniadakis, G. E. (2015). Transport dissipative particle dynamics model for mesoscopic advection-diffusion-reaction problems. J. Chem. Phys. 143 (1), 014101. doi:10.1063/1.4923254
Maraj, R., Jacobs, L. E., Ioli, A., and Kotler, M. N. (1998). Evaluation of hemolysis in patients with prosthetic heart valves. Clin. Cardiol. 21 (6), 387–392. doi:10.1002/clc.4960210604
Mehra, M. R., Uriel, N., Naka, Y., Cleveland, J. C., Yuzefpolskaya, M., Salerno, C. T., et al. (2019). A fully magnetically levitated left ventricular assist device — final report. N. Engl. J. Med. 380 (17), 1618–1627. doi:10.1056/nejmoa1900486
Olsen, D. B. (2000). The history of continuous-flow blood pumps. Artif. Organs 24 (6), 401–404. doi:10.1046/j.1525-1594.2000.06652.x
Pahuja, M., Hernandez-Montfort, J., Whitehead, E. H., Kawabori, M., and Kapur, N. K. (2021). Device profile of the Impella 5.0 and 5.5 system for mechanical circulatory support for patients with cardiogenic shock: Overview of its safety and efficacy. Expert Rev. Med. Devices 19, 1–10. doi:10.1080/17434440.2022.2015323
Pan, W., Caswell, B., and Karniadakis, G. E. (2010). A low-dimensional model for the red blood cell. Soft Matter 6 (18), 4366. doi:10.1039/c0sm00183j
Sohrabi, S., and Liu, Y. (2017). A cellular model of shear-induced hemolysis. Artif. Organs 41 (9), E80–E91. doi:10.1111/aor.12832
Song, X. W., Throckmorton, A. L., Wood, H. G., Antaki, J. F., and Olsen, D. B. (2003). Computational fluid dynamics prediction of blood damage in a centrifugal pump. Artif. Organs 27 (10), 938–941. doi:10.1046/j.1525-1594.2003.00026.x
Wu, X., Zhang, X. W., Hao, P. F., and He, F. (2019). Comparison of three control strategies for axial blood pump. J. Mech. Med. Biol. 19 (6), 1950058. doi:10.1142/s0219519419500581
Xu, Z., Wang, C., He, F., Hao, P., and Zhang, X. (2023). Coarse-grained model of whole blood hemolysisand morphological analysis of erythrocytepopulation under non-physiological shear stressflow environment. Phys. Fluids 35 (3), 031901. doi:10.1063/5.0137517
Xu, Z., Wang, C., Xue, S., He, F., Hao, P., and Zhang, X. (2022). The erythrocyte destruction mechanism in non-physiological shear mechanical hemolysis. Phys. Fluids 34 (11), 111901. doi:10.1063/5.0112967
Yano, T., Sekine, K., Mitoh, A., Mitamura, Y., Okamoto, E., Kim, D. W., et al. (2003). An estimation method of hemolysis within an axial flow blood pump by computational fluid dynamics analysis. Artif. Organs 27 (10), 920–925. doi:10.1046/j.1525-1594.2003.00034.x
Yazdani, A., Deng, Y., Li, H., Javadi, E., Li, Z., Jamali, S., et al. (2021). Integrating blood cell mechanics, platelet adhesive dynamics and coagulation cascade for modelling thrombus formation in normal and diabetic blood. J. R. Soc. Interface 18 (175), 20200834. doi:10.1098/rsif.2020.0834
Yazdani, A., and Karniadakis, G. E. (2016). Sub-cellular modeling of platelet transport in blood flow through microchannels with constriction. Soft Matter 12 (19), 4339–4351. doi:10.1039/c6sm00154h
Ye, T., Shi, H., Phan-Thien, N., and Lim, C. T. (2020). The Key events of thrombus formation: Platelet adhesion and aggregation. Biomechanics Model. Mechanobiol. 19 (3), 943–955. doi:10.1007/s10237-019-01262-x
Zhang, T., Taskin, M. E., Fang, H-B., Pampori, A., Jarvik, R., Griffith, B. P., et al. (2011). Study of flow-induced hemolysis using novel Couette-type blood-shearing devices. Artif. Organs 35 (12), 1180–1186. doi:10.1111/j.1525-1594.2011.01243.x
Keywords: ventricular assist devices, cell-scale hemolysis simulation, dissipative particle dynamics, erythrocyte damage model, erythrocyte motion form
Citation: Xu Z, Chen C, Hao P, He F and Zhang X (2023) Cell-scale hemolysis evaluation of intervenient ventricular assist device based on dissipative particle dynamics. Front. Physiol. 14:1181423. doi: 10.3389/fphys.2023.1181423
Received: 07 March 2023; Accepted: 26 June 2023;
Published: 05 July 2023.
Edited by:
Brent A. Craven, United States Food and Drug Administration, United StatesReviewed by:
Nicolas Tobin, The Pennsylvania State University (PSU), United StatesCopyright © 2023 Xu, Chen, Hao, He and Zhang. This is an open-access article distributed under the terms of the Creative Commons Attribution License (CC BY). The use, distribution or reproduction in other forums is permitted, provided the original author(s) and the copyright owner(s) are credited and that the original publication in this journal is cited, in accordance with accepted academic practice. No use, distribution or reproduction is permitted which does not comply with these terms.
*Correspondence: Xiwen Zhang, emhhbmd4aXdAdHNpbmdodWEuZWR1LmNu
Disclaimer: All claims expressed in this article are solely those of the authors and do not necessarily represent those of their affiliated organizations, or those of the publisher, the editors and the reviewers. Any product that may be evaluated in this article or claim that may be made by its manufacturer is not guaranteed or endorsed by the publisher.
Research integrity at Frontiers
Learn more about the work of our research integrity team to safeguard the quality of each article we publish.