
95% of researchers rate our articles as excellent or good
Learn more about the work of our research integrity team to safeguard the quality of each article we publish.
Find out more
ORIGINAL RESEARCH article
Front. Physiol. , 07 March 2023
Sec. Exercise Physiology
Volume 14 - 2023 | https://doi.org/10.3389/fphys.2023.1159668
This article is part of the Research Topic Biomechanical Performance and Relevant Mechanism of Physical Medicine and Rehabilitation for Neuromusculoskeletal Disorders View all 32 articles
 Zixiang Gao1,2,3
 Yining Zhu4Yufei Fang1
 Gusztáv Fekete3András Kovács2
 Julien S. Baker5
 Minjun Liang1,6*
 Yaodong Gu1*
Introduction: The purpose of this study was to evaluate the effect of running-induced fatigue on the characteristic asymmetry of running gait and to identify non-linear differences in bilateral lower limbs and fatigued gait by building a machine learning model.
Methods: Data on bilateral lower limb three-dimensional ground reaction forces were collected from 14 male amateur runners before and after a running-induced fatigue experiment. The symmetry function (SF) was used to assess the degree of symmetry of running gait. Statistical parameter mapping (Paired sample T-test) algorithm was used to examine bilateral lower limb differences and asymmetry changes pre- and post-fatigue of time series data. The support vector ma-chine (SVM) algorithm was used to recognize the gait characteristics of both lower limbs before and after fatigue and to build the optimal algorithm model by setting different kernel functions.
Results: The results showed that the ground reaction forces were asymmetrical (SF > 0.5) both pre-and post-fatigue and mainly concentrated in the medial-lateral direction. The asymmetry of the medial-lateral direction increased significantly after fatigue (p < 0.05). In addition, we concluded that the polynomial kernel function could make the SVM model the most accurate in classifying left and right gait features (accuracy of 85.3%, 82.4%, and 82.4% in medial-lateral, anterior-posterior and vertical directions, respectively). Gaussian radial basis kernel function was the optimal kernel function of the SVM algorithm model for fatigue gait recognition in the medial-lateral and vertical directions (accuracy of 54.2% and 62.5%, respectively). Moreover, polynomial was the optimal kernel function of the anterior-posterior di-rection (accuracy = 54.2%).
Discussion: We proved in this study that the SVM algorithm model depicted good performance in identifying asymmetric and fatigue gaits. These findings can provide implications for running injury prevention, movement monitoring, and gait assessment.
Running biomechanics has received widespread attention from runners, coaches and researchers for the past 30 years (Furlong and Egginton, 2018; Gao, 2022; Xu et al., 2022). Typically, the mean value of bilateral variables (Winter, 1984; Grabowski and Kram, 2008) or the default complete symmetry of both limbs (Kyröläinen et al., 2005; Gao et al., 2020c) was widely used in running biomechanical research. Bilateral limb asymmetry is not considered in these studies since complete symmetry of gait is assumed. Although these methods mentioned above can describe the motion well, it also ignores the false claims and misleading interpretations caused by the asymmetry of bilateral variables (Beck et al., 2018). Neuromuscular asymmetry is a widespread phenomenon occurred in functional tasks (Radzak et al., 2017). Few previous studies have considered that the biomechanical asymmetry of running gait (Beck et al., 2018; Gao et al., 2020b; Mastalerz, 2021), even though this phenomenon is common among healthy people (Furlong and Egginton, 2018; Gao et al., 2020c). Quantitative gait characteristics (e.g., parameters of time and parameters of space) and qualitative gait characteristics (e.g., gait variability and gait asymmetry) are related to running-related injuries, especially among amateur runners (Nakayama et al., 2010; García-Pinillos et al., 2020). Similarly, the effects of gait asymmetry are also an important consideration for motor performance (Simoni et al., 2021). Previous studies have shown that a 10% increase in asymmetry of vertical ground reaction force (GRF) leads to a 3.5% increase in net metabolic power during running (Beck et al., 2018). Another finding was that increased foot contact time asymmetry was associated with increased metabolic costs of running (Beck et al., 2018). Zifchock et al. (2006) found that the asymmetry was 49.8% and 37.5% at the running speed of 3.65 m/s by evaluating the peak lateral and medial GRF of bilateral lower limbs in the running process of healthy individuals, similarly by Williams et al. (1987) reported that 13.8% and 20.2% asymmetry of peak lateral and medial GRF at the speed of 5.36 m/s, suggesting that greater symmetry is associated with faster running speeds. The same conclusion regarding walking gait was reported by previous study (Goble et al., 2003).
Bilateral limb asymmetry may not be evident during the initial stages of running but may arise as muscle fatigue and/or exercise intensity changes (Arampatzis et al., 1999; Xiang et al., 2022a). Mizrahi et al. (2000) demonstrated that running-induced lower limb muscle fatigue increases the tibia’s vertical acceleration during heel strike, suggesting that more load accumulates in the shank after running fatigued. Research by Mastalerz (2021) reported that the asymmetry of muscle activity on bilateral limbs was increased with the occurrence of running fatigue, suggesting that bilateral lower extremity muscles have different fatigue resistance. Typically, fatigue in the lower limb muscles reduces the cushioning effect of the muscles on the joint load. Therefore, the joint load tends to focus on one limb during running-induced fatigue, and the risk of unilateral lower limb injury increases (Furlong and Egginton, 2018). Radzak and colleagues (Radzak et al., 2017) found an increase in knee stiffness and internal rotation angle asymmetry after performing a running-induced fatigue test. In addition, a recent systematic review of the relationship between fatigue and symmetry shows that the effect of running fatigue on bilateral lower limb symmetry is not apparent, and the reasons may be related to experimental design, quantitative indicators, and test protocol (Heil et al., 2020). Running-induced fatigue may cause subtle or worsening existing gait asymmetry (Gao et al., 2020a). The assessment of bilateral limb asymmetry in functional movement is an essential measure of injury prediction and screening (Kiesel et al., 2007). In addition, a recent study demonstrates that reduced asymmetry in vertical impact peaks was associated with running injuries (Ceyssens et al., 2019). Therefore, a further factor that contributes to damage during long-distant running tasks is the presence of asymmetry (Gao et al., 2022b). It is particularly important to properly evaluate the effects exercise-induced fatigue on interlimb asymmetry to understand the underlying mechanisms of non-contact injury and improve exercise efficiency (Smeets et al., 2019).
The evaluation approaches of running gait symmetry have been widely utilized in biomechanical studies in past decades (Zifchock et al., 2006; Nigg et al., 2013; Radzak et al., 2017). Typically, the traditional classification theory of symmetry, such as symmetry index (SI) (Herzog et al., 1989) and symmetry angle (SA), was based on discrete variables like the mean peak GRF (Viteckova et al., 2018). However, the time-series information may be lost in the evaluation process of continuous data, such as a complete period of gait stance (Tabor et al., 2021). Therefore, symmetry function (SF), a novel symmetry checking method, was proposed by Nigg to evaluate continuous data with time dimensions (Nigg et al., 2013). Moreover, linear principal component analysis (PCA) has been used in the previous study to extract the gait characteristics of bilateral lower limbs and examine the degree of gait symmetry (Sadeghi, 2003). However, the limitation of SF and PCA is that only linear features of gait can be extracted, which reduces the model’s sensitivity in evaluating the non-linear features of time series parameters (Chau, 2001). The previous study demonstrated that the support vector machine (SVM) has a high generalization ability for dichotomous data (Figueiredo et al., 2018). The optimal separating hyperplane was created by maximizes the distance of separation in SVM model (Figueiredo et al., 2018). Moreover, it can transform the matrix into a higher dimensional space for classification by setting the different types of kernel functions (Figueiredo et al., 2018; Zhang et al., 2023). SVM algorithms was widely used in gait patterns recognition, such as differences of young and elderly populations (Eskofier et al., 2013), competitive and recreational runners (Clermont et al., 2017), barefoot and shod populations (Gao et al., 2022a). Given the gait differences caused by running fatigue, there is still a lack of understanding of the gait characteristics of dominant and non-dominant limbs and how these differences are attributed to limb injury prevention and function performance. Furthermore, the automatic detection of asymmetric gait and fatigue gait was lacking in the previous studies. Consequently, the SVM based on the structural risk minimization principle, were adopted to evaluate bilateral lower limb non-linear differences in this study (Chau, 2001).
This study aims to examine the asymmetry changes of bilateral gait characteristics before and after running fatigue and to develop a SVM machine learning model for asymmetry and fatigue gait recognition. It was hypothesized that the GRFs on both sides are asymmetrical, increasing with fatigue intervention. The second hypothesis is that non-linear kernels perform better than linear kernels for SVM models that recognize asymmetric and fatigue gaits.
This study recruited fourteen male amateur runners who ran at least twice a week for less than 45 min or less than 10 km. The demographic information is given in Table 1. All subjects were asked to complete a questionnaire to determine whether the right limb was the dominant limb (the ball kicking leg) and had not suffered any lower limb or pelvic injuries in the previous 6 months. In addition, individuals with a history of lower extremity surgery were also excluded. The subjects have agreed in writing all the experiment contents, and the Ethics Committee of Ningbo University has approved this test protocol.
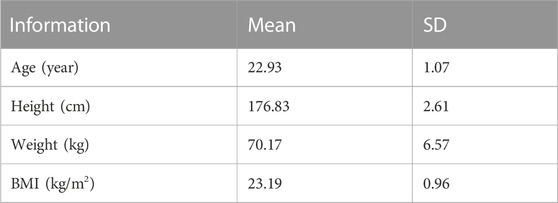
TABLE 1. Descriptive characteristics of 14 participants.
Before this experiment, subjects were fully familiarized with the environment and processed a 10-min treadmill warm-up. The complete experiment was divided into three parts: data collection of GRFs of bilateral lower limbs before running fatigue, running-induced fatigue experiment (on the treadmill), and collection of the GRFs of bilateral lower limbs after running fatigue, as shown in Figure 1. The same acquisition process was applied with two GRF data collection experiences (pre- and post-fatigued).
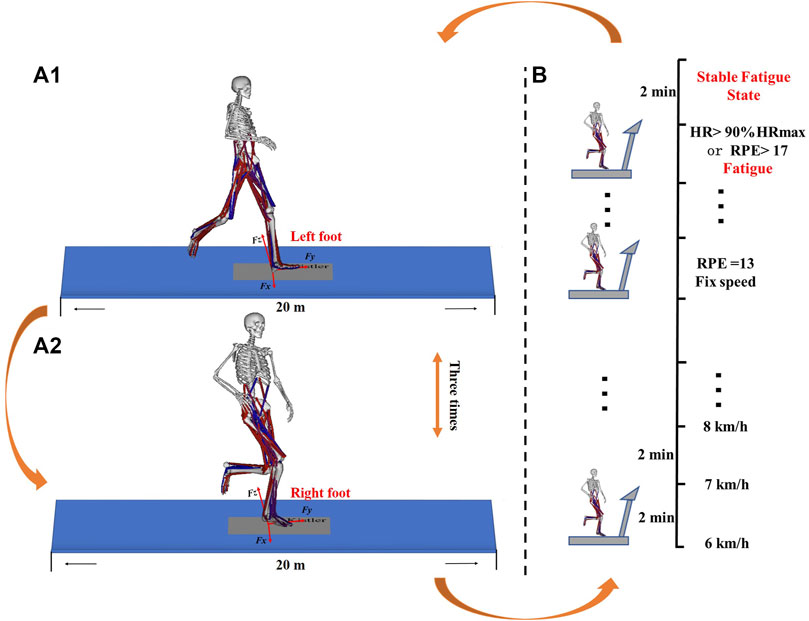
FIGURE 1. Bilateral data collection execution process. (A1) Right GRF data collection process. (A2) Left GRF data collection process. (B) Running-induced Fatigue Protocol Test implementation process.
As shown in Figure 1A1, a 3-dimensions force measuring plate (Sampling rate: 1,000 Hz) was embedded on a 20-m runway (Kistler, Winterthur, Switzerland). The force measuring plate was calibrated before each subject performed the test task. The participants determine the optimal distance from the force plate by familiarizing runway to increase the likelihood of effective contact between bilateral feet and the force plate during the runway trials. Whereafter, participants were instructed to run across a runway at a comfortable speed after familiarization and practices on the runway. During testing, the right foot didn’t land in the middle of the plate and the participants has active aiming force plate behavior were excluded (Figure 1A1). After a successful running trial has been performed, the same running mode was replaced with the left foot. until the three successful GRF data of the left and right sides were respectively collected (Figure 1A2). The second step was to implement the Running-induced Fatigue Protocol Test developed by Koblbauer and their colleagues (Koblbauer et al., 2014). The specific execution procedures have been reported in the previous study (Koblbauer et al., 2014). As shown in Figure 1A2, Heart rate (Polar RS100, Polar Electro Oy, Woodbury, NY, USA) and RPE (Ratings of Perceived Exertion, RPE, 6–20 Borg’s scale) were collected every 2 min throughout the procedure. The running speed increases by 1 km/h every 2 min until RPE = 13. Continue running at a fixed speed for 2 min after fatigue (HR>90%HRmax or RPE>17, HRmax = 200-age) (Gao et al., 2020a). The GRF data collection process was repeated until three successful data were collected on the left and right sides after the running-induced fatigue protocol test (Figure 1A1).
GRF time series data of one support period were determined by vertical GRF = 30 N as the heel initial contact and toe-off phases (Quan et al., 2021). The GRF data of the time series were normalized to 101 frames by Cubic B-spline interpolation or extrapolation function in MATLAB (Version: R2019a, The MathWorks, Natick, MA, United States). All GRF data were standardized by individual body weight (GRF (BW) is equal to GRF divided by 10 times the body weight of the individual).
SF developed by Nigg and colleagues (Nigg et al., 2013) has high robustness for quantifying the symmetry of time series data, which can effectively avoid the data loss caused by the symmetry evaluation of discrete data. The symmetry time-varying information of 101-time points in SF can reflect the supporting stage of gait (Eq. 1). The degree of asymmetry is positively correlated with the value of SF, where the closer SF is to 0, the more symmetric the parameters are (Eq. 2). ±5% was set as an asymmetric threshold in the evaluation of this study (Winiarski et al., 2021).
Where
SVM is a machine learning algorithm that realizes data dichotomy through case learning (Teufl et al., 2019). It has been widely used in biology and medicine (Noble, 2006). Such as the automatic classification of DNA sequences, gene expression profiles from tumor samples or peripheral fluids, microarray expression profiles, and mass spectrometry (Golub et al., 1999). Compared with other machine learning algorithms, such as neural networks, the SVM algorithm based on supervised learning has better robustness and generalization for gait symmetry analysis (Wu and Wu, 2015). In this study, six SVM models were constructed to evaluate the characteristic differences of GRF in the medial-lateral (X), anterior-posterior (Y) and vertical (Z) directions of left and right feet and before and after fatigue. Among them, the left GRF and SF of Pre-fatigue belong to feature 1 (X, Y, and Z directions, respectively). The right GRF and SF of Post-fatigued belong to feature 2 (X, Y, and Z directions, respectively). Optimal symmetric gait and fatigue gait recognition model by adjusting the non-linear kernel function. The kernel function
The difference of non-linear gait features between dominant and non-dominant limbs was identified by the SVM algorithm in MATLAB (Version: R2019a, The MathWorks, Natick, MA, United States). The first step is to map the non-linear function
Where each raw output quantity is defined as
In the training set data, two gait pattern data are mapped to the corresponding class flag space
where b and
In this study, the accuracy of the SVM model was evaluated by the five-fold cross-validation method (Begg and Kamruzzaman, 2005). The optimal machine learning model was determined based on different kernel function types and parameters by adjustment. The following three commonly used kernel function types were selected to evaluate the generalization ability of the SVM model in this study.
Linear kernel function (LINEAR) is shown in Eq. 9:
Gaussian radial basis kernel function (RBF) is shown in Eq. 10:
The polynomial kernel function (POLY) is shown in Eq. 11:
where the d is defined as the order of the POLY.
Classification Accuracy (ACC), Sensitivity (SEN), and Specificity percentage (SEP) are used to evaluate the performance of classification machine learning models (Begg and Kamruzzaman, 2005). Thereinto, Ac (12) was used to evaluate the model’s ability to strive for recognition of the two features. Se (13) and Sp (14) were used to evaluate the model’s ability to correctly identify the first feature and the second feature, respectively.
where, T1 and T2 are the correct recognition formats of feature 1 and feature 2 by the SVM model, and F1 and F2 are the number of feature 1 and feature 2 incorrectly recognized by the SVM model, respectively.
In this study, The Shapiro-Wilks test was used to verify the normality of the data prior to statistical analysis. SF was used to evaluate the symmetry degree of bilateral GRF, and the paired sample T-test in the statistical Parameter Mapping (SPM) algorithm was used as the different test of bilateral gait characteristics. In addition, the paired sample T-test in SPM was also used to check SF of GRF changes in X, Y, and Z directions before and after fatigue in MATLAB (Version: R2019a, The MathWorks, Natick, MA, United States). The significance level was set to 0.05.
There are asymmetries in all three directions before Running-induced Fatigue Protocol Test, as shown in Figure 2. Specifically, the SF of GRFx rise steadily until the peak value of 1.2 at 3%–40% of the gait stance phase, and then it declines to 0.05 at 95% of the gait stance phase. In addition, the SPM results showed that the non-dominant limb appears to have greater medial direction force on 7%–10% (p = 0.010, t = 3.515) and 58%–90% of the gait stance phase (p < 0.001, t = 3.515). In addition, the SF of GRFy and GRFz were more than 0.05 in 3%–85% and 4%–80% of the gait stance phase, respectively.
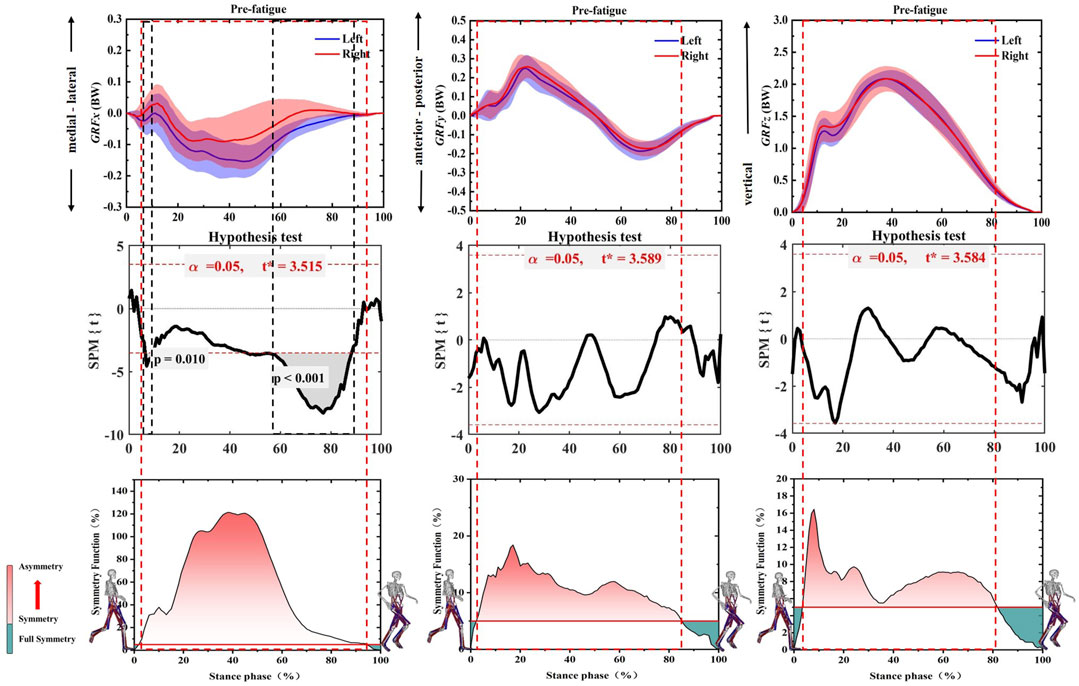
FIGURE 2. Illustration of SF degree and SPM test of GRFx, GRFy, and GRFz during the whole gait stance phase before Running-induced Fatigue Protocol Test. Note: The red dotted boxes represent asymmetrical degrees. The black dotted boxes represent a significant difference (p < 0.05). The red fill represents the degree of asymmetry, and the darker the color, the more asymmetry. The green fill represents full symmetry. GRFx: medial-lateral direction of GRF, GRFy: anterior-posterior direction of GRF, GRFz: vertical direction of GRF.
As shown in Figure 3, asymmetry of GRFx, GRFy, and GRFz was observed on both sides after the Running-induced Fatigue Protocol Test. The SF of GRFx exceeded 1.0 in 30%–55% of the gait stance phase. the SPM results showed that the left GRFx exhibited greater medial force on 8%–9% (p = 0.045, t = 3.545), 10%–12% (p = 0.042, t = 3.545), and 50%–60% (p < 0.001, t = 3.545) of the gait stance phase. Moreover, the SF of GRFy and GRFz were more than 0.05 in 3%–80% and 5%–79% of the gait stance phase, respectively.
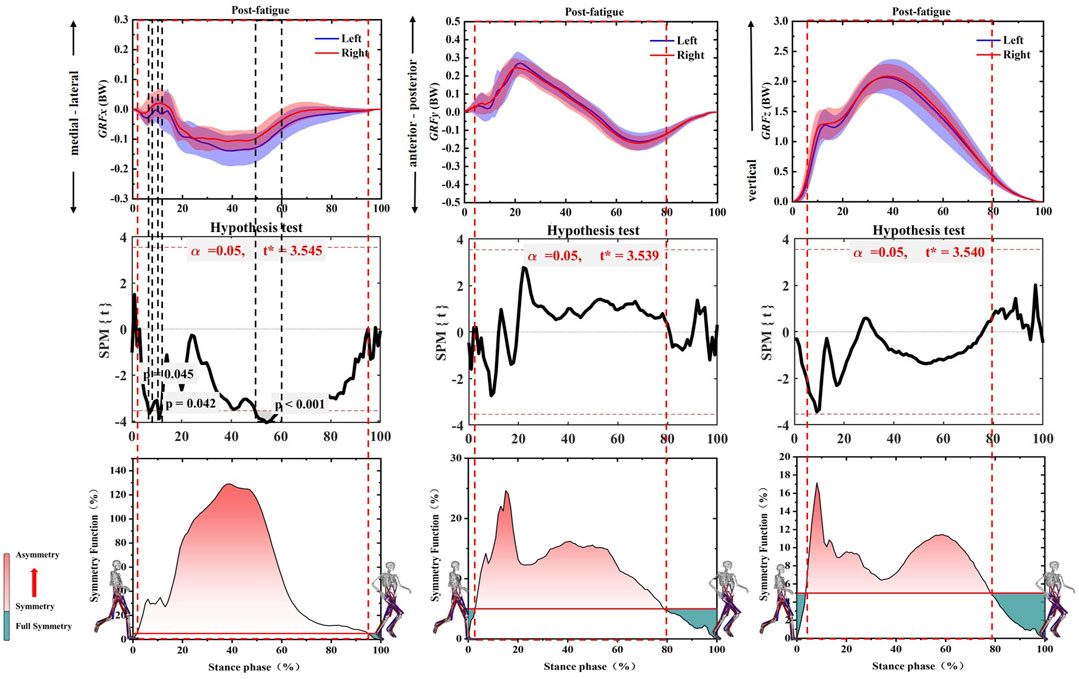
FIGURE 3. Illustration of SF degree and SPM test of GRFx, GRFy, and GRFz during the whole gait stance phase after Running-induced Fatigue Protocol Test. Note: The red dotted boxes represent asymmetrical intervals. The black dotted boxes represent a Significant difference. The red fill represents the degree of asymmetry, and the darker the color, the more asymmetry. The green fill represents full symmetry. GRFx: medial-lateral direction of GRF, GRFy: anterior-posterior direction of GRF, GRFz: vertical direction of GRF.
According to the SPM inspection results (Figure 4), Only SF of GRFx changed significantly after the Running-induced Fatigue Protocol Test. SF of post-fatigued was significantly higher than that pre-fatigue at 86%–88% (p = 0.012, t = 3.592) and 90%–92% (p = 0.047, t = 3.592) of the gait stance phase. GRFy and GRFz did not change significantly after the Running-induced Fatigue Protocol Test.
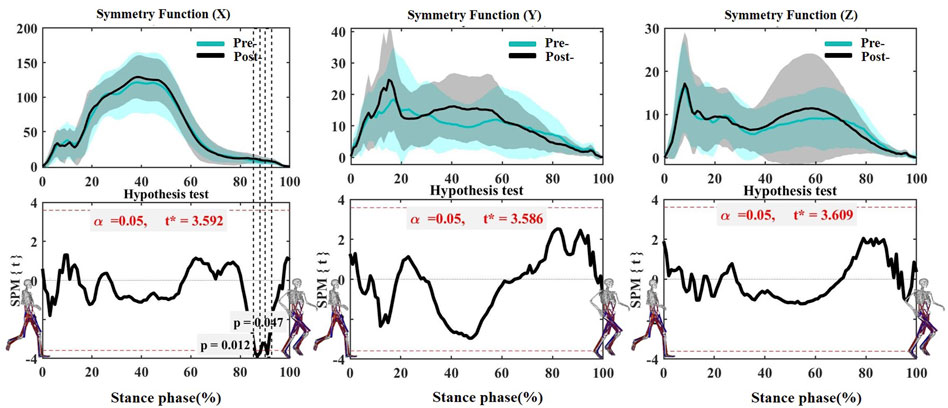
FIGURE 4. Comparing the mean values of SF of GRFx, GRFy, and GRFz from all participants between Pre-fatigue and Post-fatigue. Note: Pre-is Pre-fatigue, and Post-is Post-fatigue. The black dotted boxes represent a significant difference (p < 0.05). GRFx: medial-lateral direction of GRF, GRFy: anterior-posterior direction of GRF, GRFz: vertical direction of GRF.
It can be seen from Table 2 that the optimal kernel functions of SVM models of GRFx, GRFy, and GRFz are all POLY. ACC, SEN, and SEP of the SVM model of GRFx were achieved at 85.3%, 84.2%, and 93.3%, respectively. Through model cross-validation, best C, Best G, and CVAcc are 33.506, 0.036, and 0.836, respectively. The prediction accuracy of the test set of GRFx reached 85.294%, as shown in Table 2 and Figure 5. In addition, ACC, SEN, and SEP of GRFy SVM model were achieved at 82.4%, 76.2%, and 92.3%, respectively. The prediction accuracy of the test set of GRFy reached 82.35%, as shown in Figure 4. Through model cross-validation of the SVM model of GRFy, the Best C, Best G, and CVAcc are 3.605, 0.113, and 0.821, respectively. Moreover, the SVM Model of GRFz showed 82.35% prediction accuracy for the test set (Figure 4). ACC, SEN, and SEP of the SVM model of GRFz were achieved at 82.4%, 86.7%, and 78.9%, respectively, and the Best C, Best G, and CVAcc are 14.929, 0.069, and 0.784, respectively.
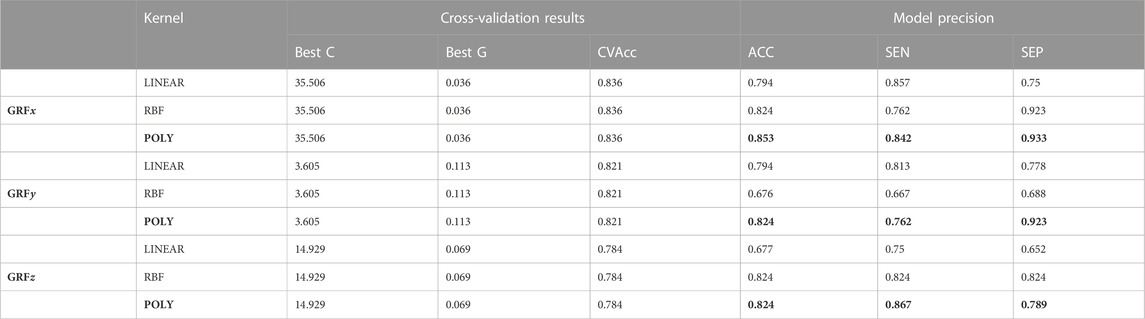
TABLE 2. Comparison of results from the different SVM classification algorithms designed for SVM models of GRFx, GRFy, and GRFz. Note: The best kernel type is highlighted in bold. GRFx: medial-lateral direction of GRF, GRFy: anterior-posterior direction of GRF, GRFz: vertical direction of GRF.
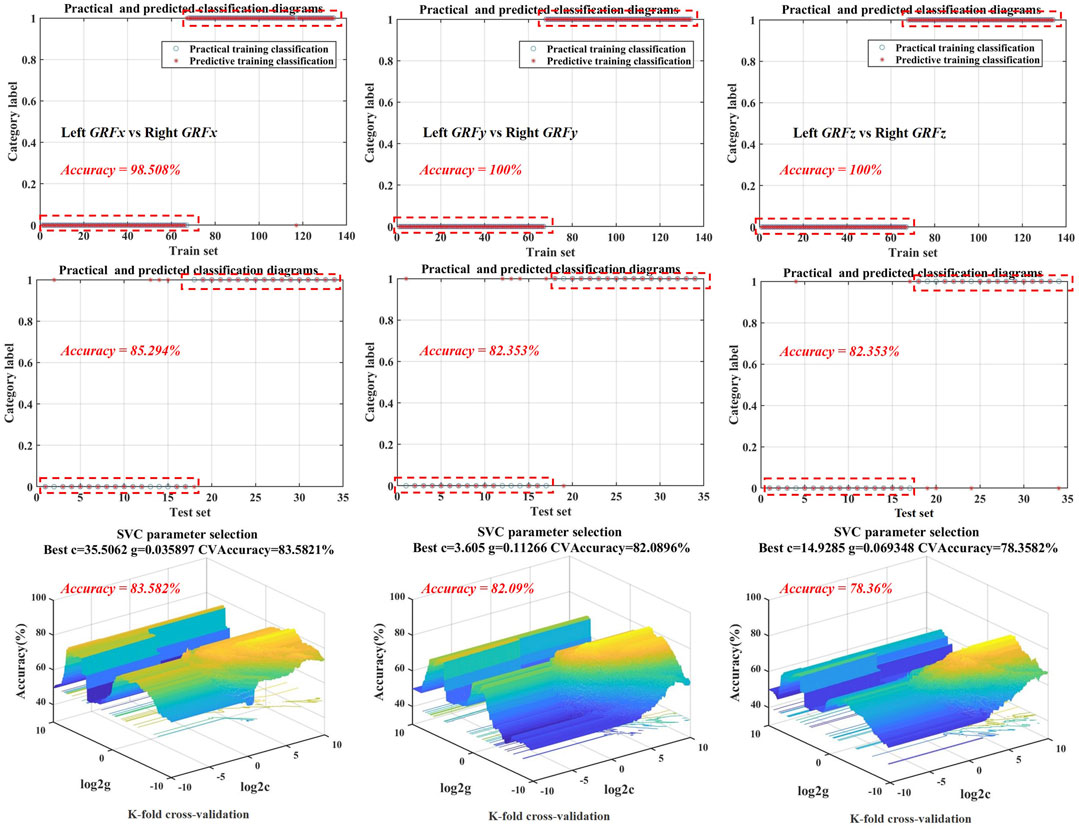
FIGURE 5. The training set, test set, and cross-validation model accuracy visualization are based on optimal kernel function selection for SVM models of GRFx, GRFy, and GRFz. GRFx: medial-lateral direction of GRF, GRFy: anterior-posterior direction of GRF, GRFz: vertical direction of GRF.
It can be seen from Table 3 that the optimal kernel functions of SVM models of SFx, SFz are POLY, and the optimal kernel function of SFy is POLY. ACC, SEN, and SEP of the SVM model of SFx were achieved at 62.5%, 66.7%, and 60%, respectively. Through model cross-validation, Best C, Best G, and CVAcc are 1.569, 0.043, and 0.75, respectively. The prediction accuracy of test set reached 62.5%, as shown in Table 3 and Figure 5. In addition, ACC, SEN, and SEP SVM models of SFy were achieved 54.2%, 100%, and 52.2%, respectively. In addition, the prediction accuracy of the test set reached 54.167%, as shown in Figure 5. Through model cross-validation of the SVM model of SFy, the Best C, Best G, and CVAcc are 20.393, 0.002, and 0.633, respectively. Moreover, the SVM model of SFz showed 62.5% prediction accuracy of the test set (Figure 4). ACC, SEN, and SEP of SVM model of SFz were achieved 62.5%, 74%, and 53%, respectively, and the Best C, Best G, and CVAcc are 0.001, 9.514, and 0.617, respectively.
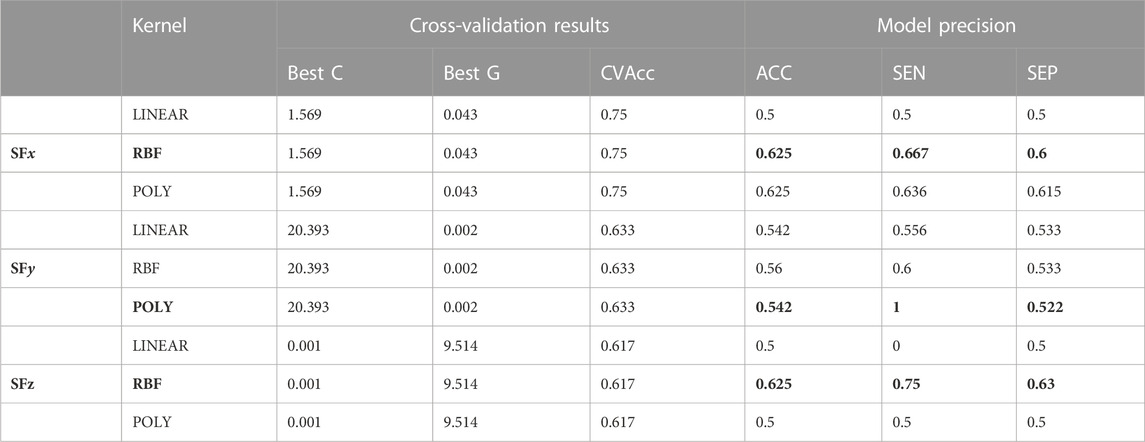
TABLE 3. Comparison of results from the different SVM classification algorithms designed for SVM models of SFx, SFy, and SFz before and after the Running-induced Fatigue Protocol Test. Note: The best kernel type is highlighted in bold, SFx: medial-lateral direction of SF, SFy: anterior-posterior direction of SF, SFz: vertical direction of SF.
This study aimed to examine the effect of running fatigue on bilateral GRF symmetry and develop SVM models to realize asymmetric gait and fatigue gait automated recognition. We found that GRF of bilateral lower limbs was asymmetric in all three directions (medial-lateral, anterior-posterior and vertical) at pre-fatigue states, especially a significantly worsened of asymmetry with the occurrence of running fatigue in the medial-lateral direction. In addition, the SVM model with POLY kernel has demonstrated to have higher accuracy for feature extraction of symmetric gait, while the SVM model with RBF kernel has higher accuracy for fatigue gait automated recognition in anterior-posterior and vertical directions. Furthermore, the POLY kernel had highlighted to have relatively higher accuracy for fatigue gait recognition in the vertical direction. In general, the results of this study are consistent with the previous hypotheses.
Gait asymmetry in healthy individuals may be related to the functional attributes of bilateral limbs (Sadeghi et al., 2000; Pan et al., 2023). Previous study have emphasized that the dominant limb usually plays a gait propulsion role while opposing limbs contribute to gait support and control (Sadeghi et al., 2000). The dominant limb during the gait cycle was associated with more power generation, which was mainly reflected in the positive anterior-posterior GRF impulse (Seeley et al., 2008). Therefore, the non-dominant limb is subjected to significant negative anterior-posterior GRF impulse (Potdevin et al., 2008). Interestingly, this study found statistical differences in medial-lateral direction of GRF during the push-off phase before the fatigue intervention, suggesting the neuromuscular control asymmetry in healthy individuals (Radzak et al., 2017). The non-dominant limb maintains the stability of the gait stance phase through the greater medial force (Sadeghi et al., 2000). Similarly, the larger SF of medial-lateral direction of GRF present in the stance phase of the entire stance phase can also explain this idea. The only slight asymmetry of vertical direction of GRF (SF < 18) and no significant difference before and after fatigue were reported in the current study, which contradicted the previous reports that vertical direction of GRF was a major variable of symmetry in running gait (Gao et al., 2020b).
The kinematics and kinetics variables of bilateral lower limbs may be changed due to the weakened central nervous control over muscles during long-distance running (Quan et al., 2021). Our findings are in line with a previous argument that gait asymmetry increases with fatigue (Gao et al., 2020a). The current study report that the asymmetry was mainly found in the medial-lateral direction, and it was observed to occur in the heel contact stage (8%–9% and 10%–12%) and the mid-foot forward transition stage (50%–60%), suggesting that the more significant medial load exist in the non-dominant foot during running gait after fatigue intervention. This phenomenon may be the potential cause of ankle pronation and arch collapse after long-distance running (Fourchet et al., 2015). Moreover, The asymmetry of anterior-posterior and vertical direction of GRF was observed to occur before the push-off period, which was consistent with the performance before fatigue, suggesting that fatigue did not affect the asymmetry of GRF in anterior-posterior and vertical directions (Van Gheluwe and Madsen, 1997). Moreover, it can be seen from Figure 6 that the symmetry of medial-lateral direction of GRF deteriorates during the push-off phase of gait (86%–88% and 90%–92%) after fatigue intervention, suggesting that the more medial load was concentrated in the metatarsal joint of non-dominant foot (Gao et al., 2020a). The deterioration of this asymmetry may be related to the risk of overuse injury to the unilateral metatarsal-toe joint, possibly due to a higher susceptibility to fatigue in the lower limb muscles of the non-dominant limb, but further research is needed to verify if GRF measures could be used to infer foot neuromuscular control.
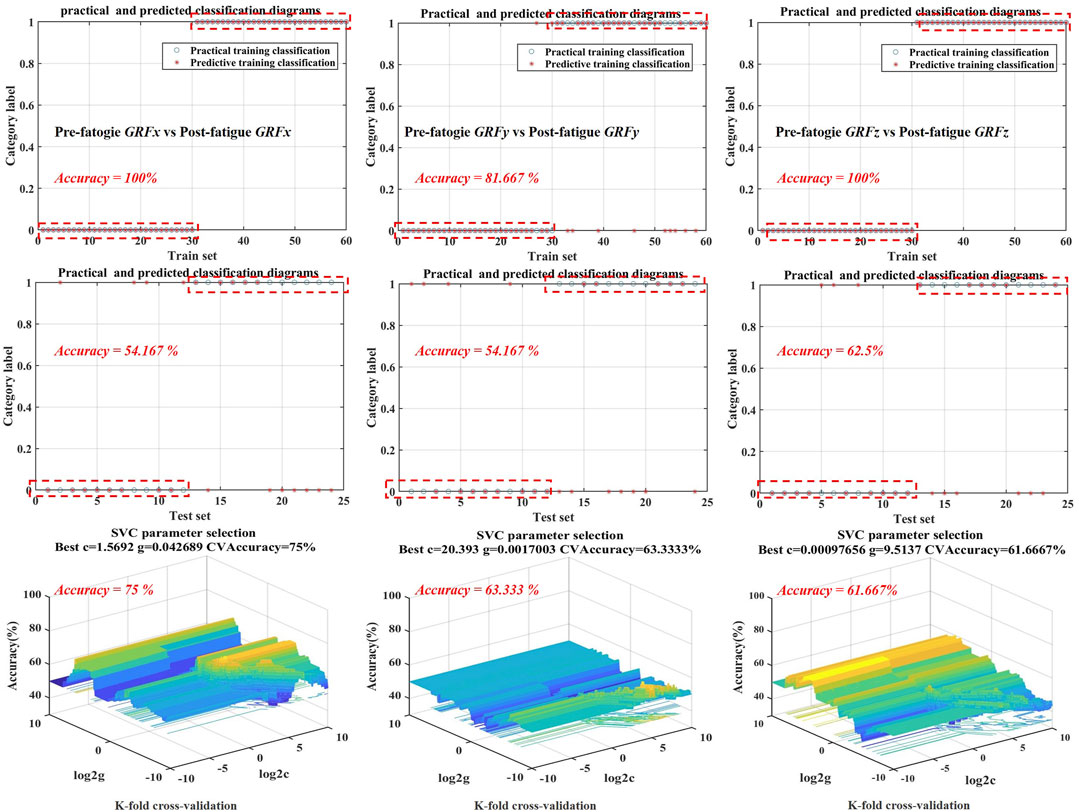
FIGURE 6. Training set, test set and cross-validation model accuracy visualization are based on optimal kernel function selection for SVM models of SF for SVM models of SFx, SFy and SFz before and after Running-induced Fatigue Protocol Test. SFx: medial-lateral direction of SF, SFy: anterior-posterior direction of SF, SFz: vertical direction of SF.
Sensitivity and specificity were used to measure the ability of the classifier to detect gait patterns of left and right limbs and before and after fatigue, respectively (Chan et al., 2002). Earlier, Chan et al. (Chan et al., 2002) reported 91% and 94% similarity success rates for second-order POLY and linear nuclei in an SVM gender classification task based on gait video sequence data. Our results also show that the SVM model can map the underlying data structures related to asymmetrical and fatigue gait (Atanassov et al., 2021). Machine learning-based classifiers can automatically recognize particular gait patterns according to their measurement methods, which is expected to provide a basis for exploring the potential biomechanical mechanism of running-fatigued. Early recognition of gait problems caused by symmetry changes by a machine classifier can avoid fatigue through a motor intervention program in advance, thus reducing the incidence of injuries caused by fatigue and asymmetry gait. Compared with traditional symmetry evaluation methods, the SVM algorithm based on non-linear kernel function mapping data to high-dimensional space classification has a more substantial symmetry quantization ability (Wu and Wu, 2015).
In this study, it is observed that the adjustment of optimal parameters is also crucial to the improvement of model accuracy, especially the choice of penalty parameter C and kernel function. The change of each kernel will lead to a change in the model. Therefore, the optimal model is obtained through repeated testing of a large number of experiments in this study (Begg and Kamruzzaman, 2005). The selection of kernel function has an important influence on the generalization ability of the SVM model since the kernel function reflects the internal changes of gait biomechanical characteristics by mapping the mutual non-linear relationship between gait variables into the high-dimensional feature space (Schölkopf et al., 2002). Therefore, three kernel functions (RBF, POLY, and LINEAR) were selected for gait data analysis, considering that all gait parameters may have probability distributions in higher space. It can be seen from Tables 2, 3 that the generalization performance of non-linear kernel functions such as POLY and RBF is better than that of LINEAR in the SVM model of gait feature recognition. A recent study reported by Xiang and his colleagues (Xiang et al., 2022b) showed that the SVM model based on RBF had a prediction accuracy of 93% to classify dynamic plantar pressure and foot metrics of barefoot and shod people. This finding is consistent with the results obtained in this study that the prediction accuracy of SVM model is higher than that of the LINEAR. Specifically, the POLY kernel can make the SVM model the most accurate in classifying left and right gait features, with accuracy of 85.3%, 82.4%, and 82.4% in medial-lateral, anterior-posterior and vertical directions, respectively. Similarly, RBF was the optimal kernel function of the SVM model for fatigue gait recognition in medial-lateral (54.2%) and vertical direction (62.5%). Furthermore, POLY was the optimal kernel function of the anterior-posterior direction (54.2%). Using these SVM model to achieve automatic gait feature of bilateral lower limbs and of fatigue gait classification, suggesting that early recognition runners gait asymmetry and fatigue gait. As a final summary, SVM classifier within the healthy individuals of this study provides a basis for further exploring the automatic recognition methodology of gait asymmetry and of fatigue gait.
There are also four limitations to this study. Firstly, in the process of GRF data collection, we only used one force plate to measure the left and right gait characteristics, respectively. secondly, the participants in this study are all young groups, so the model may not be applicable to older runners. Future studies should consider the biomechanical data sets of all ages for model training. In addition, although the running-induced fatigue experiment is a classic fatigue method, it is performed on a treadmill and may differ from long-distance running on the ground, such as a marathon. Moreover, the only GRF data was considered as a variable for gait recognition in this study, more variables that can sensitively reflect asymmetric gait, such as joint Angle, should be included in the further study. At last, this study selected participants’ comfortable running speed for ground data collection, thus ignoring the possible effect of speed on GRF. Future studies should compare the GRF differences between comfortable and standard running speeds.
In this study, the asymmetry degree and changes of GRF in both lower limbs of 14 amateur male runners were investigated before and after a running-induced fatigue experiment. An SVM machine learning model was established to mine and recognize the characteristics of left and right gait and fatigue gait non-linear. The findings of this study suggest that GRF asymmetry existed in the medial-lateral, anterior-posterior and vertical directions of bilateral lower limbs, especially in medial-lateral direction. In addition, the asymmetry of GRF in the medial-lateral direction was increased after fatigued. Moreover, the POLY and RBF kernel contribute more to recognizing asymmetric and fatigue gait characteristics in SVM machine learning model, respectively.
The raw data supporting the conclusion of this article will be made available by the authors, without undue reservation.
The studies involving human participants were reviewed and approved by Ningbo University. The patients/participants provided their written informed consent to participate in this study.
ZG, YZ, YF, GF, and AK conceived the presented idea, developed the framework, and wrote the manuscript. JB, ML, and YG provided critical feedback and contributed to the final version. All authors were involved in the final direction of the paper and contributed to the final version of the manuscript and have read and agreed to the published version of the manuscript.
This study was sponsored by the Zhejiang Provincial Natural Science Foundation of China for Distinguished Young Scholars (LR22A020002), Zhejiang Provincial Key Research and Development Program of China (2021C03130), Zhejiang Provincial Natural Science Foundation (LTGY23H040003), Research Academy of Medicine Combining Sports, Ningbo (No.2023001), the Project of NINGBO Leading Medical & Health Discipline (No.2022-F15, No.2022-F22), Ningbo Natural Science Foundation (20221JCGY010532, 20221JCGY010607), Public Welfare Science & Technology Project of Ningbo, China (2021S134), and K. C. Wong Magna Fund in Ningbo University.
The authors declare that the research was conducted in the absence of any commercial or financial relationships that could be construed as a potential conflict of interest.
All claims expressed in this article are solely those of the authors and do not necessarily represent those of their affiliated organizations, or those of the publisher, the editors and the reviewers. Any product that may be evaluated in this article, or claim that may be made by its manufacturer, is not guaranteed or endorsed by the publisher.
Arampatzis, A., Brüggemann, G.-P., and Metzler, V. (1999). The effect of speed on leg stiffness and joint kinetics in human running. J. biomechanics 32 (12), 1349–1353. doi:10.1016/S0021-9290(99)00133-5
Atanassov, E., Karaivanova, A., Ivanovska, S., and Durchova, M. (2021). A Monte Carlo method for image classification using SVM. Digital Present. Preserv. Cult. Sci. Herit. 11, 237–244. doi:10.55630/dipp.2021.11.20
Beck, O. N., Azua, E. N., and Grabowski, A. M. (2018). Step time asymmetry increases metabolic energy expenditure during running. Eur. J. Appl. physiology 118 (10), 2147–2154. doi:10.1007/s00421-018-3939-3
Begg, R., and Kamruzzaman, J. (2005). A machine learning approach for automated recognition of movement patterns using basic, kinetic and kinematic gait data. J. biomechanics 38 (3), 401–408. doi:10.1016/j.jbiomech.2004.05.002
Ceyssens, L., Vanelderen, R., Barton, C., Malliaras, P., and Dingenen, B. (2019). Biomechanical risk factors associated with running-related injuries: A systematic review. Sports Med. 49 (7), 1095–1115. doi:10.1007/s40279-019-01110-z
Chan, K., Lee, T.-W., Sample, P. A., Goldbaum, M. H., Weinreb, R. N., and Sejnowski, T. J. (2002). Comparison of machine learning and traditional classifiers in glaucoma diagnosis. IEEE Trans. Biomed. Eng. 49 (9), 963–974. doi:10.1109/TBME.2002.802012
Chau, T. (2001). A review of analytical techniques for gait data. Part 1: Fuzzy, statistical and fractal methods. Gait posture 13 (1), 49–66. doi:10.1016/S0966-6362(00)00094-1
Clermont, C. A., Osis, S. T., Phinyomark, A., and Ferber, R. (2017). Kinematic gait patterns in competitive and recreational runners. J. Appl. biomechanics 33 (4), 268–276. doi:10.1123/jab.2016-0218
Eskofier, B. M., Federolf, P., Kugler, P. F., and Nigg, B. M. (2013). Marker-based classification of young–elderly gait pattern differences via direct PCA feature extraction and SVMs. Comput. methods biomechanics Biomed. Eng. 16 (4), 435–442. doi:10.1080/10255842.2011.624515
Figueiredo, J., Santos, C. P., and Moreno, J. C. (2018). Automatic recognition of gait patterns in human motor disorders using machine learning: A review. Med. Eng. Phys. 53, 1–12. doi:10.1016/j.medengphy.2017.12.006
Fourchet, F., Kelly, L., Horobeanu, C., Loepelt, H., Taiar, R., and Millet, G. (2015). High-intensity running and plantar-flexor fatigability and plantar-pressure distribution in adolescent runners. J. Athl. Train. 50 (2), 117–125. doi:10.4085/1062-6050-49.3.90
Furlong, L., and Egginton, N. L. (2018). Kinetic asymmetry during running at preferred and nonpreferred speeds. Med. Sci. Sports Exerc. 50 (6), 1241–1248. doi:10.1249/MSS.0000000000001560
Gao, Z., Fekete, G., Baker, J. S., Liang, M., Xuan, R., and Gu, Y. (2022a). Effects of running fatigue on lower extremity symmetry among amateur runners: From a biomechanical perspective. Front. Physiology 13, 1–12. doi:10.3389/fphys.2022.899818
Gao, Z., Mei, Q., Fekete, G., Baker, J. S., and Gu, Y. (2020a). The effect of prolonged running on the symmetry of biomechanical variables of the lower limb joints. Symmetry 12 (5), 720–731. doi:10.3390/sym12050720
Gao, Z., Mei, Q., Xiang, L., Baker, J. S., Fernandez, J., and Gu, Y. (2020b). Effects of limb dominance on the symmetrical distribution of plantar loading during walking and running. Proc. Institution Mech. Eng. Part P J. Sports Eng. Technol. 236 (1), 17–23. doi:10.1177/1754337120960962
Gao, Z., Mei, Q., Xiang, L., and Gu, Y. (2020c). Difference of walking plantar loadings in experienced and novice long-distance runners. Acta Bioeng. Biomech. 22, 127–147. doi:10.37190/ABB-01627-2020-02
Gao, Z. (2022). The effect of application of asymmetry evaluation in competitive Sports: A systematic review. Phys. Activity Health 6 (1), 257–272. doi:10.5334/paah.215
Gao, Z., Zhao, L., Fekete, G., Katona, G., Baker, J. S., and Gu, Y. (2022b). Continuous time series analysis on the effects of induced running fatigue on leg symmetry using kinematics and kinetic variables: Implications for knee joint injury during a countermovement jump. Front. Physiology 13, 877394. doi:10.3389/fphys.2022.877394
García-Pinillos, F., Cartón-Llorente, A., Jaén-Carrillo, D., Delgado-Floody, P., Carrasco-Alarcón, V., Martínez, C., et al. (2020). Does fatigue alter step characteristics and stiffness during running? Gait posture 76, 259–263. doi:10.1016/j.gaitpost.2019.12.018
Goble, D., Marino, G., and Potvin, J. (2003). The influence of horizontal velocity on interlimb symmetry in normal walking. Hum. Mov. Sci. 22 (3), 271–283. doi:10.1016/S0167-9457(03)00047-2
Golub, T. R., Slonim, D. K., Tamayo, P., Huard, C., Gaasenbeek, M., Mesirov, J. P., et al. (1999). Molecular classification of cancer: Class discovery and class prediction by gene expression monitoring. science 286 (5439), 531–537. doi:10.1126/science.286.5439.531
Grabowski, A. M., and Kram, R. (2008). Effects of velocity and weight support on ground reaction forces and metabolic power during running. J. Appl. Biomechanics 24 (3), 288–297. doi:10.1123/jab.24.3.288
Heil, J., Loffing, F., and Büsch, D. (2020). The influence of exercise-induced fatigue on inter-limb asymmetries: A systematic review. Sports Medicine-Open 6 (1), 39–16. doi:10.1186/s40798-020-00270-x
Herzog, W., Nigg, B. M., Read, L. J., and Olsson, E. (1989). Asymmetries in ground reaction force patterns in normal human gait. Med. Sci. Sports Exerc. 21 (1), 110–114. doi:10.1249/00005768-198902000-00020
Kiesel, K., Plisky, P. J., and Voight, M. L. (2007). Can serious injury in professional football be predicted by a preseason functional movement screen? North Am. J. sports Phys. Ther. 2 (3), 147–158.
Koblbauer, I. F., van Schooten, K. S., Verhagen, E. A., and van Dieën, J. H. (2014). Kinematic changes during running-induced fatigue and relations with core endurance in novice runners. J. Sci. Med. sport 17 (4), 419–424. doi:10.1016/j.jsams.2013.05.013
Kyröläinen, H., Avela, J., and Komi, P. V. (2005). Changes in muscle activity with increasing running speed. J. Sports 23 (10), 1101–1109. doi:10.1080/02640410400021575
Mastalerz, A., Tabor, P., and Grabowska, O. (2021). The symmetry of fatigue of lower limb muscles in 400 m run based on electromyography signals. Symmetry 13, 1698–1708. doi:10.3390/sym13091698
Mizrahi, J., Verbitsky, O., Isakov, E., and Daily, D. (2000). Effect of fatigue on leg kinematics and impact acceleration in long distance running. Hum. Mov. Sci. 19 (2), 139–151. doi:10.1016/S0167-9457(00)00013-0
Nakayama, Y., Kudo, K., and Ohtsuki, T. (2010). Variability and fluctuation in running gait cycle of trained runners and non-runners. Gait Posture 31 (3), 331–335. doi:10.1016/j.gaitpost.2009.12.003
Nigg, S., Vienneau, J., Maurer, C., and Nigg, B. M. (2013). Development of a symmetry index using discrete variables. Gait posture 38 (1), 115–119. doi:10.1016/j.gaitpost.2012.10.024
Noble, W. S. (2006). What is a support vector machine? Nat. Biotechnol. 24 (12), 1565–1567. doi:10.1038/nbt1206-1565
Pan, J. W., Ho, M. Y. M., Loh, R. B. C., Iskandar, M. N. S., and Kong, P. W. (2023). Foot morphology and running gait pattern between the left and right limbs in recreational runners. Phys. Activity Health 7 (1), 43–52. doi:10.5334/paah.226
Potdevin, F., Gillet, C., Barbier, F., Coello, Y., and Moretto, P. (2008). Propulsion and braking in the study of asymmetry in able-bodied men's gaits. Percept. Mot. Ski. 107 (3), 849–861. doi:10.2466/pms.107.3.849-861
Quan, W., Ren, F., Xu, D., Gusztav, F., Baker, J. S., and Gu, Y. (2021). Effects of fatigue running on joint mechanics in female runners: A prediction study based on a partial least squares algorithm. Front. Bioeng. Biotechnol. 9, 746761. doi:10.3389/fbioe.2021.746761
Radzak, K. N., Putnam, A. M., Tamura, K., Hetzler, R. K., and Stickley, C. D. (2017). Asymmetry between lower limbs during rested and fatigued state running gait in healthy individuals. Gait Posture 51, 268–274. doi:10.1016/j.gaitpost.2016.11.005
Sadeghi, H., Allard, P., Prince, F., and Labelle, H. (2000). Symmetry and limb dominance in able-bodied gait: A review. Gait posture 12 (1), 34–45. doi:10.1016/S0966-6362(00)00070-9
Sadeghi, H. (2003). Local or global asymmetry in gait of people without impairments. Gait posture 17 (3), 197–204. doi:10.1016/S0966-6362(02)00089-9
Schölkopf, B., Smola, A. J., and Bach, F. (2002). Learning with kernels: Support vector machines, regularization, optimization, and beyond. Cambridge: MIT press.
Seeley, M. K., Umberger, B. R., and Shapiro, R. (2008). A test of the functional asymmetry hypothesis in walking. Gait posture 28 (1), 24–28. doi:10.1016/j.gaitpost.2007.09.006
Simoni, L., Scarton, A., Macchi, C., Gori, F., Pasquini, G., and Pogliaghi, S. (2021). Quantitative and qualitative running gait analysis through an innovative video-based approach. Sensors 21 (9), 2977–2989. doi:10.3390/s21092977
Smeets, A., Vanrenterghem, J., Staes, F., and Verschueren, S. (2019). Match play induced changes in landing biomechanics with special focus on fatigability. Med. Sci. sports Exerc. 51 (9), 1884–1894. doi:10.1249/MSS.0000000000001998
Tabor, P., Iwańska, D., Grabowska, O., Karczewska-Lindinger, M., Popieluch, A., and Mastalerz, A. (2021). Evaluation of selected indices of gait asymmetry for the assessment of running asymmetry. Gait Posture 86, 1–6. doi:10.1016/j.gaitpost.2021.02.019
Teufl, W., Taetz, B., Miezal, M., Lorenz, M., Pietschmann, J., Jöllenbeck, T., et al. (2019). Towards an inertial sensor-based wearable feedback system for patients after total hip arthroplasty: Validity and applicability for gait classification with gait kinematics-based features. Sensors 19 (22), 5006–5026. doi:10.3390/s19225006
Van Gheluwe, B., and Madsen, C. (1997). Frontal rearfoot kinematics in running prior to volitional exhaustion. J. Appl. Biomechanics 13 (1), 66–75. doi:10.1123/jab.13.1.66
Vapnik, V. (1999). The nature of statistical learning theory. Berlin: Springer science & business media.
Viteckova, S., Kutilek, P., Svoboda, Z., Krupicka, R., Kauler, J., and Szabo, Z. (2018). Gait symmetry measures: A review of current and prospective methods. Biomed. Signal Process. Control 42, 89–100. doi:10.1016/j.bspc.2018.01.013
Williams, K., Cavanagh, P., and Ziff, J. (1987). Biomechanical studies of elite female distance runners. Int. J. Sports Med. 8 (2), S107–S118. doi:10.1055/s-2008-1025715
Winiarski, S., Rutkowska-Kucharska, A., and Kowal, M. (2021). Symmetry function–An effective tool for evaluating the gait symmetry of trans-femoral amputees. Gait Posture 90, 9–15. doi:10.1016/j.gaitpost.2021.07.021
Winter, D. A. (1984). Kinematic and kinetic patterns in human gait: Variability and compensating effects. Hum. Mov. Sci. 3 (1-2), 51–76. doi:10.1016/0167-9457(84)90005-8
Wu, J., and Wu, B. (2015). The novel quantitative technique for assessment of gait symmetry using advanced statistical learning algorithm. BioMed Res. Int. 2015, 528971. doi:10.1155/2015/528971
Xiang, L., Gu, Y., Mei, Q., Wang, A., Shim, V., and Fernandez, J. (2022a). Automatic classification of barefoot and shod populations based on the foot metrics and plantar pressure patterns. Front. Bioeng. Biotechnol. 10, 843204. doi:10.3389/fbioe.2022.843204
Xiang, L., Mei, Q., Wang, A., Shim, V., Fernandez, J., and Gu, Y. (2022b). Evaluating function in the hallux valgus foot following a 12-week minimalist footwear intervention: A pilot computational analysis. J. Biomech. 132, 110941. doi:10.1016/j.jbiomech.2022.110941
Xu, D., Quan, W., Zhou, H., Sun, D., Baker, J. S., and Gu, Y. (2022). Explaining the differences of gait patterns between high and low-mileage runners with machine learning. Sci. Rep. 12 (1), 2981. doi:10.1038/s41598-022-07054-1
Zhang, Q., Zhang, Y., Chon, T. E., Baker, J. S., and Gu, Y. (2023). Analysis of stress and stabilization in adolescent with osteoporotic idiopathic scoliosis: Finite element method. Comput. Methods Biomech. Biomed. Engin 26 (1), 12–24. doi:10.1080/10255842.2022.2044803
Keywords: symmetry function, fatigue gait, statistical parameter mapping, running, support vector machine
Citation: Gao Z, Zhu Y, Fang Y, Fekete G, Kovács A, Baker JS, Liang M and Gu Y (2023) Automated recognition of asymmetric gait and fatigue gait using ground reaction force data. Front. Physiol. 14:1159668. doi: 10.3389/fphys.2023.1159668
Received: 06 February 2023; Accepted: 23 February 2023;
Published: 07 March 2023.
Edited by:
Qipeng Song, Shandong Sport University, ChinaCopyright © 2023 Gao, Zhu, Fang, Fekete, Kovács, Baker, Liang and Gu. This is an open-access article distributed under the terms of the Creative Commons Attribution License (CC BY). The use, distribution or reproduction in other forums is permitted, provided the original author(s) and the copyright owner(s) are credited and that the original publication in this journal is cited, in accordance with accepted academic practice. No use, distribution or reproduction is permitted which does not comply with these terms.
*Correspondence: Minjun Liang, bGlhbmdtaW5qdW5AbmJ1LmVkdS5jbg==; Yaodong Gu, Z3V5YW9kb25nQGhvdG1haWwuY29t
Disclaimer: All claims expressed in this article are solely those of the authors and do not necessarily represent those of their affiliated organizations, or those of the publisher, the editors and the reviewers. Any product that may be evaluated in this article or claim that may be made by its manufacturer is not guaranteed or endorsed by the publisher.
Research integrity at Frontiers
Learn more about the work of our research integrity team to safeguard the quality of each article we publish.