- 1Department of Radiology, Tongji Hospital Affiliated to Tongji Medical College, Huazhong University of Science and Technology, Wuhan, China
- 2Department of Orthopedics, Tongji Hospital Affiliated to Tongji Medical College, Huazhong University of Science and Technology, Wuhan, China
- 3MR Research, GE Healthcare, Beijing, China
- 4Department of Urology, Tongji Hospital Affiliated to Tongji Medical College, Huazhong University of Science and Technology, Wuhan, China
Objectives: This work aimed to investigate the feasibility and diagnostic value of synthetic MRI, including T1, T2 and PD values in determining the severity of cervical spondylotic myelopathy (CSM).
Methods: All subjects (51 CSM patients and 9 healthy controls) underwent synthetic MRI scan on a 3.0T GE MR scanner. The cervical canal stenosis degree of subjects was graded 0—III based on the method of a MRI grading system. Regions of interest (ROIs) were manually drawn at the maximal compression level (MCL) by covering the whole spinal cord to generate T1MCL, T2MCL, and PDMCL values in grade I-III groups. Besides, anteroposterior (AP) and transverse (Trans) diameters of the spinal cord at MCL were measured in grade II and grade III groups, and relative values were calculated as follows: rAP = APMCL/APnormal, rTrans = TransMCL/Transnormal. rMIN = rAP/rTrans.
Results: T1MCL value showed a decreasing trend with severity of grades (from grade 0 to grade II, p < 0.05), while it increased dramatically at grade III. T2MCL value showed no significant difference among grade groups (from grade 0 to grade II), while it increased dramatically at grade III compared to grade II (p < 0.05). PDMCL value showed no statistical difference among all grade groups. rMIN of grade III was significantly lower than that of grade II (p < 0.05). T2MCL value was negatively correlated with rMIN, whereas positively correlated with rTrans.
Conclusion: Synthetic MRI can provide not only multiple contrast images but also quantitative mapping, which is showed promisingly to be a reliable and efficient method in the quantitative diagnosis of CSM.
1 Introduction
Cervical spondylotic myelopathy (CSM) is a chronic compressive spinal cord lesion (Rao, 2002; McCormick et al., 2003). It is the most common form of spinal cord injury in adults, especially in older patients (McCormick et al., 2020). It is important to identify early symptoms and provide effective treatments before developing irreversible spinal cord damage (Edwards et al., 2003).
Magnetic resonance image (MRI) is widely used for CSM diagnosis via visualization of the anatomical extent of spinal cord compression and the intramedullary signal changes within the spinal cord (Takahashi et al., 1987; Al-Mefty et al., 1988; Ramanauskas et al., 1989; Mehalic et al., 1990; Batzdorf and Flannigan, 1991; Ohshio et al., 1993; Shabani et al., 2019). Conventional MRI, which usually includes T1-and T2-weighted images (T1WI and T2WI), can provide high-resolution images of vertebrae, spinal cord, and surrounding soft tissues (Harkins et al., 2016). However, alterations of the T1 and T2 signal intensity still limit the diagnosis of early stages of CSM (Karpova et al., 2010). A sensitive and reproducible imaging technique is needed for early diagnosis and quantification of spinal cord compression. Quantitative MRI might be an option because that the T1 mapping had shown the clinical potential (Maier et al., 2019; Maier et al., 2020), while T2 and proton density (PD) mappings have been rarely reported.
Synthetic MRI can provide quantitative mapping including T1, T2 and PD mapping as well as multiple contrast-weighted imaging such as T1-, T2-weighted images, simultaneously (Warntjes et al., 2008). Synthetic MRI technique has been widely used in many regions and has shown good diagnostic performance in brain, skeleton, articulatio, breast, prostate and lumbar intervertebral disk degeneration (Hagiwara et al., 2017; Cui et al., 2020; Liu et al., 2021; Moran, 2021; Zhao et al., 2021). To our knowledge, there is no application of synthetic MRI on CSM patients. Therefore, our study aimed to explore the diagnostic value of the quantitative mapping generated by synthetic MRI in evaluating spinal cord compression in patients with CSM.
2 Materials and methods
2.1 Subjects
The institutional review board of research ethics approved this study and all subjects gave written informed consent. From August 2021 to March 2022, a total of 60 subjects (26 men and 34 women) were involved in this study including 51 patients with CSM and 9 healthy controls. The 51 patients were diagnosed with CSM by the standard of narrowed anteroposterior diameter of spinal canal revealed by sagittal and axial T2WI MRI, and all the CSM patients in our study were in acute stage with clinical signs of myelopathy. According to the MRI grading system proposed by Kang et al. (2011), all subjects were classified into four grades: 1) grade 0: no spinal canal stenosis is visible (healthy controls); 2) grade I: the spinal canal is narrowed without compression of the spinal cord; 3) grade II: the spinal cord is deformed; 4) grade III: the spinal cord is compressed with additional increased signal intensity near the compressed level on T2 weighted images. Exclusion criteria for subjects were as follows: 1) regular contraindications for MRI, such as claustrophobia and metal implants; 2) patients with prior neurologic trauma or coexisting neurologic disorders; 3) patients with prior surgery. Clinical scores of patients and controls were evaluated using the Japanese Orthopaedic Association (JOA) score. The JOA ranged from 0 to 17 points and correspondingly reflected severe deficits to normal function.
2.2 MRI protocol
All subjects underwent MR exams in the supine position on a 3.0 T whole-body scanner (SIGNA Architect, GE Healthcare, Milwaukee, United States) using a 19 channel high-resolution head and neck coil. All subjects were instructed not to move and swallow during scanning to minimize motion artifacts. Routine sequences were acquired, including Sagittal T2WI FSE (TR:2000 ms, TE:102.0 ms, NEX:1.00, Thickness:3.0, Spacing: 0.5), Sagittal FS (Fat Saturation) T2WI FSE (TR:2816 ms, TE:102.0 ms, NEX:2.00, Thickness:3.0, Spacing: 0.5), Sagittal T1WI FSE (TR:612 ms, TE:10.0 ms, NEX:2.00, Thickness:3.0, Spacing: 0.5). Synthetic MRI (MAGiC, MAGnetic resonance image Compilation) scan of the spinal cord was performed at 0.5 mm in-plane resolution and 4 mm slice thickness in multiple axial sections perpendicular to the spinal cord. Other imaging parameters for MAGiC were as follows: TR: 4008 ms, TE: 29.3 ms, spacing: 1.0mm, Matrix size: 400 × 400, NEX: 1.00, scanning time: 7min45s.
2.3 Image analysis
The T1, T2, PD maps were generated by an offline post-processing software (SyMRI 11.2.2; SyntheticMR, Linköping, Sweden) in addition to automatically generated multiple contrast images, including T1WI, T2WI, PDWI simultaneously. Two radiologists with ten and 15 years of experience in spine diagnosis respectively evaluated the grade of spinal canal stenosis (SCS) and measured T1, T2 and PD values for all participants. Regions of interest (ROIs) were manually drawn at the maximal compression level (MCL) on synthetic images by covering the whole spinal cord to generate T1MCL, T2MCL, and PDMCL values in grade I-III groups, and the MAGiC quantitative values of grade 0 group were defined as the average values of spinal cord at C2/3-C6/7 intervertebral disc levels (Figure 1). Besides, the anteroposterior (AP) and transverse (Trans) diameters of the spinal cord on axial imaging were measured in grade II and III groups. The select sections of the spinal cord for measurement were the MCL and the normal level nearest the MCL, as shown in Figure 2. Relative values of AP and Trans diameters were calculated as follows: rAP = APMCL/APnormal, rTrans = TransMCL/Transnormal. The compression ratio was defined as following: rMIN = rAP/rTrans.
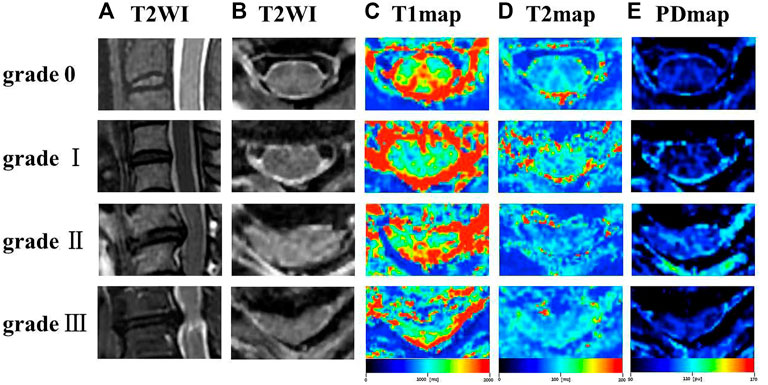
FIGURE 1. Representation sagittal T2WI (A), axial T2WI (B), T1 colormap (C), T2 colormap (D) and PD colormap (E) of the spinal cord of at C2/3 intervertebral disc level in grade 0 group, and the spinal cord at the maximal compression level (MCL) in grade I-III groups.
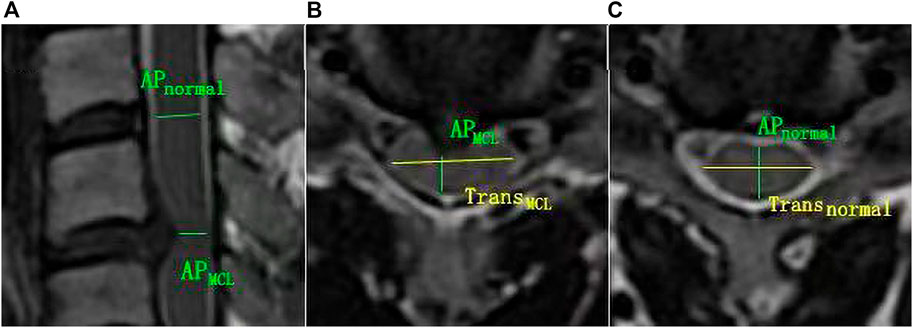
FIGURE 2. The schematic diagram for diameter measurement. (A, B) APMCL = anteroposterior diameter of the spinal cord at MCL, and TransMCL = transverse diameter of the spin cord at MCL. (A, C) APnormal = anteroposterior diameter of normal level spin cord nearest the MCL. Transnormal = transverse diameter of normal level spin cord nearest the MCL.
2.4 Statistical analysis
All data were analyzed using SPSS 23.0 software (IBM, Armonk, NY) and shown as mean ± standard deviation (SD). The values of T1, T2, PD and clinical score were compared between different CSM grades using Mann-Whitney U test. The correlations among the clinical score, MAGiC quantitative values (T1, T2 and PD), and the diameter values (rAP, rTrans and rMIN) in grade II - III groups were assessed by the Spearman correlation. Intraclass correlation coefficient (ICC) was calculated for the inter-observer consistency of T1, T2 and PD measurements and defined as poor (<0.40), fair (0.40–0.59), good (0.60–0.74), and excellent (0.75–1.00). p-values below 0.05 were considered statistically significant.
3 Results
3.1 Patient characteristic
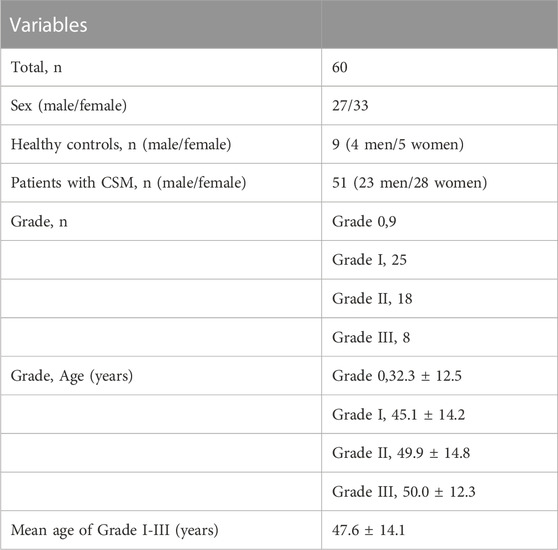
The mean age and SD of 51 patients with CSM and 9 healthy controls was respectively 47.6
3.2 Synthetic MRI parameters
Mean and standard deviation of all MAGiC quantitative values of the spinal cord at MCL were measured and recorded (Table 2). ICCs for PD, T1 and T2 ranged from 0.950 to 0.998 and showed good inter-observer consistency.

TABLE 2. The mean and standard deviation of MAGiC quantitative values (T1, T2 and PD), clinical score, and diameters values of the spinal cord at MCL in different grades of CSM patients.
For the maximal compression level, T1 value showed a decreasing trend with severity of grades (from grade 0 to grade II, p < 0.05), while it increased dramatically at grade III. Significant differences were found between adjacent groups from grade 0 to grade III. T2MCL value showed no significant difference among grades (from grade 0 to grade II), while it increased dramatically at grade III (p < 0.05). PDMCL value showed no statistically difference among all grades. The results were shown in Figure 3.
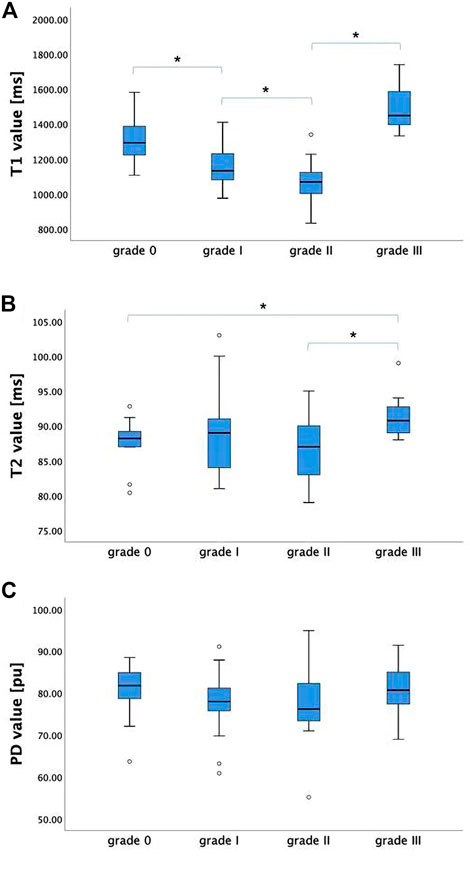
FIGURE 3. The T1, T2, and PD values (mean ± standard deviation) of grade 0-III groups. (A) T1MCL value showed a decreasing trend with severity of grades (from grade 0 to grade II), while it increased dramatically at grade III. (B) T2MCL value showed no significant difference among grade groups (from grade 0 to grade II), while it increased dramatically at grade III compared to grade II. (C) PDMCL value showed no statistically difference among all grade groups. * Statistically significant at a threshold of p < 0.05.
3.3 Association between clinical score, MAGiC quantitative values (T1, T2 and PD), and diameter values of the spinal cord at MCL
The JOA score showed a decreasing trend with severity of grades (from grade I to grade III, p < 0.05). For the CSM patients in grade II and grade III, rAP and rTrans of the spinal cord at MCL showed no significant difference between two groups, while rMIN of grade III was significantly lower than that of grade II (p < 0.05), as shown in Figure 4. Multilevel correlations were observed in the CSM patients of grade II and III. T1MCL and T2MCL values were all negatively correlated with JOA scores. T2MCL value was negatively correlated with rMIN, whereas positively correlated with rTrans. Conversely, JOA score was negatively correlated with rTrans, whereas positively correlated with rMIN (Figure 5).
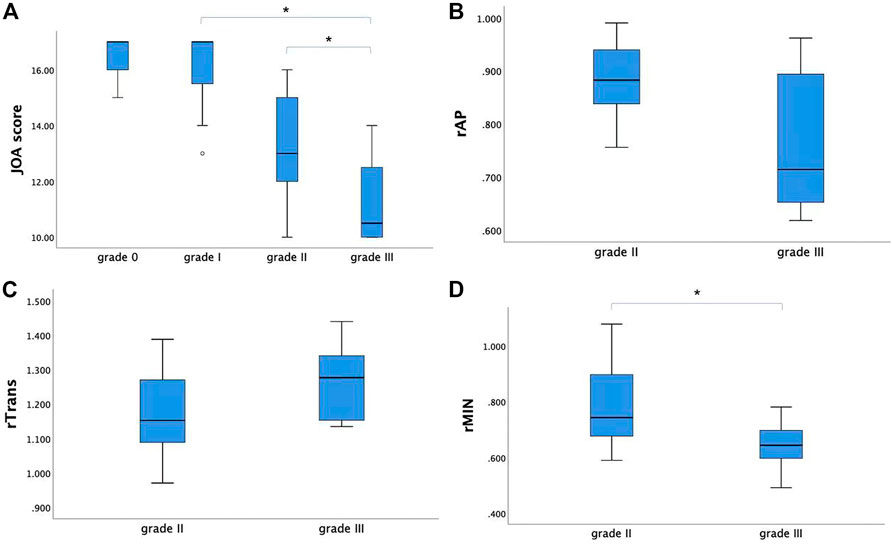
FIGURE 4. (A) The JOA score showed a decreasing trend with severity of grades (from grade I to grade III). (B, C) For the CSM patients in grade II and grade III, rAP and rTrans of the spinal cord at MCL showed no significant difference between two groups. (D) While rMIN of grade III was significantly lower than that of grade II. * Statistically significant at a threshold of p < 0.05.
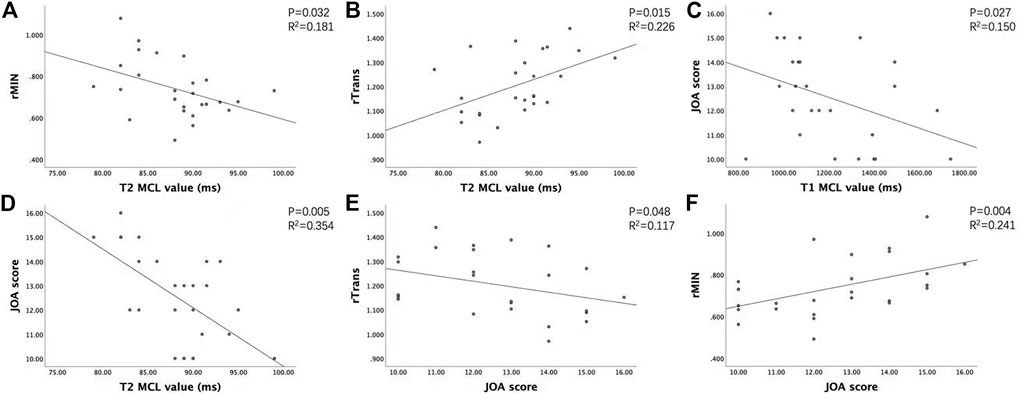
FIGURE 5. Association between clinical score, MAGIC quantitative values (T1, T2), and diameter values of the spinal cord at MCL in grade II and grade III groups. (A) T2MCL value was negatively correlated with rMIN. (B) T2MCL value was positively correlated with rTrans. (C, D) T1MCL and T2MCL value all negatively correlated with JOA scores. (E, F) JOA score negatively correlated with rTrans, whereas positively correlated with rMIN.
4 Discussion
The current study was the first to use synthetic MRI in the diagnosis of CSM patients. Multiple relaxation maps (T1, T2 and PD maps) as well as contrast-weighted images were obtained in a single scan of synthetic MRI. Our study demonstrated that T1 and T2 relaxation time of spinal cord at MCL changed with a grade dependent difference and T1MCL value could sensitively reflect the microstructural change of compressive spinal cord even at grade I stage. Moreover, T1 and T2 values were related to clinical score and diameters values of the spinal cord at MCL.
In our study, T1, T2 and PD maps as well as multi-contrast images were generated from a one-time-scan of MAGiC imaging sequence. The acquisition time (7 min 45 s) of MAGiC sequence is obviously shorter than that of the conventional mapping sequence, which is nearly 20 minutes for only T1 mapping (Maier et al., 2019; Maier et al., 2020). Therefore, it reduces patient’s discomfort, motion artifacts and increases work efficiency, allowing to easily apply in clinics. Overall, the range of T1 values in our study was consistent with that in a previous study (Maier et al., 2019) using T1 mapping in diagnosis of CSM, and T2 value obtained from MAGIC and T2 mapping data exhibited strong positive correlation in Jiang’s study (Jiang et al., 2020), so the MAGiC quantitative data should be practicable. In our result, T1MCL showed a decreasing trend with the severity of grades (from grade 0 to grade II, p < 0.05), which is in accordance with Maier’s study (Maier et al., 2019). Further, a reduced myelin water fraction was found in CSM patients, suggesting that a reduction in myelin water is a surrogate for spinal cord compression and dysfunction (Liu et al., 2017). Therefore, the main contribution to T1 decrease should be a direct physical consequence of compression compacting the microstructure and squeezing free water molecules with long T1 relaxation times out of the affected spinal cord. Nevertheless, T1 value decreased significantly in grade I group, even though the spinal cord did not present with deformation on sagittal T2-weighted MRI, which was explained by a kinetic MRI technique (Zeng et al., 2016) showing that intermittent compression and deformation of the spinal cord takes place in grade I patients. However, T1MCL and T2MCL increased dramatically together at grade III, which has not appeared in previous studies, one may speculate that tissue edema, inflammation, gliosis and microstructural damage occurred at the site of maximum compression (Batzdorf and Flannigan, 1991, Meyer et al., 2008). In addition, T2MCL value showed no significant difference among grades from grade 0 to grade II, and PDMCL value showed no statistical difference among all grades, indicating that T1MCL value could more sensitively reflect the microstructural change of compressive spinal cord than T2MCL and PDMCL. Meanwhile, the result means that T2MCL increase is associated with unfavorable clinical outcomes and poor responses to decompressive surgery (Sampath et al., 2000; Meyer et al., 2008), and microstructural damages of spinal cord in grade I and grade II may be reversible.
To explain the dramatic change of T1MCL and T2MCL values from grade II to grade III, we compared the diameter values of the spinal cord at MCL in grade II and grade III groups and tried to find the association of clinical score, MAGiC quantitative values, and diameter values of the spinal cord at MCL. Our study demonstrated that T2MCL value was negatively correlated with rMIN, besides, rMIN of grade III was significantly lower than that of grade II (p < 0.05), but rAP and rTrans of the spinal cord at MCL showed no significant difference between two groups. The result indicated that the T2 values ascended only when the spinal cord endured an oblate compression rather than local compression. In that case, the function of the compressed spinal cord would have less chance to be compensated by surrounding tissues, which could explain the result that JOA score positively correlated with rMIN and negatively correlated with rTrans, whereas no correlation with rAP in our study. Meanwhile, our study demonstrated that T1MCL and T2MCL value all negatively correlated with JOA scores in grade II and grade III patients, which is inconsistent with a previous T1 mapping study showing no correlation between T1 relaxation times and clinical signs of CSM (Maier et al., 2020). A likely explanation is the fact that we only compared the relationship between T1MCL, T2MCL value and JOA in grade II and grade III patients, and all the CSM patients in our study were in acute stage.
There were some limitations in this study. Firstly, the sample size in this study was relatively small, especially the amount of CSM patients in grade II and III groups. Secondly, there was no electrophysiological study to diagnose central conduction deficits in our study. However, all the CSM patients we enrolled were in acute stage to provide a relative objective clinical score. Third, the post-operation patients will also be included to explore the feasibility of synthetic MRI for predicting postoperative outcomes.
5 Conclusion
In this study, Synthetic MRI is showed promisingly to be a reliable and efficient method in the quantitative diagnosis of CSM. Synthetic MRI can provide not only multiple contrast images but also quantitative mapping. The MAGiC quantitative values are correlated with clinical signs and diameter changes at MCL. Therefore, Synthetic MRI may open up new dimensions in providing quantitative measures in assessing CSM and eventually improve the diagnosis of CSM in the future.
Data availability statement
The raw data supporting the conclusions of this article will be made available by the authors, without undue reservation.
Ethics statement
The studies involving human participants were reviewed and approved by The ethics committee of Tongji Hospital Affiliated to Tongji Medical College, Huazhong University of Science and Technology. The patients/participants provided their written informed consent to participate in this study.
Author contributions
XT,CL contributed to conception and design of the study. WZ contributed to supervision. GD contributed to conceptualization. WL optimized the imaging parameters of MAGiC. AS and QZ organized the database. JL, GZ, and LL performed the statistical analysis. HS wrote the first draft of the manuscript, and QL wrote sections of the manuscript. All authors contributed to manuscript revision, read, and approved the submitted version.
Funding
This study has received funding by National Natural Science Foundation of China (51907077, 51877097, 82001782).
Acknowledgments
We acknowledge WZ for supervision and GD for Conceptualization.
Conflict of interest
The authors declare that the research was conducted in the absence of any commercial or financial relationships that could be construed as a potential conflict of interest.
Publisher’s note
All claims expressed in this article are solely those of the authors and do not necessarily represent those of their affiliated organizations, or those of the publisher, the editors and the reviewers. Any product that may be evaluated in this article, or claim that may be made by its manufacturer, is not guaranteed or endorsed by the publisher.
Abbreviations
CSM, cervical spondylotic myelopathy; MCL, maximal compression level; MAGiC, MAGnetic resonance image Compilation; PD, proton density; ROIs, Regions of interest; JOA, Japanese Orthopaedic Association; ICC, Intraclass correlation coefficient; SCS, spinal canal stenosis; AP, anteroposterior; Trans, transverse.
References
Al-Mefty, O., Harkey, L. H., Middleton, T. H., Smith, R. R., and Fox, J. L. (1988). Myelopathic cervical spondylotic lesions demonstrated by magnetic resonance imaging. J. Neurosurg. 68 (2), 217–222. doi:10.3171/jns.1988.68.2.0217
Batzdorf, U., and Flannigan, B. D. (1991). Surgical decompressive procedures for cervical spondylotic myelopathy. A study using magnetic resonance imaging. Spine (Phila Pa 1976) 16 (2), 123–127. doi:10.1097/00007632-199102000-00004
Cui, Y., Han, S., Liu, M., Wu, P. Y., Zhang, W., Zhang, J., et al. (2020). Diagnosis and grading of prostate cancer by relaxation maps from synthetic MRI. J. Magn. Reson Imaging 52 (2), 552–564. doi:10.1002/jmri.27075
Edwards, C. C., Riew, K. D., Anderson, P. A., Hilibrand, A. S., and Vaccaro, A. F. (2003). Cervical myelopathy. current diagnostic and treatment strategies. Spine J. 3 (1), 68–81. doi:10.1016/s1529-9430(02)00566-1
Hagiwara, A., Warntjes, M., Hori, M., Andica, C., Nakazawa, M., Kumamaru, K. K., et al. (2017). SyMRI of the brain: Rapid quantification of relaxation rates and proton density, with synthetic MRI, automatic brain segmentation, and myelin measurement. Invest. Radiol. 52 (10), 647–657. doi:10.1097/rli.0000000000000365
Harkins, K. D., Xu, J., Dula, A. N., Li, K., Valentine, W. M., Gochberg, D. F., et al. (2016). The microstructural correlates of T1 in white matter. Magn. Reson Med. 75 (3), 1341–1345. doi:10.1002/mrm.25709
Jiang, Y., Yu, L., Luo, X., Lin, Y., He, B., Wu, B., et al. (2020). Quantitative synthetic MRI for evaluation of the lumbar intervertebral disk degeneration in patients with chronic low back pain. Eur. J. Radiol. 124, 108858. doi:10.1016/j.ejrad.2020.108858
Kang, Y., Lee, J. W., Koh, Y. H., Hur, S., Kim, S. J., Chai, J. W., et al. (2011). New MRI grading system for the cervical canal stenosis. AJR Am. J. Roentgenol. 197 (1), W134–W140. doi:10.2214/ajr.10.5560
Karpova, A., Craciunas, S., Chua, S. Y., Rabin, D., Smith, S., and Fehlings, M. G. (2010). Accuracy and reliability of MRI quantitative measurements to assess spinal cord compression in cervical spondylotic myelopathy: A prospective study. Evid. Based Spine Care J. 1 (2), 56–57. doi:10.1055/s-0028-1100916
Liu, H., MacMillian, E. L., Jutzeler, C. R., Ljungberg, E., MacKay, A. L., Kolind, S. H., et al. (2017). Assessing structure and function of myelin in cervical spondylotic myelopathy: Evidence of demyelination. Neurology 89 (6), 602–610. doi:10.1212/wnl.0000000000004197
Liu, S., Meng, T., Russo, C., Di Ieva, A., Berkovsky, S., Peng, L., et al. (2021). Brain volumetric and fractal analysis of synthetic MRI: A comparative study with conventional 3D T1-weighted images. Eur. J. Radiol. 141, 109782. doi:10.1016/j.ejrad.2021.109782
Maier, I. L., Hofer, S., Eggert, E., Schregel, K., Psychogios, M. N., Frahm, J., et al. (2020). T1 mapping quantifies spinal cord compression in patients with various degrees of cervical spinal canal stenosis. Front. Neurol. 11, 574604. doi:10.3389/fneur.2020.574604
Maier, I. L., Hofer, S., Joseph, A. A., Merboldt, K. D., Eggert, E., Behme, D., et al. (2019). Quantification of spinal cord compression using T1 mapping in patients with cervical spinal canal stenosis - preliminary experience. Neuroimage Clin. 21, 101639. doi:10.1016/j.nicl.2018.101639
McCormick, J. R., Sama, A. J., Schiller, N. C., Butler, A. J., and Donnally, C. J. (2020). Cervical spondylotic myelopathy: A guide to diagnosis and management. J. Am. Board Fam. Med. 33 (2), 303–313. doi:10.3122/jabfm.2020.02.190195
McCormick, W. E., Steinmetz, M. P., and Benzel, E. C. (2003). Cervical spondylotic myelopathy: Make the difficult diagnosis, then refer for surgery. Clevel. Clin. J. Med. 70 (10), 899–904. doi:10.3949/ccjm.70.10.899
Mehalic, T. F., Pezzuti, R. T., and Applebaum, B. I. (1990). Magnetic resonance imaging and cervical spondylotic myelopathy. Neurosurgery 26 (2), 217–226. discussion 226-217. doi:10.1097/00006123-199002000-00006
Meyer, F., Börm, W., and Thomé, C. (2008). Degenerative cervical spinal stenosis: Current strategies in diagnosis and treatment. Dtsch. Arztebl Int. 105 (20), 366–372. doi:10.3238/arztebl.2008.0366
Moran, C. J. (2021). Editorial for "Investigation of synthetic relaxometry and diffusion measures in the differentiation of benign and malignant breast lesions as compared to BI-RADS. J. Magn. Reson Imaging 53 (4), 1128–1129. doi:10.1002/jmri.27480
Ohshio, I., Hatayama, A., Kaneda, K., Takahara, M., and Nagashima, K. (1993). Correlation between histopathologic features and magnetic resonance images of spinal cord lesions. Spine (Phila Pa 1976) 18 (9), 1140–1149. doi:10.1097/00007632-199307000-00005
Ramanauskas, W. L., Wilner, H. I., Metes, J. J., Lazo, A., and Kelly, J. K. (1989). MR imaging of compressive myelomalacia. J. Comput. Assist. Tomogr. 13 (3), 399–404. doi:10.1097/00004728-198905000-00005
Rao, R. (2002). Neck pain, cervical radiculopathy, and cervical myelopathy - pathophysiology, natural history, and clinical evaluation. J. Bone Jt. Surgery-American 84A (10), 1872–1881. doi:10.2106/00004623-200210000-00021
Sampath, P., Bendebba, M., Davis, J. D., and Ducker, T. B. (2000). Outcome of patients treated for cervical myelopathy. A prospective, multicenter study with independent clinical review. Spine (Phila Pa 1976) 25 (6), 670–676. doi:10.1097/00007632-200003150-00004
Shabani, S., Kaushal, M., Budde, M., Schmit, B., Wang, M. C., and Kurpad, S. (2019). Comparison between quantitative measurements of diffusion tensor imaging and T2 signal intensity in a large series of cervical spondylotic myelopathy patients for assessment of disease severity and prognostication of recovery. J. Neurosurgery-Spine 31 (4), 473–479. doi:10.3171/2019.3.spine181328
Takahashi, M., Sakamoto, Y., Miyawaki, M., and Bussaka, H. (1987). Increased MR signal intensity secondary to chronic cervical cord compression. Neuroradiology 29 (6), 550–556. doi:10.1007/bf00350439
Warntjes, J. B., Leinhard, O. D., West, J., and Lundberg, P. (2008). Rapid magnetic resonance quantification on the brain: Optimization for clinical usage. Magn. Reson Med. 60 (2), 320–329. doi:10.1002/mrm.21635
Zeng, C., Xiong, J., Wang, J. C., Inoue, H., Tan, Y., Tian, H., et al. (2016). The evaluation and observation of "hidden" hypertrophy of cervical ligamentum flavum, cervical canal, and related factors using kinetic magnetic resonance imaging. Glob. Spine J. 6 (2), 155–163. doi:10.1055/s-0035-1557140
Keywords: magnetic resonance image, synthetic, quantitative evaluation, spinal cord, cervical spondylotic myelopathy
Citation: Liu Q, Shao H, Liu C, Liu WV, Saeed A, Zhang Q, Lu J, Zhang G, Li L, Tang X, Du G and Zhu W (2023) Quantitative evaluation of the spinal cord compression in patients with cervical spondylotic myelopathy using synthetic MRI. Front. Physiol. 14:1140870. doi: 10.3389/fphys.2023.1140870
Received: 11 January 2023; Accepted: 27 March 2023;
Published: 10 April 2023.
Edited by:
Silvia Capuani, National Research Council (CNR), ItalyReviewed by:
Matthew ManHin Cheung, CUHK Medical Centre, Hong Kong SAR, ChinaEdvin Zekaj, Galeazzi Orthopedic Institute (IRCCS), Italy
Copyright © 2023 Liu, Shao, Liu, Liu, Saeed, Zhang, Lu, Zhang, Li, Tang, Du and Zhu. This is an open-access article distributed under the terms of the Creative Commons Attribution License (CC BY). The use, distribution or reproduction in other forums is permitted, provided the original author(s) and the copyright owner(s) are credited and that the original publication in this journal is cited, in accordance with accepted academic practice. No use, distribution or reproduction is permitted which does not comply with these terms.
*Correspondence: Xiangyu Tang, dGFuZ3hpYW5neXVkZUAxNjMuY29t
†These authors have contributed equally to this work and share first authorship
 Qiufeng Liu
 Haoyue Shao
 Chaoxu Liu2
 Weiyin Vivian Liu
 Jun Lu
 Guiling Zhang
 Xiangyu Tang
 Wenzhen Zhu