
94% of researchers rate our articles as excellent or good
Learn more about the work of our research integrity team to safeguard the quality of each article we publish.
Find out more
ORIGINAL RESEARCH article
Front. Physiol., 22 March 2023
Sec. Computational Physiology and Medicine
Volume 14 - 2023 | https://doi.org/10.3389/fphys.2023.1116878
This article is part of the Research TopicWearable Sensors Role in Promoting Health and Wellness via Reliable and Longitudinal MonitoringView all 7 articles
 Shashwati Geed1,2*†
 Megan L. Grainger2Abigail Mitchell2
 Cassidy C. Anderson2Henrike L. Schmaulfuss3Seraphina A. Culp3Eilis R. McCormick3Maureen R. McGarry3Mystee N. Delgado3Allysa D. Noccioli3Julia Shelepov3
 Alexander W. Dromerick1,2
 Peter S. Lum2,3
Objective: This study aims to investigate the validity of machine learning-derived amount of real-world functional upper extremity (UE) use in individuals with stroke. We hypothesized that machine learning classification of wrist-worn accelerometry will be as accurate as frame-by-frame video labeling (ground truth). A second objective was to validate the machine learning classification against measures of impairment, function, dexterity, and self-reported UE use.
Design: Cross-sectional and convenience sampling.
Setting: Outpatient rehabilitation.
Participants: Individuals (>18 years) with neuroimaging-confirmed ischemic or hemorrhagic stroke >6-months prior (n = 31) with persistent impairment of the hemiparetic arm and upper extremity Fugl-Meyer (UEFM) score = 12–57.
Methods: Participants wore an accelerometer on each arm and were video recorded while completing an “activity script” comprising activities and instrumental activities of daily living in a simulated apartment in outpatient rehabilitation. The video was annotated to determine the ground-truth amount of functional UE use.
Main outcome measures: The amount of real-world UE use was estimated using a random forest classifier trained on the accelerometry data. UE motor function was measured with the Action Research Arm Test (ARAT), UEFM, and nine-hole peg test (9HPT). The amount of real-world UE use was measured using the Motor Activity Log (MAL).
Results: The machine learning estimated use ratio was significantly correlated with the use ratio derived from video annotation, ARAT, UEFM, 9HPT, and to a lesser extent, MAL. Bland–Altman plots showed excellent agreement between use ratios calculated from video-annotated and machine-learning classification. Factor analysis showed that machine learning use ratios capture the same construct as ARAT, UEFM, 9HPT, and MAL and explain 83% of the variance in UE motor performance.
Conclusion: Our machine learning approach provides a valid measure of functional UE use. The accuracy, validity, and small footprint of this machine learning approach makes it feasible for measurement of UE recovery in stroke rehabilitation trials.
The cornerstone of rehabilitation effectiveness lies in the answer to “how much did the individual use their affected upper extremity (UE) during functional activities in their environment?” Stroke rehabilitation trialists evaluate UE motor performance using clinical scales such as the Action Research Arm Test (ARAT) (Stinear et al., 2020) or self-reports of spontaneous UE use such as the Motor Activity Log (MAL) (Uswatte et al., 2006b). However, there are contextual differences between real-world UE use and UE motor performance in the clinic, completed following precise instructions as in the ARAT. In-clinic performance (capacity) does not always translate well to real-world use (performance) (Lundquist et al., 2022). The MAL suffers from biases associated with self-report scales (Prince et al., 2008) and disordered item difficulties that make the use of summed MAL scores a problem in measuring a meaningful change in clinical trials (van der Lee et al., 2004; Chuang et al., 2017). Furthermore, correlations between accelerometry, using the count thresholding method to quantify the amount of UE use, and the MAL are 0.52 (Uswatte et al., 2006a). Correlations between the ARAT and the MAL are reported to be 0.6 (van der Lee et al., 2004). Thus, the MAL has only fair to moderate validity and sensitivity for measuring real-world UE use (Uswatte et al., 2006b; Hammer and Lindmark, 2010). These limitations in clinical and self-report scales emphasize the need for alternative methods of directly measuring real-world functional use of the extremities.
Accelerometry is portable, unobtrusive, and suitable for 24/7 monitoring of patient activity. In the present report, to better quantify functional UE use in the community, we have advanced current accelerometry methods by validating a machine learning approach to classify UE movement as “functional” or “non-functional” in individuals with persistent motor impairment due to stroke at least 6 months prior (McLeod et al., 2016; Bochniewicz et al., 2017; Lum et al., 2020). Conventionally, quantifying UE use requires frame-by-frame video labeling for ground-truth validation. Video labeling, although ideal, is tedious and time-consuming, which makes it impractical for extended periods of home monitoring. Our machine learning approach identifies the amount of functional UE use in accelerometry data (test set) based on features of meaningful UE use extracted from a training dataset (labeled frame-by-frame using video ground truth). This advancement allows the estimation of functional UE use instead of just movement counts using accelerometry. In the present report, our purpose was to establish the concurrent validity of our machine learning estimate of functional UE use with respect to clinical measures of UE motor function (ARAT) and self-reported UE use (MAL). We hypothesized that machine learning-estimated characterization of real-world UE use will show significantly high correlation (r > 0.7) with ARAT and self-reported UE use. In a subset of the sample, we also validated our machine learning estimates with clinical measures of impairment (UEFM) and manual dexterity (nine-hole peg test) (Reuben et al., 2013; Wang et al., 2015).
Individuals were recruited from the MedStar National Rehabilitation Hospital in Washington, DC. The inclusion criteria were 1) neuroimaging-confirmed ischemic or hemorrhagic stroke at least 6 months prior to study enrollment, 2) age >18 years old, 3) no known orthopedic or neuromuscular injuries that interfered with completion of study procedures, and 4) Mini-Mental Status Examination score >24 (Cumming et al., 2013). Individuals were excluded if 1) they exhibited neglect as determined by an asymmetry >3 errors on the Mesulam’s symbol cancellation test (Mesulam, 1985), 2) experienced dense sensory loss (NIHSS sensory item score ≥2) (Brott et al., 1989), 3) had prior stroke with persistent motor impairments, and 4) received botulinum toxin within 6 months of stroke or during study participation. The study was approved by the MedStar-Georgetown Universities Institutional Ethics Committee. All individuals provided written informed consent.
Sample sizes were calculated using the software program G*Power (Faul et al., 2007) to test if use ratios were significantly correlated with the Action Research Arm Test scale to demonstrate concurrent validity. We used a moderate effect size (0.4), power = 0.8, and alpha = 0.05/2, leading to a required sample size of approximately 17 participants. For a power of 0.95 at alpha = 0.05/2, we would have required a sample of approximately 30 participants. We report results from a cohort of 31 stroke patients with a wide range of UE motor impairments measured by ARAT.
Data were collected over a single session when participants completed the activity script (Lum et al., 2020) and tests of UE motor function (ARAT) (van der Lee et al., 2001; Yozbatiran et al., 2008) impairment via UEFM (Fugl-Meyer et al., 1975; Weerdt and Harrison, 1985; Duncan et al., 1992) and manual dexterity (nine-hole peg test) (Wang et al., 2011; Reuben et al., 2013; Wang et al., 2015). Participants also completed the Motor Activity Log(MAL), a self-reported outcome of “how much” the impaired UE was used in the previous 7 days (Uswatte et al., 2006b). Ten out of 31 participants completed only the activity script and the ARAT, whereas the remaining participants completed all tests. Data from these 10 participants were part of a prior publication (Lum et al., 2020).
Wireless accelerometers (ActiGraph GT9X Link, Pensacola, FL), similar in appearance to a smartwatch, were worn on both wrists. The accelerometers are sensitive to movement in three axes, and raw acceleration is sampled and stored internally at 50 Hz.
Activity script: all participants completed the activity script, a set of activities and instrumental activities of daily living (ADLs/IADLs), to simulate functional UE use in the community. These procedures have been described previously (Lum et al., 2020). The activity script was completed in a simulated apartment in an outpatient rehabilitation setting (Figure 1). The simulated apartment houses a fully functional “living space,” including a kitchen, bedroom, store for shopping activities, and a car to practice transfers. Individuals were instructed to perform the following IADLs: 1) laundry task, 2) linen management and folding, 3) grocery shopping, 4) kitchen task, 5) financial management, 6) medication management, and 7) typing task (see Supplementary Table S1).
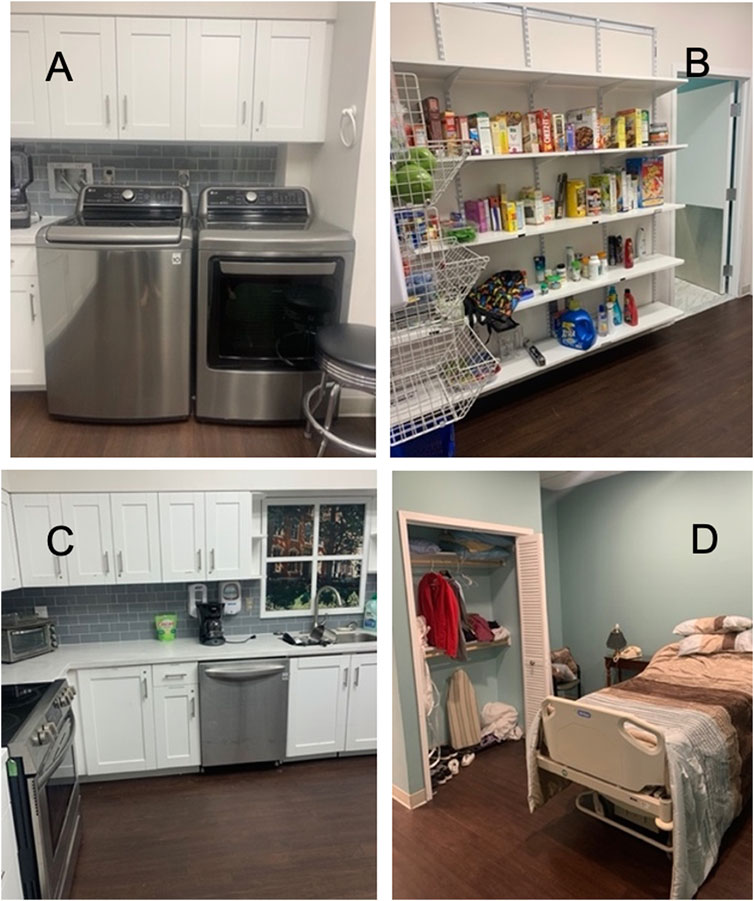
FIGURE 1. Simulated apartment in outpatient rehabilitation. (A) Laundry task. (B) Shopping task. (C) Kitchen task. (D) Bed-making and laundry-folding tasks. Activity scripts are completed using the facilities at MedStar National Rehabilitation Hospital, Washington DC.
Participants performed the activity script tasks as they would naturally complete them at home. No specific instructions were given as to which arm to use for any task. Between the activity script tasks, when participants sat, experimenters engaged them in conversation, and they walked around the facility to collect non-functional UE use data. There was no set time limit to complete the activity script. Participants wore the sensors throughout the experiment and were videotaped at 30 Hz.
The video was annotated by trained research assistants using a standardized coding scheme based on the Functional Arm Activity Behavioral Observation System (FAABOS) (Uswatte and Hobbs Qadri, 2009). Three independent annotators watched the video. All frames were labeled according to the five FAABOS categories and subsequently collapsed into three categories: functional, non-functional, or unknown. The functional category included gesturing, reaching to grasp, pushing open a door, etc. The non-functional category included arm movements associated with gait, sit-to-stand, or whole-body movement that did not include functional arm movement. No movement was labeled non-functional. Each limb was coded separately, and the final coding for each video frame was determined by a majority vote. The final coding values allowed calculation of %functional use ratio: %functional use in the paretic limb normalized to the less-affected limb. Video-annotated use ratios are referred to as ground-truth use ratios.
The video was synchronized with accelerometry data, and ground-truth labels of functional or non-functional activity were transferred to the accelerometry data. Synchronization of accelerometry and video was achieved by oscillating the accelerometers rapidly in the z direction of the sensors five times prior to placing them on the subject and again after their removal. This created five large peaks in the z-axis data that were easily identified and marked. The sensor peaks correspond to reversal points in the oscillation, which were marked on the video. Data were partitioned into 2-second blocks. If >90% of labels within the block were the same class (functional or non-functional), the entire block was labeled accordingly. The remainder of the blocks were not used for training the model but were used during the testing phase. We computed 17 features from each 2-second block of sensor data. Similar to prior reports, the features were mean, variance, maximum and minimum of each accelerometer axis, Shannon entropy and mean, variance, and maximum and minimum of the Euclidean norm of the three accelerometer axes (Lum et al., 2020). We built a separate model for each limb, using stratified 5-fold cross-validation testing. We used a random forest classifier because in prior work, this approach yielded the highest overall accuracy. Importantly, when calculating accuracy and %functional use ratio, the classifier was applied to data that are not part of the training set used to train the model, simulating the case where a model trained on labeled data collected in the lab can be applied to accelerometry data collected in the home and community. Machine learning-estimated use ratios are referred to as the estimated use ratios.
For each random forest classifier, we calculated several performance metrics assuming functional use as the positive class and non-functional as the negative class. Accuracy is the ratio of correct classifications to total cases. Sensitivity is the ratio of true-positive classifications to all positive cases. Specificity is the ratio of true-negative classifications to all negative cases.
We calculated the accuracy of machine learning-estimated use-ratio variables with respect to the ground-truth use ratios. Concurrent validity was assessed between estimated use ratios and ARAT in all participants (n = 31) using Pearson’s correlation coefficients. UEFM, nine-hole peg test, and MAL scores were available in a subset of the sample (n = 21); these were used to evaluate the validity of the estimated use ratios with respect to impairment, manual dexterity, and self-reported UE use, respectively. An r value ≥ 0.7 was considered a high correlation (Portney and Watkins, 2009).
To evaluate if our accelerometry approach measures the same construct as the clinical scales, factor analysis was applied to UE clinical measures and accelerometry data. A principal component analysis with varimax factor rotation was applied to ARAT, UEFM, nine-hole peg test, MAL scores, video-labeled accelerometry use ratio, and machine learning-estimated use ratios. Factors were retained if the eigenvalue exceeded 1. We also redefined the factor analysis to extract at least two factors irrespective of the eigenvalues to test if accelerometry measures are still separated from the clinical measures in an independent component.
Bland–Altman plots were used to estimate the degree of agreement between use ratios calculated with the machine learning algorithms versus video-labeled use ratios. Bland–Altman is a quantitative method to evaluate the agreement between two different approaches to measure the same construct. We calculated the mean difference between use ratios calculated by machine learning or video-labeled data (bias) and the standard deviation of the difference (random fluctuations around this mean difference). In addition, we computed the limits of agreement between methods as the 95% confidence intervals around the mean difference.
Demographic, clinical, and UE activity characteristics of the participants are shown in Table 1. We enrolled 31 individuals (22 male, mean age ± SD = 60.38 ± 11.94 year, range = 32–83 year) with ischemic or hemorrhagic stroke (mean time since stroke = 23.8 ± 22.5 months). Participants showed moderate UE impairment, with mean ARAT ± SD = 28.96 ± 14.41, UEFM = 41.8 ± 9.4, and nine-hole peg test average time (sec) = 166.2 ± 117.5 s. Average MAL scores = 1.67 ± 1.07.
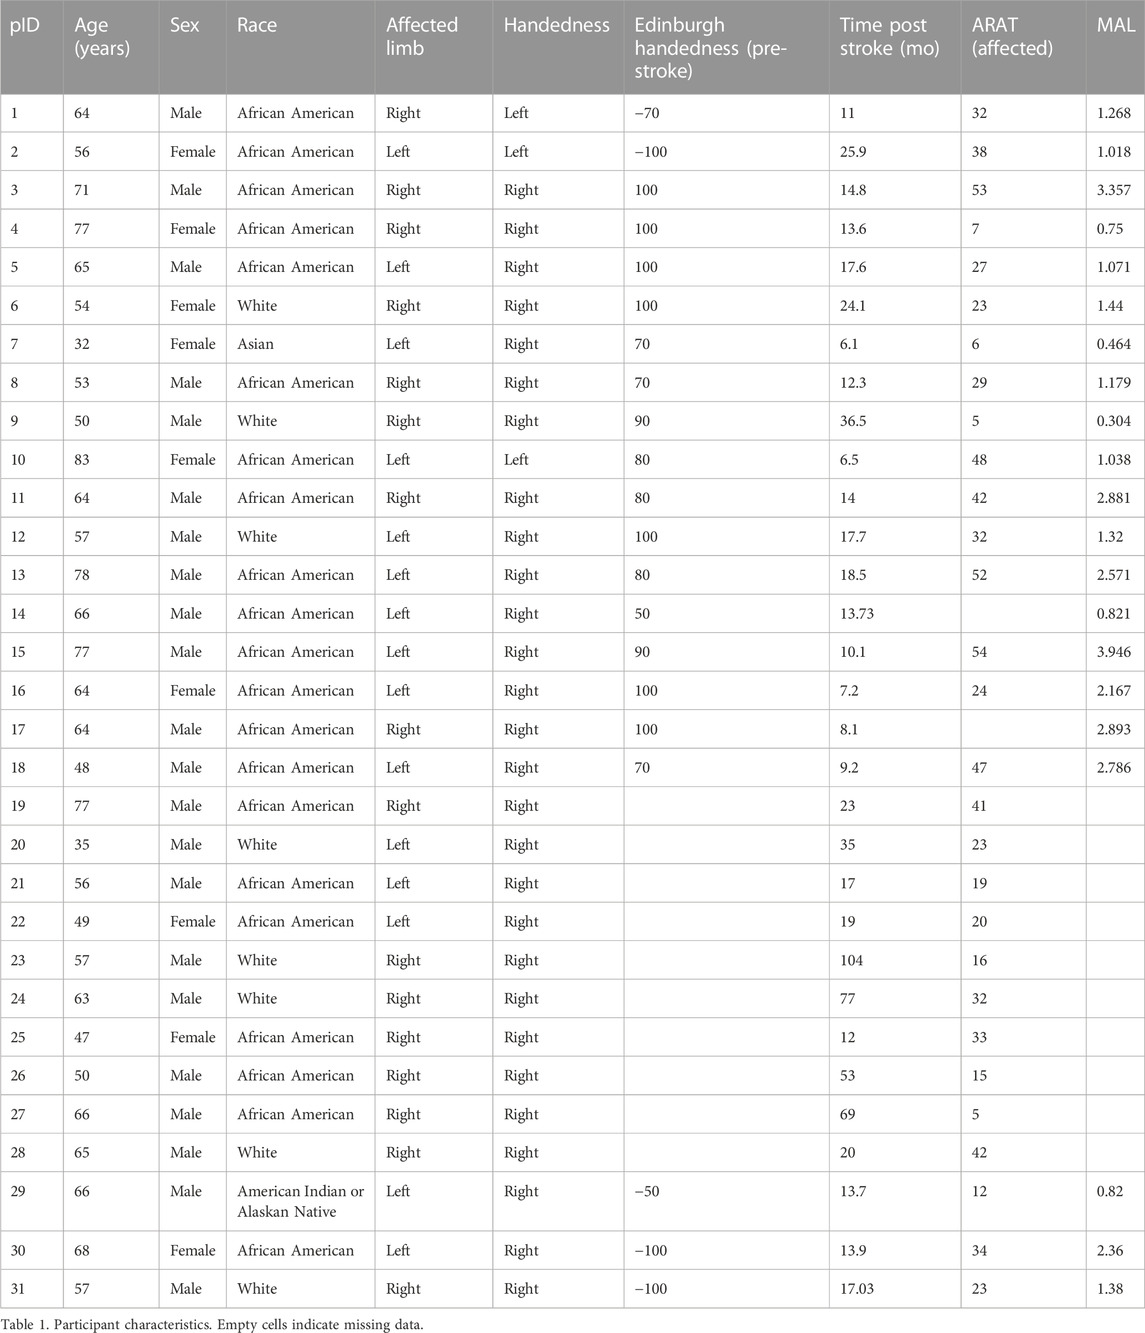
TABLE 1. Stroke participant demographic, stroke-related, and impairment data.
The performance metrics for the classifier can be found in Supplementary Table S2. Average accuracy (SD) was 90.9% (4.8) in the paretic limb and 94.6% (6.2) in the less-affected limb. Sensitivity was 90.2% (6.5) in the paretic limb and 96% (4.4) in the less-affected limb. Specificity was 89.8% (6.0) and 91.9% (9.9). The video-based and estimated use ratios can be found in Supplementary Table S3. The 95% confidence interval for error in the estimated use ratio was (0.32%–2.26%), indicating that the model, on average, slightly underestimates the functional use ratio.
Table 2 shows Pearson’s correlation between machine learning-estimated use ratio with corresponding measures from video-labeled ground truth data, ARAT, UEFM, nine-hole peg test, and MAL. Machine learning-estimated use ratio was significantly correlated with video-labeled use ratio (r = 0.99, p < 0.001), ARAT (r = 0.82, p < 0.001), UEFM (r = 0.77, p < 0.001), nine-hole peg test (r = −0.77, p < 0.001), and MAL (r = 0.61, p = 0.001).
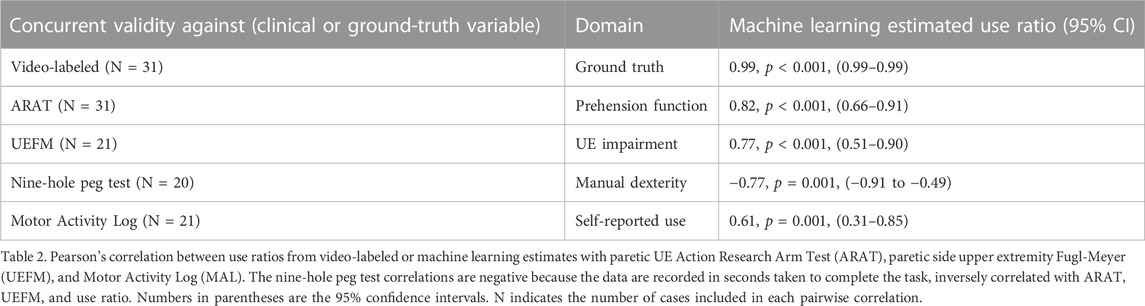
TABLE 2. Pearson’s correlations between clinical measures and UE use ratio.
Figure 2 shows scatter plots of video-labeled or machine learning estimates of UE use ratio with ARAT (Figure 2A) and MAL (Figure 2B). ARAT and use ratios showed a significant linear line of best fit (R2 = 0.63). MAL showed a significant linear line of best fit with R2 = 0.34.
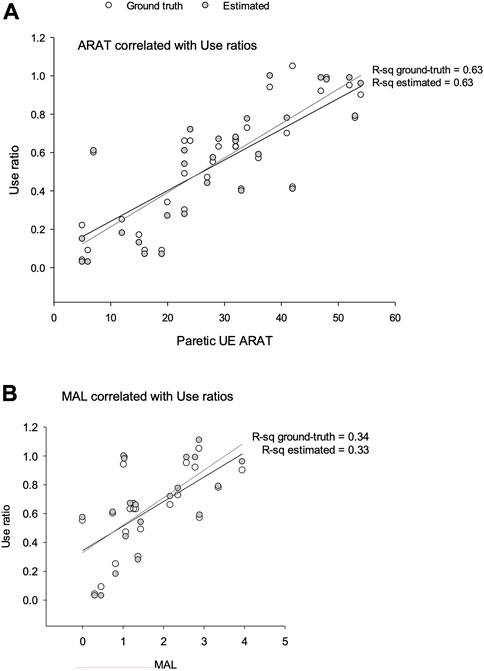
FIGURE 2. Scatter plots of video-labeled or estimated use ratios with (A) ARAT and (B) MAL.
A factor analysis was applied to UE behavioral measures to determine if use ratios measured the same construct as the clinical scales. We found a single factor with eigenvalues >1 and high factor loadings on the MAL, UEFM, ARAT, nine-hole peg test, and use ratios; this component explained 83% of the variance in UE motor performance. We also tested if redefining the factor analysis to extract two factors leads to use ratios splitting from the clinical scales given in our prior report (Barth et al., 2020). Table 3 shows varimax rotated factor loadings from 1- or 2-component factor solutions. The 2-factor solution accounted for 94% of the variability in UE behavioral outcomes, with use ratios, UEFM, and ARAT showing high factor loadings on component 1. MAL and nine-hole peg test showed high loading on a second maximally independent component.
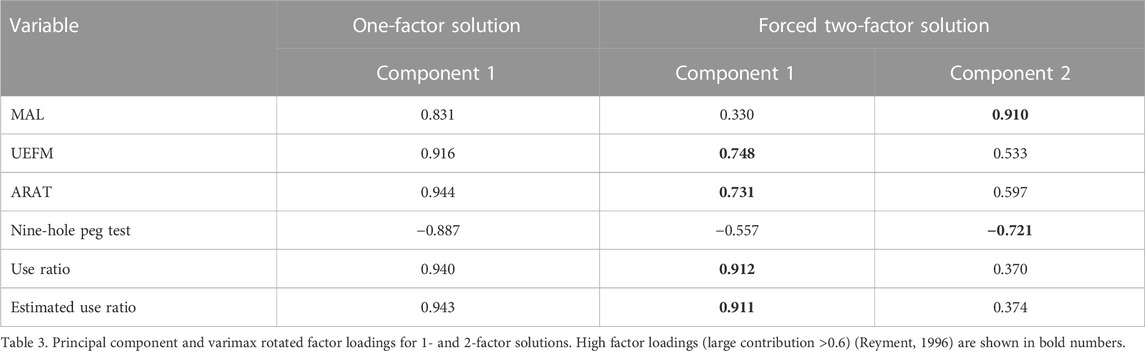
TABLE 3. Principal component loadings for 1- and 2-factor solutions.
The Bland–Altman plot (Bland and Altman, 1986) quantifies the agreement between two variables measuring the same construct. The Bland–Altman plot in Figure 3 shows, for each individual, the difference between video-labeled versus machine learning use ratios [mean difference ± SD = 0.004 ± 0.04 (95% CI = 0.08, −0.08)] as a function of the average use ratio calculated with two methods (0.54 ± 0.31). All but one data points fall inside the Bland–Altman limits of agreement, which suggests an excellent agreement between video-labeled and machine learning estimates of use ratio.
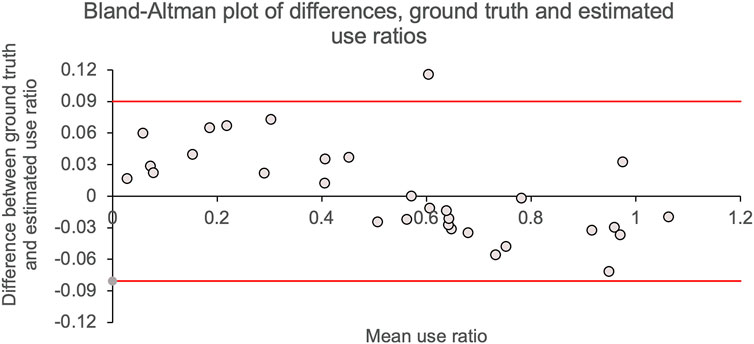
FIGURE 3. Bland–Altman plots. Difference in use ratios calculated using machine learning versus video-labeled accelerometry data are shown on the y-axis. The mean of use ratios calculated using machine learning and video-labeled accelerometry are shown on the x-axis. Solid gray line shows mean difference (mean ± SD = 0.004 ± 0.0.04) between use ratios calculated by the two methods; solid red lines show the 95% CI for the mean difference.
Machine learning predictions of functional UE use were highly correlated with video-based annotations (r = .99). This demonstrates that a classifier based on accelerometry features can very accurately detect periods of functional limb use in participants across a wide range of UE impairments. The amount of paretic limb functional use correlated significantly with clinical scales of impairment (Fugl-Meyer), function (ARAT), and manual dexterity (nine-hole peg test with r values between 0.77 and 0.82), while correlations with the MAL were lower (r = 0.61) but still significant. These results confirm the validity of the accelerometry method against existing clinical scales. The high correlations with clinical function scales and accuracy against ground-truth video annotation reflect the improvement our approach brings to accelerometry: accurate quantification of functional UE use in chronic stroke with a relatively small burden of frame-by-frame video labeling.
In prior work, we tested the performance of machine learning algorithms that separate functional from non-functional periods in accelerometry data using video annotation as ground truth and compared machine learning classifiers with the conventional count thresholding method. In this study, we applied the best-performing machine learning classifier to a larger sample of stroke participants that spanned the full impairment range and tested for concurrent validity against other clinical scales. In previously reported work, we demonstrated the feasibility of using a single wrist-worn accelerometer to detect periods of functional arm activity in a sample of 10 severe-moderately impaired stroke subjects and 10 controls (Bochniewicz et al., 2017). Using a random forest classifier, subject-specific models had accuracies of 94.8% in controls and 88.4% in the affected limb of stroke participants. In leave-one-out modeling, accuracies were 91.5% in controls and 70.2% in stroke patients. In a follow-up study, we analyzed data from the less-affected limb and the paretic limb in order to calculate ratio metrics, explored a variety of different classifiers, features, and epoch lengths (1–5 s), and compared machine learning to the conventional counts thresholding method for detecting functional use (Tran et al., 2018; Lum et al., 2020). We found that the best-performing model was random forest, which had subject-specific modeling accuracies of 96.1% and 92.6% in controls and stroke subjects, respectively. Accuracy in the dominant limb of controls and less-affected limb of stroke subjects was higher at 96.6% and 94.6%, respectively. Importantly, when calculating the functional use ratio between paretic and less-affected limbs, the conventional count method dramatically overestimated the ratio when compared to video-based ground truth. Subsequent analysis showed this overestimation was caused by the misclassification of non-functional limb movements (whole-body movements) that exceeded the threshold in the count method. In contrast, functional use ratios based on machine learning were highly accurate, with correlations of r = 99 with ground truth. In this study, we only focused on subject-specific modeling and expanded the sample size from 10 to 31 stroke participants spanning the full range of UE impairment. With this larger sample, the random forest classifier accuracies were comparable to prior reports, at 94.6% in the less-affected limb and 90.9% in the paretic limb. The functional use ratio continues to be highly correlated with ground truth (r = 99). This larger sample allowed concurrent validity testing, comparing the functional use ratio to clinical scales. We found significant correlations with tests of impairment (FM), function (ARAT), and self-reported amount of functional use (MAL), establishing concurrent validity.
Our results are consistent with prior studies reporting significant correlations between accelerometry-based metrics and clinical scales. A recent review paper of 34 studies reported a wide range of correlations between accelerometry and the MAL (0.31 < r < 0.84) and between accelerometry and the ARAT (0.15 < r < 0.79) (Heye et al., 2022). Our correlations are at the high end of the ARAT range reported by this review and near the middle of the range for the MAL. The large variability in these reported r values is concerning, especially for the MAL, which one would expect to have the strongest correlation with accelerometry. The large variability in prior studies could be due in part to the accelerometers responding to whole-body movements that do not incorporate functional use of the paretic limb. We previously found that the count method grossly overestimates the duration of functional UE movement compared to the ground truth based on video annotation (McLeod et al., 2016). This was due to the movement of the wrist-mounted accelerometers resulting from whole-body movements, such as ambulation. Normalizing by values from the opposite limb did not improve the estimate. Contamination of the accelerometer measurement from whole-body movements was also reported by Regterschot et al. (2021), and some methods rely on a third accelerometer on the thigh to eliminate periods of ambulation (Heye et al., 2022). Importantly, our machine learning approach overcomes these limitations by training a model that rejects accelerometer patterns from whole-body movements and only specifically detects periods of functional limb use during activities and instrumental activities of daily living.
A recent publication by Pohl et al. (2022) separated functional from non-functional movements during ADL performance in the home in individuals with stroke. They compared conventional count thresholding, optimal thresholding, and a logistic regression classifier applied to multiple IMU sensor signals. They report classification accuracy of around 80% when using an optimal threshold (>20.1 and >38.6 counts for the affected and less-affected sides, respectively). The machine learning classifier achieved similar accuracy in leave-one-out testing. Both these methods were found to be superior to the conventional thresholding method (>2 counts). Their optimal thresholding method can significantly increase the accuracy of metrics targeting the amount of functional limb use by removing slow movements that are not likely functional in nature and has the advantage of easy implementation on already collected data sets. One important difference between Pohl and our study is that their study is testing the performance of several classification schemes against video annotations. We also report the performance of our random forest classifier against video annotation ground truth, but the main purpose of our study is testing concurrent validity, correlating our results with several clinical scales. The Pohl study notes that in future work, concurrent validity with benchmark clinical outcome measures is needed. An important technical difference between studies is that their non-functional category includes minimal motion, while a third category of whole-body movements (gait, transfers, etc.) was excluded from the analysis. They note that detection and removal of whole-body movements in a pre-processing step might be needed before applying their optimal thresholding scheme; otherwise, these movements might be misclassified as functional. In contrast, our non-functional class includes minimal or no movement, and arm movements resulting from whole-body movements. So our classifier is already attempting to classify whole-body movements as non-functional, based on sensor data, and another level of pre-processing is not needed. Future work is needed to determine which approach is superior.
Our prior report on accelerometry outcomes within the first week of stroke showed conventionally used accelerometry counts, and the clinical scales (UEFM/ARAT) fall along two independent axes reflecting “quantity” (use ratio) versus “quality” (UEFM/ARAT) of movement (Barth et al., 2020). In the current report, factor analysis showed a single construct containing UEFM, ARAT, nine-hole peg test scores, MAL, and estimated use ratios, which captured 83% of the variance in impaired limb activity. Thus, the estimated use ratio captures a similar construct as the clinical scales, unlike the counts approach. Figure 4 shows the component plots from the 2-factor solution: MAL is relatively closer to component 2 in the rotated factor space, whereas the use ratio is closer to component 1. ARAT and UEFM fall along the midline between components 1 and 2, whereas the nine-hole peg test mirrors ARAT/UEFM scores along the negative axes being inversely correlated with ARAT and UEFM. Thus, the forced 2-factor solutions suggest differences in measurement properties of the MAL compared to functional UE use, and further investigation is warranted.
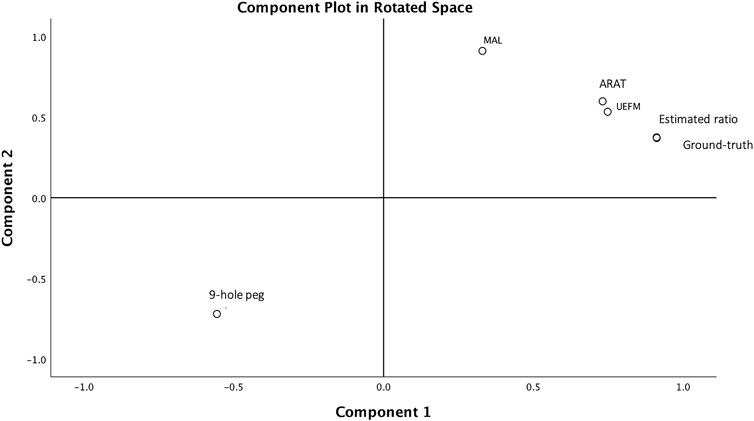
FIGURE 4. Component plot in rotated factor space. A single component accounts for 83% of the variance in UE behavioral measures of UEFM, ARAT, nine-hole peg test, self-reported MAL, and the use ratios. This is evidenced on the component plot. Forcing a 2-component solution results in MAL and nine-hole peg test scores splitting from the UEFM, ARAT, and use ratios, evidenced by MAL falling closer to component 1 axis, as shown here.
In our data, more than 37% of the variance in paretic limb use was not explained by ARAT scores (R-sq = 0.63). Importantly, examination of the scatter plots in Figure 2A shows that participants with similar ARAT scores can have very different paretic limb use patterns. For example, four subjects had ARAT scores between 38 and 42, but had a paretic limb use ratio between 0.42 and 1.1. Similarly, six subjects had functional use scores between 0.57 and 0.63, and ARAT scores that ranged from 7 to 36. These differences between ARAT and accelerometry, despite them measuring the same construct (as indicated by the factor analysis in present report), may result from the differing resolutions of measurement provided by accelerometry vs ARAT. Additionally, in ARAT, subtasks of varying difficulties are graded on a 0-1-2 Likert scale, and a sum score is created by simple summation assuming a 1-unit increase on easier and more difficult items representing the same amount of recovery. This approach, at least in the UEFM leads to significant measurement errors (Geed et al., 2020). The discrepancy between clinical scales and the range of actual UE use is particularly problematic for clinical studies that use neuroimaging or neurophysiology with ARAT/UEFM to understand the mechanisms of post-stroke recovery. If commonly used clinical scales do not capture true UE use, results from neurophysiology may be confounded by using only the ARAT or UEFM as the proxy for recovery.
These data were collected in a simulated apartment during outpatient rehabilitation. Our next step is to acquire 24-h accelerometry data from individuals with stroke living in the community who engage in the full spectrum of ADLs/IADLs to better validate our machine learning methods for measurement of UE motor function post-stroke. In terms of the potential adoption of this method, the need for video annotation to train subject-specific classifiers limits the applicability of this method to clinical practice. However, use in clinical trials is possible, as the data collection only takes around 30 min, and a trained annotator can complete an activity script in about 2.3 h. We are currently investigating a generalizable model that can be applied to new participant data without the need for subject-specific video annotation. This may be possible if the sample size can be further increased.
We validated an approach to monitor long periods of functional arm use via accelerometers and using a machine learning classifier trained on a short period of annotated video. Our results demonstrate the feasibility of this method for the measurement of UE motor recovery in stroke rehabilitation trials.
The raw data supporting the conclusion of this article will be made available by the authors, without undue reservation.
The studies involving human participants were reviewed and approved by the Georgetown-MedStar IRB System. The patients/participants provided their written informed consent to participate in this study.
SG, AWD, PSL contributed to design of this work. All authors contributed to the data acquisition and analysis. SG, PSL wrote the draft for the manuscript and prepared figures. All coauthors revised and edited the manuscript. All authors approved the final draft of the manuscript and agree to be accountable for all aspects of the work.
This work was supported by the Department of Health and Human Services (NIDILRR; Grant Number 90REGE0004) and the NIH/NICHD National Center for Medical Rehabilitation Research Neural Rehabilitation and Restorative Neuroscience Training Network K12HD093427.
The authors declare that the research was conducted in the absence of any commercial or financial relationships that could be construed as a potential conflict of interest.
All claims expressed in this article are solely those of the authors and do not necessarily represent those of their affiliated organizations, or those of the publisher, the editors, and the reviewers. Any product that may be evaluated in this article, or claim that may be made by its manufacturer, is not guaranteed or endorsed by the publisher.
The Supplementary Material for this article can be found online at: https://www.frontiersin.org/articles/10.3389/fphys.2023.1116878/full#supplementary-material
Barth, J., Geed, S., Mitchell, A., Lum, P. S., Edwards, D. F., and Dromerick, A. W. (2020). Characterizing upper extremity motor behavior in the first week after stroke. PLoS One 15, e0221668. doi:10.1371/journal.pone.0221668
Bland, J., and Altman, D. (1986). Statistical methods for assessing agreement between two methods of clinical measurement. Lancet 1, 307–310. doi:10.1016/s0140-6736(86)90837-8
Bochniewicz, E. M., Emmer, G., Mcleod, A., Barth, J., Dromerick, A. W., and Lum, P. (2017). Measuring functional arm movement after stroke using a single wrist-worn sensor and machine learning. J. Stroke Cerebrovasc. Dis. 26, 2880–2887. doi:10.1016/j.jstrokecerebrovasdis.2017.07.004
Brott, T., Adams, H. P., Olinger, C. P., Marler, J. R., Barsan, W. G., Biller, J., et al. (1989). Measurements of acute cerebral infarction: A clinical examination scale. Stroke 20, 864–870. doi:10.1161/01.str.20.7.864
Chuang, I.-C., Lin, K.-C., Wu, C.-Y., Hsieh, Y.-W., Liu, C.-T., and Chen, C.-L. (2017). Using rasch analysis to validate the motor activity log and the lower functioning motor activity log in patients with stroke. Phys. Ther. 97, 1030–1040. doi:10.1093/ptj/pzx071
Cumming, T. B., Churilov, L., Linden, T., and Bernhardt, J. (2013). Montreal Cognitive Assessment and Mini-Mental State Examination are both valid cognitive tools in stroke. Acta Neurol. Scand. 128, 122–129. doi:10.1111/ane.12084
Duncan, P. W., Goldstein, L. B., Matchar, D., Divine, G. W., and Feussner, J. (1992). Measurement of motor recovery after stroke. Outcome assessment and sample size requirements. Stroke 23, 1084–1089. doi:10.1161/01.str.23.8.1084
Faul, F., Erdfelder, E., Lang, A.-G., and Buchner, A. (2007). G*Power 3: A flexible statistical power analysis program for the social, behavioral, and biomedical sciences. Behav. Res. Methods 39, 175–191. doi:10.3758/bf03193146
Fugl-Meyer, A. R., Jaasko, L., Leyman, I., Olsson, S., and Steglind, S. (1975). The post-stroke hemiplegic patient. 1. a method for evaluation of physical performance. Scand. J. Rehabil. Med. 7, 13–31.
Geed, S., Lane, C. J., Nelsen, M. A., Wolf, S. L., Winstein, C. J., and Dromerick, A. W. (2020). Inaccurate use of the upper extremity fugl-meyer negatively affects upper extremity rehabilitation trial design: Findings from the ICARE randomized controlled trial. Arch. Phys. Med. Rehabil. 102, 270–279. doi:10.1016/j.apmr.2020.08.019
Hammer, A. M., and Lindmark, B. (2010). Responsiveness and validity of the Motor Activity Log in patients during the subacute phase after stroke. Disabil. Rehabil. 32, 1184–1193. doi:10.3109/09638280903437253
Heye, A. L., Kersting, C., Kneer, M., and Barzel, A. (2022). Suitability of accelerometry as an objective measure for upper extremity use in stroke patients. BMC Neurol. 22, 220. doi:10.1186/s12883-022-02743-w
Lum, P. S., Shu, L., Bochniewicz, E. M., Tran, T., Chang, L. C., Barth, J., et al. (2020). Improving accelerometry-based measurement of functional use of the upper extremity after stroke: Machine learning versus counts threshold method. Neurorehabil Neural Repair 34, 1078–1087. doi:10.1177/1545968320962483
Lundquist, C. B., Nguyen, B. T., Hvidt, T. B., Stabel, H. H., Christensen, J. R., and Brunner, I. (2022). Changes in upper limb capacity and performance in the early and late subacute phase after stroke. J. Stroke Cerebrovasc. Dis. 31, 106590. doi:10.1016/j.jstrokecerebrovasdis.2022.106590
Mcleod, A., Bochniewicz, E. M., Lum, P. S., Holley, R. J., Emmer, G., and Dromerick, A. W. (2016). Using wearable sensors and machine learning models to separate functional upper extremity use from walking-associated arm movements. Arch. Phys. Med. Rehabil. 97, 224–231. doi:10.1016/j.apmr.2015.08.435
Mesulam, M.-M. (1985). Dementia: Its definition, differential diagnosis, and subtypes. JAMA 253, 2559–2561. doi:10.1001/jama.1985.03350410125033
Pohl, J., Ryser, A., Veerbeek, J. M., Verheyden, G., Vogt, J. E., Luft, A. R., et al. (2022). Classification of functional and non-functional arm use by inertial measurement units in individuals with upper limb impairment after stroke. Front. Physiology 13, 952757. doi:10.3389/fphys.2022.952757
Portney, L. G., and Watkins, M. P. (2009). Foundations of clinical research: Applications to practice. Saddle River, NJ: Pearson/Prentice Hall Upper.
Prince, S. A., Adamo, K. B., Hamel, M. E., Hardt, J., Connor Gorber, S., and Tremblay, M. (2008). A comparison of direct versus self-report measures for assessing physical activity in adults: A systematic review. Int. J. Behav. Nutr. Phys. Act. 5, 56. doi:10.1186/1479-5868-5-56
Regterschot, G. R. H., Selles, R. W., Ribbers, G. M., and Bussmann, J. B. J. (2021). Whole-body movements increase arm use outcomes of wrist-worn accelerometers in stroke patients. Sensors (Basel) 21, 4353. doi:10.3390/s21134353
Reuben, D. B., Magasi, S., Mccreath, H. E., Bohannon, R. W., Wang, Y. C., Bubela, D. J., et al. (2013). Motor assessment using the NIH Toolbox. Neurology 80, S65–S75. doi:10.1212/WNL.0b013e3182872e01
Reyment, R. J. K. G. (1996). Applied factor analysis in the natural sciences. Cambridge: Cambridge University Press.
Stinear, C. M., Lang, C. E., Zeiler, S., and Byblow, W. D. (2020). Advances and challenges in stroke rehabilitation. Lancet Neurol. 19, 348–360. doi:10.1016/S1474-4422(19)30415-6
Tran, T., Chang, L. C., Almubark, I., Bochniewicz, E. M., Shu, L., Lum, P. S., et al. (2018). “Robust classification of functional and nonfunctional arm movement after stroke using a single wrist-worn sensor device,” in 2018 IEEE International Conference on Big Data (Big Data), Seattle, WA, USA, 10-13 December 2018 (IEEE), 5457–5459.
Uswatte, G., Giuliani, C., Winstein, C., Zeringue, A., Hobbs, L., and Wolf, S. L. (2006a). Validity of accelerometry for monitoring real-world arm activity in patients with subacute stroke: Evidence from the extremity constraint-induced therapy evaluation trial. Arch. Phys. Med. Rehabil. 87, 1340–1345. doi:10.1016/j.apmr.2006.06.006
Uswatte, G., and Hobbs Qadri, L. (2009). A behavioral observation system for quantifying arm activity in daily life after stroke. Rehabil. Psychol. 54, 398–403. doi:10.1037/a0017501
Uswatte, G., Taub, E., Morris, D., Light, K., and Thompson, P. (2006b). The Motor Activity Log-28 assessing daily use of the hemiparetic arm after stroke. Neurology 67, 1189–1194. doi:10.1212/01.wnl.0000238164.90657.c2
Van Der Lee, J. H., Beckerman, H., Knol, D. L., De Vet, H. C., and Bouter, L. M. (2004). Clinimetric properties of the motor activity log for the assessment of arm use in hemiparetic patients. Stroke 35, 1410–1414. doi:10.1161/01.STR.0000126900.24964.7e
Van Der Lee, J. H., Beckerman, H., Lankhorst, G. J., and Bouter, L. M. (2001). The responsiveness of the Action Research Arm test and the Fugl-Meyer Assessment scale in chronic stroke patients. J. Rehabil. Med. 33, 110–113. doi:10.1080/165019701750165916
Wang, Y. C., Bohannon, R. W., Kapellusch, J., Garg, A., and Gershon, R. C. (2015). Dexterity as measured with the 9-Hole Peg Test (9-HPT) across the age span. J. Hand Ther. 28, 53–59. doi:10.1016/j.jht.2014.09.002
Wang, Y. C., Magasi, S. R., Bohannon, R. W., Reuben, D. B., Mccreath, H. E., Bubela, D. J., et al. (2011). Assessing dexterity function: A comparison of two alternatives for the NIH toolbox. J. Hand Ther. 24, 313–320. doi:10.1016/j.jht.2011.05.001
Weerdt, W. J. G. D., and Harrison, M. A. (1985). Measuring recovery of arm-hand function in stroke patients: A comparison of the brunnstrom-fugl-meyer test and the action research arm test. Physiother. Can. 37, 65–70. doi:10.3138/ptc.37.2.065
Keywords: accelerometry, stroke rehabilitation, psychometrics, paresis/rehabilitation, sensors, disability evaluation, machine learning, ADLs
Citation: Geed S, Grainger ML, Mitchell A, Anderson CC, Schmaulfuss HL, Culp SA, McCormick ER, McGarry MR, Delgado MN, Noccioli AD, Shelepov J, Dromerick AW and Lum PS (2023) Concurrent validity of machine learning-classified functional upper extremity use from accelerometry in chronic stroke. Front. Physiol. 14:1116878. doi: 10.3389/fphys.2023.1116878
Received: 05 December 2022; Accepted: 15 February 2023;
Published: 22 March 2023.
Edited by:
Aniruddha Sinha, Tata Consultancy Services, IndiaReviewed by:
Alejandro Galán-Mercant, University of Cádiz, SpainCopyright © 2023 Geed, Grainger, Mitchell, Anderson, Schmaulfuss, Culp, McCormick, McGarry, Delgado, Noccioli, Shelepov, Dromerick and Lum. This is an open-access article distributed under the terms of the Creative Commons Attribution License (CC BY). The use, distribution or reproduction in other forums is permitted, provided the original author(s) and the copyright owner(s) are credited and that the original publication in this journal is cited, in accordance with accepted academic practice. No use, distribution or reproduction is permitted which does not comply with these terms.
*Correspondence: Shashwati Geed, c2hhc2h3YXRpLmdlZWRAbWVkc3Rhci5uZXQ=
†ORCID: Shashwati Geed, orcid.org/0000-0003-0190-6923
Disclaimer: All claims expressed in this article are solely those of the authors and do not necessarily represent those of their affiliated organizations, or those of the publisher, the editors and the reviewers. Any product that may be evaluated in this article or claim that may be made by its manufacturer is not guaranteed or endorsed by the publisher.
Research integrity at Frontiers
Learn more about the work of our research integrity team to safeguard the quality of each article we publish.