- 1Department of General Surgery, Jiangxi Provincial Children’s Hospital, Nanchang, China
- 2Computer Department, Jing-De-Zhen Jingdezhen Ceramic Institute, Jingdezhen, China
- 3Department of General Surgery, Jingdezhen No. 1 People’s Hospital, Jingdezhen, China
As one of the most common diseases in pediatric surgery, an inguinal hernia is usually diagnosed by medical experts based on clinical data collected from magnetic resonance imaging (MRI), computed tomography (CT), or B-ultrasound. The parameters of blood routine examination, such as white blood cell count and platelet count, are often used as diagnostic indicators of intestinal necrosis. Based on the medical numerical data on blood routine examination parameters and liver and kidney function parameters, this paper used machine learning algorithm to assist the diagnosis of intestinal necrosis in children with inguinal hernia before operation. In the work, we used clinical data consisting of 3,807 children with inguinal hernia symptoms and 170 children with intestinal necrosis and perforation caused by the disease. Three different models were constructed according to the blood routine examination and liver and kidney function. Some missing values were replaced by using the RIN-3M (median, mean, or mode region random interpolation) method according to the actual necessity, and the ensemble learning based on the voting principle was used to deal with the imbalanced datasets. The model trained after feature selection yielded satisfactory results with an accuracy of 86.43%, sensitivity of 84.34%, specificity of 96.89%, and AUC value of 0.91. Therefore, the proposed methods may be a potential idea for auxiliary diagnosis of inguinal hernia in children.
1 Introduction
The incidence of inguinal hernia in children is common. Galinier et al. (2007) pointed out that the incidence of inguinal hernia in children of any age is about 0.8%–4.4%, and in premature babies, it is even as high as 30%. Generally, inguinal hernia in pediatric patients is caused by their congenital abnormalities. Although some new methods are studied in this issue (Chowdhury et al., 2019; Molinaro et al., 2022; Zhao et al., 2022), for patients with different conditions, treatment methods also differ. If there is only hernia and no serious diseases such as intestinal necrosis, conservative treatment will be adopted. If serious diseases such as incarcerated necrosis of the intestines occur, surgical treatment will be adopted to prevent the risk of internal damage to the renal organs of pediatric patients. Usually, the diagnosis of intestinal necrosis of inguinal hernia is determined by medical imaging equipment, doctor’s clinical experience, or symptoms after surgery. Because medical imaging examinations have a greater radiation impact on children than on adults, m any parents disagree with children’s medical imaging examinations. At this time, medical expertise is very important for the diagnosis of intestinal necrosis in pediatric patients, and it is also a test for experts.
With the continuous advancement of concepts in the area of precision medicine, the application of intelligent algorithms in medical diagnosis has become increasingly extensive. By constructing predictors on clinical data, the purpose of assisting diagnosis is achieved. Common MRI imaging data (Gurses et al., 2019; Wadhwa et al., 2019; Wang et al., 2022), CT imaging data (Mohakud et al., 2019; Masselli et al., 2020; Singh et al., 2020; Zhuang et al., 2021), and EEG imaging data (Prucnal and Polak, 2019; Quintero-Rincón et al., 2020) are helpful in the work. However, there are a few auxiliary diagnosis models based on medical digital and textual data. However, some researchers introduced special cases in more detail or performed simple analysis on the current patient’s condition (Shiqi et al., 2018; János et al., 2020; Sabra et al., 2020; Abdulrahman et al., 2021; Beau et al., 2021; Karhade et al., 2021; Radhakrishnan et al., 2021; Hyun et al., 2022; Lin et al., 2022; Oh et al., 2022). No corresponding auxiliary diagnosis model was constructed based on these data because the data information that can be mined by case analysis or statistical analysis is very limited. Scrutinio et al. (2020) used machine learning algorithms to build a decision-making model for the prognosis of stroke survivors, providing better guidance for doctors in clinical diagnosis. We can combine machine learning algorithms to collect more information from digital and textual clinical data (Ricciardi, 2019; Onan, 2020; Onan and Tocoglu, 2021), such as some important examination parameters or making diagnosis decisions for patients, which is extremely significant to the doctor’s accurate diagnosis. Some doctors had conducted a retrospective bicentric study in this point (Bouassida et al., 2022).
In this work, we used the clinical data of pediatric patients with inguinal hernia and non-inguinal hernia. However, clinical data are different from other data. From the actual examination items performed by the patient to the collection of clinical data, some vacancies can easily occur in the examination parameters. In order to better collect more information from limited data and build a corresponding model, the nature of the data needs to be followed in the research process. If researchers blindly pursue the complexity and diversity of sample parameters, the possible consequence is that there are too few samples that can be used in the experiment, which is not conducive to experimental research. Selecting appropriate characteristic values from some common examinations of patients is a data mining method worth exploring. Therefore, in this study, we defined a model using blood routine test parameters as M1, a model using liver and kidney function test parameters as M2, and a model using blood routine test parameters and liver and kidney function test parameters as M3.
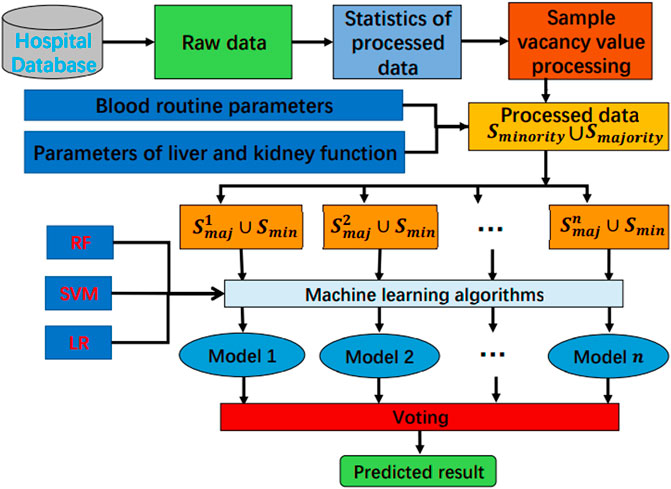
We first used statistical analysis methods to preprocess the original data and used the RIN-3M (median, mean, and mode region random interpolation) method to fill in the vacancy in the data. Second, the importance of features was compared according to the Gini coefficient (Fang et al., 2012), and the combination of features with the best performance was selected in an iterative manner. Third, we used an ensemble learning method (Onan, 2017) to deal with the problem of sample imbalance. Finally, the samples after feature selection and the original samples were put into the RF algorithm to train them as predictors. Comparing the performance of each model, we found that the model after feature selection had better performance.
The analysis process of these data is shown in Figure 1, where
2 Materials and methods
2.1 Logistic regression (LR)
The logistic regression algorithm (Abu-Hanna and de Keizer, 2003; Zhu and Fang, 2016; Li et al., 2019) plays an important role in aiding decision-making in clinical medicine, where researchers construct linear regression functions using clinical examination parameters as characteristic input parameters and map the values obtained from the linear regression functions between 0 and 1 by means of a sigmoid function, thus achieving classification. It is commonly used to construct equations for the relationship between input vectors and categories. The principle of this study is shown in Eqs 1, 2.
In formula (1),
2.2 Support vector machine (SVM)
When dealing with classification problems, SVM maps samples to higher dimensions if they are indistinguishable in the current dimension, so that the samples are linearly separable in the higher dimensional space. Also, a segmentation hyperplane is constructed in the samples in the high-dimensional space to maximize the distance between the sample points and the hyperplane for the purpose of classification. Because of its good learning ability, the SVM algorithm is widely used in clinical disease diagnosis, and the algorithm has strong processing performance in the face of complex clinical medical data (Zhu et al., 2013; Recenti et al., 2019; Reynolds et al., 2019; Chen and Lin, 2020).
2.3 Random forest (RF)
Random forest (Zhao et al., 2020) is itself a swarm policy algorithm. It constructs optimal decision trees by releasably drawing n samples at random from the sample and constructing the optimal decision tree for each drawn dataset. Many optimal decision trees are combined to form a random forest. Due to the relatively stable performance of the models constructed by the RF algorithm, many researchers often apply such algorithm to disease analysis (Asadi et al., 2021; Quist et al., 2021).
3 Experiment design
3.1 Datasets
The data of this study were derived from the diagnostic data on children with incarcerated inguinal hernia in Jiangxi Children’s Hospital. The study was approved by the Ethics Committee of Jiangxi Children’s Hospital with ethics approval number JXSETYY-YXKY-20210016. Because the subjects were all under 18 years of age, informed consent from their guardian or legal close relatives was obtained. In order to protect the patients’ private information, we used digital codes to replace the names and other private information.
We selected 3,807 children with incarcerated inguinal hernia but no intestinal necrosis as the positive sample set, denoted as S1, and 170 children with incarcerated inguinal hernia caused by intestinal necrosis as the negative sample set, denoted as S2. The clinical parameters used in this study are blood routine examination parameters and liver and kidney function examination parameters, and the patient discharge diagnosis results are the basis for the category label of the study.
However, it is quite often that the dimensions of the examination parameters are inconsistent in the diagnostic data, which may be due to the lack of certain examination items in the hospital. In other words, some children only have a single test item such as that of blood or liver and kidney function. Of course, there are also patients who have multiple test items at the same time. Therefore, based on the characteristics of the clinical data on children with incarcerated inguinal hernia, the blood routine single clinical examination data, the single clinical examination data on liver and kidney function, and the combination of these two examination parameters served for modeling and analysis in this work.
3.2 Data preprocessing
3.2.1 Statistical magnitude
The original data have been analyzed with statistical theory. Based on the number of features and samples, some clinical examination parameters with low sample size were excluded. The clinical examination parameters after preliminary screening are shown in Table 2
Unfortunately, there were still some null values in the parameters of a certain examination because the patient did not undergo a certain examination or there are some deviations in the information input or information collection. For those samples with missing values, the usual processing method used is deletion or interpolation. Because there is an imbalance between positive and negative samples, it may be more severely imbalanced when some samples with null or missing values of the minority are deleted. Thus, in this work, the selection of samples depends on the missing rate of the inspection parameters in the samples. The selected sample should be the positive sample without any missing value or the negative sample with less than 40% of the whole features missing. In this way, some sparse feature samples can be eliminated, and the integrity of negative sample information can be preserved to a large extent to avoid further expansion of sample imbalance.
3.2.2 Data interpolation
For those samples with missing values, the commonly used processing methods are interpolation (Liu et al., 1997; Rababah Msc et al., 2019), mean, mode, and median, and nearest neighbor imputation (Beretta and Santaniello, 2016). Although nearest neighbor imputation has good performance in image processing, there are some limitations to this experiment because of the number of samples. If the mode interpolation is used, because the number of negative samples is only 170, the mode of some selected features may not be representative. Second, because the clinical examination parameters are discrete, some features may have multiple modes.
Therefore, choosing an appropriate mode is also a difficult task. In this study, we combined the actual situation of the data, in order to make the interpolation closer to reality, comprehensively considered the different characteristics of the mode, mean, and median, and adopted a new interpolation method for these vacant data. This is the regional random interpolation (RIN-3M) method of the median, mode, and mean. The principle of this method is shown in formula (3).
In formula (3),
3.3 Feature selection
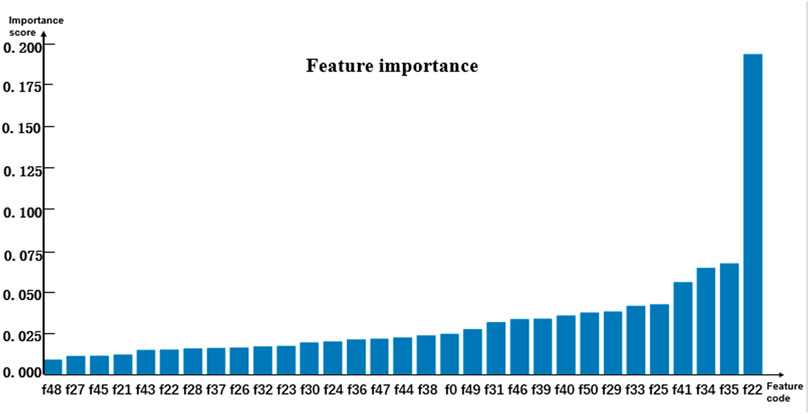
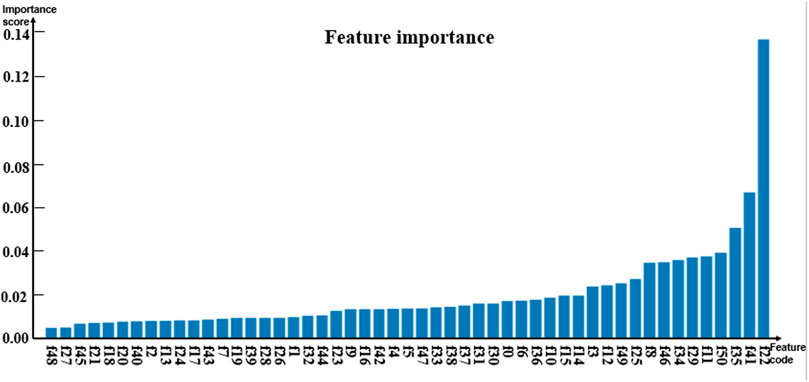
Random forests have relatively stable performance at the time of dealing with heterogenetic parameters because the constructed decision trees could randomly extract some feature values and avoid the influence of too many redundant features in the process of training models (Onan et al., 2016a; Onam and Serdar, 2016; Onan, 2016; Onan and Korukoğlu, 2016; Onan, 2019; Toolu and Onan, 2021). Thus, the random forest algorithm classifier was selected as a sub-model. To analyze the contribution of the involved parameters to different models, the importance of features was evaluated by using the feature_importance method based on the Gini coefficient theory in the sklearn library of Python. The importance score of each feature was obtained by calculating the sum of the degree of impurity reduction of each feature, and then the importance of the parameter depends on the importance of the sub-model. The average of five-fold cross-validation test results served as the importance score of the model. The histograms in Figures 2–4 show the importance of parameters in the M1, M2, and M3 models.
Figure 2 shows that the age marked as f0 is the most important feature. In Figures 3, 4, the C-reactive protein labeled f22 is the most important parameter. Since the level of C-reactive protein reflects the degree of infection, it is an important indicator of certain diseases. In fact, the feature importance histograms of the models M2 and M3 also fully indicated that the feature importance of C-reactive protein is relatively high, so C-reactive protein can be used as a reference for the diagnosis of inguinal hernia. Second, the feature importance of direct bilirubin, albumin, and troponin I in the second gradient was high, as shown in Figure 3, which are labeled as f35, f34, and f41, respectively. The feature importance of troponin I and direct bilirubin in the second gradient was also high, as shown in Figure 4; it can be seen that these two examination parameters can also provide doctors with reference values.
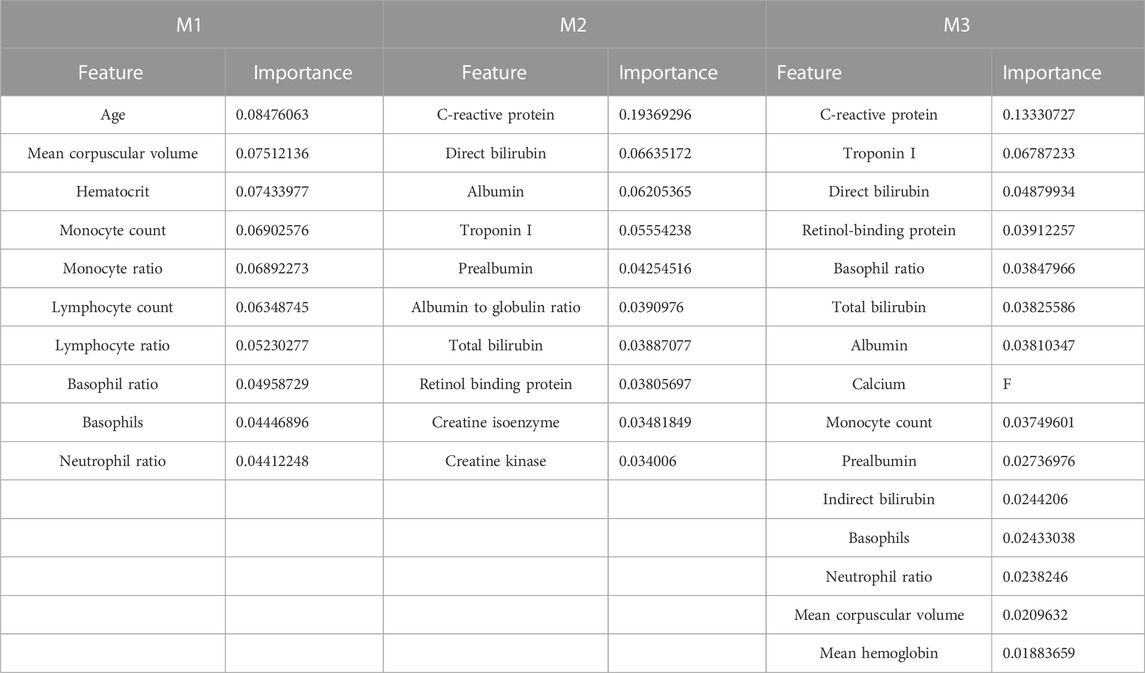
In order to better compare the features that have significant contributions to these three models, Table 3 lists the top 10 important parameter names in the M1 and M2 models, the top 15 important parameter names in the M3 model, and their importance score. The feature intersection between M1 and M3 in Table 3 and the feature intersection between M2 and M3 are analyzed in the Discussion sub-section.
3.4 Classification model design and training
To solve the problem of imbalanced forecasting and improve the prediction accuracy, some researchers have recently tried to use the combination of up-sampling and down-sampling methods (Rubin et al., 2009). In the procedure of balancing the training datasets, some synthetically generated data points are injected into the minority class dataset in the up-sampling method, while the down-sampling method would train on a disproportionately low sub-set of the majority class examples by adding a weight to the down-sampled class. Both methods have advantages and disadvantages. This study uses a voting-based integrated learning method to solve data imbalance. The model is trained by dividing most samples into multiple sub-sets to improve the training effect of the model.
In this study, 20% of the positive and negative samples are selected as test sets, and the remaining 80% served as the training sets. Subsequently, the positive sample set with majority categories was divided into multiple sub-sets, and the numbers of samples in all sub-sets are almost equal to the number of negative samples. Every dataset of the sub-sets and the negative set form a sub-balance training dataset, denoted as
As shown in Table 2, the parameters of this research issue comprise blood routine examination and liver and kidney function; the classification models should be trained according to the parameters. Actually, the model should be separately trained with the blood routine examination parameters and the liver and kidney function parameters because the dimensionality of the data is very heterogenetic and it is not appropriate or practical for diagnosis. The inspection is often based on the process. Some basic examinations should be performed on the patient, and a more in-depth examination will be performed when a doctor makes a diagnosis. As basic checks, some features of routine blood tests, for example, white blood cell count and red blood cell ratio, are usually used as diagnostic reference indicators for doctors. However, liver and kidney function tests are relatively stricter than routine blood tests. The liver and kidney function tests are different from the routine blood test because the patient’s venous blood needs to be taken for testing and the patient also needs to fast before the blood is drawn. However, compared with B-ultrasound and other medical imaging diagnostic methods, the results of blood routine and liver and kidney function tests are superior to the former in terms of economy and operation process. Then, a specific model based on parameters would reduce the medical resources and patients’ financial expenditure. Moreover, in many hospitals, the parameters of routine blood tests and liver and kidney function tests are easily available since the tests are cheap and convenient.
To make the auxiliary diagnosis models in line with the actual situation of the diagnosis process and simplify the complexity, the proposed models are trained with different inhomogeneous features. Based on the aforementioned data explanation, the blood routine parameters are used to train the first kind of model named M1, the liver and kidney function parameters served for training the second model denoted as M2, and all of the parameters for the third model marked as M3. Table 1 shows the profiles of the datasets.
4 Results and discussion
4.1 Performance evaluations
Accuracy (ACC), sensitivity (SN), specificity (SP), and area under the curve (AUC) (Wang et al., 2019) are often used to judge the quality of the proposed models. The accuracy rate represents the proportion of the sample that can be accurately predicted in the overall test sample. The larger the value of ACC, the higher the accuracy of the model’s prediction of the sample. However, it usually reflects only the overall situation of the sample. When evaluating models for imbalanced datasets, the ACC value can obscure some truth. In other words, the model’s prediction accuracy for samples from most categories may neutralize the low prediction accuracy of samples from a few categories. Therefore, we need to use other parameters for further analysis. Sensitivity represents the proportion of samples that are correctly predicted in positive samples, and specificity represents the proportion of samples that are correctly predicted in negative samples. The specificity and sensitivity reflect the actual predictions of the model for positive and negative samples. These two values will not change much due to the imbalance of the sample. Therefore, accuracy combined with sensitivity and specificity can objectively reflect the prediction of the model. The AUC value is based on the area enclosed by the receiver operating characteristic (ROC) curve and the coordinate axis. The ROC curve takes the sensitivity of the model as the ordinate and 1 minus the specificity as the abscissa. According to different classification thresholds, the relationship between sensitivity and specificity can be accurately analyzed. The AUC value is between 0 and 1. The larger the AUC value, the better the performance of the model.
4.2 Results
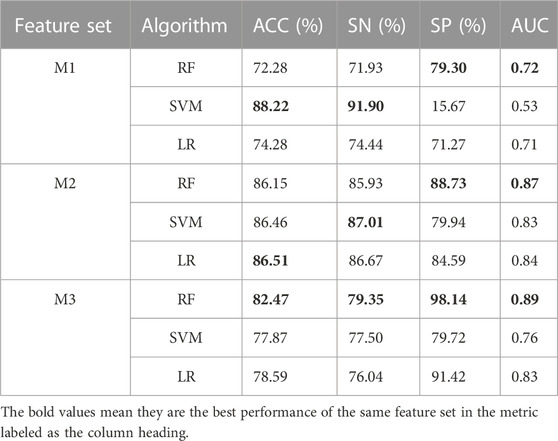
In this study, aiming to resolve the imbalance of children’s inguinal hernia text data, an integrated learning method based on the voting mechanism is used to reduce the impact of data imbalance. According to the characteristics of the sample data, blood routine and liver and kidney functions were used to establish different comprehensive classifying models. In this experiment, five-fold cross-validation (Mou et al., 2014) is used to further analyze the stability of the model. The ensemble of SVM and LR algorithms was compared with the current auxiliary diagnosis system. Table 4 lists the performance of different algorithms. M1 indicates that the model is constructed only from blood routine parameters, M2 indicates that the model is constructed only from liver and kidney function parameters, and M3 indicates that the model is constructed from all of the aforementioned parameters.
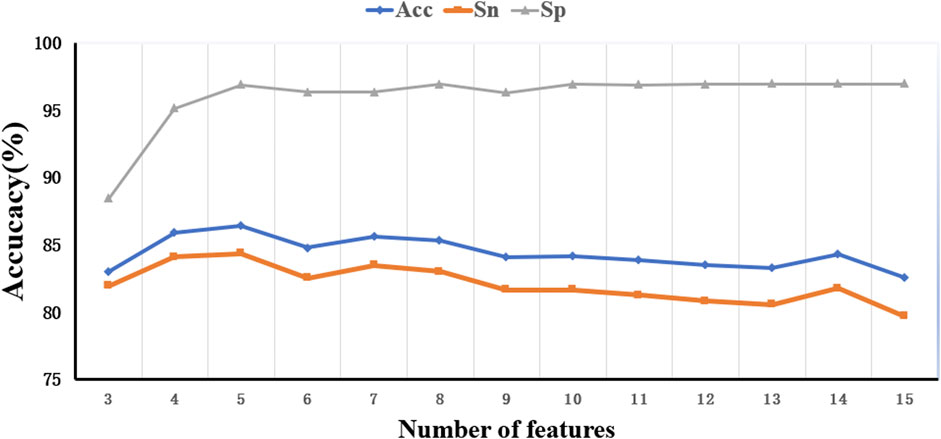
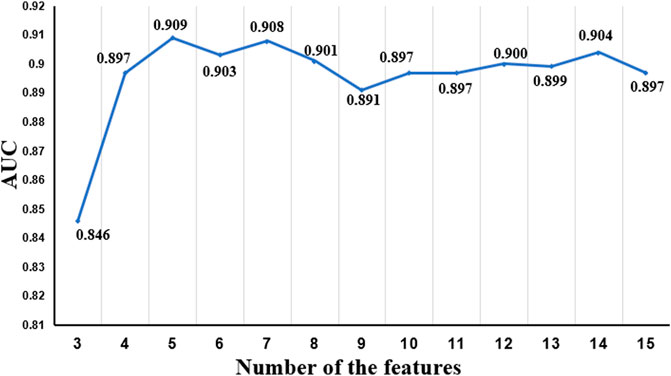
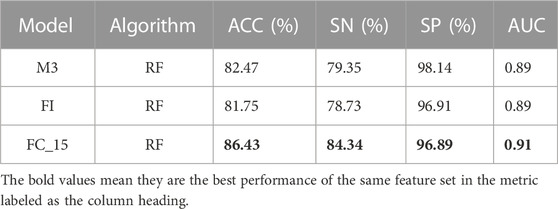
To optimize the performance of the RF algorithm trained with the M3 parameter, we further analyzed feature importance ranking, as shown in Table 3. Two items of research have been performed for the in-depth study. The first one is to screen out the intersection of the first 15 features of M3 and the first 10 features of M1 and M2 and then find the union of these two intersections. The union of these 11 features was denoted as FI and applied to train the enhanced model. The other one is to select the best feature combination from the aforementioned 15 features of M3. Since RF does not have a clear threshold for the feature importance, we continuously adjust the number of features in this experiment to achieve the goal of optimization, and the best combination feature set was denoted as FC_15. Figures 5, 6 show the performance of different feature sets, and the detailed results are listed in Table 5.
4.3 Discussion
Table 4shows that the performances of the three models using the M1 parameters alone are not good, and the SVM algorithm even obtained a low specificity value (15.67%). The accuracies of models trained with M2 are all over 86%, and their sensitivity and specificity are prospective. As far as the overall performance is concerned, the performance of the RF algorithm under the M2 parameter is better than those of the models with M1 or M2 parameters. The values of ACC, SN, and SP of RF trained with M2 are 86.17%, 85.93%, and 88.73%, respectively. The reason why the performance of the models trained with M1 is inferior to that of the models with M2 may be that it is not effective enough for mining the information of children with intestinal necrosis from the blood routine features. The performance of the models with M3 is lower than that with M2, as shown in Table 4, and there are many interfering features which affect the involved models.
Figures 5, 6 show that when the feature number is 5, the performance of the model is better than the model under the M3 parameter. At this time, the five feature parameters are C-reactive protein, calcium, direct bilirubin, average hemoglobin, and the ratio of basophils. The AUC values of the model trained with M2 and M3 parameters are all larger than 0.87 (see Table 3), and the AUC value of the filtered characteristic FC_15 model can reach 0.91. Therefore, the author believes that the model constructed using medical text data can be used for a doctor’s auxiliary diagnosis. This work proved that the performance of a model can be further improved by selecting proper features with good priority.
To calculate the performance of the different models, the parameters used in this study can be summarized as follows: the random forest algorithm has n_estimators parameter of 200, criterion parameter of gini, min_samples_split parameter of 2, min_samples_leaf parameter of 1, and max_features parameter of “auto.” The support vector machine algorithm has C parameter of 1 and gamma of “scale.” The parameter in the logistic regression algorithm is 1e-4, the C parameter is 1, and the max_iter parameter is 100. All of these have been added in the MS.
5 Conclusion
The purpose of this study is to find the relationship between patients with intestinal necrosis and patients with inguinal hernia through blood routine and liver and kidney function test parameters, so as to provide auxiliary recommendations for children’s next treatment. Some constructive models were established on the heterogenetic feature sets and offer helpful answers to doctors’ diagnosis. Furthermore, our work highlighted many patient features that are predictive for making a diagnosis on the relevant diseases. For example, C-reactive protein parameters, troponin I, albumin, and total bilirubin are remarkably important for the issue. The vital sign parameters and image-type medical data would be helpful for the improved models.
Actually, routine blood tests and liver and kidney function tests are often overlooked by researchers because of their basic and common data. This study was conducted to explore the potential association of these basic clinical data with inguinal hernia disease and to construct a model to assist physicians in decision-making. Due to the imbalance of the clinical data and the sparsity of the features, the current study only attempts to use some conventional algorithms to train the samples for analysis. Therefore, this study is more of a trial, guided experiment. In the future, the authors aim to introduce more medical data and intelligent assistance.
However, there are a couple of limitations to this study. On the one hand, the obtained clinical data such as blood routine data and liver and kidney function test parameters are easily affected by the data collection process. If the clinical data parameters used in each study cannot be unified, some important parameters may be missed, which will increase some uncertain risks. On the other hand, due to the influence of research methods, clinical data are different from the characteristic values of some other sample data, and the normal value is usually given in a certain interval range. If one pays too much attention to the numerical weight of the parameters, the generalization ability of the model may be limited. Therefore, based on these limitations, in the future, the author will strictly use data standards and convert some parameters into codes by encoding, thereby weakening the individuality of parameter values.
Data availability statement
The raw data supporting the conclusion of this article will be made available by the authors, without undue reservation.
Ethics statements
The studies involving human participants were reviewed and approved by the Ethics Committee of Jiangxi Children’s Hospital (approval no. JXSETYY-YXKY-20210016). Written informed consent from the patients/participants legal guardian/next of kin was not required to participate in this study in accordance with the national legislation and the institutional requirements.
Author contributions
S-HZ and W-RQ devised and designed the experiments. GC and C-FD were in charge of feature extraction, model construction, model training, and model evaluation. Z-WL and GC analyzed the data and carried out the evaluation. Z-WL wrote the manuscript. S-HZ supervised the project and revised the manuscript. The figures were created by GC. All authors read and approved the final manuscript.
Funding
This work was supported by grants from the National Natural Science Foundation of China (No. 62162032), the Natural Science Foundation of Jiangxi Province, China (20212BAG70003), and the Key Program for S&T Cooperation Projects of Jiangxi Province (No. 20212BDH80021).
Conflict of interest
The authors declare that the research was conducted in the absence of any commercial or financial relationships that could be construed as a potential conflict of interest.
Publisher’s note
All claims expressed in this article are solely those of the authors and do not necessarily represent those of their affiliated organizations, or those of the publisher, the editors, and the reviewers. Any product that may be evaluated in this article, or claim that may be made by its manufacturer, is not guaranteed or endorsed by the publisher.
References
Abdulrahman, B., Abdullah, A., Mohammed, A., Abdulrahman, A., Muaiqel, A., and Abdullah, M. A. (2021). Vesical tumor within an inguinal bladder hernia: A case report. Urol. Case Rep. 38, 101680. doi:10.1016/j.eucr.2021.101680
Abu-Hanna, A., and de Keizer, N. (2003). Integrating classification trees with local logistic regression in Intensive Care prognosis. Artif. Intell. Med. 29 (1-2), 5–23. doi:10.1016/s0933-3657(03)00047-2
Asadi, S., Roshan, S., and Kattan, M. W. (2021). Random forest swarm optimization-based for heart diseases diagnosis. J. Biomed. Inf. 115, 103690. doi:10.1016/j.jbi.2021.103690
Beau, F., Attaar, M., and Maya, L. (2021). Inguinal hernia mesh is safe in 1720 patients. Surg. Endosc. 36 (2). doi:10.1007/s00464-021-08442-w
Beretta, L., and Santaniello, A. (2016). Nearest neighbor imputation algorithms: A critical evaluation. BMC Med. Inf. Decis. Mak. 16 (3), 74. doi:10.1186/s12911-016-0318-z
Bouassida, M., Dougaz, M. W., Beji, H., Guermazi, H., Zribi, S., Kammoun, N., et al. (2022). Intestinal ischemia in patients with incarcerated groin hernia: Proposal and validation of a score. Langenbecks Arch. Surg. 407 (6), 2547–2554. doi:10.1007/s00423-022-02521-9
Chen, R., and Lin, J. (2020). Identification of feature risk pathways of smoking-induced lung cancer based on SVM. PLoS One 15 (6), e0233445. doi:10.1371/journal.pone.0233445
Chowdhury, A. R., Chatterjee, T., and Banerjee, S. (2019). A Random Forest classifier-based approach in the detection of abnormalities in the retina[J]. Medical and Biological Engineering and Computing: Journal of the International Federation for Medical and Biological Engineering 57 (1), 193–203.
Fang, Y., Middaugh, C. R., and Fang, J. (2012). In silico classification of proteins from acidic and neutral cytoplasms. PLoS One 7 (9), e45585. doi:10.1371/journal.pone.0045585
Galinier, P., Bouali, O., Juricic, M., and Smail, N. (2007). Focusing of inguinal hernia in children. Arch. Pediatr. 14 (4), 399–403. doi:10.1016/j.arcped.2007.01.008
Gurses, B., Boge, M., Altınmakas, E., and Balık, E. (2019). Multiparametric MRI in rectal cancer. Diagn Interv. Radiol. 25 (3), 175–182. doi:10.5152/dir.2019.18189
Hyun, C. M., Bayaraa, T., Jang, T. J., Park, H. S., and Seo, J. K. (2022). Deep learning method for reducing metal artifacts in dental cone-beam CT using supplementary information from intra-oral scan. Phys. Med. Biol. 67 (17), 175007, doi:10.1088/1361-6560/ac8852
János, T., Pieler, J., Abraham, S., Simonka, Z., Paszt, A., and Lazar, G. (2020). Incarcerated gallbladder in inguinal hernia: A case report and literature review. BMC Gastroenterol. 20 (1), 425. doi:10.1186/s12876-020-01569-5
Karhade, J., Ghosh, S. K., Gajbhiye, P., Tripathy, R. K., and Acharya, U. R. (2021). Multichannel multiscale two-stage convolutional neural network for the detection and localization of myocardial infarction using vectorcardiogram signal. Appl. Sci. (Basel). 11 (17), 7920. doi:10.3390/app11177920
Li, X., Yu, S., Zhang, Z., Radican, L., Cummins, J., Engel, S. S., et al. (2019). Predictive modeling of hypoglycemia for clinical decision support in evaluating outpatients with diabetes mellitus. Curr. Med. Res. Opin. 35 (11), 1885–1891. doi:10.1080/03007995.2019.1636016
Lin, J., Ge, J., Gong, J., Hong, H., and Jiang, C. (2022). Application of digital orthopedic Technology in orthopedic trauma. Comput. Math. Methods Med. 2022, 3157107. doi:10.1155/2022/3157107
Liu, Y. H., Sun, Y. N., Mao, C. W., and Lin, C. J. (1997). Edge-shrinking interpolation for medical images. Comput. Med. Imaging Graph 21 (2), 91–101. doi:10.1016/s0895-6111(96)00063-8
Masselli, G., De Angelis, C., Sollaku, S., Casciani, E., and Gualdi, G. (2020). PET/CT in pediatric oncology. Am. J. Nucl. Med. Mol. Imaging 10 (2), 83–94.
Mohakud, S., Juneja, A., and Lal, H. (2019). Abdominal cocoon: Preoperative diagnosis on CT. BMJ Case Rep. 12 (5), e229983. doi:10.1136/bcr-2019-229983
Molinaro, F., Nascimben, F., Fusi, G., Brenco, G., Sica, M., Messina, M., et al. (2022). Evolution of outcomes and complications of flip flap laparoscopic repair for inguinal hernia in children: 5 years' experience and practical implication in a third level Italian center. Minerva Surg. 78 (1), 45–51. doi:10.23736/s2724-5691.22.09605-8
Mou, W., Liu, Z., Luo, Y., Zou, M., Ren, C., Zhang, C., et al. (2014). Development and cross-validation of prognostic models to assess the treatment effect of cisplatin/pemetrexed chemotherapy in lung adenocarcinoma patients. Med. Oncol. 31 (9), 59. doi:10.1007/s12032-014-0059-8
Oh, J. K., Lee, J. Y., Eun, S. J., and Park, J. M. (2022). New trends in innovative technologies applying artificial intelligence to urinary diseases. Int. Neurourol. J. 26 (4), 268–274. doi:10.5213/inj.2244280.140
Onam, A., and Serdar, K. (2016). Exploring performance of instance selection methods in text sentiment classification. Artif. Intell. Perspect. Intelligent Syst. 464, 167–179.
Onan, A. (2019). “Topic-enriched word embeddings for sarcasm identification,” in Handbuch methoden der Politikwissenschaft, 293–304.
Onan, A. (2016). An ensemble scheme based on language function analysis and feature engineering for text genre classification. J. Inf. Sci. 44 (1), 28–47. doi:10.1177/0165551516677911
Onan, A. (2017). Hybrid supervised clustering based ensemble scheme for text classification. Kybernetes 46 (2), 330–348. doi:10.1108/k-10-2016-0300
Onan, A., and Korukoğlu, S. (2016). A feature selection model based on genetic rank aggregation for text sentiment classification. J. Inf. Sci. 43 (1), 25–38. doi:10.1177/0165551515613226
Onan, A., Korukoglu, S., and Bulut, H. (2017). A hybrid ensemble pruning approach based on consensus clustering and multi-objective evolutionary algorithm for sentiment classification. Inf. Process. Manag. 53 (4), 814–833. doi:10.1016/j.ipm.2017.02.008
Onan, A., Korukoğlu, S., and Bulut, H. (2016). A multiobjective weighted voting ensemble classifier based on differential evolution algorithm for text sentiment classification. Expert Syst. Appl. 62, 1–16. doi:10.1016/j.eswa.2016.06.005
Onan, A., Korukoğlu, S., and Bulut, H. (2016). Ensemble of keyword extraction methods and classifiers in text classification. Expert Syst. Appl. 57, 232–247. doi:10.1016/j.eswa.2016.03.045
Onan, A., and Mansur, A. T. (2020). Satire identification in Turkish news articles based on ensemble of classifiers. Turk. J. Elec. Eng. Comp. Sci. 28 (2), 1086–1106. doi:10.3906/elk-1907-11
Onan, A. (2020). “Sentiment analysis on product reviews based on weighted word embeddings and deep neural networks,” in Concurrency and computation: Practice and experience.
Onan, A., and Tocoglu, M. A. (2021). A term weighted neural language model and stacked bidirectional LSTM based framework for sarcasm identification. IEEE Access 9, 7701–7722. doi:10.1109/access.2021.3049734
Prucnal, M. A., and Polak, A. G. (2019). Effectiveness of sleep apnea detection based on one vs. Two symmetrical EEG channels. Annu. Int. Conf. IEEE Eng. Med. Biol. Soc. 2019, 4056–4059. doi:10.1109/EMBC.2019.8856632
Quintero-Rincón, A., D'Giano, C., and Batatia, H. (2020). A quadratic linear-parabolic model-based EEG classification to detect epileptic seizures. J. Biomed. Res. 34 (3), 205–210. doi:10.7555/jbr.33.20190012
Quist, J., Taylor, L., Staaf, J., and Grigoriadis, A. (2021). Random forest modelling of high-dimensional mixed-type data for breast cancer classification. Cancers (Basel) 13 (5), 991. doi:10.3390/cancers13050991
Rababah Msc, A. S., Bond, R. R., Msc, K. R., Guldenring, D., McLaughlin, J., and Finlay, D. D. (2019).Novel hybrid method for interpolating missing information in body surface potential maps. J. Electrocardiol 57S. S51–S55. doi:10.1016/j.jelectrocard.2019.09.003
Radhakrishnan, T., Karhade, J., Ghosh, S. K., Muduli, P. R., Tripathy, R. K., and Acharya, U. R. (2021). AFCNNet: Automated detection of AF using chirplet transform and deep convolutional bidirectional long short term memory network with ECG signals. Comput. Biol. Med. 137, 104783. doi:10.1016/j.compbiomed.2021.104783
Recenti, M., et al. (2019). “Machine learning algorithms predict body mass index using nonlinear trimodal regression analysis from computed Tomography scans,” in Proceedings of MEDICON 2019. 2019. Coimbra, Portugal: XV mediterranean conference on medical and biological engineering and computing – MEDICON 2019.
Reynolds, E., Callaghan, B., and Banerjee, M. (2019). SVM-CART for disease classification. J. Appl. Stat. 46 (16), 2987–3007. doi:10.1080/02664763.2019.1625876
Ricciardi, C. (2019). “Is it possible to predict cardiac death?,” in Proceedings of MEDICON 2019. 2019. Coimbra, Portugal: XV mediterranean conference on medical and biological engineering and computing – MEDICON.
Rubin, S. H., Khoshgoftaar, T. M., and Van Hulse, J. (2009). Hybrid sampling for imbalanced data. Integr. Computer-Aided Eng. 16 (3), 193–210. doi:10.3233/ica-2009-0314
Sabra, H., Alimoradi, M., El-Helou, E., Azaki, R., Khairallah, M., and Kfoury, T. (2020). Perforated sigmoid colon cancer presenting as an incarcerated inguinal hernia: A case report. Int. J. Surg. Case Rep. 72, 108–111. doi:10.1016/j.ijscr.2020.05.067
Scrutinio, D., Ricciardi, C., Donisi, L., Losavio, E., Battista, P., Guida, P., et al. (2020). Machine learning to predict mortality after rehabilitation among patients with severe stroke. Sci. Rep. 10 (1), 20127. doi:10.1038/s41598-020-77243-3
Shiqi, L., Li, Q., Li, Y., Lv, Y., Niu, J., Xu, Q., et al. (2018). Ileocecal junction perforation caused by a sewing needle in incarcerated inguinal hernia: An unusual case report. Medicine 97 (22), e10787. doi:10.1097/MD.0000000000010787
Singh, D., Kumar, V., and Kaur, M. (2020). Classification of COVID-19 patients from chest CT images using multi-objective differential evolution-based convolutional neural networks. Eur. J. Clin. Microbiol. Infect. Dis. 39 (7), 1379–1389. doi:10.1007/s10096-020-03901-z
Toolu, M. A., and Onan, A. (2021). “Sentiment analysis on students' evaluation of higher educational institutions,” in Intelligent and fuzzy techniques: Smart and innovative solutions, 1693–1700.
Wadhwa, A., Bhardwaj, A., and Singh Verma, V. (2019). A review on brain tumor segmentation of MRI images. Magn. Reson Imaging 61, 247–259. doi:10.1016/j.mri.2019.05.043
Wang, G., Yu, G., Chen, J., Yang, G., Xu, H., Chen, Z., et al. (2022). Can high b-value 3.0 T biparametric MRI with the Simplified Prostate Image Reporting and Data System (S-PI-RADS) be used in biopsy-naive men? Clin. Imaging 88, 80–86. doi:10.1016/j.clinimag.2021.06.024
Wang, M., Ding, L., Xu, M., Xie, J., Wu, S., Xu, S., et al. (2019). A novel method detecting the key clinic factors of portal vein system thrombosis of splenectomy & cardia devascularization patients for cirrhosis & portal hypertension. BMC Bioinforma. 20 (22), 720. doi:10.1186/s12859-019-3233-3
Zhao, J., Yu, C., Lu, J., Wei, Y., Long, C., Shen, L., et al. (2022). Laparoscopic versus open inguinal hernia repair in children: A systematic review. J. Minim. Access Surg. 18 (1), 12–19. doi:10.4103/jmas.JMAS_229_20
Zhu, Y., and Fang, J. (2016). Logistic regression-based trichotomous classification tree and its application in medical diagnosis. Med. Decis. Mak. 36 (8), 973–989. doi:10.1177/0272989X15618658
Zhu, Y., Wu, J., and Fang, Y. (2013). Study on application of SVM in prediction of coronary heart disease. Sheng Wu Yi Xue Gong Cheng Xue Za Zhi 30 (6), 1180–1185.
Zhuang, Y., Lin, L., Xu, X., Xia, T., Yu, H., Fu, G., et al. (2021). Dynamic changes on chest CT of COVID-19 patients with solitary pulmonary lesion in initial CT. Jpn. J. Radiol. 39 (1), 32–39. doi:10.1007/s11604-020-01037-w
Keywords: imbalanced data, medical numerical data, postoperative diagnosis, machine learning, intelligent assistant diagnosis
Citation: Liu Z-W, Chen G, Dong C-F, Qiu W-R and Zhang S-H (2023) Intelligent assistant diagnosis for pediatric inguinal hernia based on a multilayer and unbalanced classification model. Front. Physiol. 14:1105891. doi: 10.3389/fphys.2023.1105891
Received: 08 December 2022; Accepted: 27 February 2023;
Published: 14 March 2023.
Edited by:
Rajesh Kumar Tripathy, Birla Institute of Technology and Science, IndiaReviewed by:
Pranjali Gajbhiye, Nirvesh Enterprises Private Limited, IndiaSamit Ghosh, Techno India University, India
Copyright © 2023 Liu, Chen, Dong, Qiu and Zhang. This is an open-access article distributed under the terms of the Creative Commons Attribution License (CC BY). The use, distribution or reproduction in other forums is permitted, provided the original author(s) and the copyright owner(s) are credited and that the original publication in this journal is cited, in accordance with accepted academic practice. No use, distribution or reproduction is permitted which does not comply with these terms.
*Correspondence: Wang-Ren Qiu, MDA0MjUxQGpjaS5lZHUuY24=, cWl1b25lQDE2My5jb20=; Shou-Hua Zhang, enNob3VodWE0MTZAMTYzLmNvbQ==
 Zhi-Wen Liu
 Gang Chen
 Chao-Fan Dong3
 Wang-Ren Qiu
 Shou-Hua Zhang